Sun, Z., Jian, Z., Stock, J.M., Larsen, H.C., Klaus, A., Alvarez Zarikian, C.A., and the Expedition 367/368 Scientists
Proceedings of the International Ocean Discovery Program Volume 367/368
publications.iodp.org
https://doi.org/10.14379/iodp.proc.367368.106.2018

Site U15021
Hans Christian Larsen, Zhimin Jian, Carlos A. Alvarez Zarikian, Zhen Sun, Joann M. Stock, Adam Klaus, Jacopo Boaga, Stephen A. Bowden, Anne Briais, Yifeng Chen, Deniz Cukur, Kelsie A. Dadd, Weiwei Ding, Michael J. Dorais, Eric C. Ferré, Fabricio Ferreira, Akira Furusawa, Aaron J. Gewecke, Jessica L. Hinojosa, Tobias W. Höfig, Kan-Hsi Hsiung, Baoqi Huang, Enqing Huang, Xiao-Long Huang, Shijun Jiang, Haiyan Jin, Benjamin G. Johnson, Robert M. Kurzawski, Chao Lei, Baohua Li, Li Li, Yanping Li, Jian Lin, Chang Liu, Chuanlian Liu, Zhifei Liu, Antonio Luna, Claudia Lupi, Anders J. McCarthy, Geoffroy Mohn, Lachit Singh Ningthoujam, Michael Nirrengarten, Nobuaki Osono, David W. Peate, Patricia Persaud, Ning Qiu, Caroline M. Robinson, Sara Satolli, Isabel Sauermilch, Julie C. Schindlbeck, Steven M. Skinner, Susanne M. Straub, Xiang Su, Liyan Tian, Froukje M. van der Zwan, Shiming Wan, Huaichun Wu, Rong Xiang, Rajeev Yadav, Liang Yi, Cuimei Zhang, Jinchang Zhang, Yang Zhang, Ning Zhao, Guangfa Zhong, and Lifeng Zhong2
Keywords: International Ocean Discovery Program, IODP, JOIDES Resolution, Expedition 367, Expedition 368, Site U1502, northern South China Sea, continent–ocean transition zone, Ridge A, hyperextension, continental breakup, thinning, rifting, altered basalt, Cenozoic, prerift, red clay, greigite, agglutinated benthic foraminifers
MS 367368-106: Published 28 September 2018
Site summary
Background and objectives
Site U1502 (proposed Site SCSII-17A; Sun et al., 2016) within the South China Sea (SCS) northern margin (Figures F1, F2) is located at 3764 meters below sea level (mbsl) on a prominent basement ridge (A) within the continent–ocean transition (COT) (Figure F3). Ridge A is one of four distinct basement highs found across the COT. The outer margin high (OMH) is the most landward of these highs and is followed seaward by the nearly parallel Ridges A, B, and C. A key objective of Expeditions 367 and 368 was to examine the nature of the crust within Ridge A. This ridge is considered to be a pivotal element in the transition from continental to oceanic crust. Hence, the main objective of Site U1502 was to drill through synrift deposits overlying an interpreted shallow-dipping (~20°) fault zone and into the crystalline basement below the fault. Information on the nature and age of the synrift deposits overlying the fault, as well as the nature and age of the overlying sediments and associated seismic unconformities, formed another target with the objective of constraining basin subsidence.
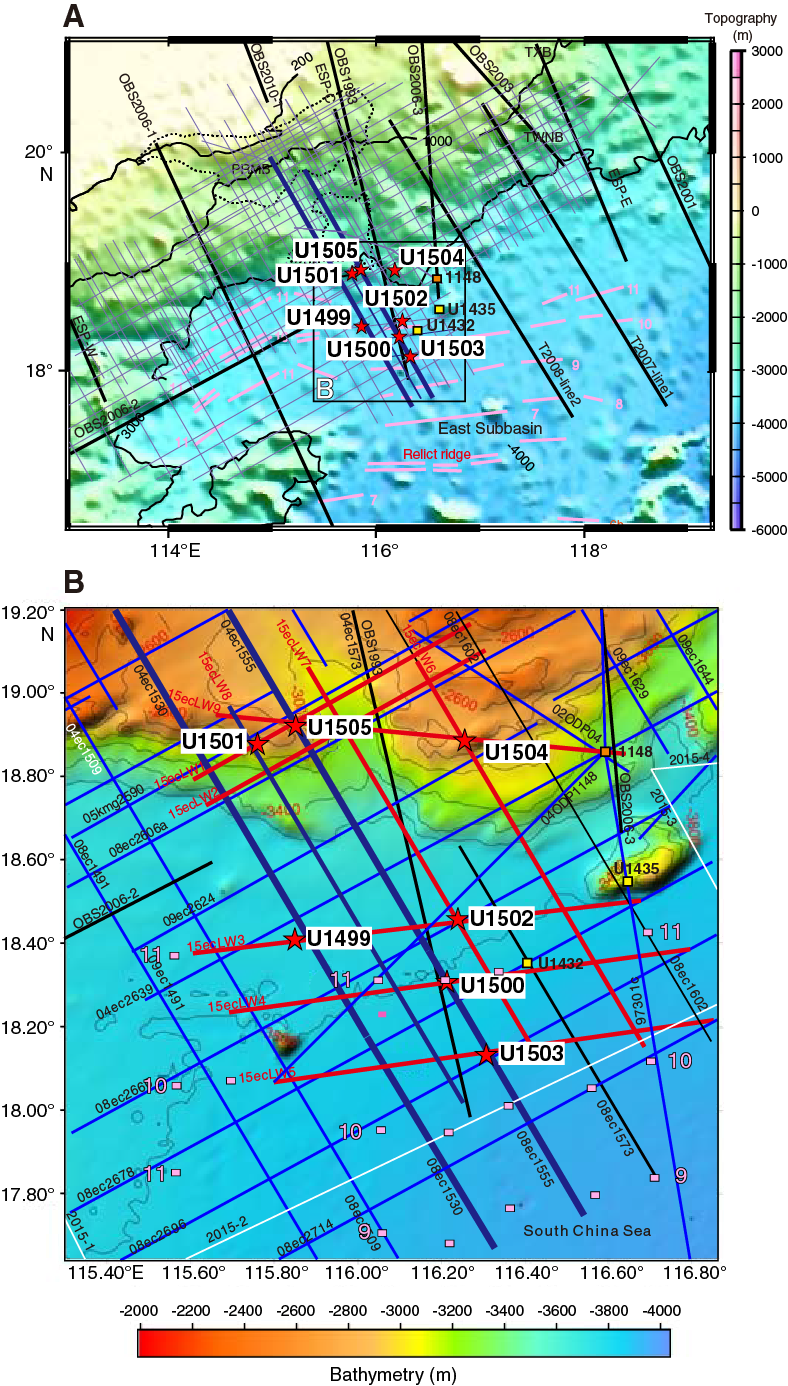
Figure F1. Northern SCS margin with seismic coverage.
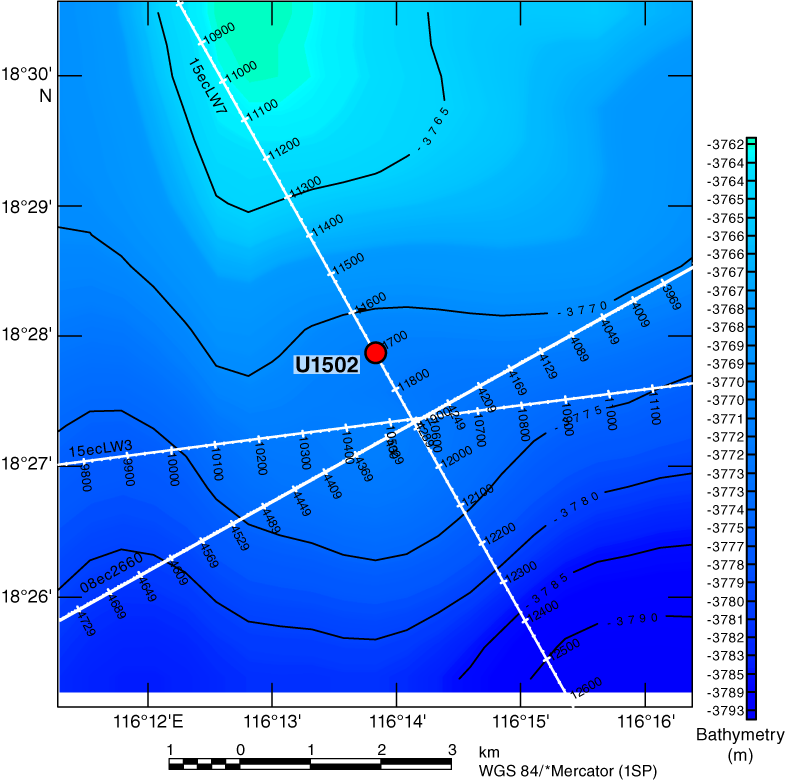
Figure F2. Bathymetry with seismic lines.
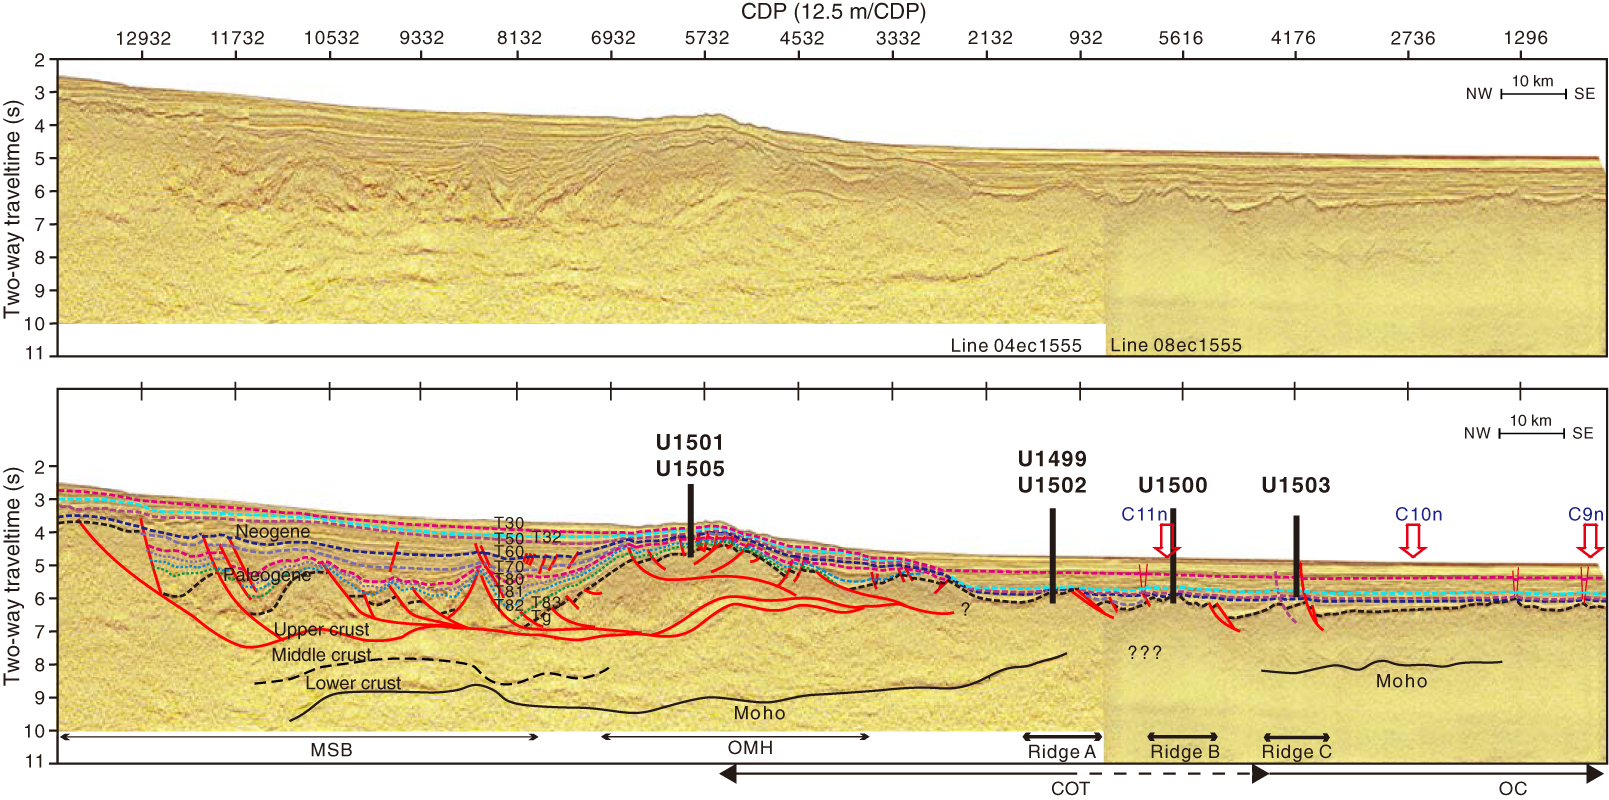
Figure F3. Deep crustal time-migrated seismic reflection data.
Operations
We conducted operations in two holes at Site U1502. Hole U1502A is located at 18°27.8720′N, 116°13.8381′E, at 3763 mbsl. Our operations in Hole U1502A were designed to provide information on formation characteristics and drilling conditions so that we could decide the length of casing to drill into the seafloor in deep-penetration Hole U1502B. Given this purpose and the amount of time to drill the second, deep hole, we did not core continuously in Hole U1502A. Instead, we drilled without coring from the seafloor to 375.0 m and cored with the rotary core barrel (RCB) system from 375.0 to 758.2 m, recovering 176.81 m (46%). Hole U1502B is located at 18°27.8798′N, 116°13.8409′E, at 3763.6 mbsl. In Hole U1502B, we drilled a reentry funnel and 727.7 m of 10¾ inch casing into the seafloor; cored with the RCB system through the sediment–basalt transition (727.7–739.16 m) and 180 m into the underlying basalt (739.16–920.95 m), recovering 128 m (70%); and collected downhole log data with the triple combo tool string and a check shot with the Versatile Sonic Imager (VSI) tool string.
Lithostratigraphy
The sedimentary succession recovered at Site U1502 extends from the late Eocene to the late Miocene. The succession includes four sedimentary units (I and III–V) that are composed of mainly clay, nannofossil-rich clay, biosiliceous-rich clay, limestone, and clast-rich clay and two igneous units (II and VI) that are mainly composed of basalt. The base of the sedimentary succession is a sequence of clay and metasediments (dolomite marble and dolomitic limestone) that possibly forms the contact with a unit of altered basalt (Unit VI) (Figure F4).
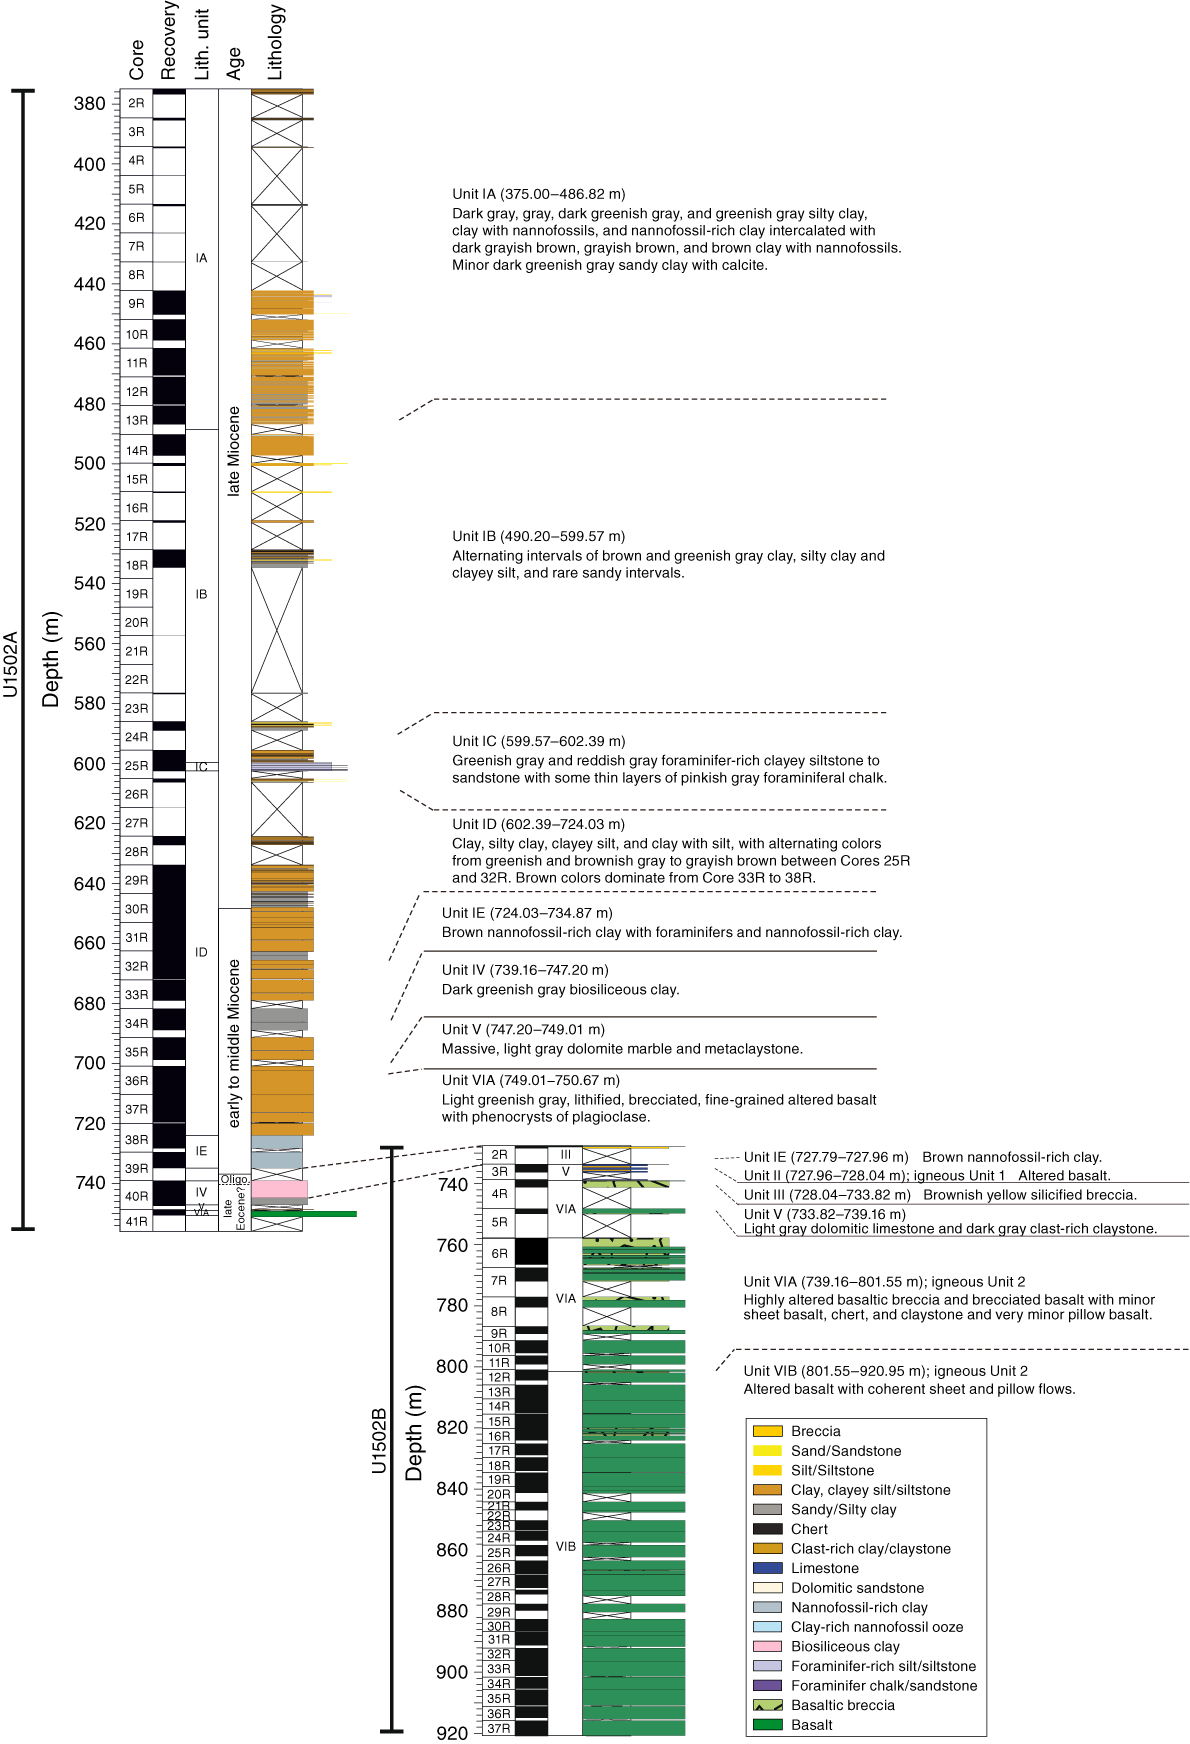
Figure F4. Simplified lithology and unit descriptions.
Late Miocene to late Oligocene lithostratigraphic Unit I is divided into five subunits. Subunit IA (Hole U1502A = 375.00−486.82 m) is composed of dark gray, gray, dark greenish gray, and greenish gray silty clay, clay with nannofossils, and nannofossil-rich clay intercalated with dark grayish brown, grayish brown, and brown clay with nannofossils, with minor dark greenish gray sandy clay with calcite. Subunit IB (Hole U1502A = 490.20–599.57 m) is composed of alternating intervals of brown and greenish gray clay, silty clay, and clayey silt. Sandy intervals are rare. Recovery in Subunits IA and IB was very poor, which might be due to the occurrence of thick sand beds that were washed out. Subunit IC (Hole U1502A = 599.57–602.39 m) is composed of greenish gray and reddish gray foraminifer-rich clayey siltstone to sandstone with parallel laminations and convolute bedding, with thin layers of pinkish gray foraminiferal chalk. Subunit ID (Hole U1502A = 602.39–724.03 m) is mainly composed of alternating greenish and brownish gray and grayish brown clay, silty clay, clayey silt, and clay with silt (Cores 368-U1502A-25R through 32R), but brown colors dominate Cores 33R through 38R. Nannofossils are abundant within the lowermost ~4 m of this subunit. Subunit IE (Hole U1502A = 724.03–734.87 m; Hole U1502B; 727.79–727.96 m) is composed of brown nannofossil-rich clay with foraminifers and nannofossil-rich clay with pale green colored halos around fractures. The sediments of Unit I are interpreted as having been deposited in a deep-marine environment. Fining-upward intervals in Subunits IA–IC are interpreted as turbidites.
Unit II is a highly altered greenish gray basalt clast recovered from Hole U1502B at 727.96–728.04 m. The primary mineral phases are replaced by an alteration-mineral assemblage.
Unit III (Hole U1502A = 739.10–739.16 m; Hole U1502B = 728.04–733.82 m) is composed of brownish yellow, very hard, poorly sorted breccia. The granule- to pebble-size siliceous clasts consist of alteration minerals (Fe hydroxides) cemented by a matrix of annealed quartz in various grain sizes.
Unit IV (Hole U1502A = 739.16–747.20 m) consists of biosiliceous-rich silty clay. Diatoms, sponge spicules, and radiolarians are abundant in the upper part, but the abundance of both nannofossils and diatoms decreases rapidly downhole from Section 368-U1502A-40R-1 to Section 40R-3. Pyrite occurs as centimeter-sized patches and along cracks. The layering in Unit IV is inclined and may be slightly deformed.
Unit V (Hole U1502A = 747.20–749.01 m; Hole U1502B = 733.82–739.16 m) is an interval of alternating metasediments (dolomite marble, dolomitic limestone, and clast-rich clay). The dolomite marble is dominated by very fine grained dolomite (~95%) with minor amounts of magnetite (~3%) and calcite (~2%). The annealing texture is equigranular and crossed by fine-grained dark gray bands. The presence of magnetite explains the extraordinarily high magnetic susceptibility of this unit. The gray, fine-grained dolomitic limestone in Hole U1502B is intercalated with well-consolidated, very dark greenish gray clay with 10%–15% igneous clasts. The sediment is partially overprinted with alteration caused by secondary high-temperature processes (e.g., hydrothermal fluid sediment interaction or contact metamorphism).
Unit VI (Hole U1502A = 749.01–750.67 m; Hole U1502B = 739.16–920.95 m) consists of highly altered basaltic breccia, brecciated basalt, pillow basalt, and sheet basalt. The unit is divided into two subunits. Subunit VIA is composed of highly altered basaltic breccia and brecciated basalt with minor sheet basalt, chert, and claystone and very minor pillow basalt. Subunit VIB is dominated by altered pillow basalt and sheet flows and is less brecciated than Subunit VIA.
Igneous petrology
At Site U1502, we recovered two igneous lithologic units. Unit 1 (lithostratigraphic Unit II) is represented by just three small, aphanitic, fine-grained basalt fragments that contain rare plagioclase phenocrysts (Figure F5). Alteration of Unit 1 is intense, with most of the groundmass replaced by green clay minerals, clinozoisite, zeolites, and Fe (hydr)oxides.
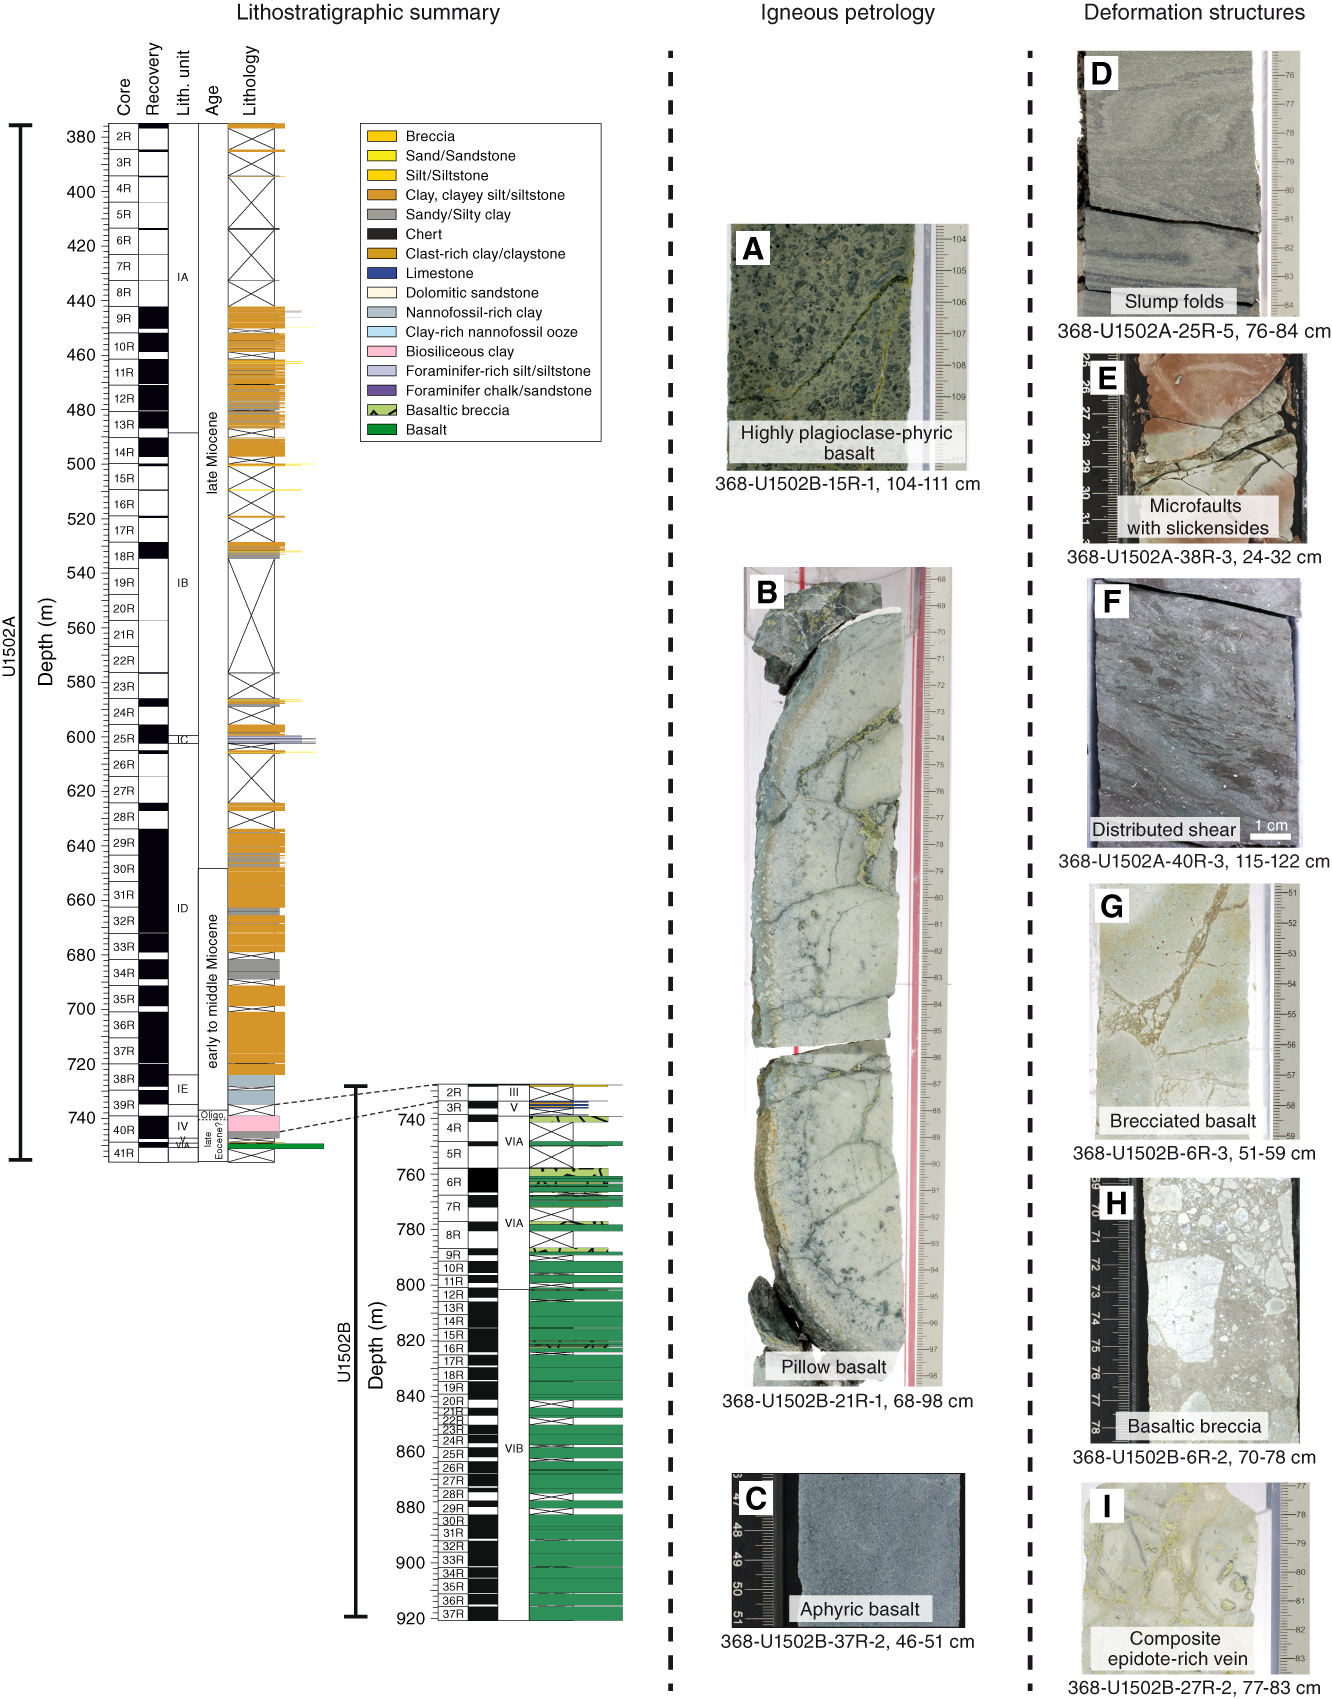
Figure F5. Lithostratigraphic summary.
Unit 2 (lithostratigraphic Unit VI) comprises a 182 m thick sequence of highly altered aphyric to highly plagioclase porphyritic basalts with minor chert (Figure F5). These basalts are divided into two igneous subunits (2a and 2b) based on flow morphology and alteration style: an upper brecciated and fractured massive lava flow sequence (Subunit 2a) and a lower sequence of interbedded pillow flows with lobate and sheet lava flows in which the alteration style is characterized by intense veining (Subunit 2b). Subunit 2a is characterized by highly altered breccia clasts of sparsely to moderately phyric basalt in a matrix of carbonates, epidote, chlorite, Fe (hydr)oxides, quartz, zeolite minerals, and clay minerals. The clasts show an alteration assemblage similar to the matrix, with remnant plagioclase and secondary pyrite. Subunit 2b consists of aphyric to highly plagioclase phyric (>30%) basalts with abundant chlorite and sulfides, as well as epidote, clay minerals, carbonates, zeolites, and opaque minerals.
All of Unit 2 has undergone some degree of hydrothermal alteration. This alteration varies from complete replacement of the rock, where the original composition and texture are difficult to determine, to replacement of mineral phases with little change to the texture. Glassy pillow rinds are completely replaced, and multiple phases of veining and halos are ubiquitous throughout the rocks. Three vein types were observed: (1) white to green to black silica-epidote veins, (2) apple green pyrite-epidote veins, and (3) white silica and/or calcite veins. Sulfide mineralization (disseminated and veined) is widespread throughout Unit 2 and is dominated by pyrite, with minor sphalerite, chalcopyrite, and covellite.
Handheld portable X-ray fluorescence (pXRF) analyses show no significant differences in contents of alteration-resistant elements such as Ti and Zr within Unit 2, but Subunit 2a has lower MgO, FeO, and MnO than Subunit 2b, which is consistent with the higher degree of alteration. Subunit 2b is also strongly affected by secondary alteration, but areas of less intense alteration are indicated by higher magnetic susceptibility and high CaO and Fe2O3 contents. Unit 1 appears to be compositionally distinct from Unit 2 and has, for example, higher Ti/Zr ratios.
Structural geology
Deformation structures are scarce in Unit I above Core 368-U1502A-37R, with only a local, convolutely bedded sequence in Core 25R. Downhole from Core 37R at ~700 m, a gradual increase in deformation structures was observed (Figure F5). Cores 37R through 39R are characterized by microfaults, as evidenced by downward-dip plunging striations and slickensides on exposed fracture surfaces, systematically associated with greenish halos. No deformation structures were encountered in Unit II. Unit III consists of extremely silicified breccia that was poorly recovered. The nature of this breccia, however, as sedimentary, tectonic, or hydrothermal remains unconstrained at the moment. In Unit IV, a small-scale transition from distributed to localized shear in unlithified sediments was documented. No deformation structures were encountered in Unit V.
Unit VI is essentially composed of basalts that were heterogeneously affected by brecciation and veining associated with the circulation of hydrothermal fluids. Subunit VIA is dominated by brecciated basalt/basaltic breccia, whereas Subunit VIB comprises a rather coherent series of lava flows crosscut by a multistage network of polymineralic veins. The uppermost part of Unit VI contains severely fractured and fragmented basalt locally filled by fine-grained unconsolidated greenish rock. Subunit VIA is characterized by diverse brecciation horizons associated with veins and microcracks. Depending on the intensity of fragmentation and the clast/matrix ratio, the rocks are referred to as brecciated basalt or basaltic breccia. A typically observed feature is the jigsaw-puzzle structure, suggesting possible in situ fragmentation. Macro- and microscopic observations show that the breccia-clasts consist mainly of sparsely to moderately plagioclase phyric basalts that were hydrothermally altered to variable degrees. Thus, formation of such breccias likely involved fluid-assisted fracturing of basalt. In contrast, Subunit VIB is characterized by a progressive decrease of breccia horizons and the development of different vein types, almost always polymineralic. Notably, vein composition and their orientation changes through Subunit VIB. Although numerous small-scale veins often related with major veins were observed, three first-order vein types were categorized: (1) composite silica-rich veins, (2) composite epidote-rich veins, and (3) composite carbonate- and/or silica-rich veins.
Biostratigraphy
All core catcher samples from Hole U1502A and selected samples from Hole U1502B were analyzed for calcareous nannofossils, foraminifers, diatoms, and ostracods. Additional samples were taken from the working-half core intervals when necessary to refine the ages. The preservation of calcareous microfossils is mostly good to moderate in the upper sections (Cores 368-U1502A-2R through 13R) and moderate to poor in the lower sections (Cores 14R through 41R). Planktonic foraminifers and calcareous nannofossils are abundant to common in Cores 2R through 10R, 25R, and 37R through 39R and rare to barren in all other sections. Diatoms were only observed in Sections 40R-1 through 40R-3. In Hole U1502B, foraminifers were observed only in Section 3R-1 and are represented by well-preserved agglutinated deepwater taxa. Ostracods are extremely rare; single occurrences were observed only in three samples in Hole U1502A (Samples 3R-CC, 4R-CC, and 5R-CC).
Fourteen planktonic foraminifer and calcareous nannofossil biostratigraphic events were used to provide an age-depth model for Site U1502 from the late Oligocene to the late Miocene. The Pliocene/Miocene boundary is placed tentatively within Core 368-U1502A-2R, but it may be shallower than the cored section. The Miocene/Oligocene boundary was determined to lie between Samples 39R-CC and 40R-1, 7 cm. Sedimentation rates vary from ~10 mm/ky in the early–middle Miocene to ~39 mm/ky in the late Miocene. No planktonic microfossils were found in Hole U1502B, but a sample from the sandy interval in Core 3R revealed abundant and diverse abyssal agglutinated benthic foraminifers. The composition of this agglutinated benthic foraminifer assemblage provides a possible age of late Eocene for this interval.
Paleomagnetism
The magnetic behavior of sediments at Site U1502 correlates with their color (greenish gray or reddish brown). Reddish brown sediment shows alternating field (AF) magnetization indicative of magnetite or titanomagnetite and hematite (responsible for the color). In contrast, greenish gray sediment hosts magnetite or titanomagnetite and pyrrhotite. The predominance of steep normal inclinations (~75°; Figure F48) across all late Oligocene to late Miocene units (375.00–750.67 m) affects the superconducting rock magnetometer (SRM) section measurements and prevents any reliable magnetostratigraphy to be established for Holes U1502A and U1502B.
The basalt has natural remanent magnetization (NRM) intensity one order of magnitude higher than sediment. The main magnetically remanent phase is titanomagnetite, but its alteration produces maghemite or hematite. Magnetic susceptibility (κ) has a bimodal distribution with a median at 327 × 10−6 SI. κ does not show any strong correlation with any chemical (R2 = 0.343 for Fe2O3 wt%). Intervals of high κ might correspond to the bottoms of flows with a massive, less altered structure. Altered basalts have higher Koenigsberger ratios (Qn = 1–10) than fresher basalts (Qn = 0.001–1). The mean dip of magnetic foliation is 8°.
Cores 368-U1502B-9R and 10R show less-pervasive drilling overprint, and two discrete samples show both a normal (soft) component and a reverse (hard) component, suggesting a possible reversal.
Geochemistry
Site U1502 contains very low high-hydrocarbon gas abundances and total organic carbon (TOC), nitrogen, and sulfur contents, likely reflecting the poor preservation of organic matter. Instances of high carbonate content are associated with siderite, and on occasion this mineral comprises >50 wt% by mass of intervals in lithostratigraphic Subunit ID. The interstitial water at Site U1502 is enriched in Ca, Mg, and K and has notably high alkalinity but is depleted in Na, Cl, and Br. The linear increase of major anion and cation contents implies upward movement of fluid from deeper sediments. The hemipelagic sediments within Unit I have some similarities to the geochemical characteristics of the hemipelagic and pelagic units at Sites U1501 and U1505, but Site U1502 sediments are enriched in Fe, K, and clay concentrations, likely as a result of regions of increased alteration. All of the analyzed igneous rocks from Units II–VI are heavily altered, although samples from igneous lithologic Subunit 2b are altered to a lesser degree than those from Subunit 2a.
Physical properties
Physical property data acquired at Site U1502 include density, magnetic susceptibility, P-wave velocity, natural gamma radiation (NGR), color reflectance, and thermal conductivity (Figure F63). These data allow us to characterize four physical property (PP) units. PP Unit 1 (375–740 m) corresponds to the nannofossil-rich and biosiliceous-rich clay lithologies and exhibits small variations in NGR between 50 and 70 counts/s and uniformly increasing P-wave velocities with depth that average <2500 m/s. Unit 1 sediments have similar porosities to those recorded at nearby Sites U1499 and U1500 in the same depth interval, suggesting the same compaction history. A significant increase in bulk density (up to 2.7 g/cm3) in Core 368-U1502B-3R is associated with strongly lithified limestone beds. Variations of high and low magnetic susceptibility values correspond to sediment color changes in Unit 1 and may be controlled by the amount of pyrrhotite within the sediments.
PP Unit 2 (740–750 m) in Hole U1502A is characterized by lower P-wave velocities and bulk densities and higher NGR than the strata above. Low densities and P-wave velocities found in Unit 2 reflect the clast-rich claystone from lithostratigraphic Unit V.
PP Units 3 and 4 represent the basaltic basement and are characterized by relatively low NGR (<10 counts/s), high densities, and P-wave velocities that vary over a broad range (3000–6000 m/s). The boundary between Units 3 and 4 is marked by an abrupt increase in density, P-wave velocity, and thermal conductivity and coincides with the change from igneous lithologic Subunit 2a to 2b. Prominent magnetic susceptibility peaks (up to 4000 × 10−5 SI) in Units 3 and 4 correspond to relatively less altered basalt. Thermal conductivity in Units 3 and 4 is variable but generally increases in line with decreasing porosity with depth.
Downhole measurements
Wireline logging was conducted in Hole U1502B using a modified triple combination (triple combo) tool string and the VSI tool string. The modified triple combo tool string included the Hostile Environment Natural Gamma Ray Sonde (HNGS), Hostile Environment Litho-Density Sonde (HLDS), and Dipole Sonic Imager (DSI) for acoustic velocity. The triple combo run collected good data downhole from 875.3 m (~45 m above the bottom of Hole U1502B) and allowed us to define eight logging units, which correlate in great part to the lithostratigraphic units and core physical properties. Logging Units 1–5 are defined by data collected through the casing and drill pipe. Unit 6 data was collected outside the casing but inside the drill pipe, whereas data in Units 7 and 8 were collected in the open hole. For measurements inside the casing and/or drill pipe, only NGR and the associated K, Th, and U components provide meaningful data, although they are highly attenuated by the casing and/or drill pipe. Open borehole conditions from the bottom of the casing at 723 m to 875.3 m were generally good, with measured diameters from 12 to 14.5 inches. Log and core data generally show good agreement, and downhole measurements provide information in zones of poor core recovery in Hole U1502B. The log data exhibit increasing densities and P-wave velocities with depth. The amplitude of NGR increases gradually with depth throughout Units 1–3 (seafloor to ~630 m), with an interval of relatively constant values between 150 and 350 m. NGR values are lowest in Units 4–8 (~630–850 m).
The VSI tool string was run only inside the casing because the tool could not pass through an obstruction encountered at the end of the casing. Eight stations were attempted. The two deepest stations (at 715.1 and 695.2 m) are associated with large noise levels, which were possibly caused by poor mechanical coupling of the casing with the surrounding formation. The remaining upper six stations, located at 290.2, 350.3, 450.3, 550.1, 590.3, and 630.3 m, recorded good quality waveforms.
Background and objectives
Site U1502 within the SCS northern margin (Figures F2, F6) is located at a water depth of 3764 m on a prominent basement ridge (Ridge A) within the seaward end of the COT. Ridge A is one of four distinct basement highs found across the COT (Figure F3). The OMH is the most landward of these highs (see the Site U1501 chapter [Larsen et al., 2018]) within the COT and is followed seaward by the nearly parallel Ridges A, B, and C. The crustal thickness below Ridge A is significantly smaller (~8 km) than below the OMH (~15 km) and close to the thickness found ~6 km further seaward within the COT. The oldest interpreted seafloor-spreading magnetic anomaly seaward of Site U1502 is Chron C11n (~30 Ma), which runs parallel to Ridge A (Figures F1, F3) ~20 km to the south of the ridge.
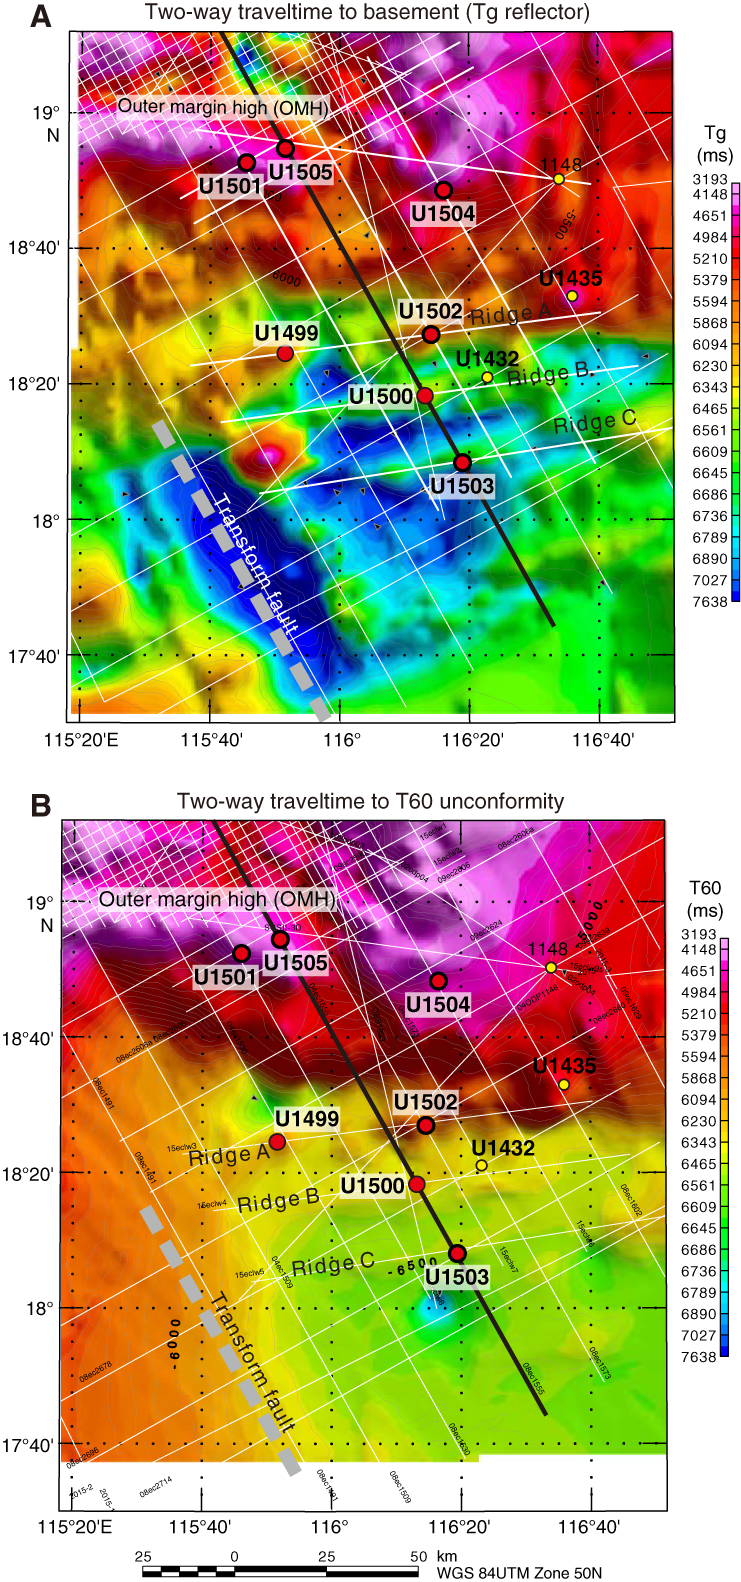
Figure F6. Two-way traveltime to Tg and T60 unconformities.
Site U1499 was also drilled on Ridge A ~70 km west of Site U1502 and recovered a Neogene sediment section on top of the basin-wide Tg reflector. Below the Tg reflector, Site U1499 recovered Oligocene sediments (see the Site U1499 chapter [Sun et al., 2018b]). The pre-Miocene sediments comprise sandstone, claystone, matrix-supported breccia, and gravel. They are interpreted to have a proximal source and to possibly reflect a tectonically active environment. True crystalline basement was not recovered at Site U1499 due to the collapse of Hole U1499B.
Site U1502 on Ridge A is located near the crossing of seismic Lines 15eclLW7 and 15eclLW3 (Figure F2, site specific bathymetry). Ridge A can be followed along the margins for more than 100 km (Figure F6). Before drilling, it was interpreted to be fault bounded (Figure F7, main line). The structure is narrower and steeper in this location than elsewhere along the ridge. Along strike, it forms an elongated local high on Ridge A (Figure F8, cross-line). This seismic line along the ridge also shows evidence of normal faulting. In general, however, the seismic reflectors do not show significant dip that would be indicative of major fault-block rotation. The one exception is the set of strong reflectors overlying the interpreted fault on the seaward flank of the ridge (Figure F7, main line). No 3-D interpretation of faults was possible.
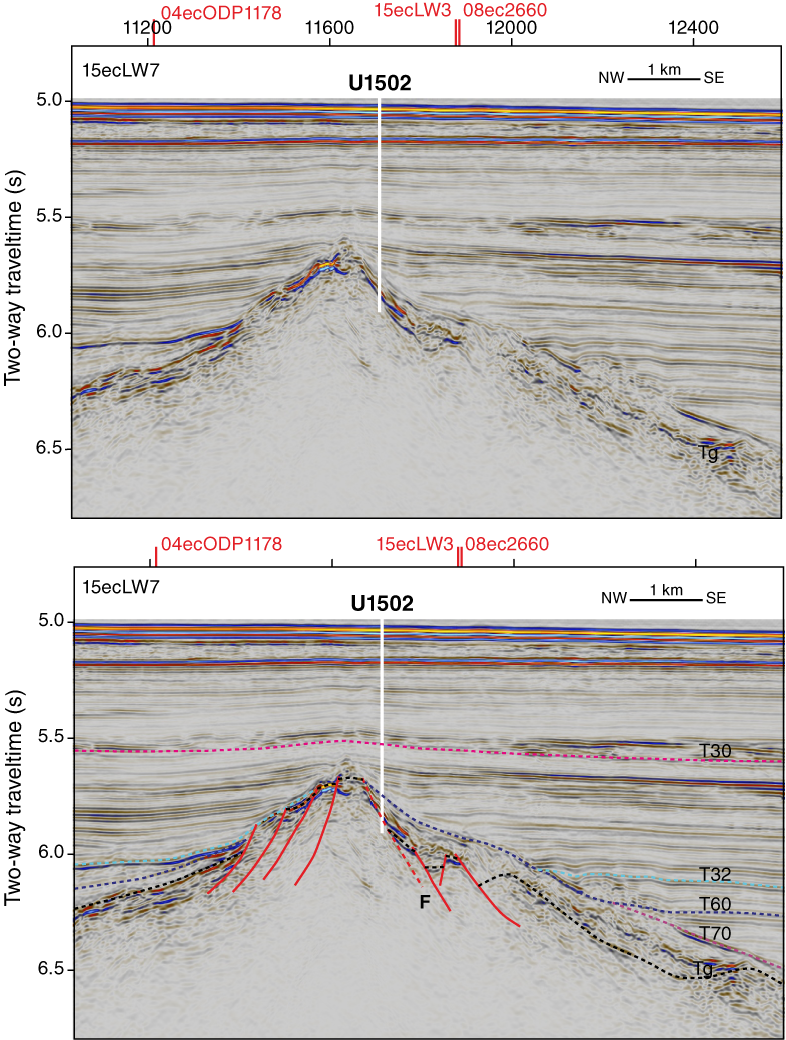
Figure F7. Original and predrilling interpretation of seismic Line 15ecLW7.
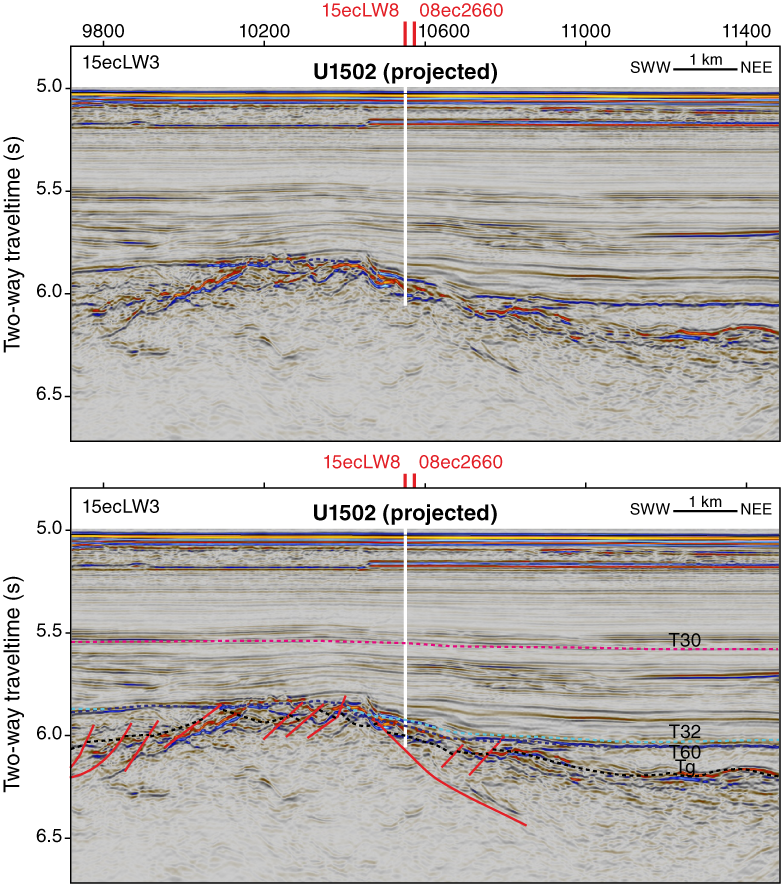
Figure F8. Original and predrilling interpretation of seismic Line 15ecLW3.
The predrilling interpretation of the seismic unconformities (T30 to T70 and Tg reflector; see Correlation to seismic data in the Expedition 367/368 methods chapter [Sun et al., 2018a]) around Site U1502 is shown in Figure F7 (main line). This shows the regional T60 unconformity rising from the basin seaward of Ridge A, possibly present almost to the top of the structure, and reappearing on the landward side of the ridge. It is also possible, however, that the T32 unconformity has completely removed (eroded) the T60 unconformity across the ridge, in which case sediments of lower and middle Miocene age should be missing at this site. The high-amplitude, dipping reflectors at Site U1502 just below this unconformity were interpreted predrilling as synrift deposits of pre-T60 (~23 Ma) age, possibly sediments of the same age and nature as those recovered at Site U1499, and related to rifting. However, as detailed in this chapter, the high-amplitude reflector (Tg) represents the top of a sequence of seaward-dipping, submarine basaltic lava flows, implying that the structure is a seaward rotated fault block bounded entirely by landward-dipping normal faults.
A key objective of Expeditions 367 and 368 was to examine the nature of the crust within Ridge A. This ridge is considered a key element in the transition from continental to oceanic crust. Specific questions to be answered by drilling:
- Does it represent continental crust, and if so, does it represent upper or lower crust?
- Did tectonic exhumation reach into the lithospheric mantle, and did serpentinization take place?
- Or is the structure possibly partly or wholly of igneous origin (see the Expedition 367/368 methods chapter [Sun et al., 2018a])?
Because Site U1499 failed to provide conclusive evidence of the nature of the crystalline basement of Ridge A, the key objective of Site U1502 was to drill through the interpreted fault zone and into the crystalline basement at this location on Ridge A. Information on the nature and age of interpreted synrift deposits overlying the fault forms a secondary objective, along with the nature and age of the overlying unconformities, their depositional environment, and the constraints they can offer on basin subsidence.
In this deep water, post-Miocene sediments were deposited below the carbonate compensation depth (CCD) and were therefore not a coring objective. Site operations were planned to drill without coring through the sediments postdating the T30 unconformity, core from there to basement in Hole A, drill in Hole B with casing almost to the T60 unconformity, and then core from there until conclusive results regarding basement were obtained (see Operations).
Operations
We conducted operations in two holes at Site U1502 with the objective of sampling the lowermost sediment and underlying basalt. We successfully penetrated from the seafloor to the sediment/basalt contact at 728 m and 180 m into the underlying basalt. The sedimentary section was not continuously cored, and recovery in the cored intervals was highly variable and relatively low (46%). In contrast, core recovery in the basalt was significantly better (70%). Downhole logging was conducted in Hole U1502B with the triple combo and VSI tool strings.
Hole U1502A is located at 18°27.8720′N, 116°13.8381′E, at a water depth of 3763.2 m. Operations in Hole U1502A were designed to provide information on the formation characteristics and drilling conditions so that we could decide the length of casing to drill into the seafloor at the second, deep-penetration Hole U1502B. Given this purpose and the amount of time needed to drill Hole U1502B, we did not core continuously in Hole U1502A. Instead, we drilled without coring from the seafloor to 375 m and RCB cored from 375 to 758.2 m, recovering 176.81 m (46%).
Hole U1502B is located at 18°27.8798′N, 116°13.8409′E, at a water depth of 3763.6 m. We conducted the following operations in Hole U1502B:
- Drilled a reentry funnel and 727.7 m of 10.75 inch casing into the seafloor,
- RCB cored the sediment sequence from 727.7 to 739.16 m (11.46 m cored; 3.55 m recovered; 31%),
- RCB cored 180 m into the underlying basalt (739.16–920.95 m; 128 m recovered [70%]), and
- Collected downhole log data with the triple combo and VSI tool strings.
Hole U1502A and U1502B coring summaries are presented in Table T1. A diagram of the reentry cone and casing in Hole U1502B is shown in Figure F9.
Table T1. Site U1502 core summary. View table in PDF format. Download table in CSV format.
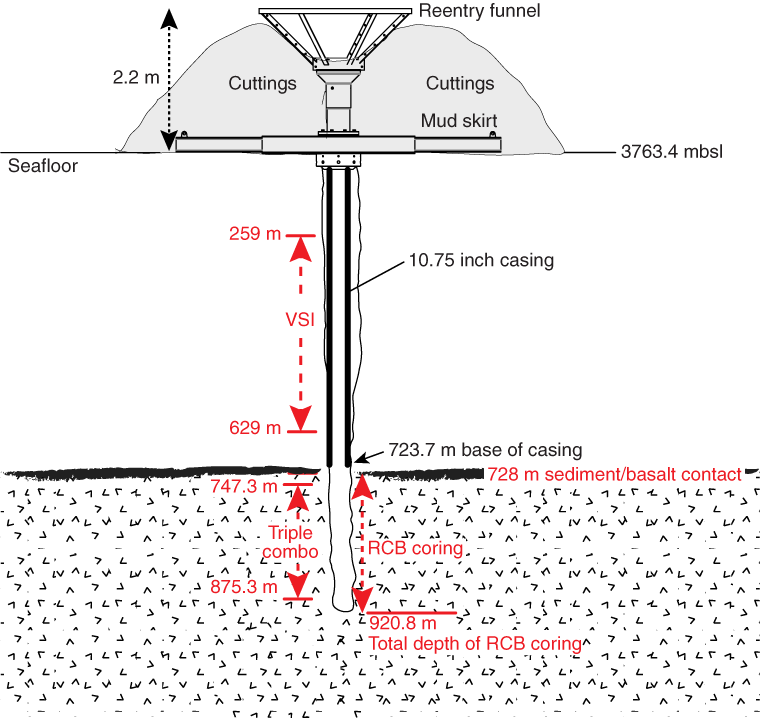
Figure F9. Reentry system and casing.
Hole U1502A
The R/V JOIDES Resolution made the 36.5 nmi transit from Site U1501 to Site U1502 in 3.6 h, averaging 10.1 kt. The vessel arrived over the site coordinates at 2142 h on 24 April 2017. At 2240 h, an acoustic beacon was deployed approximately 100 m west of the site coordinates. Upon arrival at Site U1502, a new C-4 RCB bit with a mechanical bit release (MBR) was assembled onto the bottom of the bottom-hole assembly (BHA). The core barrel space out was checked, and the BHA was lowered to 161 mbsl. The precision depth recorder measurement taken on arrival showed a calculated seafloor depth of 3768.4 m.
The bit was lowered to 3733 mbsl, stopping every 20 stands to fill the pipe with water. The upper guide horn (UGH) was pulled, and the underwater camera system was deployed to the seafloor to observe the end of the pipe tag the seafloor. While the camera was being lowered, 115 feet of drill line was slipped and cut. After the slip and cut operations were completed, the bit was spaced out to 3750.7 m and slowly lowered until it was observed that the bit had tagged the seafloor. Seafloor was determined to be at 3763.7 m. The bit was again spaced out to 3750.7 m, and the top drive was picked up. The UGH was raised, and the underwater camera was recovered at 1215 h. A center bit was dropped, and drilling in Hole U1502A started at 1300 h on 25 April. The hole was advanced without coring to 375 m in 18 h. The center bit was removed, and an RCB core barrel was dropped to begin coring operations. One of the main objectives in Hole U1502A was to RCB core to a depth in the formation that would provide a stable casing set point for the next hole.
Cores 2R through 7R were drilled very quickly and had little recovery. This low-recovery area was interpreted as an unconsolidated sand interval. Penetration rates slowed for Cores 8R through 14R, with the bit taking approximately 15,000 lb of weight during coring operations. Recovery improved through this mudstone interval but dropped off in what was interpreted as another unconsolidated sand interval from 499.5 to 585.9 m (Cores 15R through 23R). A second mudstone interval was sampled with very good recovery from Core 24R at 585.9 m to Core 39R at 739.1 m. The last 2 m of the following core, Core 40R, drilled very slowly, indicating a major change in formation. One more core was drilled to confirm the continuity of the formation change. At that point, coring in Hole U1502A was terminated in favor of continuing to core in a cased hole. The drill string was pulled to the surface, clearing the seafloor at 0330 h on 30 April and ending Hole U1502A and beginning Hole U1502B.
Total time spent on Hole U1502A was 125.25 h (5.2 days). A total of 40 RCB cores were taken over a 383.2 m interval with 176.81 m of recovery (46%). One interval was drilled without coring from the mudline to 375.0 m.
Hole U1502B
We secured the RCB components of the BHA and prepared the rig floor for reentry and casing operations. The vessel was offset to the coordinates provided from the science office, and the UGH was removed and laid out to the drill collar racks.
The hydraulic release tool (HRT) was made up to a landing stand and racked back in the derrick. The prepared mud skirt was moved onto the moonpool doors and centered underneath the rotary table. After rigging up to run 10¾ inch casing, 62 joints of 10¾ inch casing (723.7 m) were run through the mud skirt. The landing stand was picked up, and the casing was lowered to the moonpool and latched into the mud skirt. The adapter flange was unbolted, and the landing stand was pulled back to the rig floor and racked back in the derrick.
The bit, bit sub, underreamer, and mud motor were assembled, and a pump-in sub was connected to the top of the mud motor. The mud motor and underreamer were function tested in the moonpool with good results. The remainder of this drilling stinger was assembled. The landing joint was again picked up, and the mock hanger and HRT were attached to the top of the casing and mud skirt. The adapter flange was bolted up and tightened with a torque wrench to the recommended torque. The reentry funnel was picked up in the moonpool and securely welded to the mock hanger.
The drilling and casing assemblies were lowered to the seafloor, stopping every 20 stands to secure the drill string and fill it with water to prevent collapse from differential pressure. After running in to 3744 m, the subsea camera was lowered to the bottom of the pipe to observe the drilling activity. While the camera descended, the top drive was picked up and the rig was serviced. The drill string was spaced out, and slow circulating rates were recorded. Drilling the casing into Hole U1502B started at 3763.7 mbsl at 1255 h on 1 May 2017. Drilling continued until the 723.7 m long casing string had been fully drilled into the seafloor and the mud skirt landed on the seafloor. The go-devil was inserted into the drill pipe and pumped down to release the casing at 2220 h on 2 May. The drill string was released from the casing assembly, and the bit and underreamer were pulled back through the casing and back to the rig floor. The bit cleared the seafloor at 0115 h on 3 May. The remainder of the drill string was pulled back to the rig floor, and the bit cleared the rotary table at 1130 h on 3 May.
After the tricone bit was removed, the mud motor and underreamer were flushed with freshwater and laid out. The UGH was reinstalled, and the drill floor was reassembled. The RCB outer core barrel was set up in the rotary table, and the core barrels were spaced out to the outer core barrel. The remainder of the RCB BHA was made up, and the bit was lowered to 3732 m. The subsea camera system was deployed and run to near bottom in preparation for reentering Hole U1502B to begin coring operations. While the subsea camera was lowered to the seafloor, 115 feet of drill line was slipped and cut. After a 3.5 h search, we found the Hole U1502B reentry cone and reentered the hole at 0400 h on 4 May. The camera was then pulled back to the surface and secured.
The bit was lowered through the casing until it encountered fill at 715.3 m, 12.4 m above the total depth of the hole. The top drive was picked up, a core barrel was dropped, and the hole was washed and reamed to bottom. A 20 bbl mud sweep was circulated to help clean cuttings from the hole. Once the hole was clean, RCB coring began from 727.7 m and continued through Core 21R at 846.8 m. While cutting Core 21R, the driller noticed some excessive torque while on bottom. With 48.8 h on the bit, it was decided to pull out of the hole for a bit change. The bit was found to be in relatively good condition.
The drill string was pulled inside the casing before setting back the top drive. Overpull of 60,000 lb was noted between 740.3 m and the casing shoe. The bit was then raised to the mouth of the reentry cone, and the vibration isolated television (VIT) camera was run to the seafloor to verify the condition of the base and cone. The cone was visible but was below the sediment surface. Seawater was circulated in a successful attempt to clear the funnel of cuttings, and the VIT camera was retrieved to the moonpool. The bit was then retrieved to the surface, clearing seafloor at 0600 h and the rotary table at 1345 h on 8 May 2017.
A new 9⅞ inch C-7 RCB bit and an MBR were installed in the BHA, and the bit was run back to seafloor, followed by the subsea camera, for reentry. The cone was clearly visible, and Hole U1502B was reentered at 0240 h on 9 May. The camera was recovered, and the bit was lowered to 728.3 m, ~1.5 m below the casing shoe. The top drive was picked up, and a center bit was dropped. The hole was then washed to total depth, with the fill holding 10,000 lb weight on bit from 733.3 to 770.3 m.
A mud sweep was circulated, and the center bit was retrieved prior to resuming coring operations. Coring continued to 858.4 m, at which depth the low clutch diaphragm failed for the second time during the expedition at 0115 h on 10 May. The bit was pulled inside the casing and up to 715.3 m, and the drill pipe was hung off the elevators. The clutch diaphragm was replaced, and the drill string was lowered again by 0945 h on 10 May. While running in the hole, the driller noticed a spike in pressure, and a deplugger was dropped to clear any obstruction in the bit. The deplugger was retrieved, and a center bit was deployed so that the bit could be worked to the bottom of the hole. Before reaching the total depth of the hole, 3 m of fill was cleared. The center bit was then recovered, and coring resumed from 858.4 m (Core 25R) to a final depth of 920.8 m (Core 37R). Recovery was generally high over this interval (82%–101%), except for Cores 28R and 29R, which recovered only 33% and 45% and had higher rates of penetration of 2.76 and 3.75 m/h, respectively. The hole was then prepared for logging operations by circulating a high-viscosity mud sweep and performing a wiper trip. The bit was then released in the bottom of the hole. The end of pipe was raised to a logging depth of 747.3 m to ensure that the logging tools could bypass obstructions encountered by the bit when reentering the hole below casing.
Downhole logging
Two logging tool strings were deployed in Hole U1502B: a modified triple combo and the VSI. The triple combo tool string was then rigged up, zeroed, presurvey calibrated, and deployed in the hole with the following tools:
- DSI,
- HLDS with source,
- HNGS,
- Enhanced Digital Telemetry Cartridge (EDTC), and
- Logging Equipment Head (model QT) (LEH-QT).
The string made it into the open hole without any issue, but it stopped at a maximum depth of 4639 m wireline depth below rig floor (WRF), roughly 45.5 m higher than the driller’s total depth. Based on an unexpected drop in gamma ray readings through casing, this obstacle was believed to be fill from above that had slumped and fallen to the bottom of the hole.
The repeat pass was taken from that depth up to the point where the logging head was just outside the pipe. The tool was then returned to maximum depth, which remained firmly at 4639 m WRF. The main log started there and continued up past the seafloor to provide a continuous gamma ray log of the entire interval. The caliper was closed at 4549 m to facilitate pipe entry, which was accomplished without any problems. The tools were pulled to surface with ease until the final joint of pipe at the top.
With the EDTC already sticking out of the top of the pump-in sub during the process of pulling the tool up to remove the density source, a large overpull was observed, causing the tension alarms to trip and disable winch function. Several attempts were made to free the tool, but they only resulted in it becoming too stuck to move up or down significantly. An alternate plan to disconnect the first joint of drill pipe to permit access to the tool inside and then disassemble whichever portion was free to move was successful, and the radioactive source was rigged down along with the majority of the string. The portion remaining stuck in the top single consisted only of the LEH-QT and EDTC, which were extracted relatively quickly and easily from the bottom of that single using an air tugger.
There was no sign of damage to the tool string itself, nor was there any sign of a problem in the affected joint of pipe. The cause of the problem could have been a fragment of shear pin from coring or some other small debris such as a pebble or shear pin, but these items were never located. The string was safely rigged down with only ~30 min of additional time required. The wireline was extracted from the traveling blocks to facilitate pulling the pipe up to approximately 69 mbsl for the seismic run, and wireline operations were paused for that action.
The VSI string was rigged up, zeroed, presurvey calibrated, and lowered in Hole U1502B with the VSI, EDTC, and LEH-QT. While pulling up the pipe, the drill crew observed that the hole was beginning to flow and made an unplanned break in the tripping operation to pump down some seawater and stop the flow. Once the flow was halted, the seismic string was rigged up and lowered inside the hole without finishing the pull-out because the pipe was already at 4023 mbsl (259 m) and sufficiently high to avoid any major complication with the seismic experiment and because it was getting too late to raise the pipe any higher and still have sufficient time to finish the survey before dark.
The tool was rigged up as quickly as was safe and was run in the hole at a somewhat accelerated rate to make as much use as possible of the remaining daylight. The depth was correlated and adjusted to be on-depth in real time using a distinct gamma ray peak at 4413 meters below rig floor (mbrf) (corrected depth based on field pick of sea bed; raw depth of 4411.3 mbrf on main pass of first run). With the seismic tool on-depth, several attempts were made to get out of the casing and down to the bottom of the hole so that the deepest requested stations for the survey could be recorded, but the tool appeared to be hanging up on a ledge and was unable to pass into the open-hole section.
With very little daylight remaining, the open-hole stations were canceled in order to concentrate on getting as many of the cased-hole stations as time would permit. In all, eight stations were attempted, all in casing. Of those, the deepest two did not produce any useful signal, but the upper six all resulted in good seismic arrivals. The seismic survey was concluded roughly at sunset, and the tool was pulled out of the hole and rigged down in the usual manner. The heave compensator was not required for any portion of the logging because the total heave was just ±2 inches throughout the entire operating time.
The logging equipment was then rigged down, and the crew began recovering the drill string. The bit cleared the seafloor at 2235 h on 13 May. The beacon was recovered at 0015 h on 14 May, and the vessel began moving toward Site U1503 in dynamic positioning mode. The bit cleared the rotary table at 0445 h on 14 May, ending Hole U1502B and Site U1502.
Total time spent on Hole U1502B was 337.25 h (14.1 days). A total of 36 RCB cores were taken over a 193.1 m interval in Hole U1502B with 126.94 m of recovery (66%). There was one drilled interval from the mudline to 727.7 m, with 10¾ inch casing installed to 723.7 m. The triple combo string collected data in the open hole between 747.3 and 875.3 m, and the VSI logging experiment was conducted only inside casing between 259 and 629 m.
Lithostratigraphy
We examined the lithostratigraphy of Holes U1502A (Figure F10) and U1502B (Figure F11) and defined six lithostratigraphic units and seven subunits based on visual core description, smear slide and thin section inspection, and X-ray diffraction (XRD) analysis (see Lithostratigraphy in the Expedition 367/368 methods chapter [Sun et al., 2018a]). Four units (I, III, IV, and V) are sedimentary, and two units (II and VI) are igneous. Units II and III were only recovered in Hole U1502B, and Unit IV was only recovered in Hole U1502A. Several of the subunits exhibit gradual changes, complicating a clear definition of their boundaries. The precise depth of boundaries between certain lithostratigraphic subunits within the intervals of poor core recovery is difficult to determine. The boundaries were refined using physical property measurements (e.g., changes in magnetic susceptibility, color reflectance spectroscopy, and seismic velocity) (see Physical properties; also see Physical properties in the Expedition 367/368 methods chapter [Sun et al., 2018a]) and carbonate measurements (Figure F56).
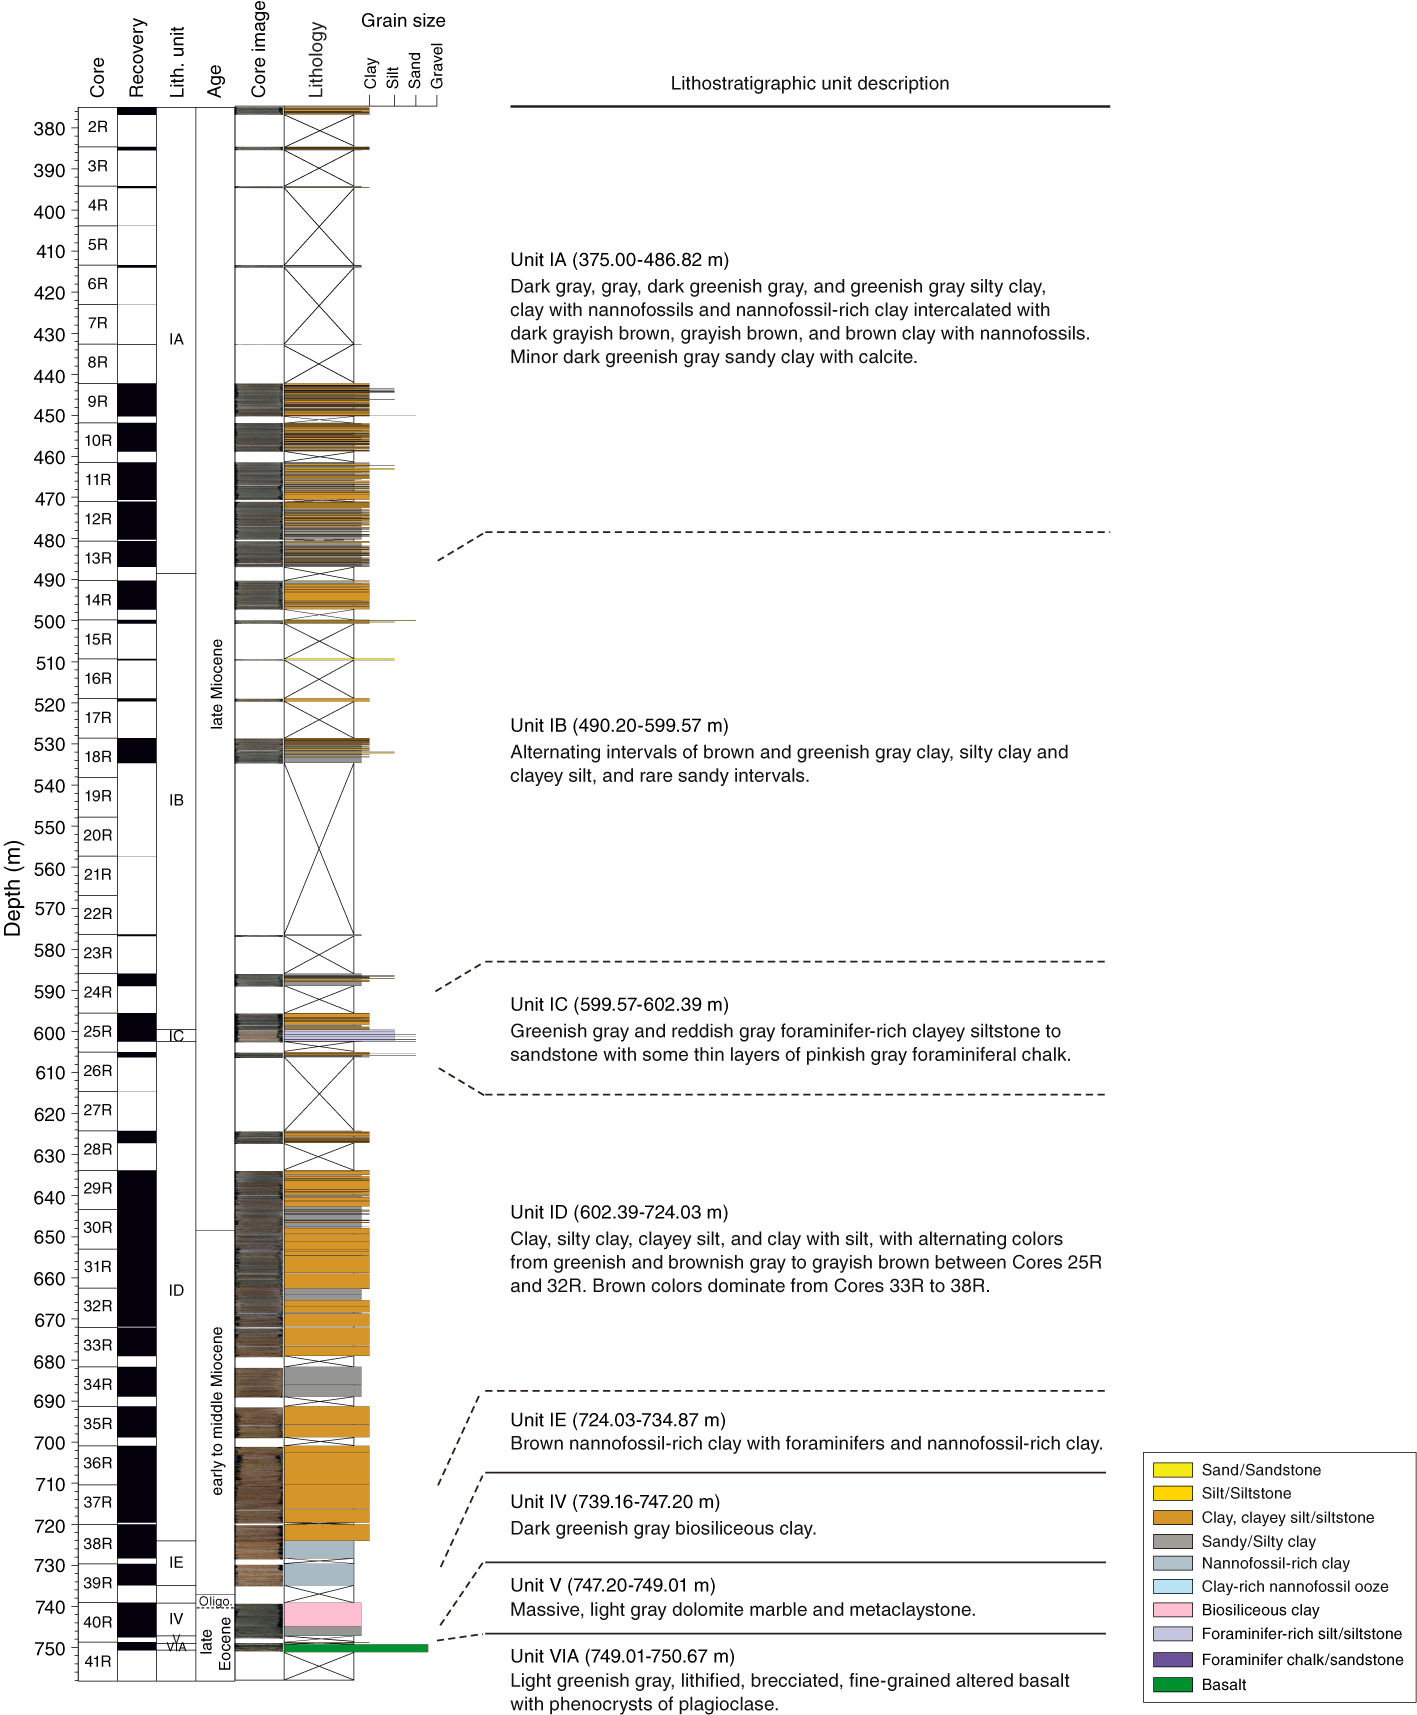
Figure F10. Lithostratigraphic summary, Hole U1502A.
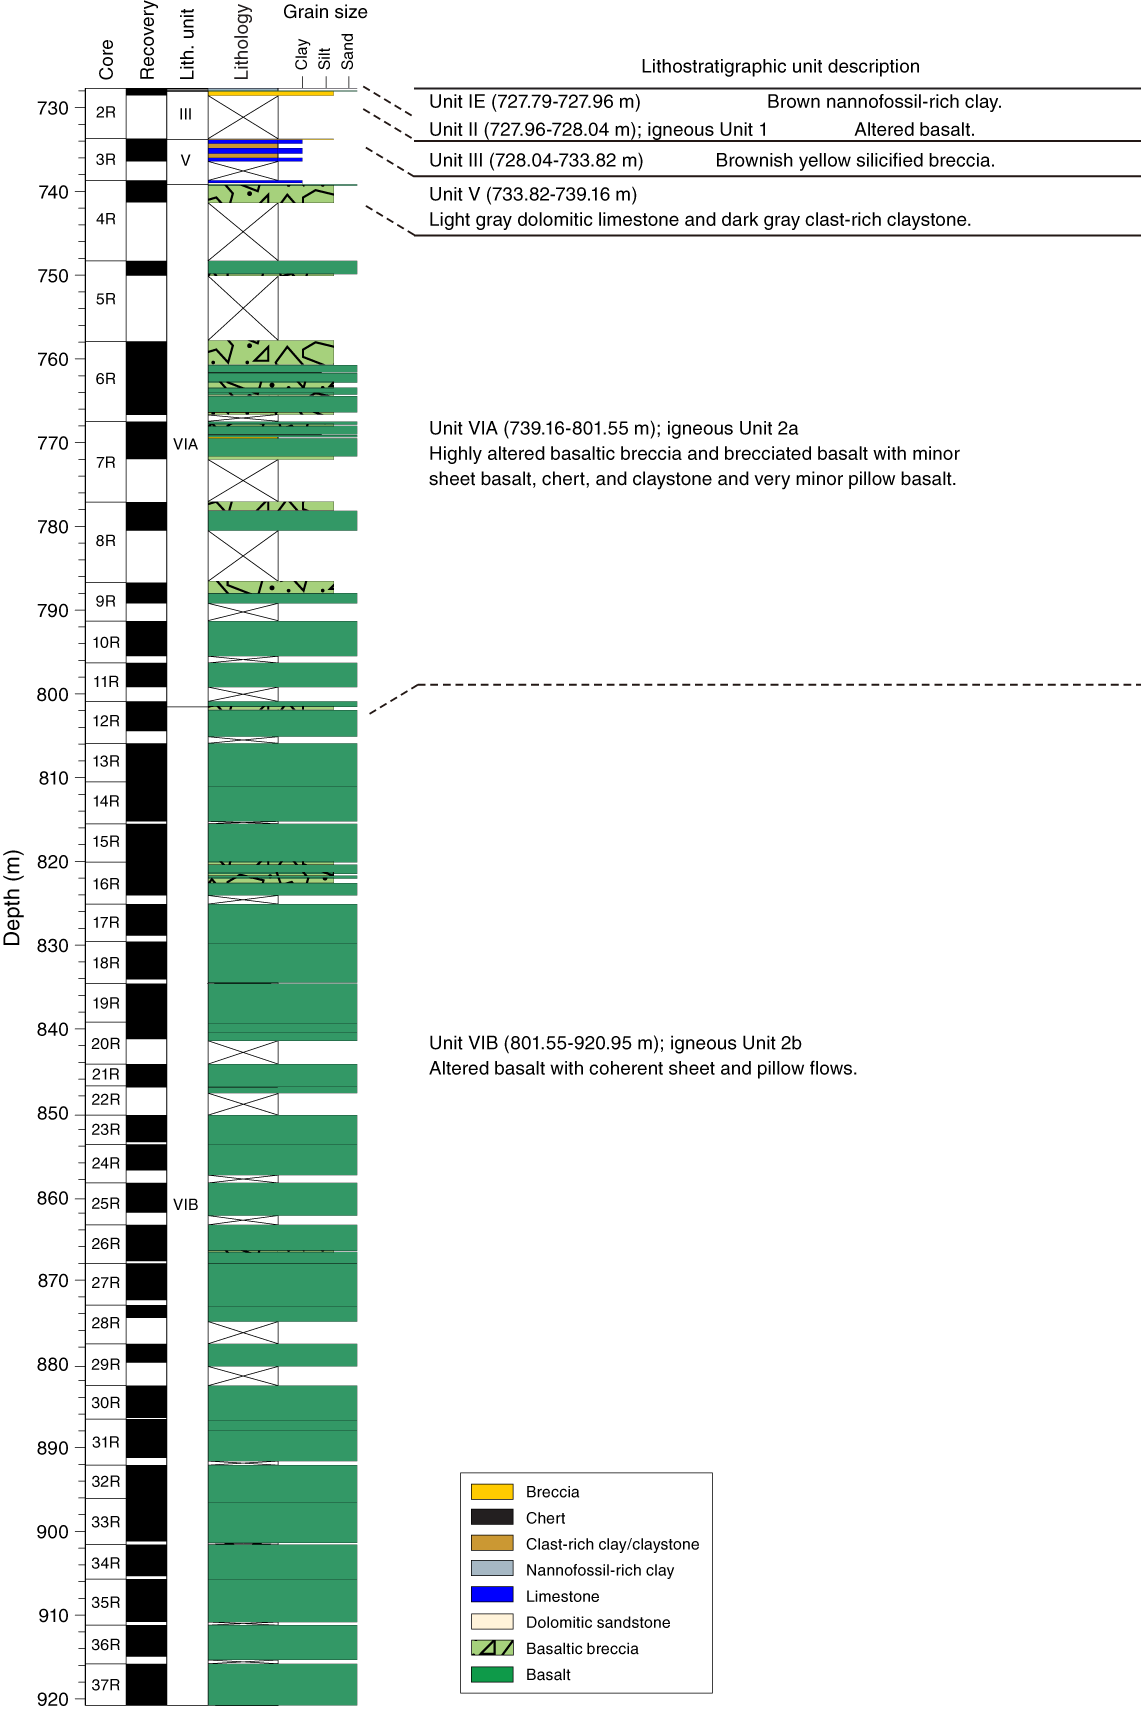
Figure F11. Lithostratigraphic summary, Hole U1502B.
The sedimentary succession recovered at Site U1502 extends from the early Oligocene to the late Miocene (see Biostratigraphy), includes four units (I, III, IV, and V), and comprises mainly clay, nannofossil-rich clay, biosiliceous-rich clay, limestone, and clast-rich clay. The two igneous units (II and VI) are composed of highly to moderately altered basalt, basaltic breccia, and brecciated basalt. The base of the sedimentary succession is a sequence of clay and metasedimentary rocks (dolomite marble and dolomitic limestone) that form the contact above a unit of altered basalt (Unit VI). Unit I is dominated by clay and silty clay with varying amounts of nannofossils and foraminifers. The base of Unit I is defined at the base of the clay interval that has millimeter-sized pale green nodules. The contacts between Units II, III, and IV were not recovered. Unit II is a basalt clast. Unit III is silicified breccia. Unit IV consists of biosiliceous-rich silty clay transitioning downhole into silty clay barren of siliceous microfossils. Unit V is an interval of alternating metasedimentary rocks, including epidote-rich metaclaystone and dolomite marble. Unit VI consists of highly to moderately altered basaltic breccia, brecciated basalt, pillow basalt, and sheet basalt. Unit I is divided into five subunits, and Unit VI is divided into two subunits, described below.
Unit description
Unit I
- Intervals: 368-U1502A-2R-1, 0 cm, to 39R-CC, 19 cm; 368-U1502B-2R-1, 0–26 cm
- Depths: Hole U1502A = 375.00−734.87 m; Hole U1502B = 727.79–727.96 m
- Age: Miocene
Lithology and sedimentary structures
Unit I is dominated by clay, silty clay with varying proportions of nannofossils, clay-rich nannofossil ooze, minor sandy clay with calcite, nannofossil-rich clay with foraminifers, and sandy silt. The unit is divided into five subunits, IA–IE, based on slight lithologic variation. Recovery within the upper part of Unit I is very poor.
Bulk mineralogy
The bulk mineralogy results of XRD analyses are listed in Table T2. Unit I sediments in Hole U1502A are composed mainly of quartz, plagioclase, K-feldspar, siderite, clay minerals (smectite, illite, kaolinite and chlorite), and halite, as well as minor amounts of calcite and dolomite. The relative content of minerals changes significantly downhole (Figure F12). Siderite is a major component of the sediments and has a relatively high content (average ~39%) throughout Subunits IA–IC and the upper part of Subunit ID (410–680 m) but is almost absent in the lower part of Subunit ID between 680 and 750 m, except for an interval with an abnormally high content (~15%) at about 734.8 m. In Subunits IA and IB, the abundance of siderite corresponds well to the alternation of greenish gray (lower siderite) and brownish gray (higher siderite) layers. Other minerals, including quartz, plagioclase, smectite, and halite, show the reverse trend to siderite, possibly because of a dilution effect. K-feldspar and chlorite decrease downhole, whereas illite and kaolinite increase. Calcite and dolomite are rare, except for exceptionally high abundances in Subunits IC and IE.
Table T2. Mineral percentages, Hole U1502A. View table in PDF format. Download table in CSV format.
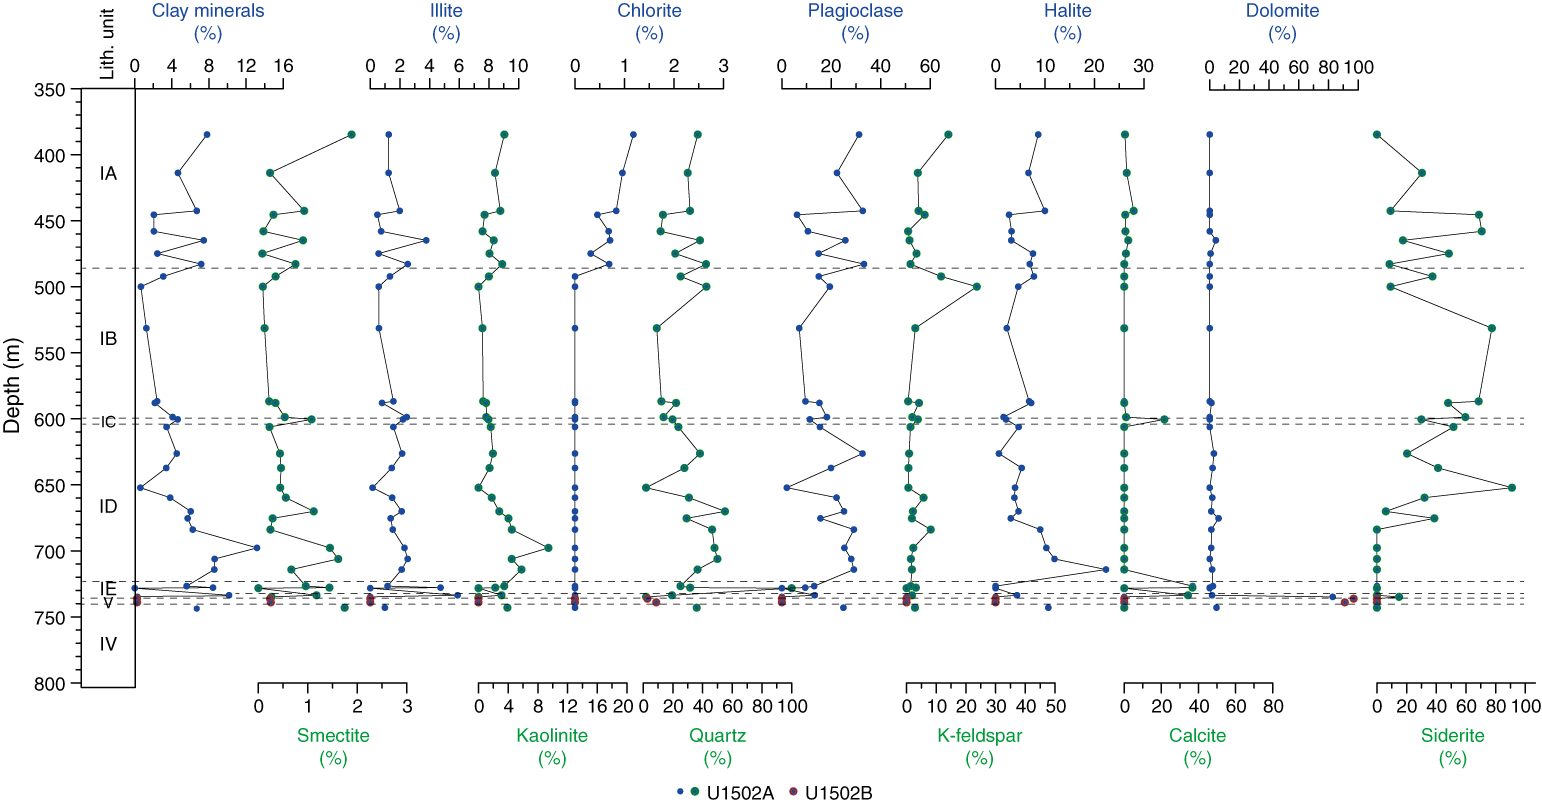
Figure F12. Bulk mineralogy.
Subunit IA
Subunit IA spans the uppermost 111.82 m of Unit I and comprises dark gray, gray, dark greenish gray, and greenish gray silty clay; clay with nannofossils; and nannofossil-rich clay intercalated with dark grayish brown, grayish brown, and brown clay with nannofossils. There is also minor dark greenish gray sandy clay with calcite. The lithologies are dominantly dark gray and dark greenish gray in the upper cores (375.15–432.67 m). Intervals that fine upward are common (Figure F13). The lithology changes downhole (442.2–486.82 m) to more greenish gray, dark grayish brown, and rarely brown lithologies. Lithologic variations are not directly tied to color boundaries, and some burrows extend across areas of contrasting color. The clay contains varying amounts of nannofossils, as well as foraminifers in some intervals. The terrigenous component is mainly quartz and clay, with lesser feldspar and rare singular volcanic glass shards. Most lithologies have calcite or dolomite crystals, as well as accessory glauconite, pyrite, and iron oxide grains in the more brownish lithologies.
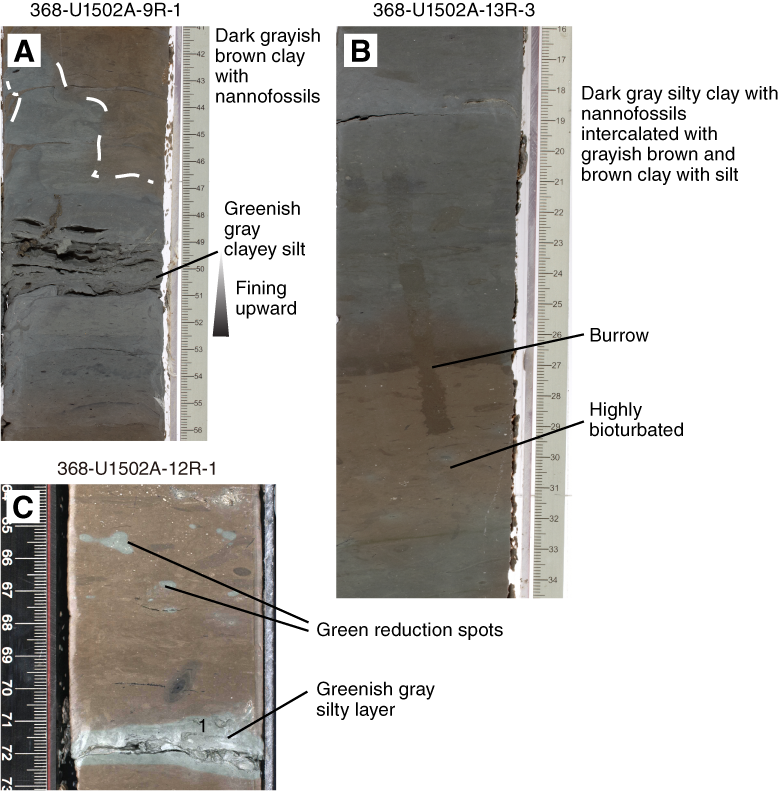
Figure F13. Bioturbation and burrows.
Bioturbation is heavy throughout most of Subunit IA, with Planolites and Chondrites as the main ichnospecies (Figure F13). Recovery between 375 and 445 m was very poor, possibly because sand layers were washed out.
The boundary between Subunits IA and IB is defined by the absence of nannofossils in Subunit IB.
Subunit IB
Subunit IB is 109.37 m thick and composed of alternating intervals of brown and greenish gray clay, silty clay, and clayey silt. Sandy intervals are rare. Two intervals of (light) greenish gray calcareous ooze occur in intervals 14R-1, 23–57 cm, and 15R-1, 63–69 cm (Figure F14). In general, the lithology (clay dominated) does not change across color boundaries, and some burrows extend across areas of contrasting color. Intervals that fine upward are common in the greenish gray layers. The sediment is dominated by clay minerals, quartz, feldspar, and authigenic siderite, as well as traces of pyrite.
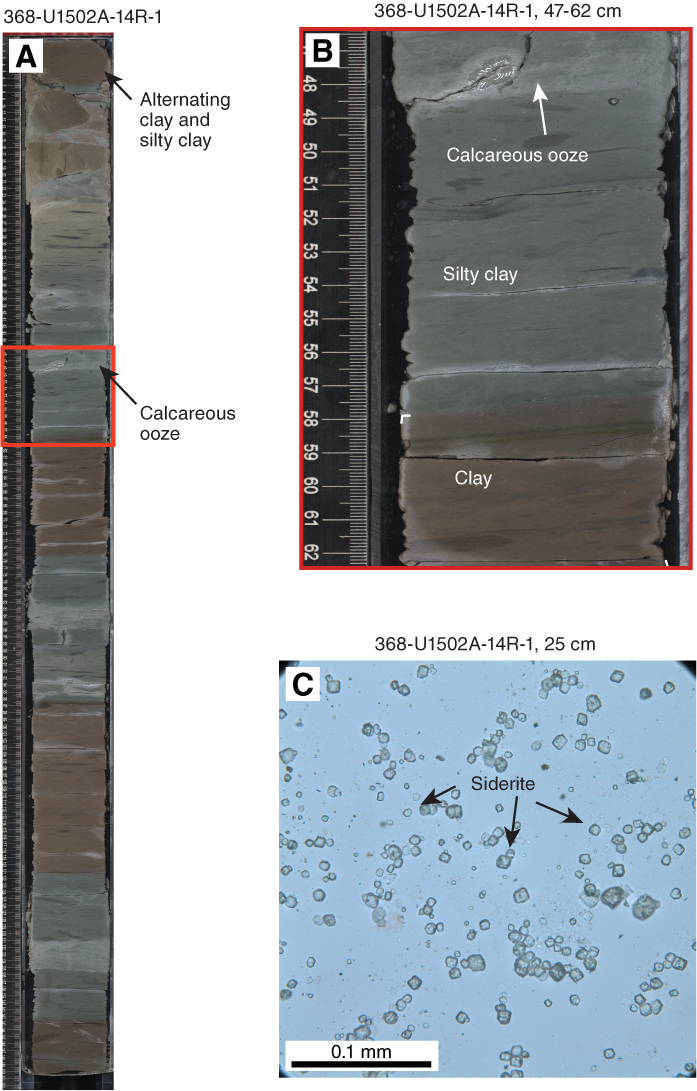
Figure F14. Sediment color change from greenish gray to brown.
Bioturbation is heavy in Subunit IB. Recovery was poor, which might be due to the presence of unconsolidated sand beds between the clay intervals.
The boundary between Subunits IB and IC is marked by a distinct change in lithology and in the consolidation and bedding structure of the sediments. Subunit IB is overall massive and well consolidated, whereas Subunit IC is laminated and lithified.
Subunit IC
Subunit IC is 2.82 m thick and coarser grained than the other subunits of Unit I. The dominant lithology is greenish gray and reddish gray foraminifer-rich clayey siltstone to sandstone with some thin layers of pinkish gray foraminiferal chalk (Figure F15). Foraminifers make up 25%–30% of Subunit IC, and foraminifer tests are embedded within a matrix of nannofossil-rich micritic calcite. The subunit consists of several layers that are characterized by erosive and inclined bottom contacts and upward fining. Within these intervals, the sediments show parallel laminations and convolute bedding.
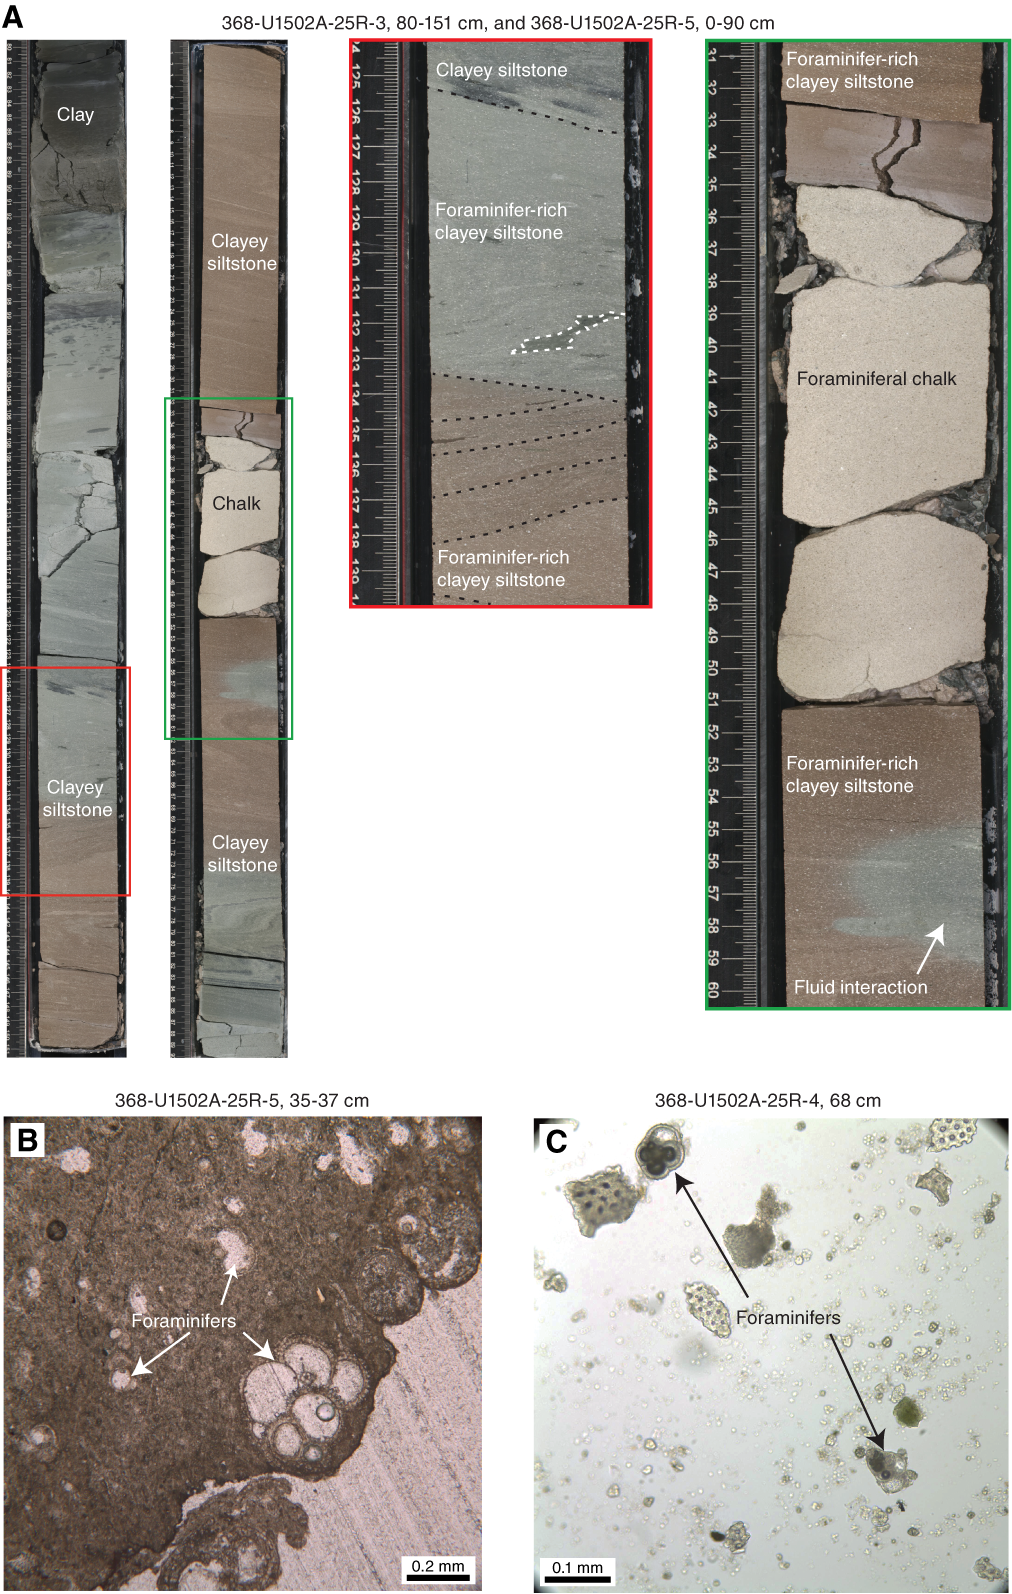
Figure F15. Dominant lithology, Subunit IC.
In contrast to the subunits above and below, Subunit IC is only slightly bioturbated. The contact with Subunit ID was not recovered but was interpreted on the basis of a change in the lithology from lithified foraminifer-rich siltstone to greenish gray clay.
Subunit ID
- Interval: 368-U1502A-25R-CC, 91 cm, to 38R-3, 131 cm
- Depth: 602.39–724.03 m
- Age: late to early Miocene
Subunit ID is 121.64 m thick and mainly composed of clay, silty clay, clayey silt, and clay with silt. The sediment has alternating colors from greenish and brownish gray to grayish brown between Cores 25R and 32R. Brown colors dominate in Cores 33R through 38R, and greenish gray colors only occur along fractures and burrows (Figure F16). The sediments are well consolidated and slightly laminated. Clay minerals are abundant, and quartz is common. Glauconite, pyrite, and siderite are rare to common.
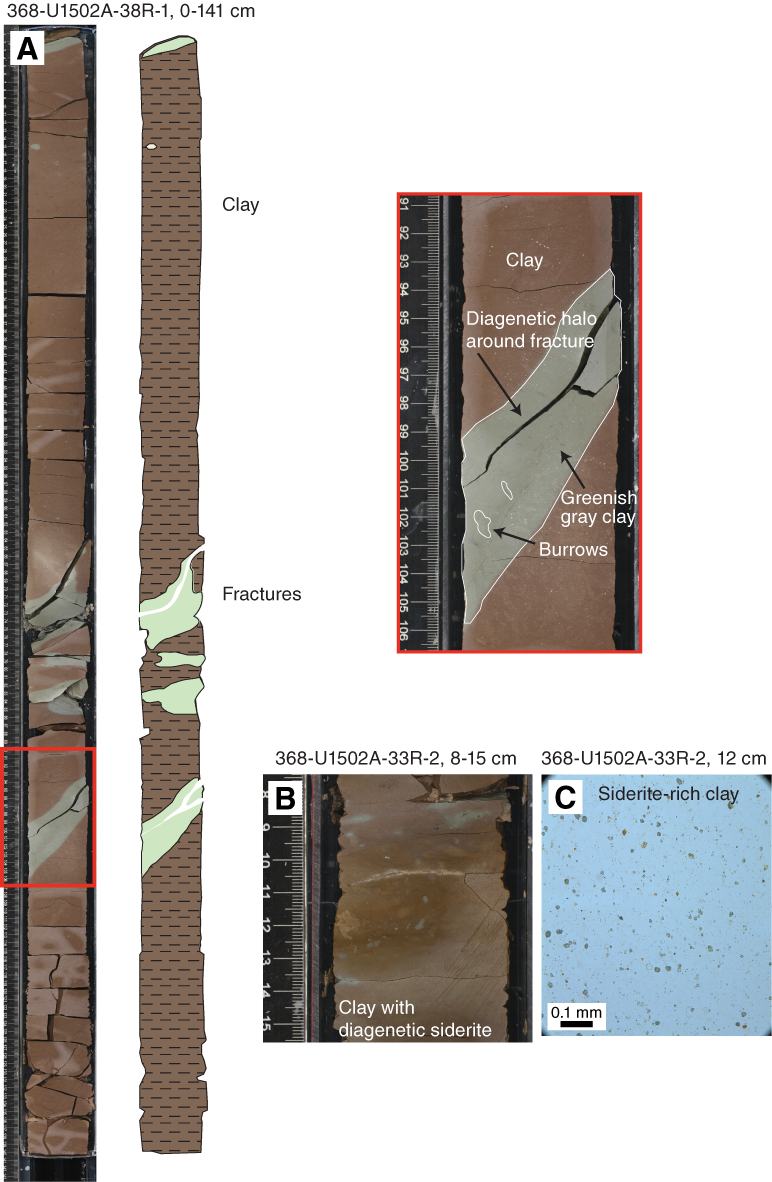
Figure F16. Dominant lithology, Subunit ID.
Subunit ID is heavily bioturbated, and some thin yellowish layers contain abundant diagenetic siderite (e.g., Core 33R; Figure F16).
The boundary between Subunits ID and IE is characterized by the appearance of abundant nannofossils and foraminifers in Subunit IE, accompanied by a slight change in color from darker to lighter brown.
Subunit IE
- Intervals: 368-U1502A-38R-3, 131 cm, to 39R-CC, 19 cm; 368-U1502B-2R-1, 0–26 cm
- Depths: Hole U1502A = 724.03–734.87 m; Hole U1502B = 727.79–727.96 m
- Age: early Miocene
Subunit IE is 10.84 m thick and composed of brown nannofossil-rich clay with foraminifers and nannofossil-rich clay. Pale green colors are restricted to halos around fractures (Figure F17) and are not related to a change in lithology. The sediment contains abundant clay minerals and, commonly, quartz and calcite. Pyrite was found in patches throughout the subunit. At the base of Unit I, within Core 368-U1502A-39R, are single, green, up to centimeter-size concretions (various green alteration minerals, including epidote) with black rims. The number of concretions increases downhole.

Figure F17. Dominant lithology, Subunit IE.
Unit II (igneous rock) was not recovered in Hole U1502A, and only a clast (fall-in) of Unit III was recovered in the uppermost few centimeters of Core 40R at the top of Unit IV. The boundary between Units I and IV is marked by a change in color from brown to dark greenish gray, a change in lithology from nannofossil-rich clay to biosiliceous clay, and an increase in NGR. However, there is a ~5 m gap in recovery between Cores 39R and 40R (see Operations). The contact between Units I and II was not recovered in Hole U1502B, but the lithology changes from sediment to igneous rock (Figure F18).
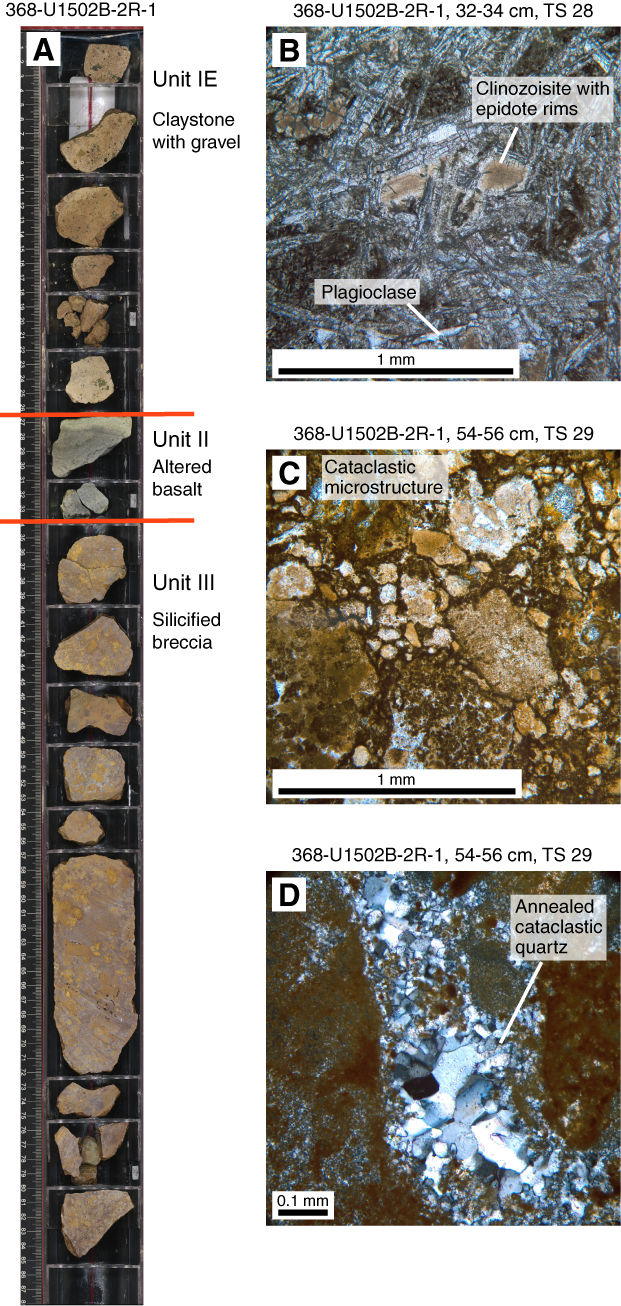
Figure F18. Core images.
Unit II
Unit II is a ~10 cm clast of greenish gray basalt with an equigranular texture (Figure F18). The basalt is highly altered, and most of the primary mineral phases are replaced by an alteration assemblage. Plagioclase laths as large as 3 mm make up approximately 1% of Unit I. The groundmass is intersertal with possible altered olivine, clinopyroxene, and/or altered glass between a felt of plagioclase crystals. The plagioclase has swallow-tail and bow-tie textures, indicating quenching.
The contact with Unit III was not recovered but is marked by a change in lithology (Figure F18).
Unit III
- Intervals: 368-U1502A-40R-1, 0–6 cm (fall-in); 368-U1502B-2R-1, 34 cm, to 3R-1, 12 cm
- Depths: Hole U1502A = 739.10–739.16 m; Hole U1502B = 728.04–733.82 m
- Age: Miocene/Oligocene boundary
Unit III is composed of a brownish yellow, silicified, very hard, poorly sorted breccia (Figures F18, F19). The average grain size is granule, and maximum clasts are pebble sized. The clasts consist of alteration minerals (Fe hydroxides) cemented by a matrix of annealed quartz in various grain sizes (see Structural geology for interpretation of textures).
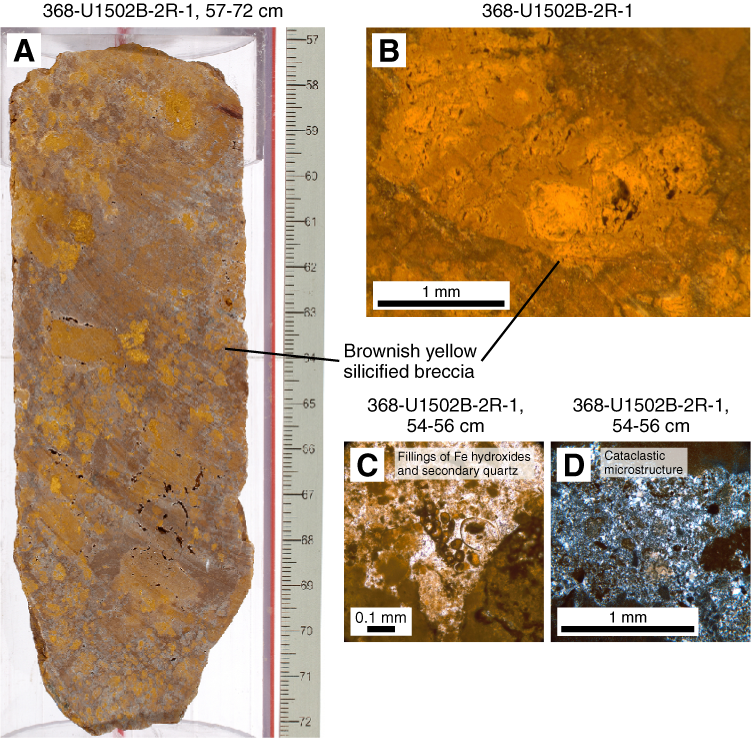
Figure F19. Brownish yellow silicified breccia.
In Hole U1502A, Unit III is represented by a single clast (fall-in) in the uppermost centimeters of Core 40R (Figure F20), whereas in Hole U1502B, an interval of 0.63 m (interval 2R-1, 34 cm, to 3R-1, 12 cm) was recovered (Figure F19). The contact with the underlying Unit IV was not recovered in Hole U1502A but is indicated by a change in lithology from poorly sorted silicified breccia to dark greenish gray biosiliceous clay. Unit IV was not recovered in Hole U1502B.
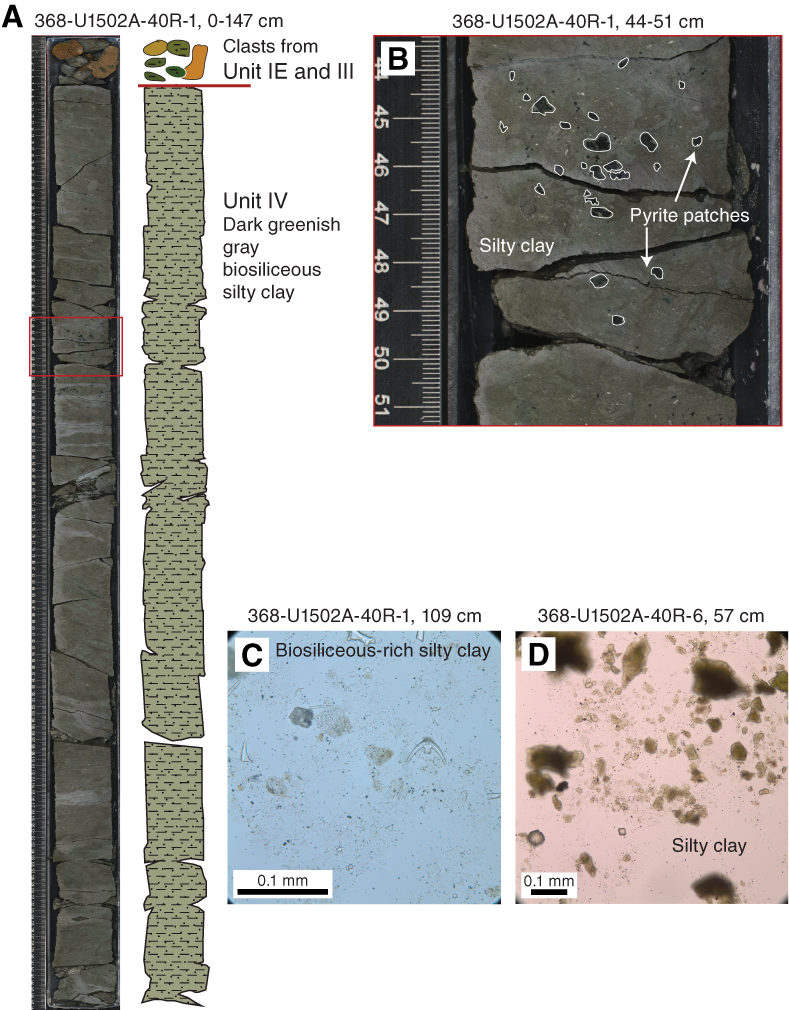
Figure F20. Dominant lithology, Unit IV.
Unit IV
Lithology and sedimentary structures
Unit IV is 8.1 m thick and was recovered only in Hole U1502A. The unit is dominated by dark greenish gray biosiliceous clay (Figure F20). The amount of nannofossils decreases rapidly within Section 40R-1, and diatoms, sponge spicules, and radiolarians are abundant. Diatom abundance decreases significantly from Section 40R-1 to Section 40R-3. The calcareous nannofossil abundance is rare to barren in Unit IV. Pyrite occurs in centimeter-sized patches and along cracks (Figure F20).
Unit IV is heavily bioturbated and, in the upper section, contains the same green concretions found in the lower part of Subunit IE. The layering in Unit IV is inclined (~20°) and slightly deformed (see Structural geology).
The bottom contact of Unit IV is irregular and subhorizontal, and the boundary is characterized by a lithology change from dark greenish gray, well-consolidated, biosiliceous clay to light gray, lithified marble. The boundary between Units IV and V is associated with a distinct increase in magnetic susceptibility in Unit V (see Physical properties).
Bulk mineralogy
One XRD sample from Unit IV (Table T2) indicates that the bulk mineralogy of the sediments is quartz, plagioclase, K-feldspar, and clay minerals (smectite, illite, and kaolinite), as well as minor amounts of halite and dolomite. No siderite, calcite, or chlorite were detected in the XRD sample. Apart from the absence of these minerals, Unit IV has a very similar mineral assemblage to Unit I but with slightly more abundant smectite (Figure F12).
Unit V
- Intervals: 368-U1502A-40R-6, 83 cm, to 41R-1, 31 cm; 368-U1502B-3R-1, 12 cm, to 4R-1, 46 cm
- Depths: Hole U1502A = 747.20–749.02 m; Hole U1502B: 733.82–739.16 m
- Age: unknown (at least pre-late Oligocene, possibly late Eocene)
Unit V is 1.82 m thick in Hole U1502A when calculated using the curated section lengths; however, only 43 cm of rock was recovered. In Hole U1502B, 3.05 m was recovered. The unit is composed of massive, light gray dolomite marble and meta claystone in Hole U1502A and dolomitic limestone intercalated with clast-rich clay and sandstone in Hole U1502B (Figures F21, F22).
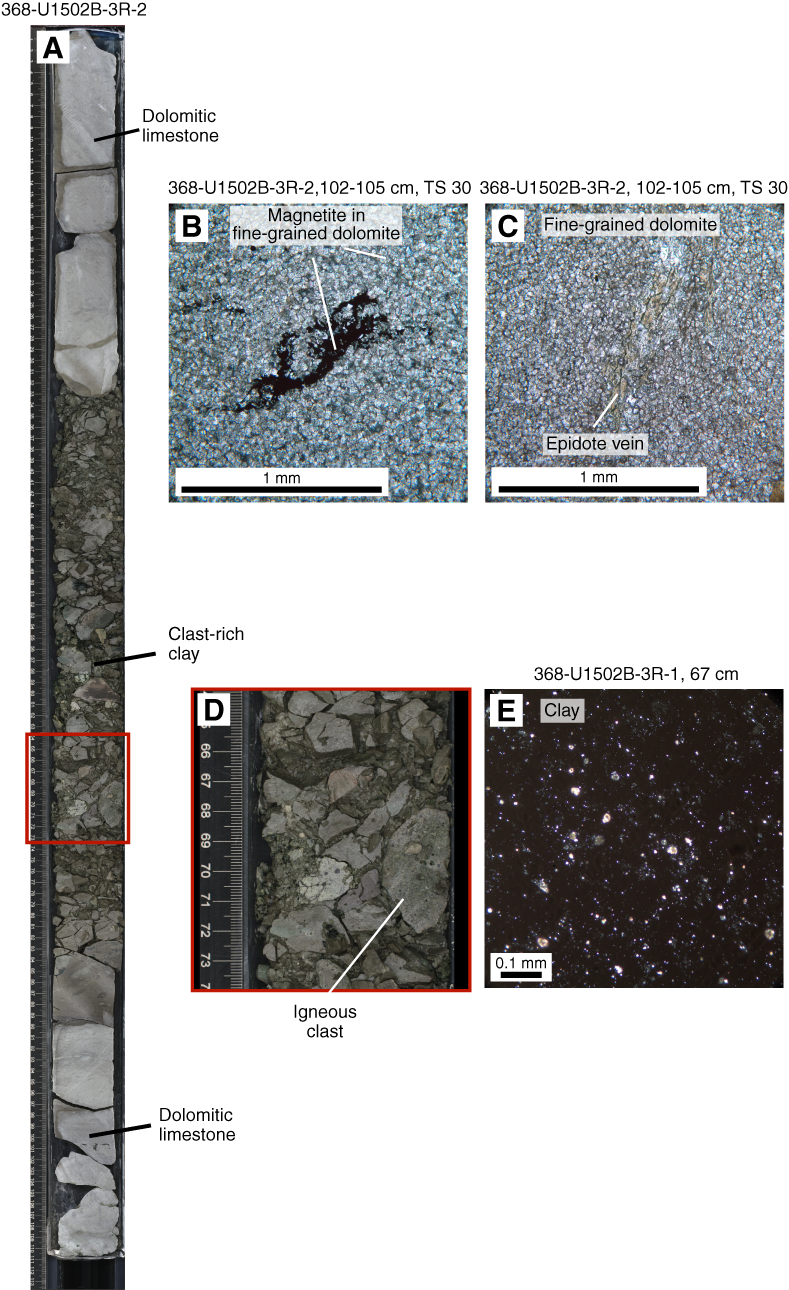
Figure F21. Dominant lithology, Unit V.

Figure F22. Unit V/Subunit VIA contact.
The dolomite marble in Hole U1502A is very fine grained, equigranular with an annealing texture, and crossed by fine dark gray bands. The marble is dominated by dolomite (~95%), with minor amounts of magnetite (~3%) and calcite (~2%) (Figure F22). The calcite occurs in enclaves, whereas magnetite forms dark gray bands or occurs as singular grains within the dolomite marble and limestone. The presence of magnetite explains the high magnetic susceptibility of this unit.
The gray, fine-grained dolomitic limestone in Hole U1502B is intercalated with a well-consolidated, very dark greenish gray clay with 10%–15% igneous clasts (Figure F21). The clay is composed of clay minerals, calcite, feldspar, quartz, and pyrite in decreasing order of abundance. Abundant benthic agglutinated foraminifer tests occur in Section 3R-1 (see Biostratigraphy). Gray, coarse-grained dolomitic sandstone occurs at the base of Unit V and is lithified and well sorted.
The boundary between Units V and VI is characterized by a change in lithology from (meta)sedimentary dolomite marble, dolomitic limestone, clay, and sandstone to igneous Unit VI (Figure F22).
Unit VI
- Intervals: 368-U1502A-41R-1, 31 cm, to 41R-CC, 18 cm; 368-U1502B-4R-1, 46 cm, to 37R-4, 141 cm
- Depths: Hole U1502A = 749.01−750.67 m; Hole U1502B = 739.16–920.95 m
- Age: Unknown (at least pre-late Oligocene, possibly Eocene)
Unit VI consists of highly to locally moderately altered basalt. The unit is divided into two subunits, VIA and VIB. The upper part of Hole U1502A (interval 41R-1, 30–62 cm) is greenish gray, highly altered, and heavily fractured, possibly due to drilling disturbance (Figure F23). Interval 41R-1, 62–90 cm, is light greenish gray, lithified, brecciated, fine-grained rock with phenocrysts of plagioclase. From Section 41R-1, 90 cm, downhole, the rock is still heavily but less altered. The rock is light gray and coarser grained with subrounded amygdules as large as 0.5 cm in diameter. Reddish iron oxides are common and occur as single crystals and along fractures, together with rare sulfides. Fragments show yellowish concentric alteration horizons. All basalt in Hole U1502A is within Subunit VIA.
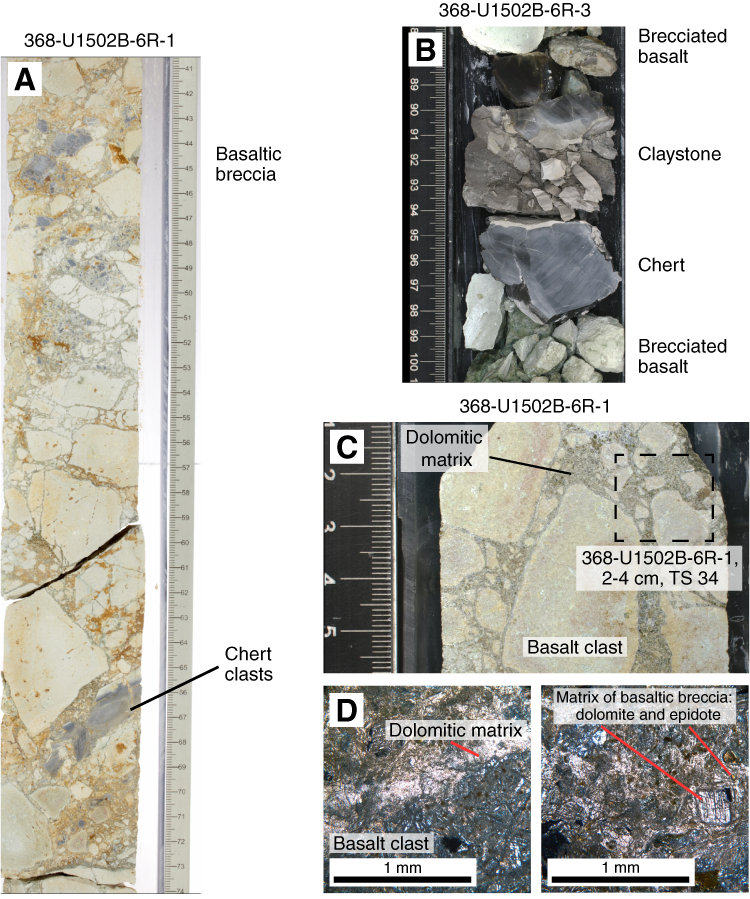
Figure F23. Basaltic breccia, brecciated basalt, and sedimentary rocks.
Unit VI was recovered in Hole U1502B from Section 4R-1, 46 cm, downhole to 920.95 m. Unit VI is divided into two subunits, VIA (Section 4R-1, 46 cm, to 12R-1, 105 cm) and VIB (Section 12R-1, 105 cm, to 37R-4, 141 cm). The basalt is heavily altered and fractured, and veins with quartz, carbonates, epidote, and sulfides are common. Highly fractured, matrix-supported intervals and intervals with a mixture of basaltic and sediment clasts are described as basaltic breccia (Figure F23). Intervals that are fractured but clast supported are described as brecciated basalt. Fractured basalt without any matrix between the basaltic fragments is described as basalt (with optional prefixes for phyric basalts).
Subunit VIA is composed of highly altered basaltic breccia and brecciated basalt with infrequent sheet basalt, chert, and claystone and very minor pillow basalt. The basaltic breccia in Sections 4R-1 through 6R-2 is a mixture of light gray and greenish gray claystone and basaltic clasts in an altered matrix (e.g., Section 6R-1; Figure F23). Chert and claystone layers and clasts were recovered between the brecciated basalt and basaltic breccia in Sections 6R-3 through 7R-2. No sedimentary clasts were recovered from Section 7R-2 downhole. From Core 11R downhole, pillow lavas were recovered in between the sheet lava flows and the basalt is locally less altered (moderately highly altered) and less brecciated.
The boundary between Subunits VIA and VIB is placed at the base of a fine-grained interval (12R-1, 105 cm), which might be a tectonic or hydrothermal breccia (see Structural geology). This interval also marks the boundary between the basaltic breccia and brecciated basalt of Subunit VIA and the more coherent sheet and pillow flows in Subunit VIB. Veins are more localized and larger in Subunit VIB, crosscutting the complete length of core sections (e.g., Sections 13R-3 and 14R-1).
The lithology of Unit VI basalt is described in more detail in Igneous and metamorphic petrology, and its structures are described in more detail in Structural geology.
Discussion
Depositional environment of Unit V
Unit V is composed of dolomite marble and limestone intercalated with clast-rich clay. Although the sediment is overprinted by secondary high-temperature processes (likely hydrothermal fluid sediment interaction or possibly contact metamorphism), it still retains primary sedimentary bedding and bioturbation features. The clay lithology and presence of deep-water benthic agglutinated foraminifers (see Biostratigraphy) indicate the unit was deposited in a deep abyssal environment.
Depositional environment of Unit IV
Unit IV is composed of dark greenish gray biosiliceous clay (Figure F20), and calcareous nannofossils are rare. The lower part of the unit (Section 368-U1502A-40R-6) is barren of diatoms, but their abundance increases with time, and diatoms are abundant at the top of the unit (Section 40R-1). Sponge spicules occur throughout the unit. The lower part of Unit IV is slightly deformed and interpreted as being postdepositional (see Structural geology).
Comparing the dominantly calcareous microfossil assemblage in the early to late Miocene Unit I with the dominantly biosiliceous microfossil assemblage in Unit IV may either indicate deposition of Unit IV in deeper water or the existence of a shallower CCD during its time of deposition (see Biostratigraphy).
Depositional environment of Unit I
Lithostratigraphic Unit I (late Miocene–late Oligocene) at Site U1502 was deposited in a deep-marine environment. The dominant lithologies in Unit I are clay and silty clay with nannofossils and nannofossil-rich clay, which are interbedded with centimeter-scale silt layers and rarely foraminifer-rich siltstone. There are variable amounts of foraminifers in all lithologies.
Some thin silty beds and thick silty laminae in Unit I (Sections 368-U1502A-9R through 33R; ~440–680 m) have upward fining and erosive bottom contacts that are interpreted as fine-grained (mostly Bouma sequence) turbidite deposits. Similar beds were observed at Site U1499.
Subunit IC comprises an approximately 3 m thick foraminifer-rich siltstone interbedded with foraminiferal sand. The subunit has parallel lamination and convolute bedding, which we interpret as evidence of downslope slumping of slightly to moderately consolidated sediments on the continental slope.
Site U1502 is located at the boundary between the lower continental slope and the deep-sea basin, and a similar depositional environment probably existed during the deposition of Unit I. This environment is very prone to redeposition of sediment by sediment-gravity processes, including slides, slumps, debris flow, and turbidity currents. Sea level change and tectonic uplift are two important mechanisms that may trigger sediment gravity flows.
According to the preliminary age model of Site U1502 (see Biostratigraphy), the variation in sedimentation rate correlates well with the lithologic change from Subunit IE to Subunit IA. Between the early Oligocene and middle Miocene (~30–15 Ma), the sedimentation rate was very low (~1 cm/ky). Sediment from this interval has a low siderite abundance and a monotonous reddish-brown color, likely indicating an oxidizing environment (Subunits ID and IE; 670–740 m). The sedimentation rate increases to ~3.9 cm/ky between the middle and late Miocene (~15–6 Ma), consistent with the many thin turbidite beds (Subunits IA–ID; 440–670 m). Here, the sediment is also siderite rich.
Unit I has likely been affected by diagenetic processes. For example, the decrease in the abundance of nannofossils within Subunit ID correlates with an increase in the abundance of single calcite crystals in the sediment. This correlation may indicate that the nannofossils have been dissolved and redeposited as crystalline calcite during diagenesis. Alternately, the decrease may simply indicate a decrease in the overall nannofossil abundance.
A striking feature of Unit I is the alternation of brownish gray to greenish gray intervals along the core. This alternation is most pronounced in Subunits IA–ID (e.g., Cores 368-U1502A-9R through 31R; Figure F14), where the alternations occur as thick, approximately bedding-parallel bands, typically 10–50 cm long, with some crosscutting relations between the color change and the bedding. The number of greenish gray intervals decreases downhole, and Cores 34R through 39R are dominantly brownish in color. In these lower sections, greenish gray intervals usually crosscut the bedding (Figures F16, F17).
The color change from brownish gray to greenish gray sediment within Subunit IE and the lower part of Subunit ID (Cores 34R through 39R) is evidently related to secondary processes because it occurs along faults, fractures, and silty beds and in burrows (Figure F16). Halos of greenish sediment around these features do not extend more than a few centimeters, and the color change is most likely the result of interaction of the oxidized sediment with reducing fluids. Boundaries between the color bands from Subunit IA through the upper part of Subunit ID (Cores 9R through 31R) crosscut biogenic features such as burrows and are sometimes discordant to bedding. However, the boundaries are most often approximately parallel to the bedding. An association of greenish gray sediment with thin silt beds was interpreted as turbidites. Therefore, the cause of the color change in the upper part of the core may be related to (secondary) diagenetic fluids, differences in the input of detrital matter associated with turbidites (e.g., Wilson et al., 1986), changes in bottom water conditions (e.g., Dean et al., 1989), or allocyclic change such as climate (e.g., Gardner et al., 1982).
Interpretation of Units II–VI
The interpretation of Units II and VI is given in Igneous and metamorphic petrology, and the interpretation of Unit III is given in Structural geology.
Igneous and metamorphic petrology
At Site U1502, we recovered two igneous lithologic units (Figures F10, F11). Three small, altered basalt fragments were recovered in interval 368-U1502B-2R-1, 26–34 cm (727.96–728.04 m), and they represent igneous Unit 1, which corresponds to lithostratigraphic Unit II (see Lithostratigraphy). Hole U1502A terminated in highly altered basalt that comprises the upper part of igneous lithologic Unit 2 (corresponding to lithostratigraphic Unit VI; see Lithostratigraphy). This unit was drilled from 749.0 to 750.7 m with a total recovered core length of 1.7 m. A more complete section of igneous lithologic Unit 2 was drilled in Hole U1502B below 739.16 m. This sequence of strongly (hydrothermally) altered aphyric to highly plagioclase phyric basalts has a total drilled thickness of 181.79 m. These basalts are divided into two igneous lithologic subunits, 2a and 2b, based on flow morphology and alteration style (Figure F24). Subunit 2a contains an upper sequence of brecciated and fractured massive lava flows (739.16–801.95 m), and Subunit 2b contains a lower sequence of interbedded pillows with lobate and sheet lava flows (801.95–920.95 m).
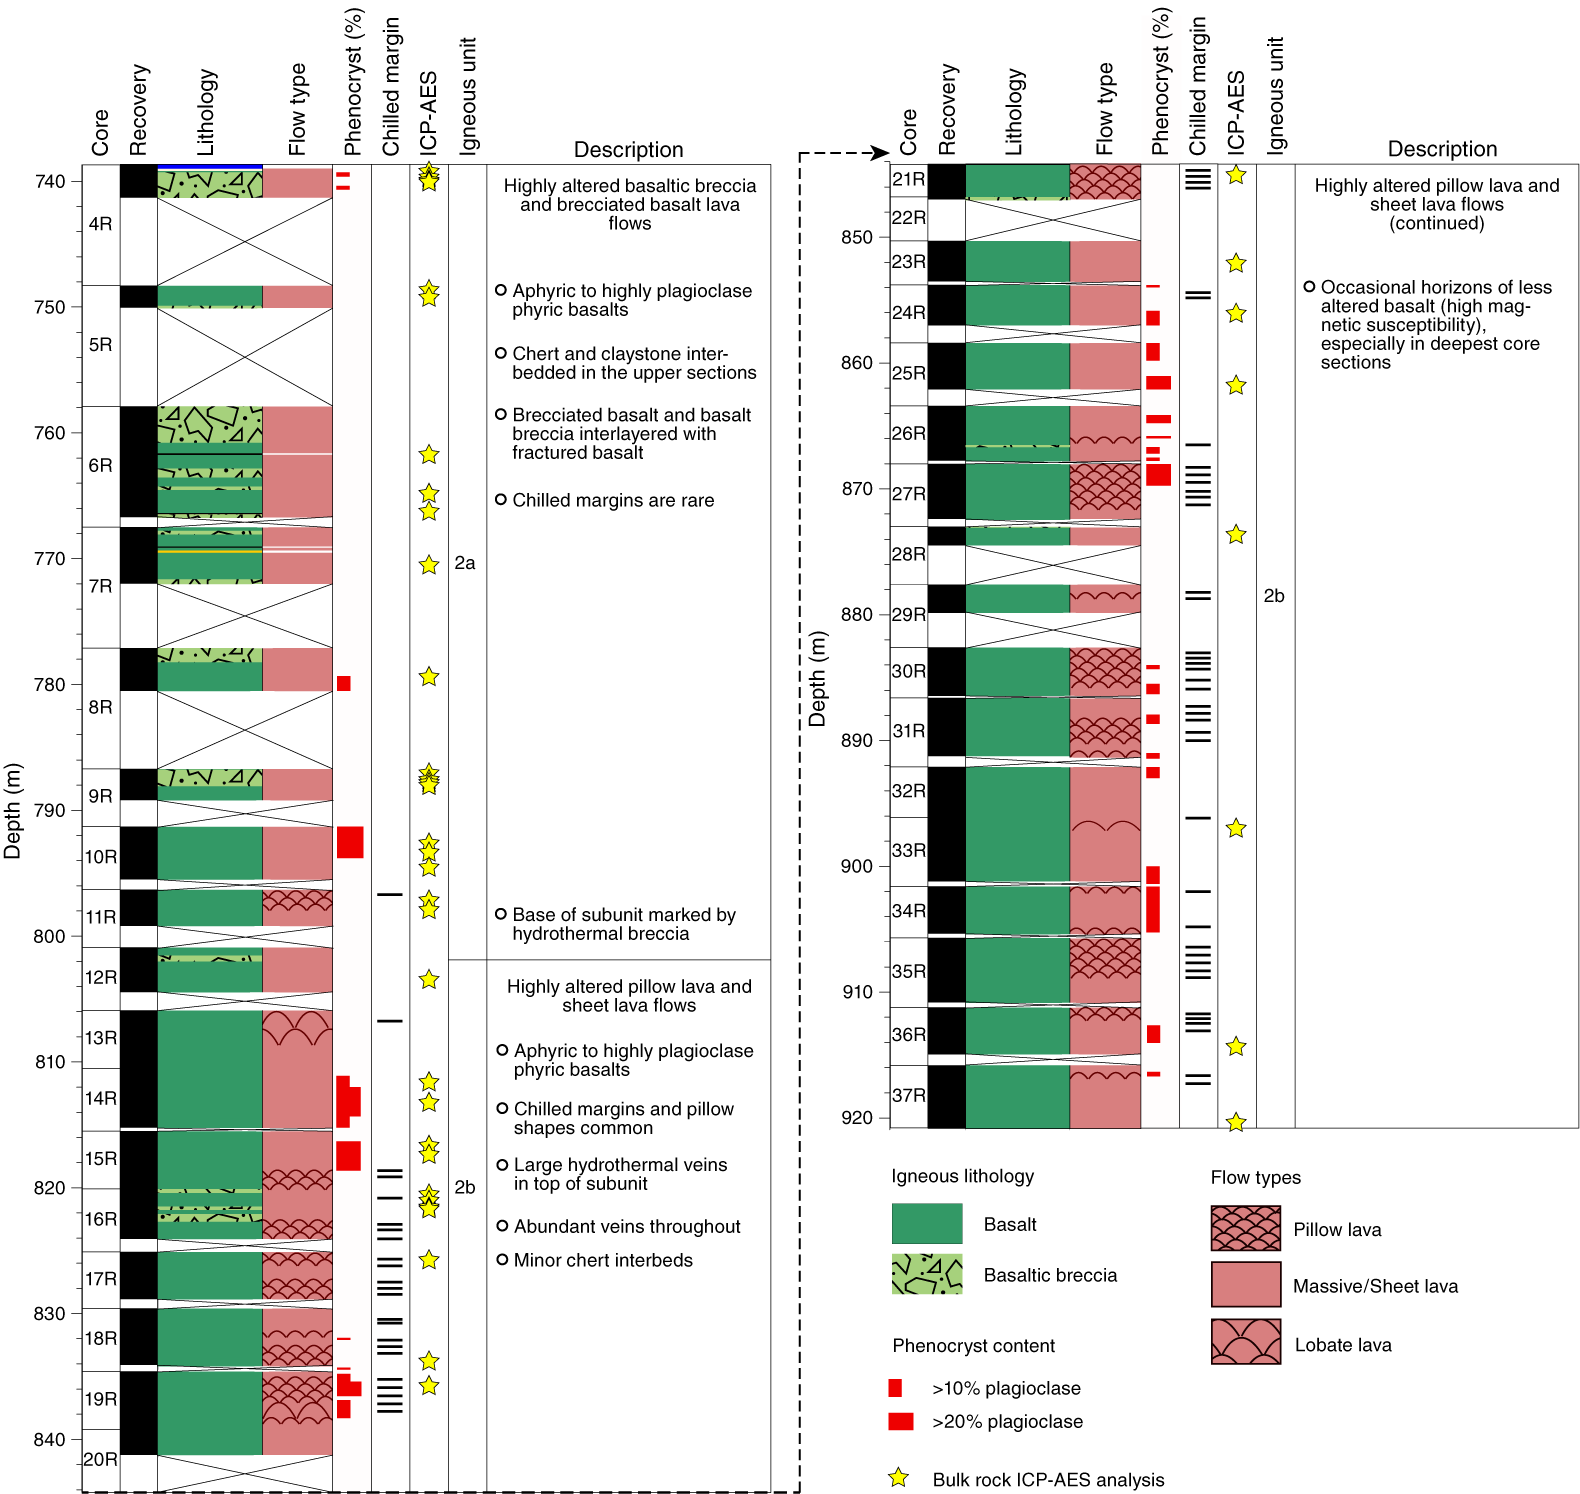
Figure F24. Lithostratigraphic summary, igneous lithologic Unit 2.
The igneous lithologic units were described macroscopically and microscopically from thin sections (see Igneous and metamorphic petrology in the Expedition 367/368 methods chapter [Sun et al., 2018a]). Chemical analyses were carried out by inductively coupled plasma–atomic emission spectroscopy (ICP-AES) and the handheld pXRF to check for any major compositional changes, both primary and from the alteration process. Alteration assemblages were recognized through a combination of hand specimen examination, thin section examination, and XRF and XRD data.
Igneous lithologic Unit 1 (lithostratigraphic Unit II)
- Interval: 368-U1502B-2R-1, 26–34 cm
- Depth: 727.96–728.04 m
- Thickness: 0.08 m
- Lithology: altered basalt
- Age: early Miocene–late Oligocene or older
The greenish gray basalt of igneous lithologic Unit 1 is altered, and an assemblage of alteration minerals has replaced most of the primary mineral phases (Figure F18B). The aphanitic, fine-grained basalt is nonvesicular to moderately vesicular and contains rare (as large as 6 mm) plagioclase phenocrysts. Alteration of the unit is intense, with less than 50% of the primary crystals remaining, which makes it difficult to determine the primary phases that were originally present. Thin section observations indicate a primary mineralogy of plagioclase with a potential assemblage of pyroxene and Fe-Ti oxides ± mesostasis. The texture is equigranular, and plagioclase laths as large as 1 mm make up approximately 40% of the unit. The groundmass is intersertal with possible altered pyroxene, olivine, and altered glass between a felt of tightly woven, quench-textured plagioclase crystals (Figure F18B). The groundmass is replaced by green clay minerals, clinozoisite, zeolites, and Fe (hydr)oxides. Zeolites radially fill pore space, which may represent original vesicularity.
The contacts with lithostratigraphic Units I and III were not recovered due to low overall recovery in this core (2R; Figure F18A).
Igneous lithologic Unit 2 (lithostratigraphic Unit VI)
- Intervals: 368-U1502A-41R-1, 31 cm, to 41R-CC, 18 cm; 368-U1502B-4R-1, 46 cm, to 37R-4, 141 cm
- Depths: Hole U1502A = 749.01–750.67 m; Hole U1502B = 739.16–920.95 m
- Thickness: Hole U1502A = 1.71 m; Hole U1502B = 181.79 m
- Lithology: highly altered, aphyric to highly plagioclase phyric pillow and sheet basalt, brecciated basalt, and basaltic breccia
- Recovery: 75%
- Age: late Oligocene–late Eocene or older
Igneous lithologic Unit 2 (lithostratigraphic Unit VI) encompasses a sequence of basaltic breccia, brecciated basalt, pillow basalt, and sheet-flow basalts that range from aphyric to highly plagioclase phyric volcanics and minor chert (Figure F25). The entire section of igneous rock recovered in Hole U1502B has undergone some degree of hydrothermal alteration within the temperature range representative for zeolite to greenschist facies conditions (200°–500°C). This alteration varies from complete replacement of the rock, where the original composition and texture are difficult to determine, to replacement of mineral phases with little change to the texture. Glassy pillow rinds are completely replaced, and multiple phases of veining and halos are ubiquitous throughout the rocks.

Figure F25. Varying lithologies, Hole U1502B.
Igneous lithologic Unit 2 is divided into two subunits based on morphological character and alteration style (Figure F24). Subunit 2a, in Cores 368-U1502B-4R through 12R, is dominantly basaltic breccia and brecciated basalt (e.g., interval 5R-CC, 19–29 cm) with strong carbonate alteration forming a matrix between the basalt clasts (Figures F25, F26). Subunit 2b is moderately to highly altered and less brecciated than Subunit 2a. It comprises pillow lavas alternating with sheet flows. The change between both subunits is gradual, but the boundary was placed at the base of interval 12R-1, 64–105 cm, which was interpreted as hydrothermal breccia and possibly represents a fault gouge (see Structural geology).
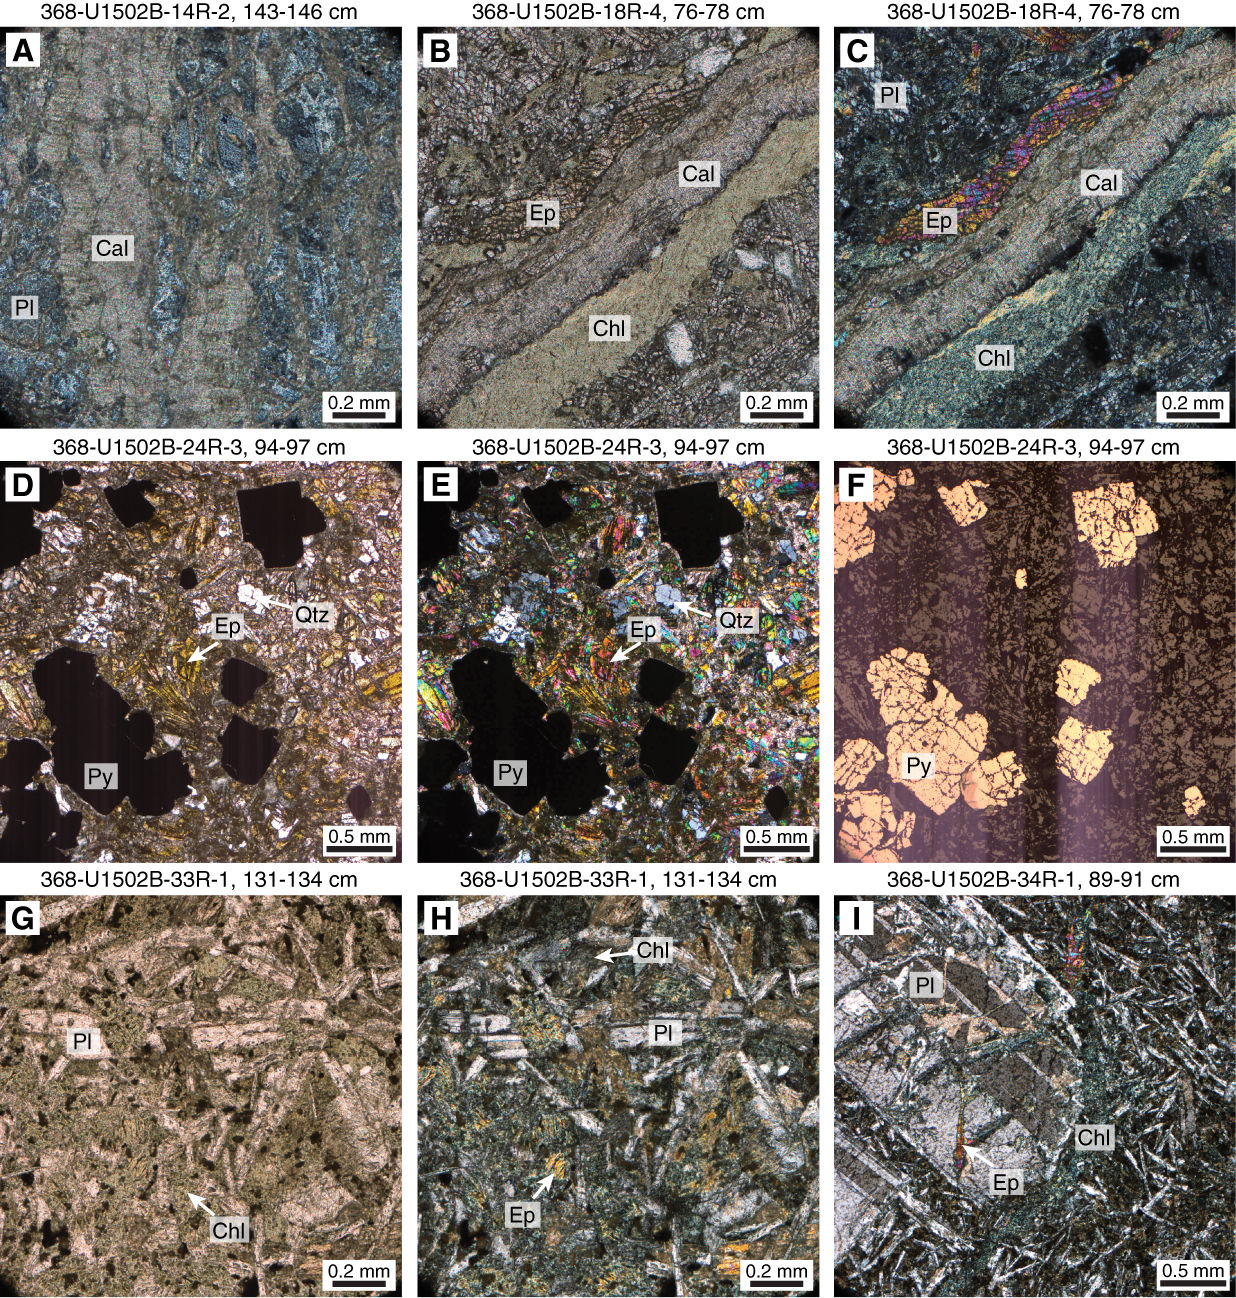
Figure F26. Representative minerals and textures, igneous Subunit 2b.
Igneous lithologic Subunit 2a (lithostratigraphic Subunit VIA)
- Intervals: 368-U1502A-41R-1, 31 cm, to 41R-CC, 18 cm; 368-U1502B-4R-1, 46 cm, to 12R-1, 105 cm
- Depths: Hole U1502A = 749.01–750.67 m; Hole U1502B = 739.16–801.95 m
- Lithology: highly altered, brecciated basalt, and basaltic breccia
- Age: late Oligocene–late Eocene or older
Igneous Subunit 2a is composed of pale green, yellowish, light gray, light greenish gray, and greenish gray highly altered basaltic breccia and brecciated basalt, with minor sheet basalt, chert, and claystone and very minor pillow basalt (Core 368-U1502B-11R) (Figure F25). The color change along the core in Hole U1502B is mostly subtle, from pale green or yellowish at the contact with lithostratigraphic Unit V (Figure F22) to light greenish gray to greenish gray without an apparent relationship to flow structure. The basaltic breccia in Sections 4R-1 through 6R-3 is a mixture of predominantly basaltic clasts and subordinate light gray and greenish gray claystone and chert in an altered matrix (e.g., Section 6R-1; Figure F23).
The basaltic breccia and brecciated basalt differ in the proportion of matrix and arrangement of clasts (Figure F25). The clasts are either sparsely to moderately porphyritic basalt with altered plagioclase phenocrysts (2%–15%) in an altered groundmass of plagioclase and alteration minerals or aphyric with a groundmass of plagioclase and alteration minerals. The groundmass comprises variably altered plagioclase partially replaced by a combination of albite, sericite, calcite or dolomite, clinozoisite, zeolite minerals, Fe hydroxides, and clay minerals, with a felty, intersertal, often tightly interwoven texture (Figure F27B). Plagioclase phenocrysts have a similar alteration assemblage. Potential former interstitial pyroxene may contain some relict fresh areas but is largely replaced by chlorite, zeolite minerals, epidote-group minerals, and clay minerals, with accessory pyrite. The basalt clasts vary from nonvesicular to having approximately 10% amygdules. The amygdules are dark to light green and filled with carbonate, epidote, zeolite minerals, and pyrite (Figure F28B). The matrix of the breccia and veins that cut the brecciated basalt are dominantly pale green-gray to yellowish and reddish brown and consist largely of carbonate (likely dolomite or siderite) crystals with lesser calcite, epidote, chlorite, Fe (hydr)oxides, quartz, zeolite minerals, and clay minerals (Figure F28).
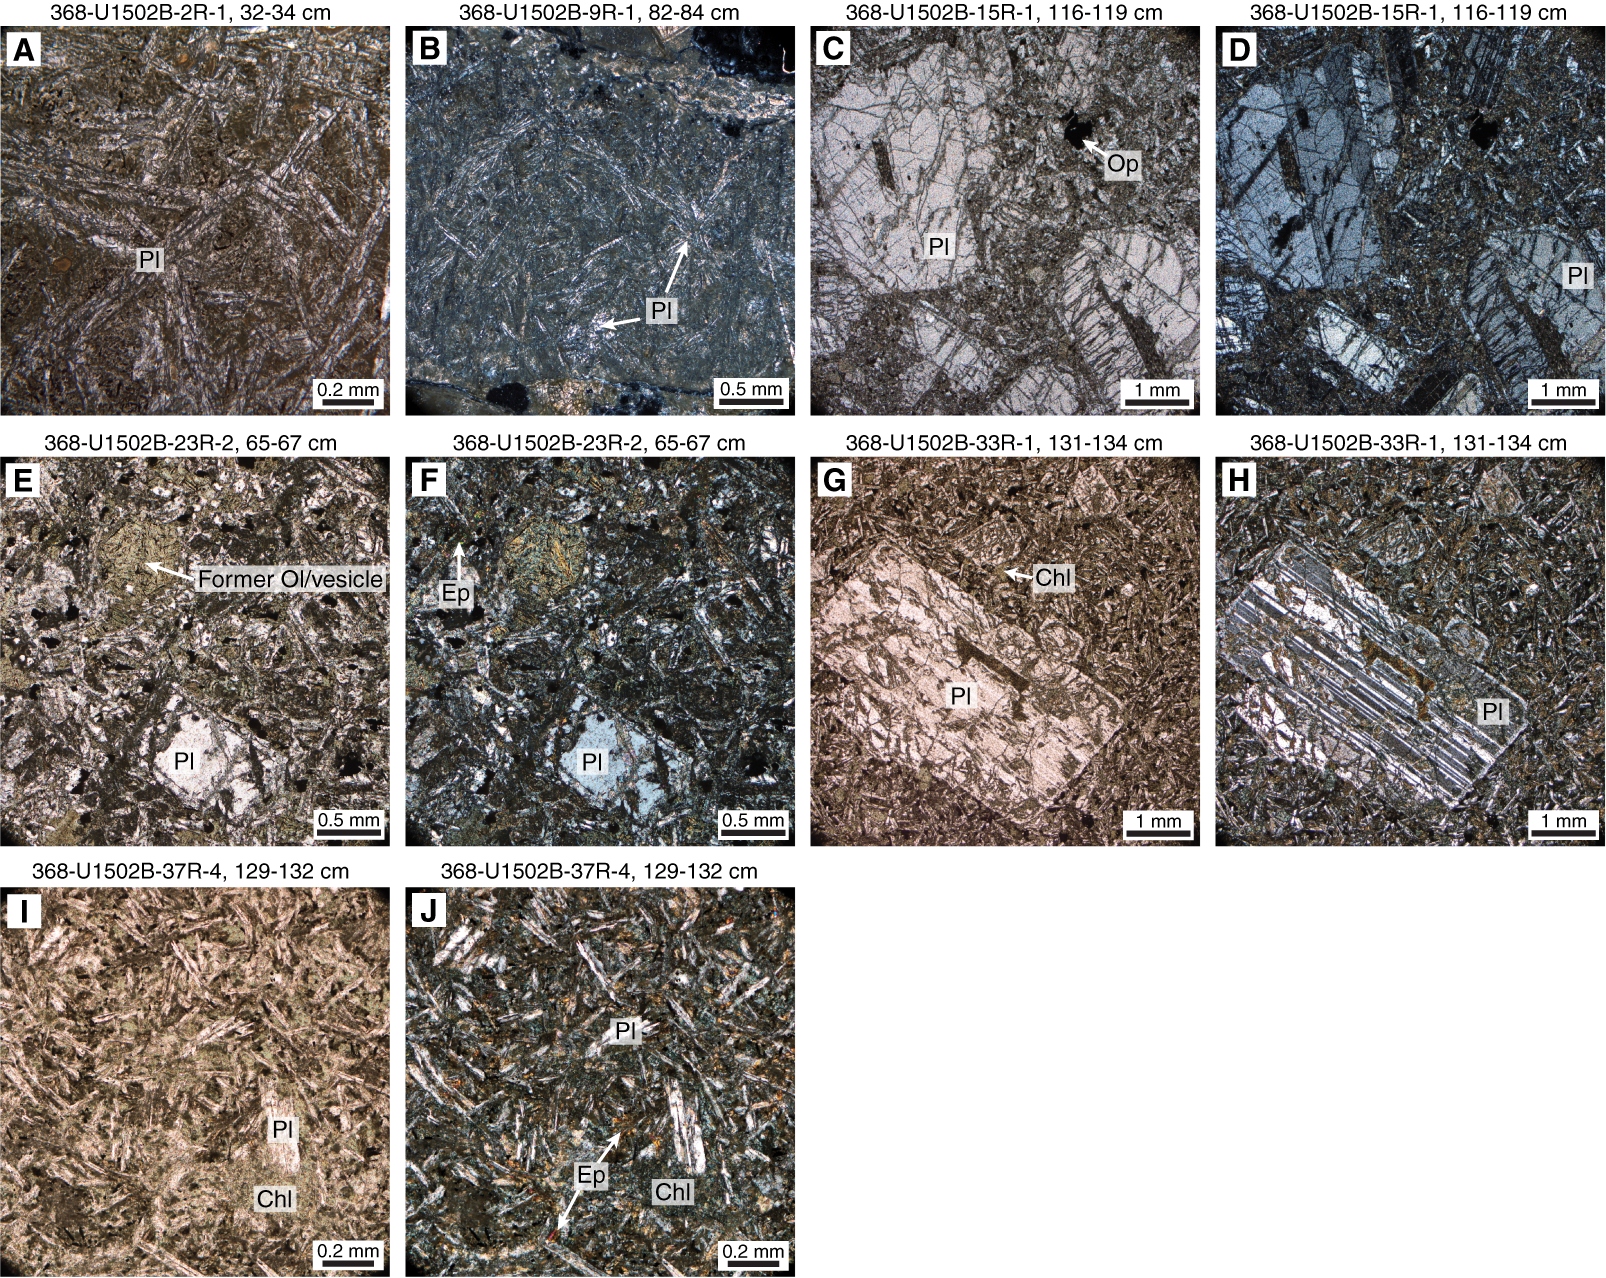
Figure F27. Representative minerals and textures, igneous lithologic Units 1 and 2.

Figure F28. Representative minerals and textures, igneous Subunit 2a.
Igneous lithologic Subunit 2b (lithostratigraphic Subunit VIB)
- Interval: 368-U1502B-12R-1, 105 cm, to 37R-4, 141 cm
- Depth: 801.95–920.95 m
- Lithology: highly to moderately altered pillow basalt, lobate basalt, and sheet basalt
- Age: late Oligocene–late Eocene or older
Igneous Subunit 2b is composed of (light) greenish gray and bluish gray, highly to moderately altered pillow basalt and sheet basalt, with minor lobate basalts and brecciated basalt (Figure F25). Pillow basalt is recognized by pillow rims and chilled margins in the cores (e.g., interval 19R-1, 117–128 cm; Figures F29, F30). Some pillows show pipe vesicles that are perpendicular to the pillow rim. No glass is preserved in the basalt. The altered pillow rims, which may originally have been glass, are dark greenish gray and completely altered to chlorite, calcite, epidote, zeolite minerals, Fe hydroxides, and clay minerals (Figure F29). Pillow rims are interpreted as having been glassy prior to alteration due to their extremely fine grain size, variolitic texture (variolites are millimeter sized), and different alteration style compared to the pillow cores. Some pillow rims are plagioclase phyric, with often better-preserved plagioclase than in the adjacent basalt. One thin section of a pillow rim has quench-texture plagioclase laths in an altered groundmass with relict perlitic cracking (Figure F29). Alteration minerals highlight the perlitic cracks. The perlitic cracking and quench textures also indicate that the pillow rims were glassy prior to alteration. Very thin (<1 mm) carbonate veins occur mostly parallel to the pillow margin within the altered glass (e.g., interval 17R-1, 33–43 cm).
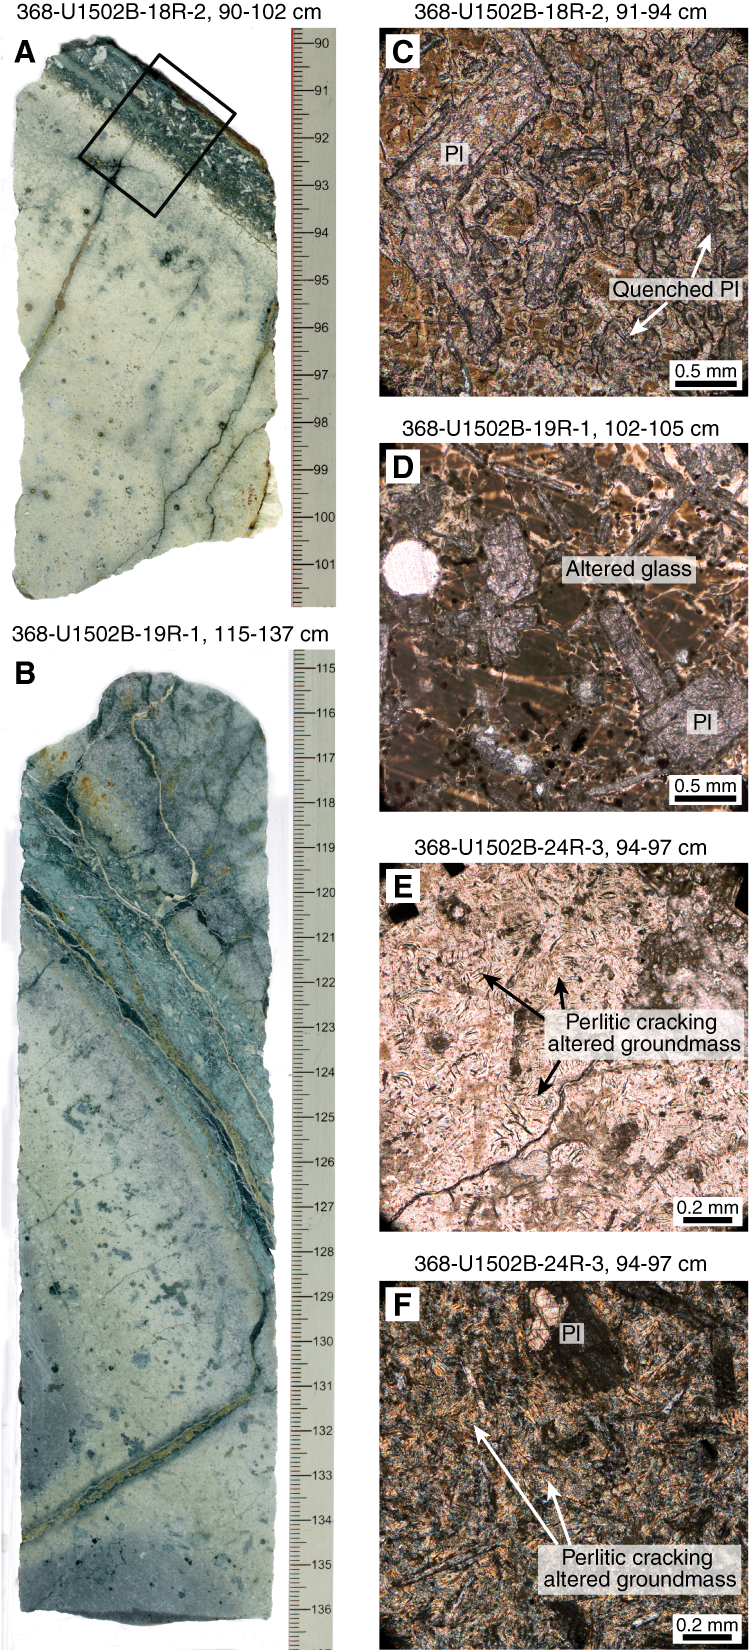
Figure F29. Pillow lavas.
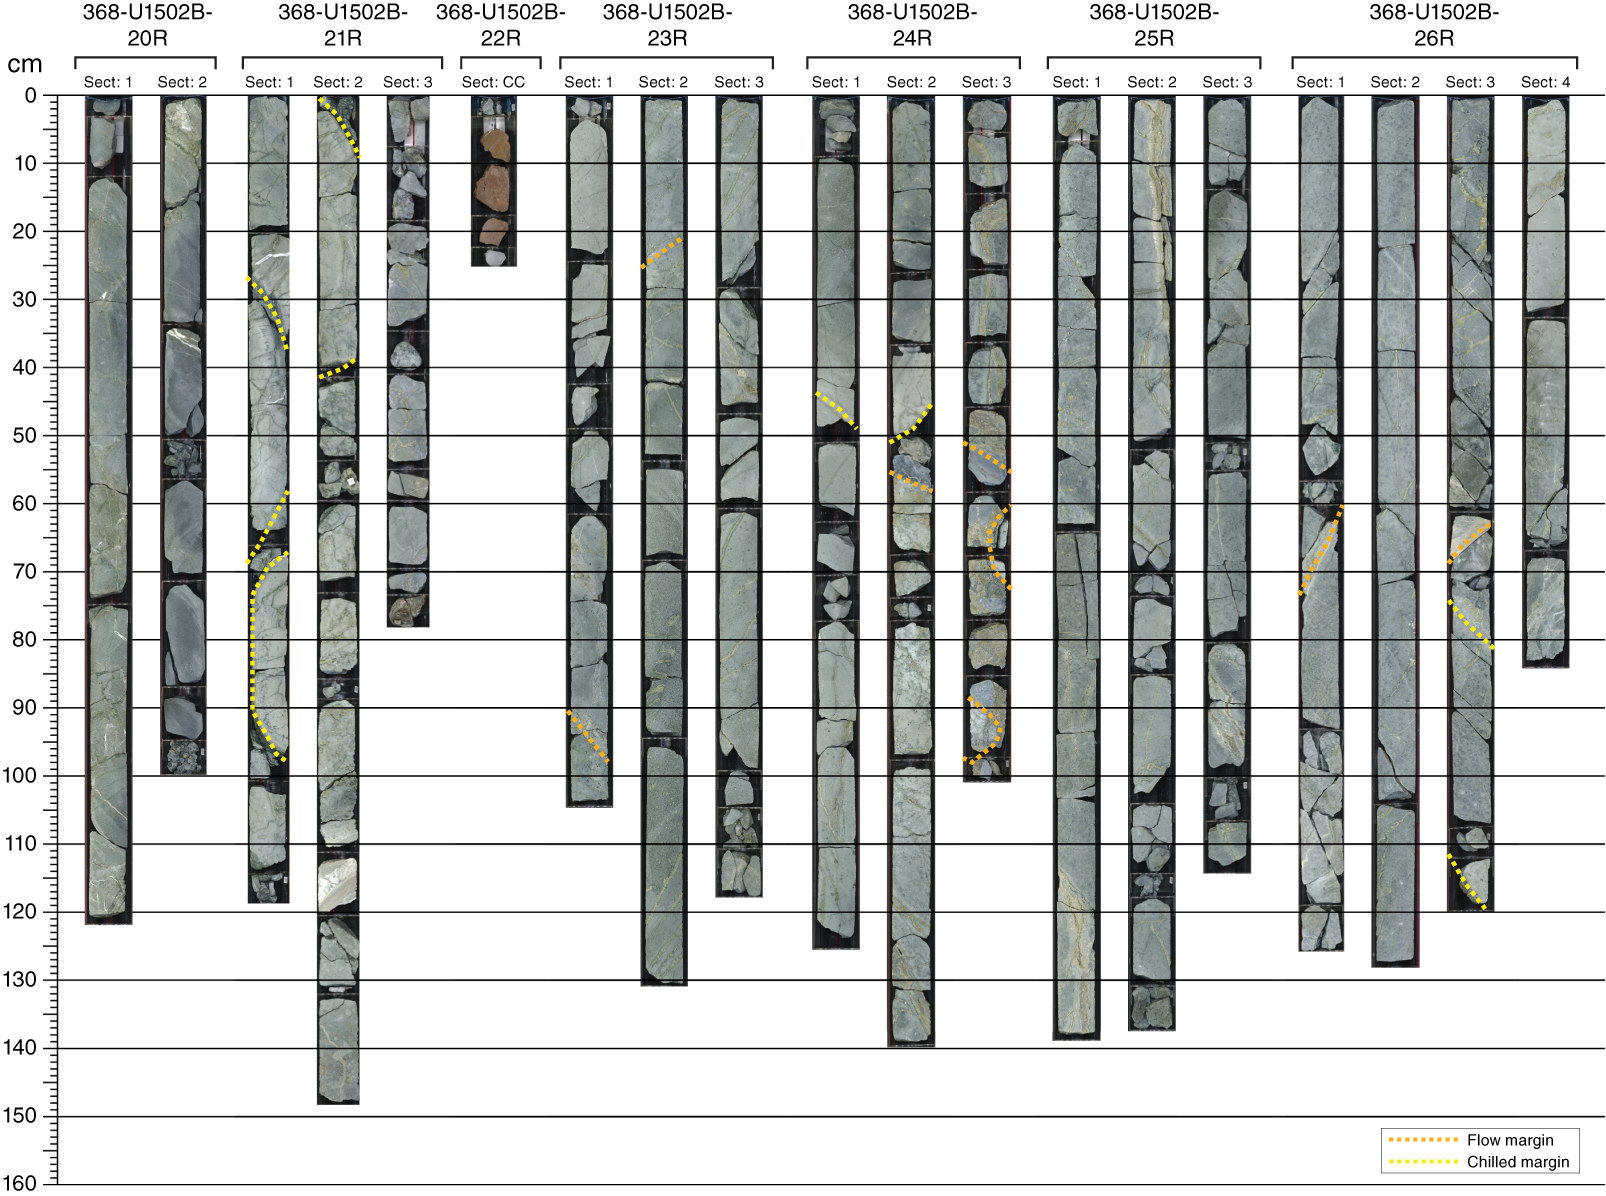
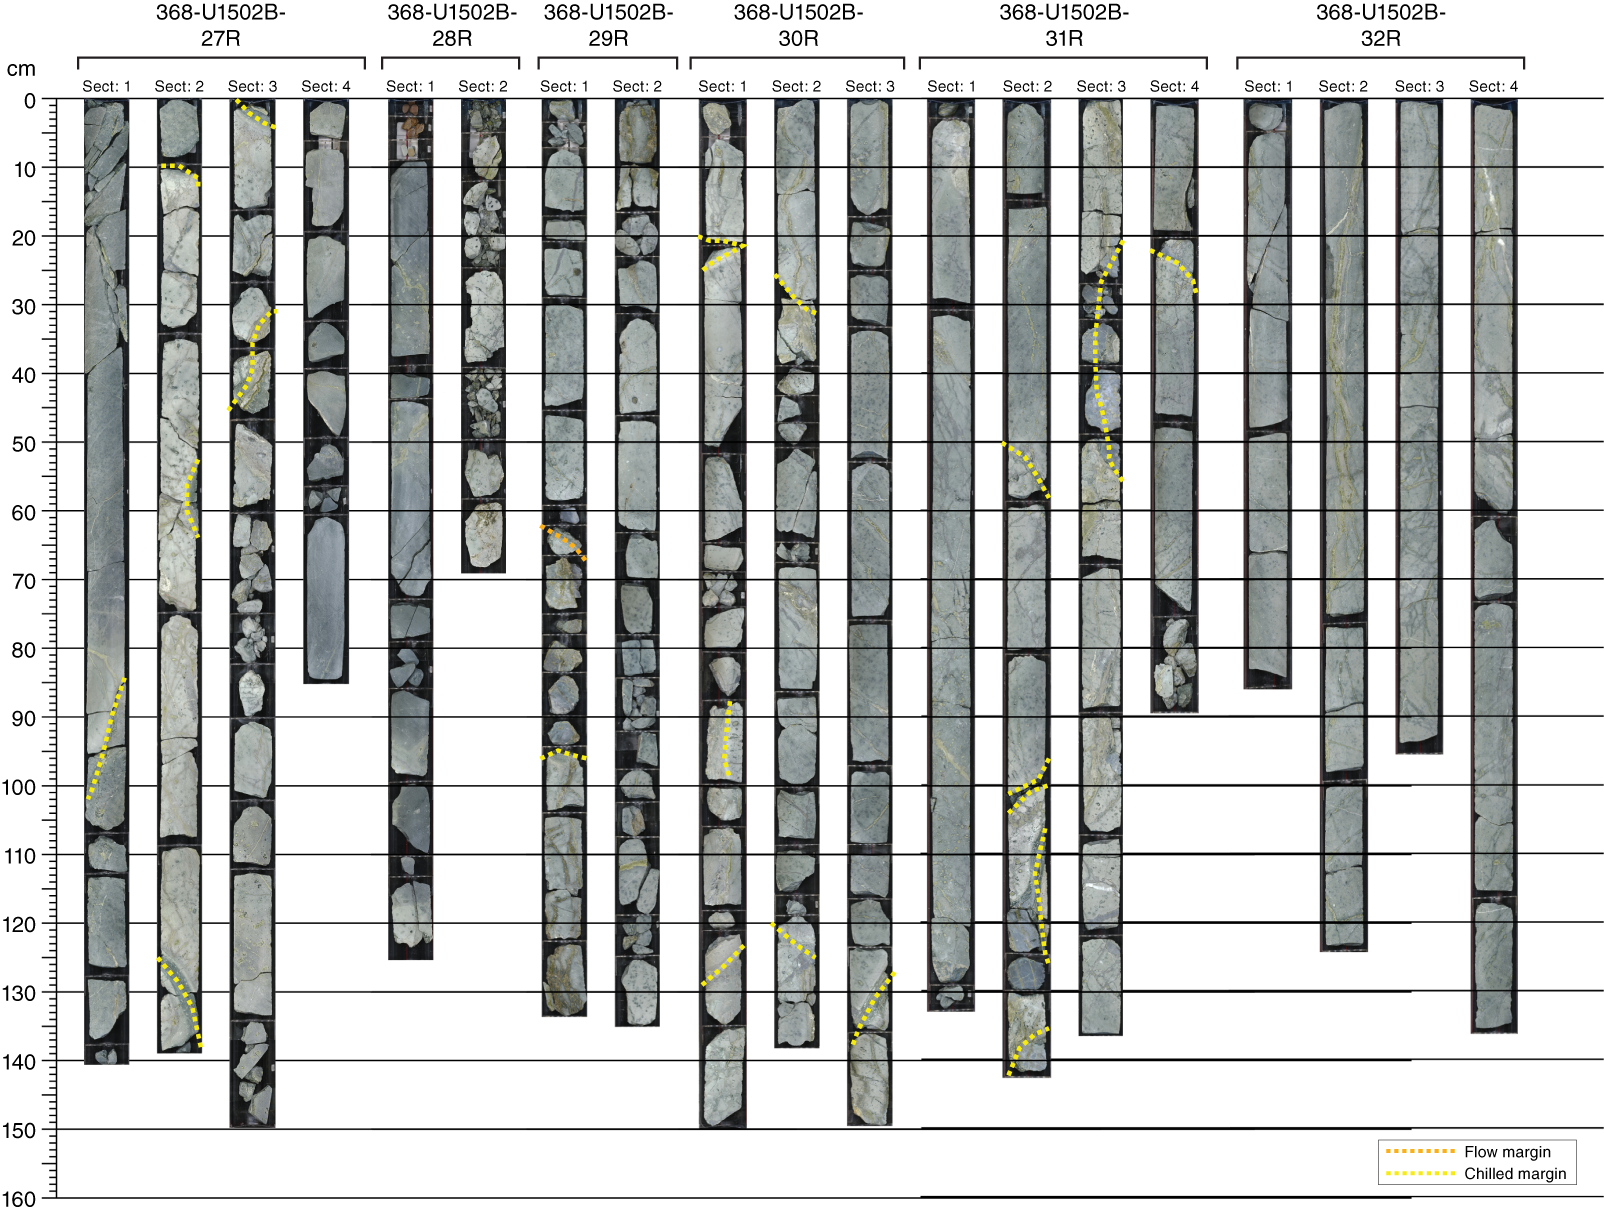
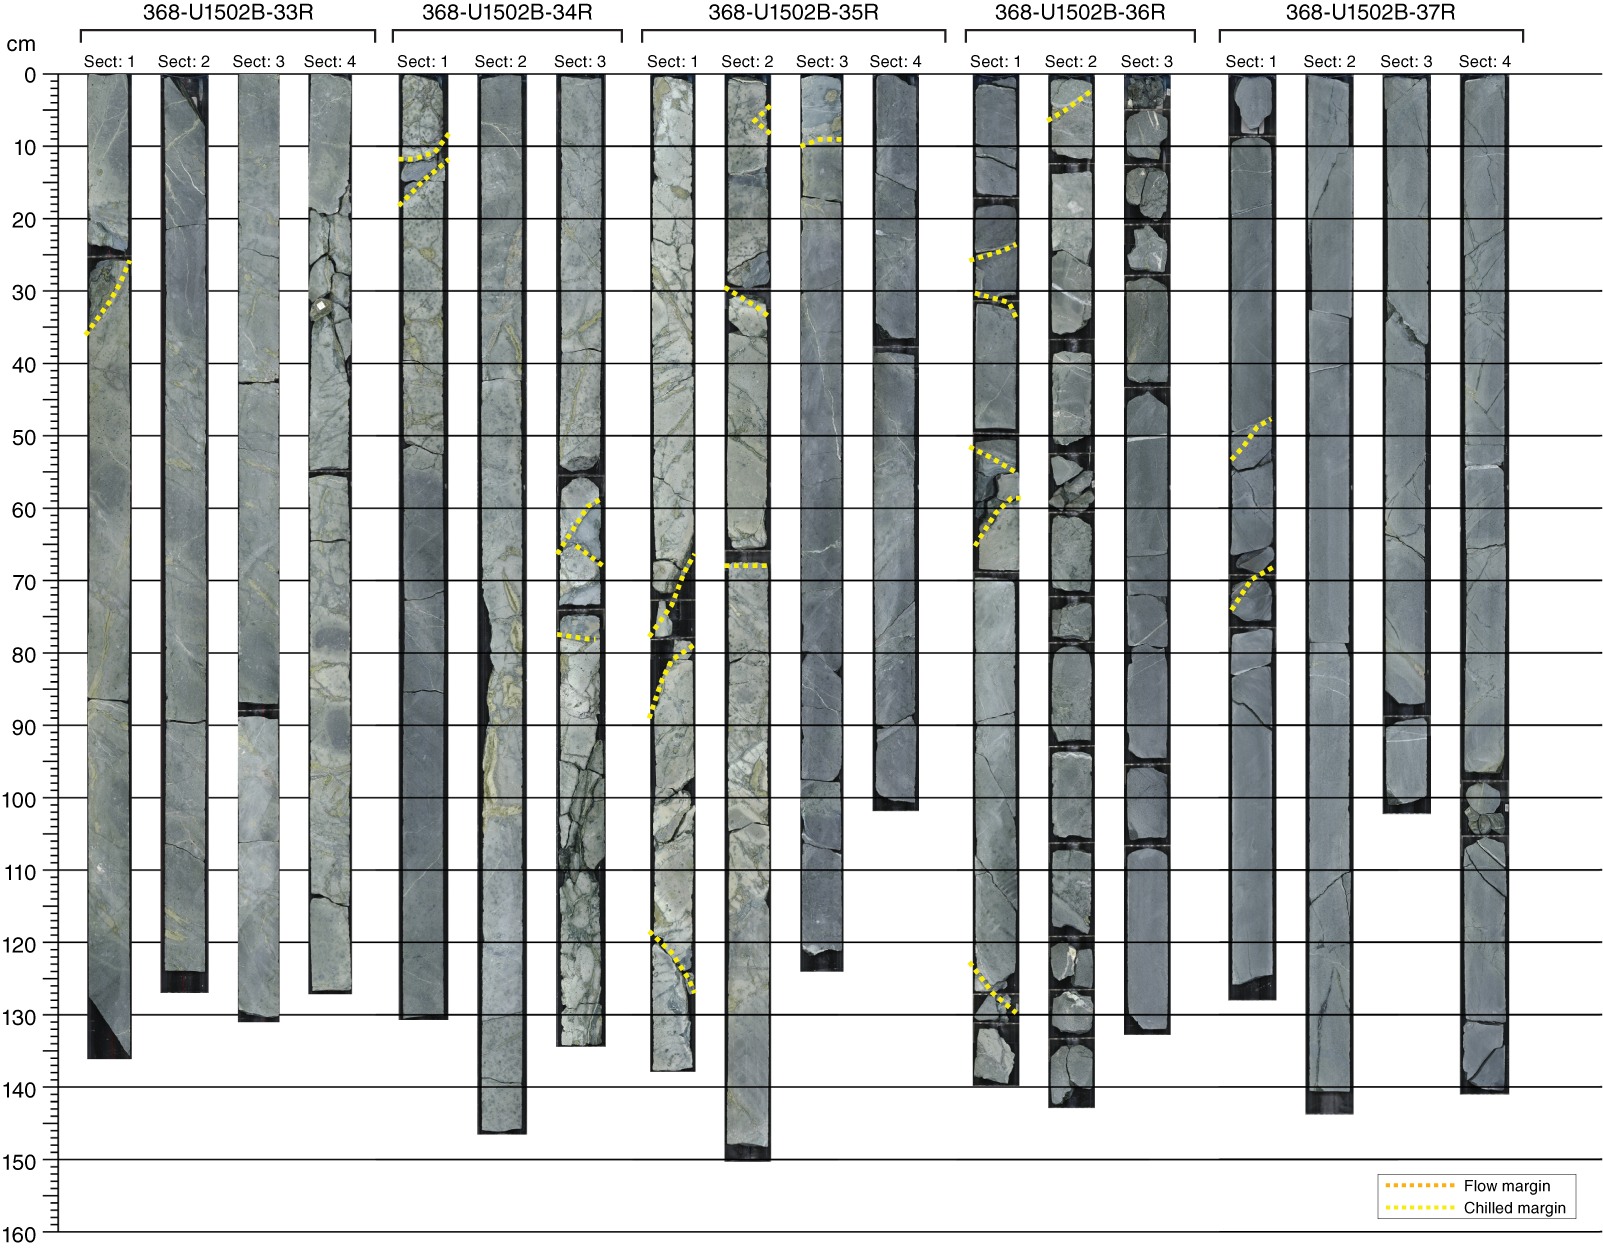
Figure F30. Basalt.
Sheet flows were recognized by the absence of pillow or intrusive margins. Rare flow boundaries are defined by chilled margins and areas of brecciation and drilling-induced fragmentation that may be brecciated flow tops. Depending on the degree of alteration, the basalt is greenish gray (high alteration) to bluish gray in some intervals and patches (e.g., interval 35R-3, 103–120 cm) that we interpret as less altered (consistent with thin section observations).
Subunit 2b basalt varies from sparsely to highly plagioclase phyric (e.g., interval 19R-3, 35–41 cm), partially reflecting glomeroporphyritic assemblages, with only minor intervals of equigranular and aphyric texture (Figure F25). The texture and petrography (Figure F27C–F27J) of Subunit 2b is similar to the clasts in the Subunit 2a breccia and brecciated basalt. Subunit 2b includes intervals with as much as 50% tabular to equant plagioclase phenocrysts (e.g., interval 15R-1, 104–111 cm; Figure F25D). Chlorite and sulfides are more abundant in thin sections of Subunit 2b, and several of the samples are also high in epidote (Figure F26G–F26I). Pseudomorphs, replaced by a brown mineral with first-order interference colors, probably a clay mineral such as saponite, may represent either olivine or filled vesicles (Figure F27E). Interstitial areas that may have been glass now show an amorphous gray, isotropic mineral and opaque minerals (Figure F27I, F27J). Carbonate and zeolite minerals occur in the groundmass, but they are not as abundant as in Subunit 2a. Veins are filled with dark and apple green minerals (chlorite and epidote), carbonates (dolomite, calcite, and siderite), zeolite minerals, pyrite, quartz, and secondary feldspar (Figures F28, F31).
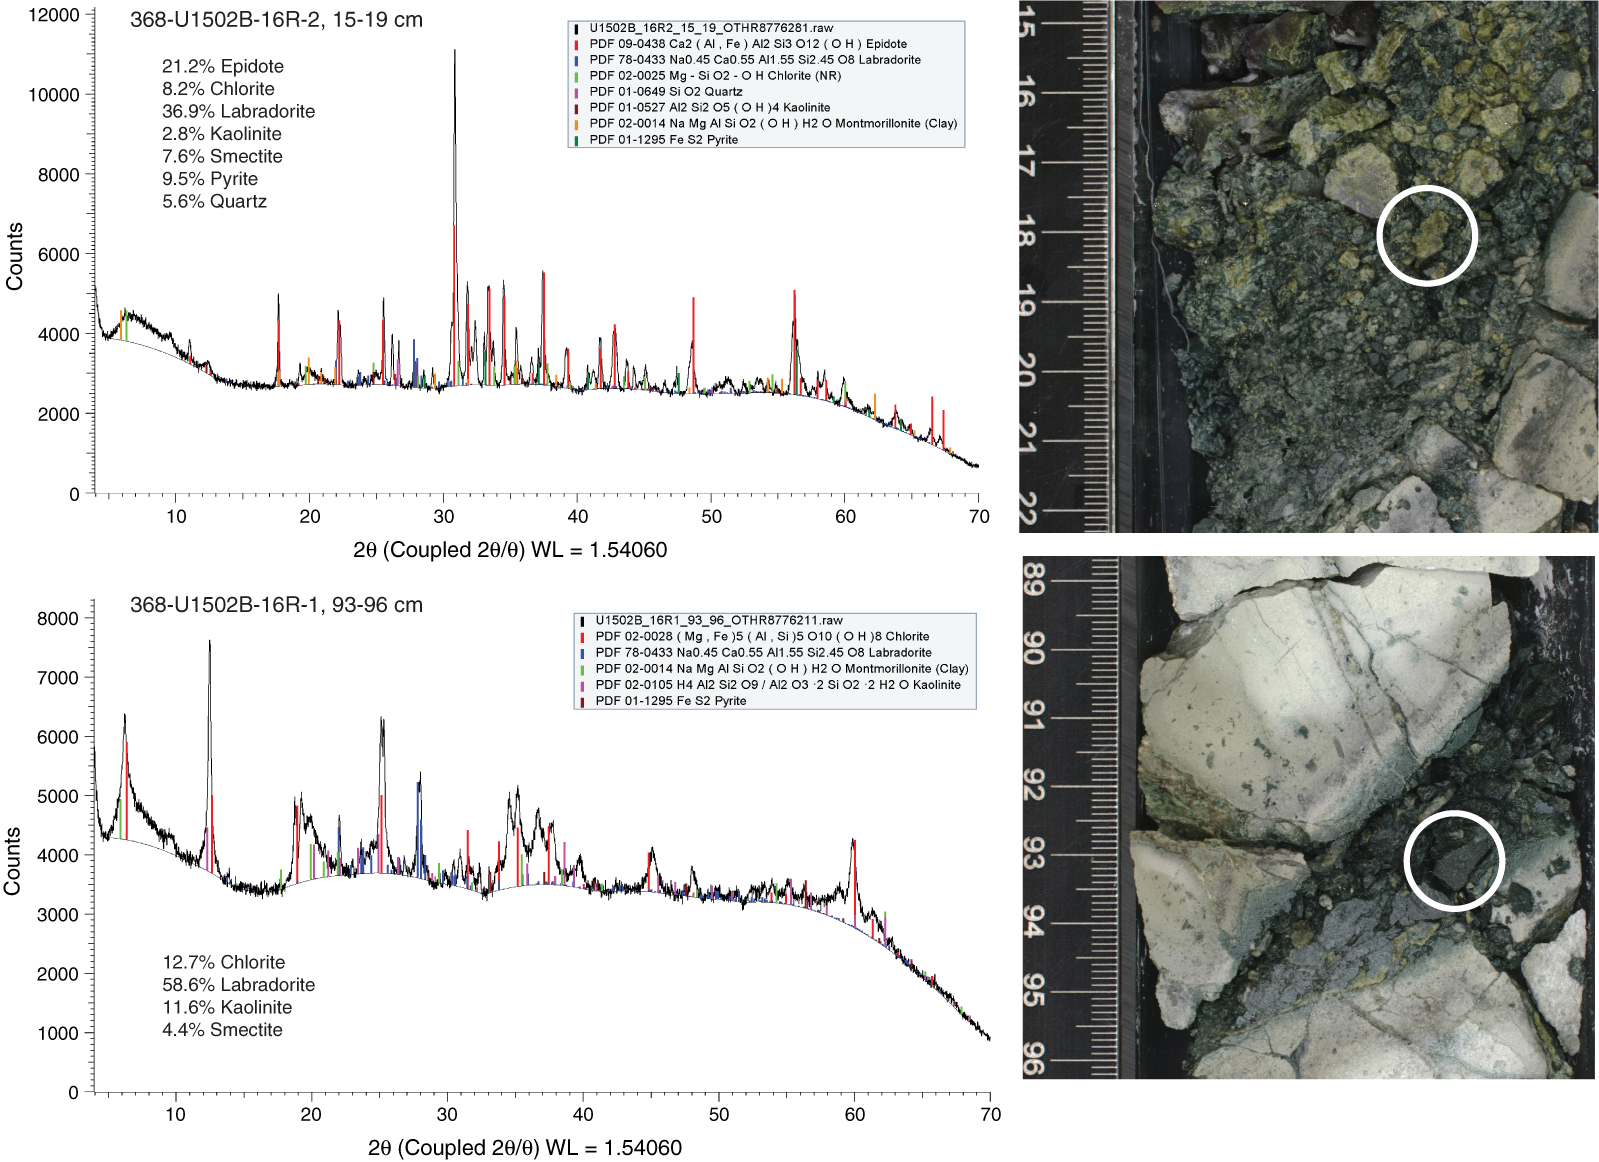
Figure F31. XRD data.
The coarse-grained basalt flow in Sections 37R-2 and 37R-3 contains several thin (0.5–1.5 cm wide), fine-grained gray basaltic veins with irregular margins (intervals 37R-2, 134–137 cm; 37R-3, 0–2 cm; and 37R-3, 3–10 cm). Analyses using the pXRF show that, relative to the coarse-grained host lava, these veins have lower TiO2 (1.1 wt% versus 1.7 wt%) and Ni (20 ppm versus 40 ppm), as well as higher Zr (400 ppm versus 170 ppm). These data indicate that the veins have more evolved compositions than the host lava and therefore may represent segregation veins that formed just prior to final solidification of the flow.
Veins and alteration
The pervasive greenish gray color of the samples indicates that the basalt is altered from its original mineralogy (e.g., Figure F29). Plagioclase, as phenocrysts and in the groundmass, appears only partially altered in some thin sections (Figures F27, F26), and XRD indicates that it is labradorite (Figure F32). XRD data also indicates abundant albite, and therefore in some sections the plagioclase may now be albitized. The plagioclase is sericitized or altered to clay minerals in other thin sections. Some relict areas of pyroxene may be visible in thin section, as well as some Fe-Ti oxides, but no other primary magmatic minerals are present. The green color of the basalt is most likely due to the presence of epidote, green zeolite minerals, and green clay minerals in the upper sections and chlorite in the lower sections (Figures F26, F28, F31). Other common alteration minerals are calcite, dolomite, quartz, chalcedony, and Fe (hydr)oxide (Figures F26, F28). Pyrite is pervasive and is found in the fractured basalt, in the matrix and clasts of the basalt breccia, in pillows, as vesicle filling, and in veins (Figures F26, F31). In addition, minor amounts of chalcopyrite, sphalerite, and covellite are found in the groundmass and veins in Cores 23R through 32R.
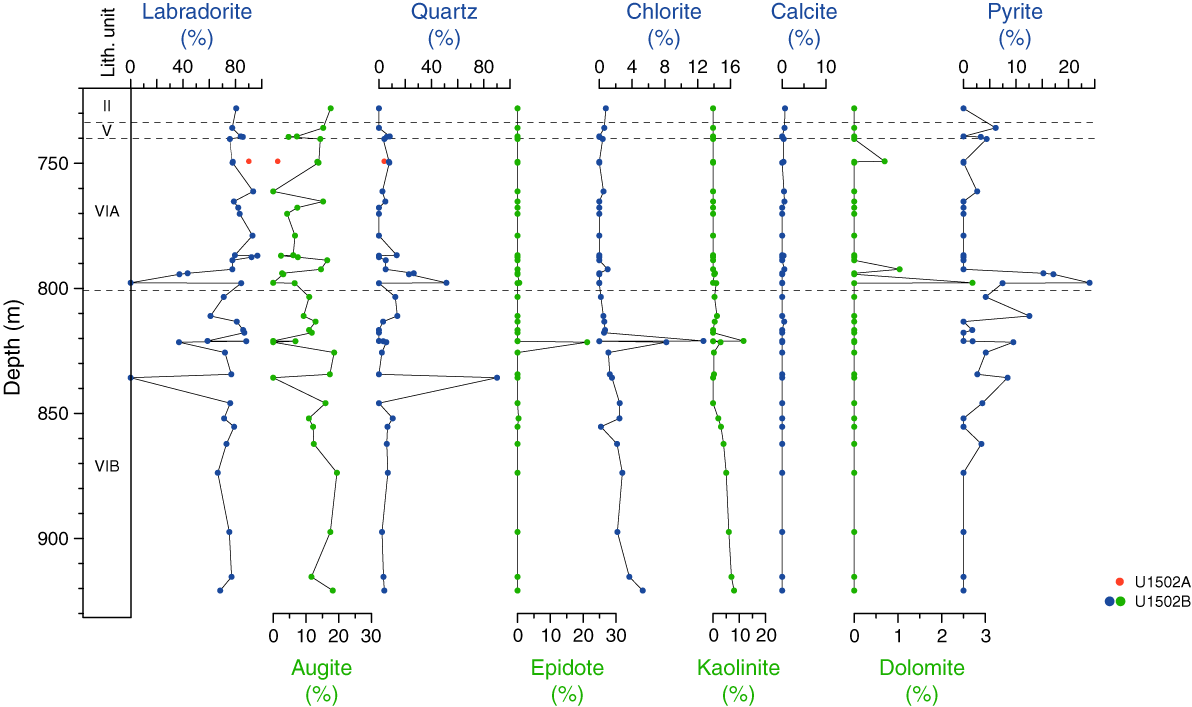
Figure F32. XRD bulk mineralogy.
There are at least three vein types. Type 1 is white to green to black in color, with cryptocrystalline silica, epidote, Fe (hydr)oxide, carbonates (dolomite/siderite), and traces of pyrite (e.g., intervals 10R-1, 68–85 cm, and 13R-4, 90–100 cm; Figures F26B, F26C, F28E). Some veins have less abundant quartz and are green to grayish green, whereas others have red jasper. Type 2 is pyrite rich with pistachio green and dark green minerals, probably epidote and zeolite minerals and quartz (e.g., interval 13R-3, 110–120 cm; Figure F26D–F26F). Type 3 veins are rich in calcite with minor epidote and pyrite (e.g., interval 19R-2, 50–68 cm) (Figures F26A–F26C, F31).
Bulk mineralogy
The bulk mineralogy results of XRD analyses on igneous samples from Site U1502 are listed in Table T3 and shown in Figures F31 and F32. Igneous Unit 2 basalts are composed mainly of plagioclase (mean = 78%), with minor amounts of augite (mean = 11%), quartz (mean = 6%), and clay minerals (smectite; mean = ~1%) (Figure F32; Table T3). Pyrite is found both in veins and as a disseminated phase in numerous basalt intervals within igneous Unit 2, and it is a common accessory phase in many of the basalt XRD analyses. Differences in additional mineral phases are found between Subunits 2a and 2b. Chlorite is not common in Subunit 2a basalts, and when detected, it is <1%. In contrast, most basalts in Subunit 2b contain chlorite, and its abundance increases with depth, reaching 5% in Section 368-U1502B-37R-4. Many basalt samples in Subunit 2a contain as much as 3% calcite and/or dolomite, and two samples (intervals 7R-1, 23–25 cm, and 7R-2, 122–124 cm) are notable for having 9%–12% siderite. Kaolinite is found in the lowermost 7 m of Subunit 2a and throughout Subunit 2b, where its abundance increases downhole from ~1% to 8%. XRD samples taken from highly fragmented (drilling-disturbed) intervals (e.g., 10R-2, 125–127 cm; 10R-3, 16–18 cm; and 11R-2, 4–6 cm) generally have lower amounts of plagioclase and higher amounts of quartz, pyrite, and siderite ± dolomite.
Table T3. Mineral percentages, Hole U1502B. View table in PDF format. Download table in CSV format.
XRD analyses were made to confirm the identity of epidote (olive green) and chlorite (dark green) in veins from intervals 16R-2, 15–19 cm, and 16R-1, 93–96 cm, respectively (see Figure F31). Samples from interval 16R-2, 15–19 cm, contain 21% epidote (with 8% chlorite because it was difficult to hand pick a clean sample of the epidote), and samples from interval 16R-2, 15–19 cm, contain 13% chlorite plus feldspar and clay minerals.
Chemical composition (pXRF and XRF core scanning)
Compositional analyses of the igneous lithologic Unit 2 basalts, as well as veins and clasts, were made directly on the archive half of the core using the handheld pXRF (see Igneous and metamorphic petrology in the Expedition 367/368 methods chapter [Sun et al., 2018a]). The average pXRF sample spacing was about every 1 m. Additional representative samples were also taken for major and trace element analysis by ICP-AES (see Geochemistry). The pXRF data are shown in Figure F33 and Table T4. Subunit 2a has lower MgO (<4 wt%) and MnO (<0.1 wt%) contents than Subunit 2b (MgO = >4 wt%; MnO = >0.1 wt%), and on average it also has lower Fe2O3 (4.8 ± 3.1 wt% versus 8.5 ± 2.6 wt%). This difference is interpreted as a secondary feature related to the pervasive alteration of Subunit 2a because there are no significant differences in abundances of alteration-resistant elements such as Ti and Zr between these two units. Subunit 2a has TiO2 contents of 2.2 ± 0.5 wt% and Zr concentrations of 161 ± 44 ppm, whereas Subunit 2b has TiO2 contents of 1.8 ± 0.4 wt% and Zr concentrations of 131 ± 32 ppm. Although Subunit 2b has MgO contents more typical of basalts, other elements show that these basalts are still strongly affected by secondary alteration. CaO and Fe2O3 have wide ranges (CaO = 1–10 wt%; Fe2O3 = 3–14 wt%), and the highest values tend to be found in zones of significantly higher magnetic susceptibility (Figure F33) (see also Physical properties) that might indicate areas of less intense alteration.
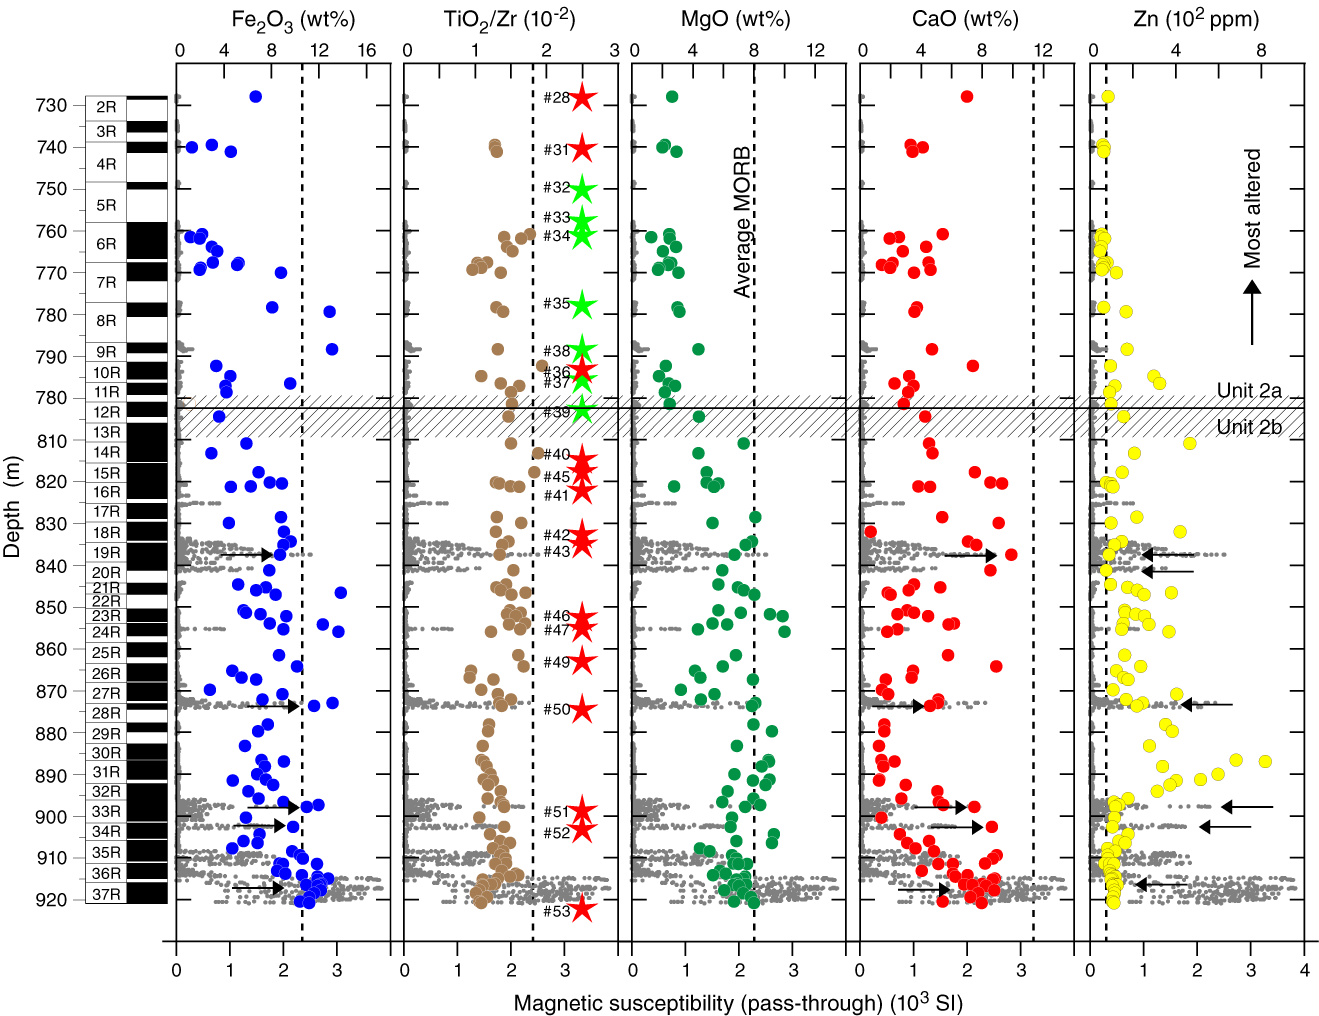
Figure F33. pXRF compositional data.
Table T4. Major element oxides and minor elements in rocks. View table in PDF format. Download table in CSV format.
Elevated S values (as high as 6.4 wt%) in many analyses are consistent with the widespread sulfide mineralization seen throughout igneous lithologic Unit 2. Visual inspection of the core shows that the sulfide mineralization is dominated by pyrite, but other sulfide minerals were also found: sphalerite ([Zn,Fe]S) in interval 368-U1502B-23R-3, 0-86 cm, chalcopyrite (CuFeS2) in Sections 24R and 25R; and covellite (CuS) in interval 14R-2, 143–146 cm. The pXRF results can be used to determine the extent of Zn and Cu mobilization within the hydrothermal system at Site U1502. Cores 33R through 37R have high magnetic susceptibility and low Zn concentrations (average = 112 ± 22 ppm) that are typical of oceanic basalts (e.g., White and Klein, 2014). In the overlying cores (32R through 30R), there is a sudden jump to values as high as 800 ppm, and Zn remains at variably elevated levels until the upper part of Subunit 2a (Cores 4R–8R) (Figure F33), confirming significant pervasive mobilization of Zn. In contrast, there is little evidence for significant Cu mobilization. Cu concentrations average ~80 ppm with values mostly below 300 ppm, and only one analysis gave high Cu (interval 17R-1, 57 cm = 2035 ppm).
Variations in ratios of immobile incompatible elements, such as Ti and Zr, can be used to assess whether there were any changes in parental magma compositions. The Ti/Zr ratio is the same in Subunit 2a (85 ± 14) and Subunit 2b (83 ± 13), implying that there were no significant changes in the melt generation process during the period of eruption of the basalts recovered at Site U1502. However, within Subunit 2b a jump in Ti/Zr ratios at 865 m (91 ± 12 above and 77 ± 10 below this depth) might indicate a small change in magma chemistry. Small-scale flow-by-flow differences in Zr and TiO2 abundances are most likely due to variations in the extent of magmatic differentiation. The few measurements made on igneous lithologic Unit 1 show compositions quite distinct from those of igneous lithologic Unit 2, with a higher average Ti/Zr ratio of 218 ± 8 and Nb concentration of 19.4 ± 0.7 ppm (compared to 10.8 ± 2.6 ppm for Unit 2), as well as higher P2O5 and Cr but lower Zr and V abundances.
A high-resolution XRF core scanning data set for the Site U1502 volcanic rock section was produced onshore (see Igneous and metamorphic petrology in the Expedition 367/368 methods chapter [Sun et al., 2018a]) and can be retrieved as shipboard data from the IODP database (http://web.iodp.tamu.edu/LORE). At the time of this publication, assessment and discussion of this data set have not been concluded yet.
Interpretation
Igneous lithologic Unit 2 shows typical mid-ocean ridge basalt (MORB) flow morphologies with pillow basalts with quenched rims and sheet lavas, as well as a typical MORB mineralogy. The presence of agglutinated benthic foraminifers in the overlying Unit V and pillow basalts indicate that Unit 2 was emplaced in a marine environment. The agglutinated foraminifers indicate abyssal water depths (see Biostratigraphy). A combination of pillow basalts methodsand sheet flows is common in submarine volcanic settings, with the change from sheet to pillow flows probably controlled by the magma discharge rate (Gregg and Fink, 1995; Fink, 2017) and the slope of the ridge axis (Kennish and Lutz, 1998). Some eruption sequences start with high flow rates and sheet morphologies and change to pillow flows as the rate declines (McClinton et al., 2014). For example, the 2005–2006 eruption on the East Pacific Rise (Soule et al., 2007) produced a flow that changed from inflated lobate and sheet morphologies in the flow interiors to pillow lavas at terminal flow fronts. This change was probably controlled by a reduction in the flow rate and a gentler slope away from the ridge axis (e.g., Kennish and Lutz, 1998). The chemistry of the freshest basalts (in areas with high magnetic susceptibility) also overlaps with typical MORB lava compositions (e.g., White and Klein, 2014). Compared to Site U1500 lavas (see Igneous and metamorphic petrology in the Site U1500 chapter [Stock et al., 2018]), igneous lithologic Unit 2 samples have slightly higher TiO2 content (1.72 wt% versus 1.51 wt%), which may indicate a slightly more enriched source or a more differentiated magma. Subunit 2b has multiple intervals where the plagioclase phenocryst content is more than 10% and in places as high as 50% (Figure F24). Basalts with >10% plagioclase phenocrysts are known as plagioclase ultraphyric basalts (PUBs) (Cullen et al., 1989) and are typically found at mid-ocean ridges with ultraslow to intermediate spreading rates and in off-axis seamounts (Flower, 1980; Lange et al., 2013), consistent with the spreading rates of 35–50 mm/y inferred for the SCS (Briais et al., 1993). Recent models (Lange et al., 2013) argue that PUBs form through magma interaction with preexisting lower crustal plagioclase-rich cumulates, and they are erupted only when ascent rates are sufficiently high (>0.5 cm/s) and where the conduit system lacks or bypasses an axial magma chamber.
The combination of intense alteration, multiple veins, and brecciation in the basalt sequence, particularly in Subunit 2a (e.g., interval 368-U1502B-4R-2, 84–93 cm), suggests alteration due to hydrothermal fluids. The abundant pyrite indicates that the fluids were rich in sulfur. Hydrothermal fluids can lead to hydraulic fracturing, which may have caused some of the brecciation in the unit (e.g., Jébrak, 1997). The alteration mineral assemblage belongs to the albite-epidote to lower greenschist facies and suggests high-temperature water-rock interaction. The presence of epidote and quartz shows that this interaction took place at temperatures higher than ~200°C (Reyes, 1990). This style of alteration is referred to as propylitic. The intensity of both alteration and brecciation decreases with depth in the volcanic pile. Alteration in Subunit 2b is dominated by epidote, sulfides, and chlorite, whereas Subunit 2a shows more carbonate and clay alteration, which may indicate lower temperature alteration for the upper section of Unit 2.
The age of igneous lithologic Unit 2 can only be inferred from the biostratigraphy of the overlying sedimentary units because the sparse sedimentary material found between the basalts in the upper part of Unit 2 is barren of microfossils. Lithostratigraphic Unit IV (Core 368-U1502A-40R) is late Oligocene in age based on nannofossils and diatoms, and Unit V (Core 368-U1520B-3R) is inferred to be late Eocene or older in age based on agglutinated benthic foraminifers (see Biostratigraphy).
Igneous lithologic Unit 1 is only represented by a few basaltic fragments found between the early Miocene–late Oligocene lithostratigraphic Unit II and the late Oligocene lithostratigraphic Unit IV and could represent a unit with a younger age than igneous lithologic Unit 2. It is possible that igneous lithologic Unit 1 might be older than the late Oligocene if these fragments represent reworked material derived from nearby exposures of the underlying Unit 2 basalts. Nevertheless, there seem to be petrographic differences between igneous lithologic Units 1 and 2, although they are difficult to determine due to the high degree of alteration in both units. Unit 1 may have contained more olivine as phenocrysts, now completely altered, than Unit 2. In addition, preliminary shipboard analyses using ICP-AES and the pXRF indicate some distinct compositional differences between Units 1 and 2. Igneous lithologic Unit 1 has higher TiO2, P2O5, Cr, and Nb contents and lower Zr and V contents than Unit 2. Another possible reworked source for the Unit 1 basalt fragments are late Oligocene–early Miocene basalts recovered from oil exploration wells (BY2 and BY7-1) in Baiyun Sag, about 200 km north-northwest of Site U1502 (Zhao et al., 2016). The relationship between igneous lithologic Units I and 2 and other basalts in the surrounding area will be evaluated further with postexpedition geochemical analysis.
Structural geology
Site U1502 is located on Ridge A, which represents a northeast-southwest–trending basement high within the COT zone, about 40 km east of Site U1499 and 15 km north of Site U1500 (Figure F1).
Lithostratigraphic Unit I structures
Deformation structures are scarce in lithostratigraphic Unit I downhole to Core 368-U1502A-37R. This upper interval is weakly deformed to undeformed and characterized by horizontal to slightly dipping bedding (Figure F34). However, Sections 25R-3 through 25R-5 contain a convolutely bedded sequence (Figure F35), indicating soft-sediment deformation during mass movements (i.e., slump folding) before lithification of the sediments. Below Core 25R, a slight but consistent tilt with apparent dips on split core surfaces up to ~10° is recorded (Figure F34).
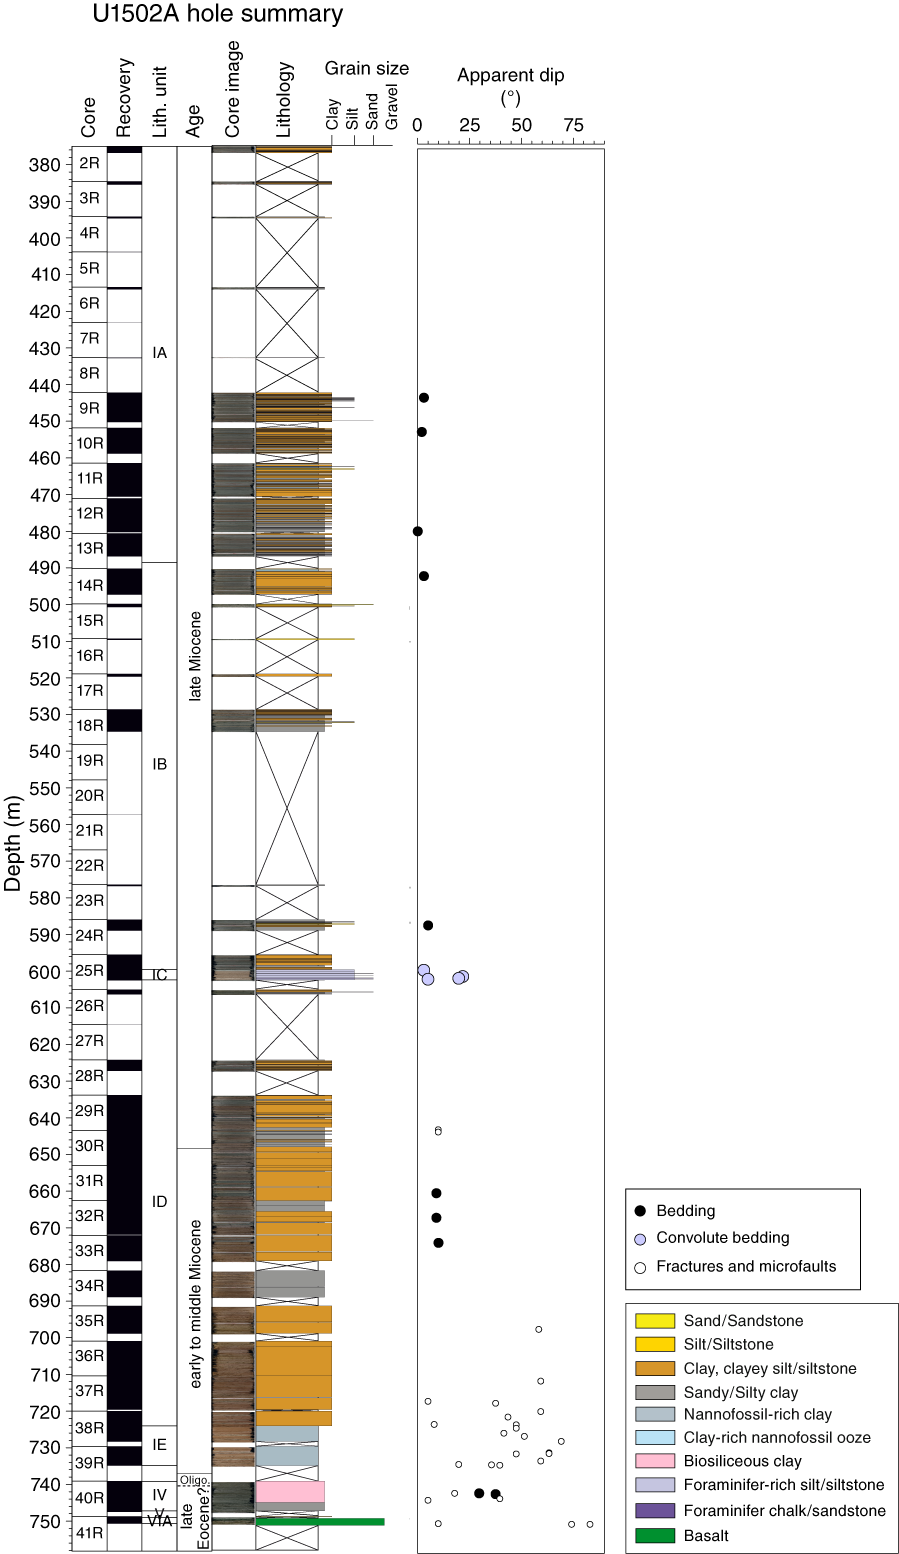
Figure F34. Lithostratigraphic summary with bedding, fractures, and microfaults.
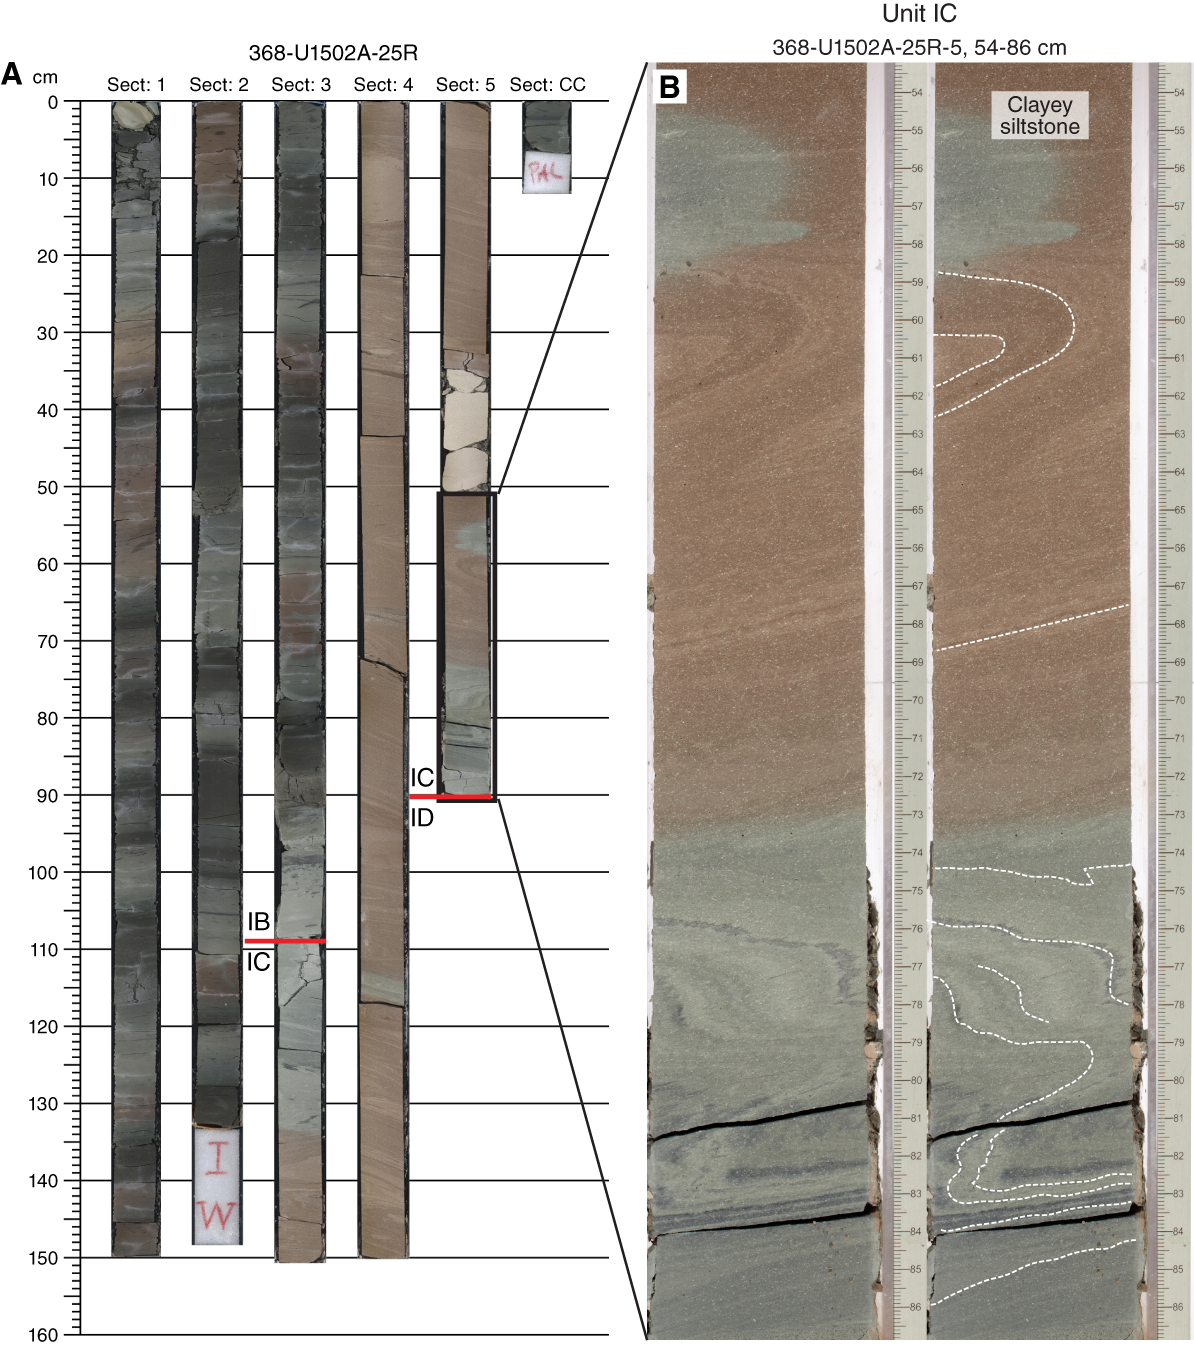
Figure F35. Lithostratigraphic subunit boundaries.
Starting from Core 37R at ~700 mbsf, a gradual increase in deformation structures was observed. Cores 37R, 38R, and 39R are characterized by microfaults evidenced by down-dip plunging striations and slickensides on exposed fracture surfaces at an average frequency of about two per meter (Figure F36). These fractures are systematically associated with greenish halos from 3 to 40 mm wide within the well-consolidated brownish clay.
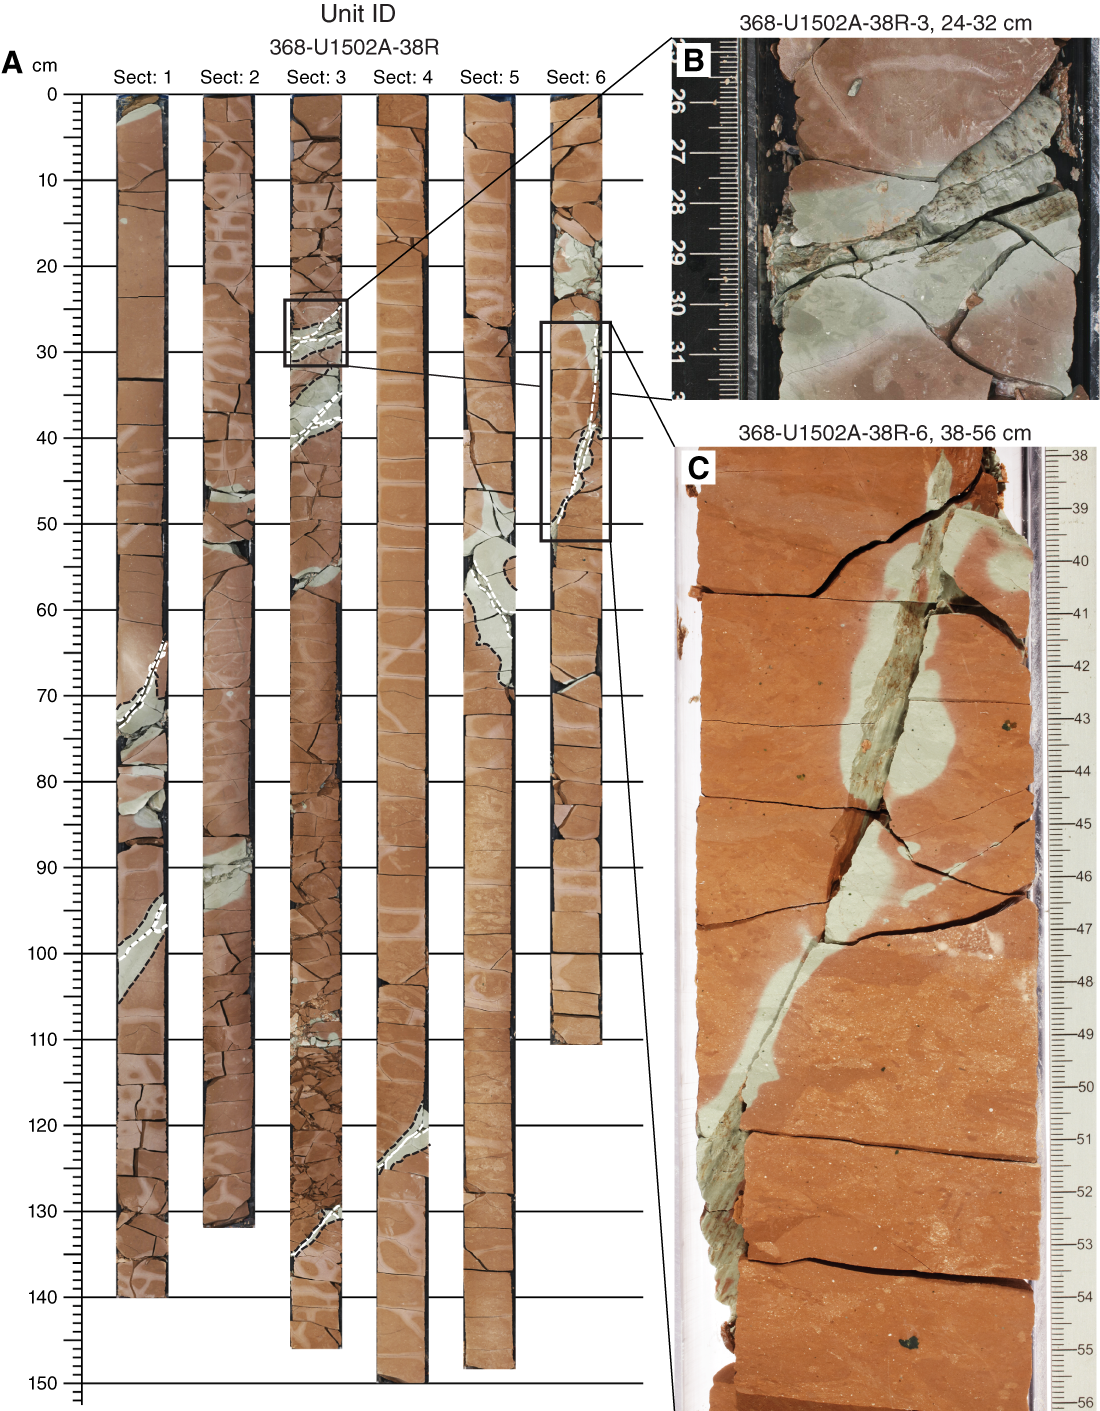
Figure F36. Microfaults.
Lithostratigraphic Unit II structures
No deformation structures were encountered in Unit II.
Lithostratigraphic Unit III structures
Lithostratigraphic Unit III consists of an extremely silicified breccia that was poorly recovered with only a few decimeters in Sections 368-U1502B-2R-1 and 3R-1 and a single fall-in clast in the uppermost centimeters of Core 368-U1502A-40R (Lithostratigraphy). This breccia is essentially composed of quartz showing a fractal grain-size distribution evident in both macroscopic and microscopic observations, with a maximum clast size of ~2 cm and minimum clast size in the submillimeter scale (Figure F19). Quartz microstructures in the silicified matrix of this breccia show some domains governed by partially annealed fractal grain-size distribution. Other domains in the breccia may preserve evidence for initial sedimentary structures or microfossil shapes that were silicified, suggesting important fluid circulation. However, the nature of this breccia as either sedimentary, tectonic, or hydrothermal remains unconstrained.
Lithostratigraphic Unit IV structures
In Core 368-U1502A-40R, a small-scale transition from distributed to localized shear in unlithified sediments of Unit IV (biosiliceous-rich clay; see Lithostratigraphy) was encountered. Tilted bedding (~20°) with diffuse shear bands and a sigma clast in Section 40R-3 (Figures F34, F37B, F37C) indicate passive creep. From Section 40R-1 to Section 40R-5, an increasing occurrence of microfaults with striations and slickensides grades into a microfault network strongly affected by drilling disturbance (Figure F37D, F37E).

Figure F37. Deformation structures.
Lithostratigraphic Unit V structures
No deformation structures were encountered in Unit V.
Lithostratigraphic Unit VI structures
Unit VI is composed of basalts that were heterogeneously affected by brecciation and veining associated with the circulation of hydrothermal fluids. Subunit VIA is dominated by brecciated basalts/basaltic breccias, whereas Subunit VIB comprises a rather coherent series of lava flows crosscut by a multistage network of polymineralic veins.
Subunit VIA
Core 368-U1502A-41R, representing the very top of Unit VI, contains severely fractured and fragmented basalt (Figure F38). The fractures are locally filled by fine-grained unconsolidated greenish rocks. In Cores 368-U1502B-4R through 12R, Subunit VIA is characterized by diverse brecciated horizons associated with veins and microcracks (Figures F39, F40). Depending on the intensity of fragmentation and the clast/matrix ratio, the rocks are referred to as brecciated basalt or basaltic breccia (for more information about lithology definitions, see Igneous and metamorphic petrology in the Expedition 367/368 methods chapter [Sun et al., 2018a]). Such breccias contain angular clasts of variable size up to ~8 cm and are generally clast supported. A commonly observed feature is the jigsaw-puzzle structure, suggesting possible in situ fragmentation (Figure F39A, F39B).
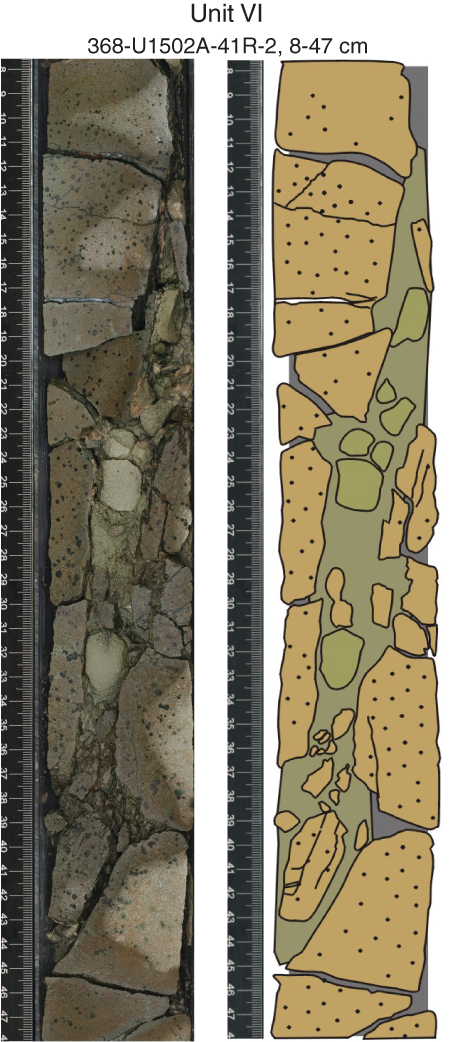
Figure F38. Strongly fractured and fragmented basalt.

Figure F39. Breccias.

Figure F40. Progressing stages of brecciation process.
Macro- and microscopic observations show that the breccia clasts consist mainly of sparsely to moderately plagioclase phyric basalts that were hydrothermally altered to variable degrees. However, some breccia varieties also contain sedimentary components (e.g., chert) as clasts and/or matrix constituents. In places, a possible initial veining episode predating the eventual brecciation is preserved in breccia clasts that are fragmented by silica, epidote, and carbonate veins (Figure F40A, F40B). The matrix between individual clasts is made of euhedral Ca-, Mg-, and/or Fe-carbonate crystals in a fine-grained groundmass of zeolite, clay minerals, and various Fe oxides (e.g., Section 368-U1502B-5R-CC; thin section [TS] 32; Figure F40C, F40D). The contact between the basalt clasts and the matrix is generally sharp with clearly defined edges. The matrix itself provides no evidence for a shear-induced brittle fabric (e.g., a Riedel-type fracture pattern). Locally, however, carbonate crystals are anhedral and exhibit undulose extinction at clast/matrix contacts, indicating a strained crystal lattice (Figure F40E, F40F). Thus, formation of such breccias likely involved fluid-assisted fracturing of basalt with limited displacement.
Section 368-U1502B-12R-1 displays a gradual transition from a clast-supported brecciated basalt to a matrix-supported basaltic breccia (Figure F39). This transition is accompanied by progressive rounding of clasts and severe grain-size reduction within the breccia matrix. Macroscopically, the structure of this rock therefore falls into our first-order definition of a fault gouge. However, thin section observations cannot provide support for a deformation process involving significant shear movements because the original matrix geometry is erased by static overgrowth of euhedral carbonate crystals, most likely as precipitates from a circulating fluid postdating the brecciation process (Figure F40G, F40H). Locally, the healed matrix is cut by a second generation of veins, indicating that multiple pulses of fluid-assisted fracturing were involved in the formation of this breccia.
Subunit VIB
Subunit VIA is characterized by small-scale veins and microcracks only a few millimeters wide, showing a complex network generally in direct relation with the brecciation. In contrast, Subunit VIB is characterized by a progressive decrease of breccia horizons and the development of different vein types, almost always polymineralic. Notably, the composition and orientation of the veins change throughout Subunit VIB (Figure F41). Although numerous small-scale veins often related with major ones can be observed, only the main veins are represented in this figure, therefore providing only a first-order trend. In Cores 368-U1502B-12R through 37R, three vein types were identified: (1) composite silica-rich vein, (2) composite epidote-rich vein, and (3) composite carbonate and/or silica-rich vein. For more information about their mineralogy, see Igneous and metamorphic petrology.
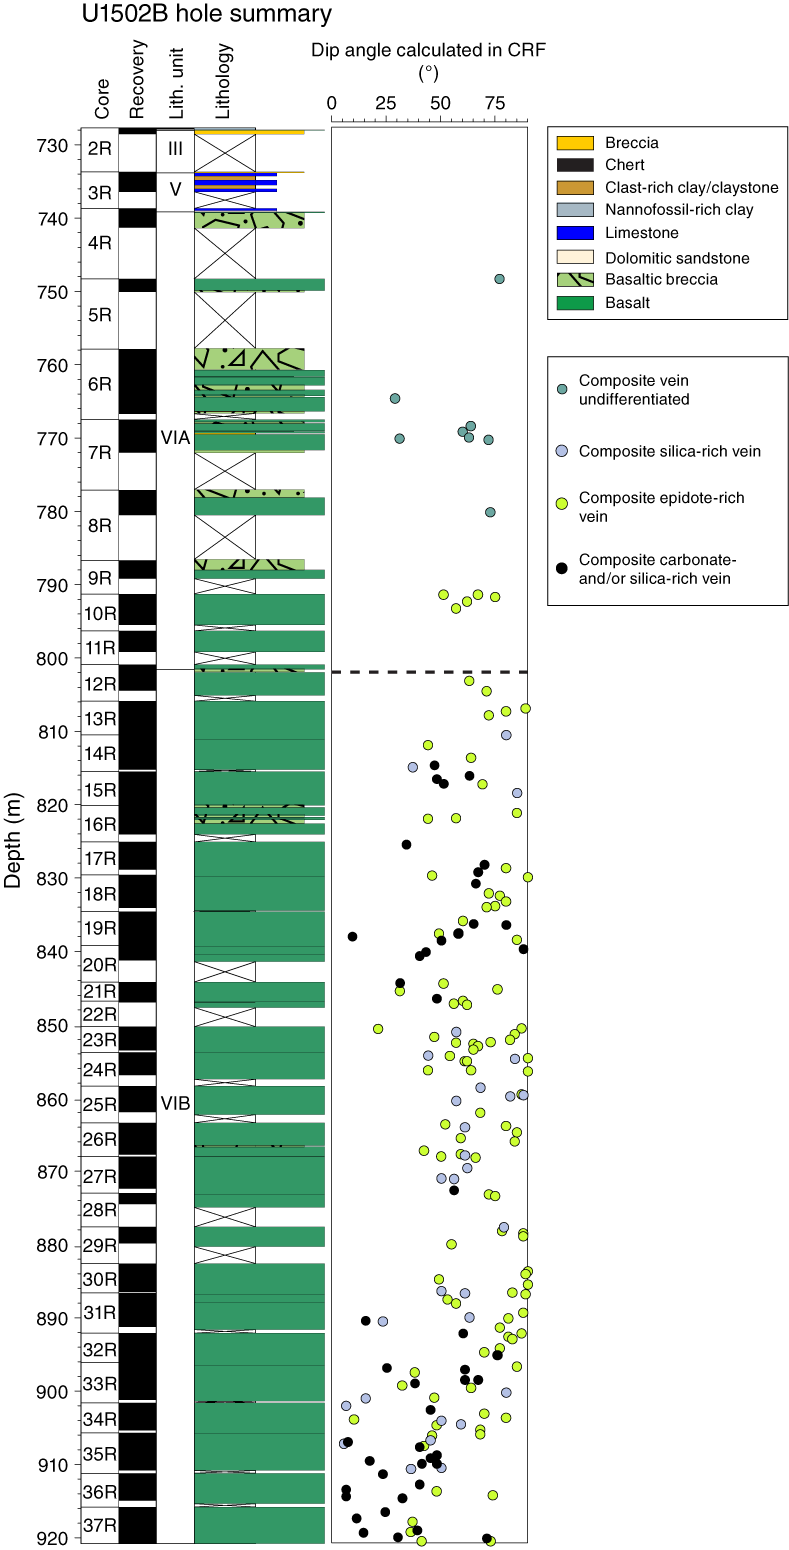
Figure F41. Calculated true dip angles.
The first category includes silica-rich veins that are not particularly abundant. They are characterized by irregular shapes and single to branched connectivity (Figures F42, F43) and often appear crosscut by composite epidote-rich veins (Figure F42A), whereas locally the opposite relations are also inferred. These epidote-rich veins, observed from Core 10R downhole, are associated with sulfides, silica, chlorite, various clay minerals, and zeolites. These veins are generally vertical to subvertical, from 1 to 25 mm wide, and typically irregular in shape. Individual veins are continuous for only short distances (less than a few tens of centimeters) and commonly terminate on other veins, forming an interconnected network (Figure F43D), although branched geometries are also common (Figure F43B, F43C, F43F). Locally, the epidote vein displays a radial geometry in relation to a pillow margin (Figure F43E). From Core 35R downhole, this vein type becomes gradually less abundant. Eventually, these composite epidote-rich veins are overprinted by a third type composed of composite carbonates and/or silica-rich veins (Figure F42B, F42C). These veins show various sizes ranging from 1 to 10 mm with various orientations. In Cores 35R–37R, these veins are more abundant and are associated with shallow to moderate dips (<50°) with a straight shape (Figure F43). They record a texture from massive to slip fiber showing single to branched to network connectivity.
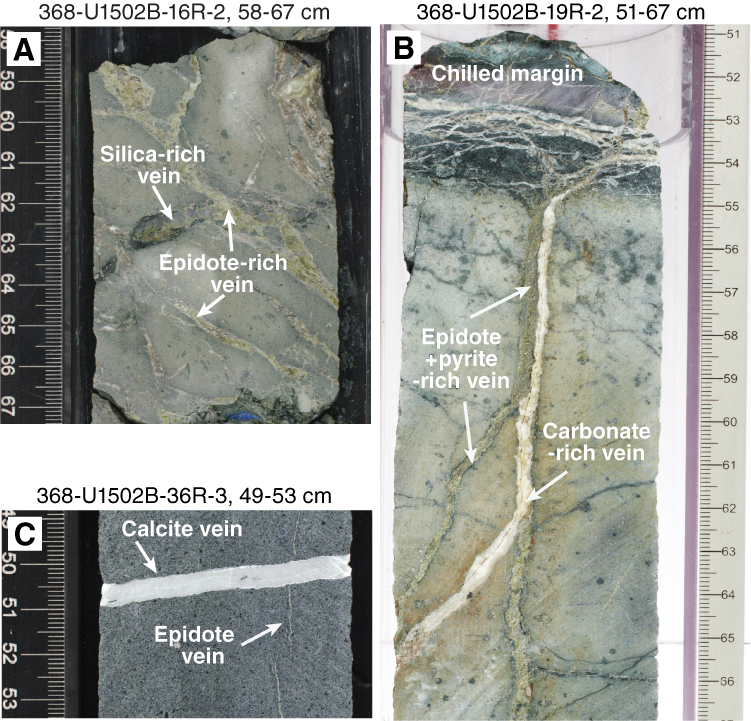
Figure F42. Principal generations of veins.
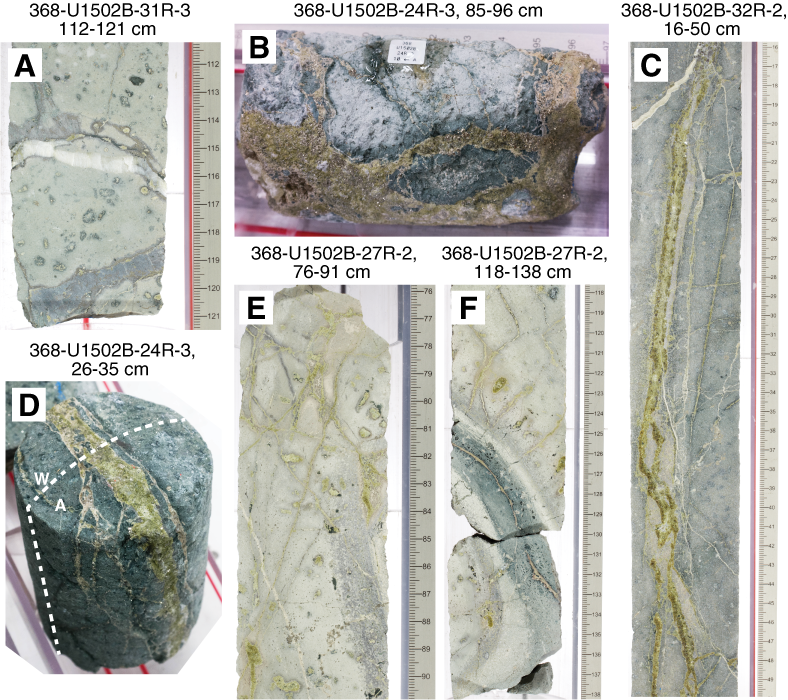
Figure F43. Distinct vein shapes, connectivity, and mineral compositions.
Interpretation
The upper part of the sedimentary record encountered at Site U1502 is essentially devoid of deformation structures apart from Core 368-U1502A-25R, which contains a convolutely bedded sequence in Sections 25R-3 through 25R-5 (Subunit IC). The formation of this soft-sediment deformation structure most probably involved mass movements related to gravitational instabilities on a slope in close vicinity of a basement high (i.e., Ridge A).
A gradual downhole increase of predominantly brittle deformation is recorded within the sediments directly overlying the volcanic basement (Cores 368-U1502A-37R through 40R), whereas severe brecciation was observed within the uppermost ~50 m of the basement top (Cores 368-U1502B-4R through 12R). The observed deformation structures are interpreted to be related to the emplacement history of the basalt and the subsequent development of a hydrothermal system. Assuming such a setting, local strain accumulations resulting from possible thermal reequilibration and triggered by the circulation of fluids in both magmatic rocks and sedimentary cover may well be expected.
The numerous brecciated horizons observed in Subunit VIA are most probably related to fluid-assisted fracturing associated with hydraulic (and) in situ fragmentation of basalts. In that context and from a mechanical perspective, rock failure may have occurred in the tensile regime associated with low differential stress and high fluid pressure. Such rocks are commonly described in hydrothermal systems (e.g., Jébrak, 1997; Clark and James, 2003) and are identified as hydrothermal breccias. In some cases, however, a clear distinction between hydrothermal and tectonic breccias remains unconstrained, as it does in Section 368-U1502B-12R-1, which marks the boundary between Subunits VIA and VIB. Indeed, macroscopic observations from this section are compatible with a fault breccia, showing a gradual increase of the brittle deformation passing from a clast-supported cataclasite to a matrix-supported fault gouge. However, the identification of characteristic microstructures resulting from shear deformation are precluded by a pervasive fluid circulation associated with replacement, destabilization, and recrystallization of the initial texture. Therefore, at its present stage, two possible scenarios are considered regarding the formation mechanism of this breccia: (1) the breccia results essentially from hydrothermal fluid-assisted brecciation associated with the replacement and destabilization of the initial basalts, or (2) the breccia represents a fault zone with cataclastic deformation processes and was subsequently overprinted by pervasive hydrothermal fluid circulation.
Biostratigraphy
All core catcher samples from Hole U1502A and selected samples from Hole U1502B were analyzed for calcareous nannofossils, foraminifers, diatoms, and ostracods. Additional samples were taken from intervals within the working-half cores when necessary to refine the ages. The preservation of calcareous microfossils is mostly good to moderate in the upper sections (Cores 368-U1502A-2R through 13R) and moderate to poor in the lower sections (Cores 14R through 41R). Planktonic foraminifers and calcareous nannofossils are abundant to common in Cores 2R through 10R, 25R, and 37R through 39R and rare to barren in all the other sections. Diatoms were only observed in Sections 40R-1 through 40R-3. In Hole U1502B, foraminifers were observed only in Section 3R-1 and are represented by well-preserved agglutinated deepwater taxa. Ostracods are extremely rare and were observed only in Samples 368-U1502A-3R-CC to 5R-CC.
Fourteen biostratigraphic events from the planktonic foraminifers and calcareous nannofossils were used to provide an age-depth model for Site U1502 from the late Miocene to late Oligocene (Tables T5, T6; Figure F44). The Pliocene/Miocene boundary is placed tentatively within Core 368-U1502A-2R, but it may be above the cored section, and the Miocene/Oligocene boundary was determined to lie between Samples 39R-CC and 40R-1, 7 cm. Sedimentation rates varied from ~39 mm/ky in the late Miocene to ~10 mm/ky in the middle and early Miocene.
Table T5. Calcareous nannofossil events. Download table in CSV format.
Table T6. Planktonic foraminifer events. Download table in CSV format.

Figure F44. Age-depth model.
No planktonic microfossils were found in Hole U1502B, but Sample 3R-1, 94–99 cm, from a sandy interval) revealed abundant and diverse abyssal agglutinated benthic foraminifers. The taxonomic composition of this agglutinated benthic foraminifer assemblage suggests a late Eocene age for this interval.
Calcareous nannofossils
The calcareous nannofossil biostratigraphy for Hole U1502A is based mainly on the analysis of core catcher samples, with occasional toothpick samples from the working-half cores to better constrain the biostratigraphic events (Table T7). Calcareous nannofossils are abundant and well preserved in Cores 2R through 6R, deteriorating to moderate preservation with abundant to common occurrences in Cores 7R through 12R. Calcareous nannofossils are absent in Cores 13R through 36R with the exception of a few samples where they are present but the assemblages are affected by strong dissolution. In contrast, nannofossils are abundant in Cores 37R through 40R. Reworking, overgrowth, and fragmentation were observed in most samples from Hole U1502A, whereas heavy dissolution occurred in discoasterid-dominated assemblages, if present, in the middle part of the sequence. Nine nannofossil biostratigraphic datums were recognized from the late Oligocene through late Miocene sediment sequence in Hole U1502A (Table T5). The oldest nannofossil event identified in Hole U1502A is the last appearance datum (LAD) of Sphenolithus predistentus (26.93 Ma) observed in Sample 40R-1, 69 cm (739.79 m), whereas the first appearance datum (FAD) of Sphenolithus distentus (30.0 Ma) cannot be determined due to the nannofossil-barren interval from the immediately underlying sample to the bottom of Hole U1502A, indicating an age older than 26.93 Ma but possibly younger than 30.0 Ma. All core catchers and toothpick samples from within the working-half cores of Hole U1502B are barren of calcareous nannofossils.
Table T7. Calcareous nannofossils. View table in PDF format. Download table in CSV format.
Miocene
Four events occur in the late Miocene strata of Hole U1502A. The top of Zone NN11 is defined by the LAD of Discoaster quinqueramus (5.59 Ma), which was observed in the uppermost Sample 2R-CC (376.81 m), indicating an age older than 5.59 Ma. The LAD of Nicklithus amplificus (5.94 Ma) was found in Sample 5R-CC (403.85 m). The FAD of Amaurolithus spp. (7.42 Ma) was found in Sample 10R-CC (458.81 m). The bottom of Zone NN11 is placed in Sample 13R-2, 89–90 cm (483.01 m), where the apparent FAD of Discoaster berggrenii (8.29 Ma) was found right above a nannofossil-barren interval. The LAD of Cyclicargolithus floridanus (11.85 Ma) within Zone NN6 is placed in Sample 30R-CC (653.27 m), and this sole event in the middle Miocene strata of Hole U1502A approximates the top of Zone NN6 (11.90 Ma) and the late/middle Miocene boundary. Three bioevents were found in the early Miocene strata of Hole U1502A. The top of Zone NN2 is marked by the LAD of Triquetrorhabdulus carinatus (18.28 Ma), which was observed in Sample 37R-CC (719.62 m) immediately below a nannofossil-barren interval; the FAD of Sphenolithus belemnos (19.03 Ma; Zone NN2) was also found in this same sample. The base of Zone NN2 and the Miocene/Oligocene boundary are inferred by the FAD of Sphenolithus disbelemnos (22.76 Ma), which was observed in Sample 39R-CC (734.87 m). Notably, the co-occurrence of Sphenolithus delphix (23.11–23.21 Ma) in this same sample and the LAD of Reticulofenestra bisecta >10 µm (23.13 Ma) in the immediately underlying Sample 40R-1, 7 cm (739.17 m), may be the result of the sample size (5 cm thick) and/or the presence of a hiatus.
Oligocene
One Oligocene bioevent was identified in Hole U1502A. The LAD of S. predistentus (26.93 Ma) within Zone NP24 was observed in Sample 40R-1, 7 cm (739.17 m). The occurrence of S. distentus (first occurrence dated to 30.0 Ma) immediately overlies a barren interval, indicating a possible deeper position of its FAD and therefore an age younger than 30 Ma at 739.79 m (Sample 40R-1, 7 cm).
Planktonic foraminifers
All core catcher sediment samples from Holes U1502A and U1502B were processed for foraminiferal analyses. Additional samples were taken and analyzed from the split cores to supplement the biostratigraphic work (Table T8). Planktonic foraminifers are moderately to well preserved and abundant to common in samples from Cores 368-U1502A-2R through 10R and moderately to poorly preserved or even recrystallized and less abundant in Cores 11R through 13R, 25R, and 29R through 31R. Samples from Cores 14R through 24R, 26R through 28R, 32R through 36R, and 40R through 41R and all samples from Hole U1502B are barren of planktonic foraminifers, whereas planktonic foraminifers in samples from Cores 368-U1502A-37R through 39R are poorly preserved with relatively high abundance.
Table T8. Planktonic foraminifers. View table in PDF format. Download table in CSV format.
Five planktonic foraminiferal datums spanning from the late Pliocene to the early Miocene were recognized in Hole U1502A (Table T6). The planktonic foraminiferal biostratigraphy for Hole U1502A was established by these events and the planktonic foraminiferal assemblages at successive depth intervals. No planktonic foraminiferal biostratigraphy events are recognized for Hole U1502B.
The middle–late Miocene planktonic foraminiferal assemblage in samples from Cores 368-U1502A-3R through 29R is dominated by Sphaeroidinellopsis seminulina, Globoturborotalita nepenthes, and Sphaeroidinellopsis kochi (Plate P1), whereas Dentoglobigerina altispira is also a common species in Samples 3R to 9R. The early Miocene–Oligocene planktonic foraminiferal assemblage in Samples 37R to 40R is dominated by Catapsydrax dissimilis and Globoquadrina venezuelana.
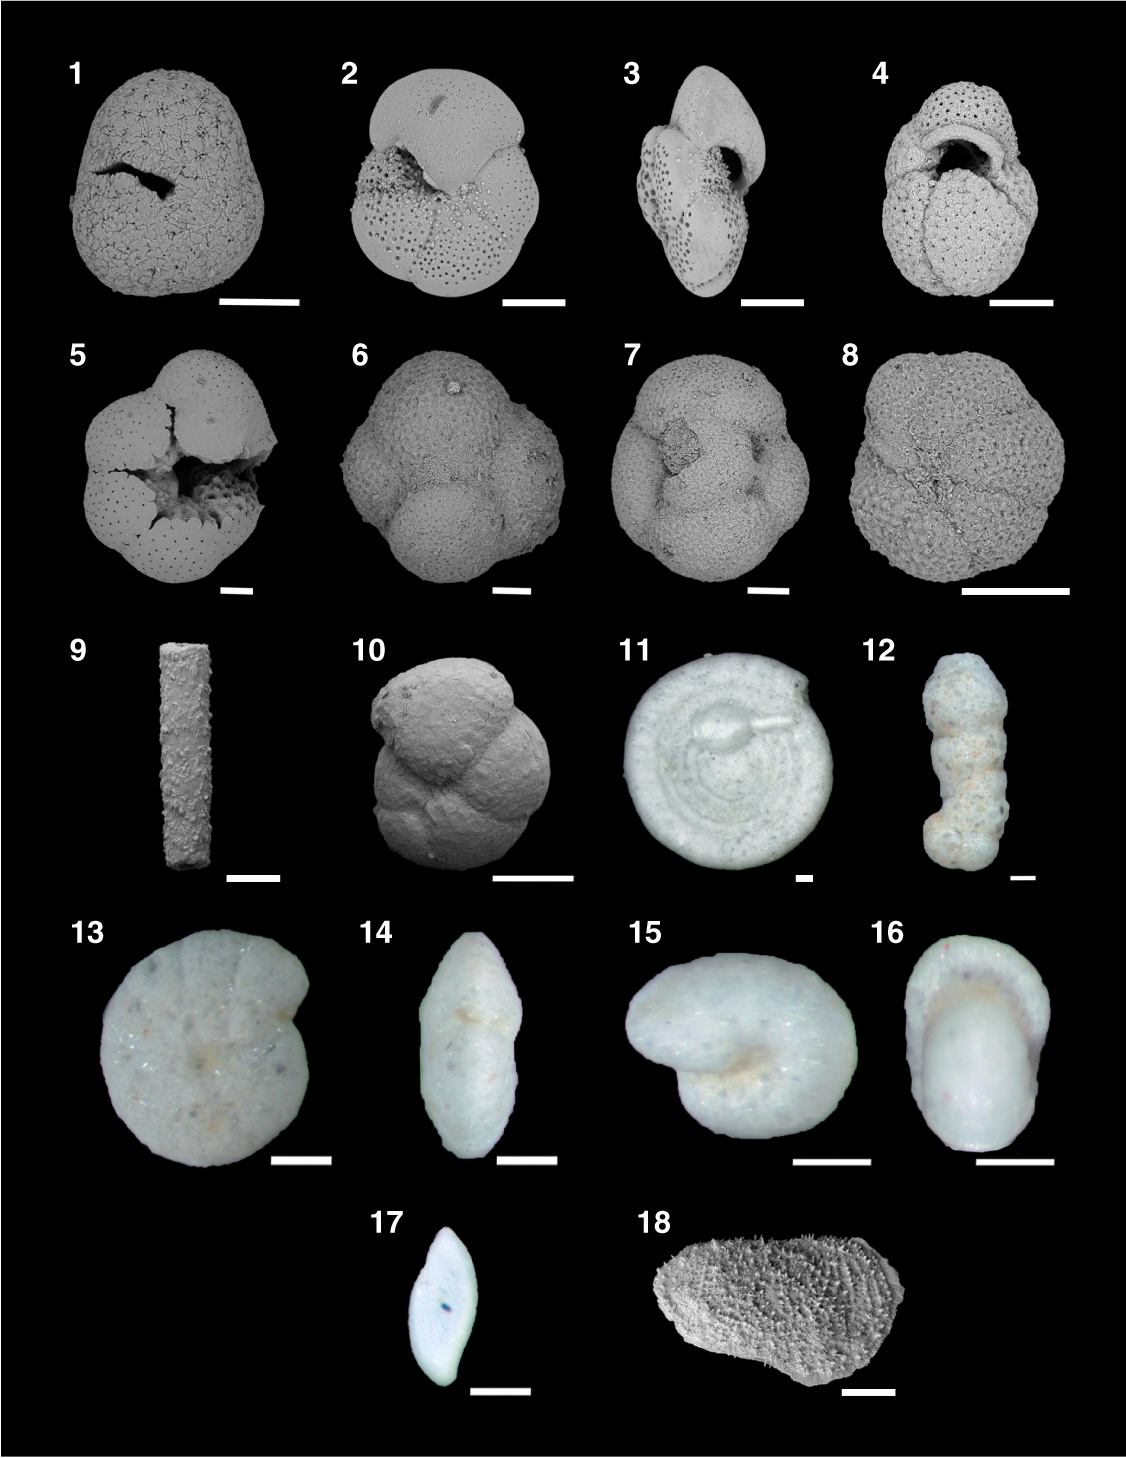
Plate P1. Principal planktonic and benthic foraminifers and ostracods.
The presence of S. seminulina and G. nepenthes in Sample 2R-CC (376.81 m) indicates the top age of this hole should be older than 4.37 Ma. Four other events occur in the Miocene strata of Hole U1502A. The FAD of Globorotalia margaritae (6.08 Ma) was found in Sample 8R-CC (432.74 m), the FAD of G. nepenthes (11.63 Ma) was found in Sample 30R-CC (653.27 m), the LAD of C. dissimilis (17.54 Ma) was found in Sample 37R-CC (719.62 m), and the LAD of Paragloborotalia kugleri (21.12 Ma) within Zone N4 occurs in Sample 38R-CC (728.32 m).
Benthic foraminifers
In Hole U1502B, only one studied sample (interval 3R-1, 94–99 cm) yielded agglutinated benthic foraminifers. In this sample, the agglutinated foraminifers are abundant and the assemblage is dominated by typical abyssal species (e.g., Psammosiphonella cylindrica, Cribrostomoides sp., Ammodiscus cf. Ammodiscus cretaceous, Ammolagena clavata, Ammobaculites sp., Reticulophragmium amplectens, Reticulophragmium gerochi, Psamminopelta gradsteini, and Rugocythereis horrida). Compared to the calcareous microfossil assemblage found in Hole U1502A, the agglutinated assemblage indicates that either a very deepwater paleodepth or a shallower CCD existed during this time. The taxonomic composition of the benthic assemblage, in particular the association between A. clavata, Ammodiscus sp., P. gradsteini, R. amplectens, and R. gerochi, indicates an age of late Eocene (M. Kaminski, pers. comm., 2017) for this layer. Moreover, the on-growth of A. clavata on Ammodiscus sp. (Plate P1, figure 11) was previously reported from Eocene coarse pyroclastic sediments overlying basement at Ocean Drilling Program (ODP) Site 643 (plate 21.3 in Kaminski and Gradstein, 2005).
Ostracods
The deepwater species R. horrida was found as single valves, one each in Samples 368-U1502A-3R-CC, 4R-CC, and 5R-CC.
Diatoms
The core catchers of Hole U1502A were processed into smear and strewn slides for diatom analysis with 57 additional toothpick samples taken from selected intervals of the working-half cores for further resolution. All core catcher samples and most additional samples were found to be barren of diatoms (Table T9). Toothpick samples from the top of Section 40R-1 contain abundant but poorly preserved diatoms, decreasing in abundance to barren in Section 40R-4. Chaetoceros spp. are few to common in these sections, with few Cyclotella spp., Distephanosira architecturalis, Paralia sulcata, and Thalassiothrix spp. Sections 40R-1 through 40R-3 have an early Oligocene diatom assemblage; the presence of Rocella vigilans indicates the sections are between 30 to 24 Ma in age (Table T10).
Table T9. Diatoms. View table in PDF format. Download table in CSV format.
Table T10. Diatom event. Download table in CSV format.
Paleomagnetism
Shipboard measurements
Shipboard paleomagnetic investigations combined three complementary approaches (see Paleomagnetism in the Expedition 367/368 methods chapter [Sun et al., 2018a]): (1) measurement and in-line AF demagnetization of archive-half sections on the pass-through 2G Enterprises SRM at 2.5 and 2 cm spacing for sediments and basalts, respectively; (2) measurement and thermal demagnetization of oriented discrete samples on the SRM; and (3) measurement and AF demagnetization of oriented discrete samples on the spinner magnetometer (AGICO JR-6A). For sedimentary units, 40 representative discrete samples were collected for thermal demagnetization and 15 for AF demagnetization from sections where recovery was higher than ≈20%. For igneous basement units, 8 discrete samples were collected for thermal demagnetization and 41 for AF demagnetization.
First, we used scalar data from discrete samples that were thermally demagnetized up to 700°C or AF demagnetized up to 120 mT to assess the nature of the magnetic assemblage. Second, we used the directional and intensity data of archive-half sections measured after in-line AF demagnetization of 25 mT to determine magnetic polarity along the core. The thermal instability of the sedimentary rocks combined with the lack of laboratory shielding prevented the use of thermal demagnetization to confirm magnetic polarities. Thermal demagnetization of samples from the igneous basement was successful due to intrinsically higher NRM in basaltic rocks. Directional data were analyzed using Zijderveld diagrams (Zijderveld, 1967), and the characteristic remanent magnetization (ChRM) direction(s) were calculated by principal component analysis (PCA) (Kirschvink, 1980) using PuffinPlot (version 1.03, 23 April 2015) (Lurcock and Wilson, 2012).
Demagnetization behavior of sedimentary rocks and implications for magnetic assemblages
- Units: IA to V
- Depths: Hole U1502A= 375.00–750.67 m core depth below seafloor, Method A (CSF-A); Hole U1502B = 727.79–739.16 m CSF-A.
- Cores 368-U1502A-2R through 41R; 368-U1502B-2R through 3R
The data from thermal demagnetization at the 95°, 120°, and 200°C heating steps were irreparably lost because of an error in drift-and-background corrections on the SRM. Subsequent measurements at higher temperature steps were successfully performed on 30 representative samples using the JR-6A spinner magnetometer. However, stepwise thermal demagnetization of the NRM above 200°C failed because instead of losing magnetization the samples gained magnetization (Figure F45A). However, these failed experiments show that the behavior of the sedimentary material is strongly associated with its color (red or green), which primarily reflects distinct mineral assemblages.
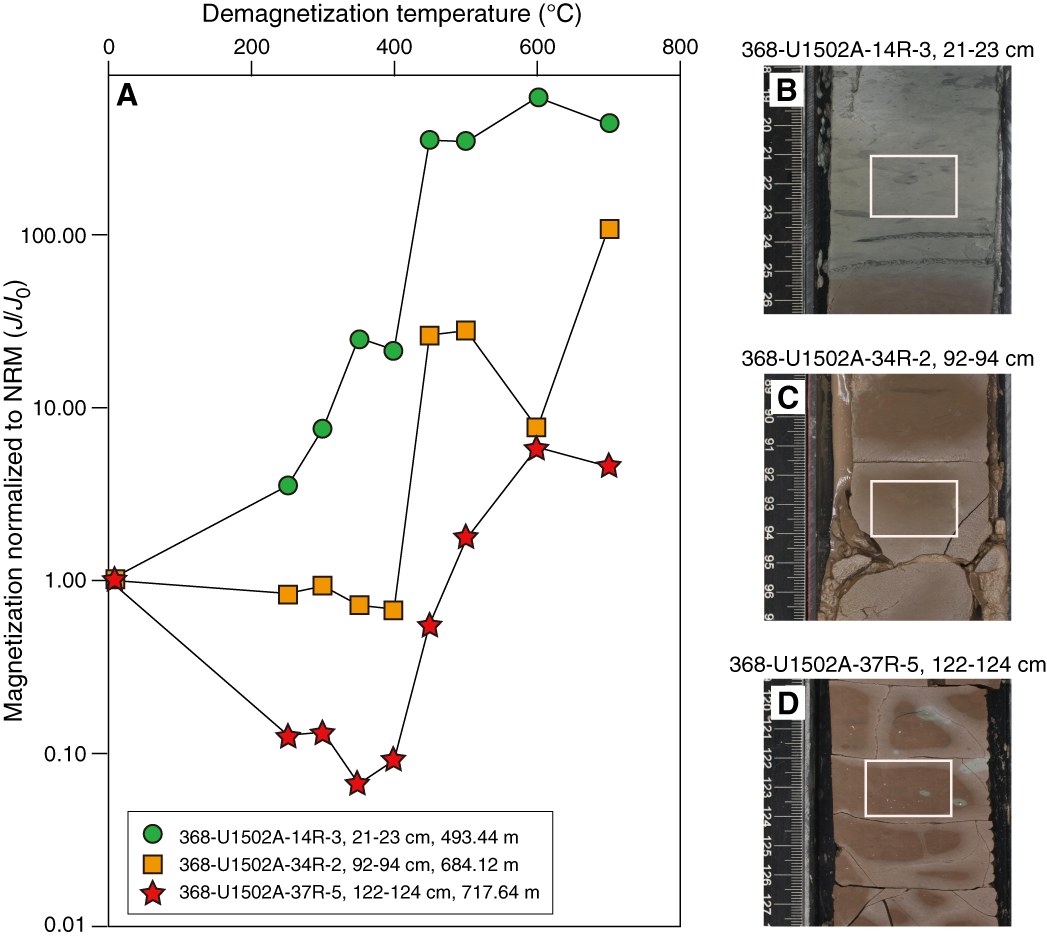
Figure F45. Thermal demagnetization.
Red beds (e.g., discrete Sample 368-U1502A-37R-5, 122–124 cm) initially display normal behavior marked by a decrease in magnetization up to 350°C, followed by an anomalous increase in magnetization from 350° to 600°C and finally a normal decrease above 600°C (Figure F45). The increase in magnetization results from at least one thermally induced reaction that forms, upon heating, one (or several) magnetically remanent phases. Although such reactions are common in sedimentary materials, the acquisition of magnetization in the magnetically shielded TD-48 SC oven is anomalous. The gain in magnetization does not increase with the duration of time before measurement (outside the oven), which suggests that the samples are remagnetized at high temperature in the ≈60 nT residual field (measured with Applied Physics System APS 550 fluxgate probe at room temperature) present in the oven. The magnetic phase formed by the heating-induced reaction must be able to acquire a high chemical remanent magnetization (CRM) to contribute so significantly to bulk magnetization. Because magnetization generally decreases above 600°C, this phase is likely to consist primarily of magnetite (Fe3O4; saturation magnetization: σ ≈ 92 Am2/kg) and hematite (αFe2O3; σ ≈ 0.4 Am2/kg). Potential precursors to thermally induced magnetite and hematite in sedimentary rocks include siderite (paramagnetic), greigite (Fe3S4; σ ≈ 25 Am2/kg), and pyrite (paramagnetic). Although siderite (FeCO3) has been reported in red bed interval 368-U1502A-33R-2, 8–15 cm, and detected by XRD in Sample 33R-3, 25–27 cm (see Lithostratigraphy), it does not constitute a major or ubiquitous phase in the sedimentary units of Holes U1502A or U1502B, and therefore its breakdown into magnetite around 350°C (Ellwood et al., 1986; Hirt and Gehring, 1991; Pan et al., 2000) is unlikely to cause the observed large gain in magnetization. The breakdown of greigite into magnetite around 330°C (Roberts et al., 2011) would cause an insufficient increase in magnetization (≈ 3.68). Finally, the breakdown of pyrite (FeS2), a common paramagnetic phase in sedimentary units of Holes U1502A or U1502B, into magnetite and hematite (αFe2O3) around 350°C (Tarling and Hrouda, 1993) best accounts for the substantial increase in magnetization between 350° and 600°C:
for pyrite + oxygen = magnetite + sulfur dioxide, and
for pyrite + oxygen = hematite + sulfur dioxide.
The green beds (e.g., discrete Sample 368-U1502A-14R-3, 21–23 cm) display significantly higher reactivity to heating (Figure F45A). These samples consistently display a very large magnetization enhancement, up to 600 times the NRM, above 200°C.
Stepwise AF demagnetization was performed up to 120 mT. Most samples display a demagnetization behavior corresponding to the color of sedimentary material (red or green), although some sediments of intermediate color show mixed behaviors. Red sediments show an initial 50% loss of magnetization by 25 mT (Figure F46), a soft behavior indicative of magnetite or titanomagnetite in the multidomain to pseudosingle-domain size range. This behavior changes drastically above 30 mT and up to 120 mT. The reddish color of the sediment combined with this magnetically harder behavior supports the presence of hematite in these sediments. In contrast, green sediments exhibit a very soft AF behavior characterized by rapid demagnetization below 15 mT, which is typical of multidomain–pseudosingle domain magnetite or titanomagnetite. Many samples gain magnetization above 70 mT, a phenomenon attributed to gyroremanent magnetization (GRM) or rotational remanent magnetization (e.g., Thompson, 1990; Snowball, 1991; Hu et al., 2002) that is common in pyrrhotite and greigite. The low saturation isothermal remanent magnetization to magnetic susceptibility (χ) ratios of these green sediments (Table T11) does not support the presence of greigite. Generally, AF treatments on discrete samples removed the steep overprint component more successfully with respect to the SRM in-line treatment on the archive sections (Figures F47, F48, F49).

Figure F46. AF demagnetization.
Table T11. Rock magnetic properties of representative samples. Download table in CSV format.
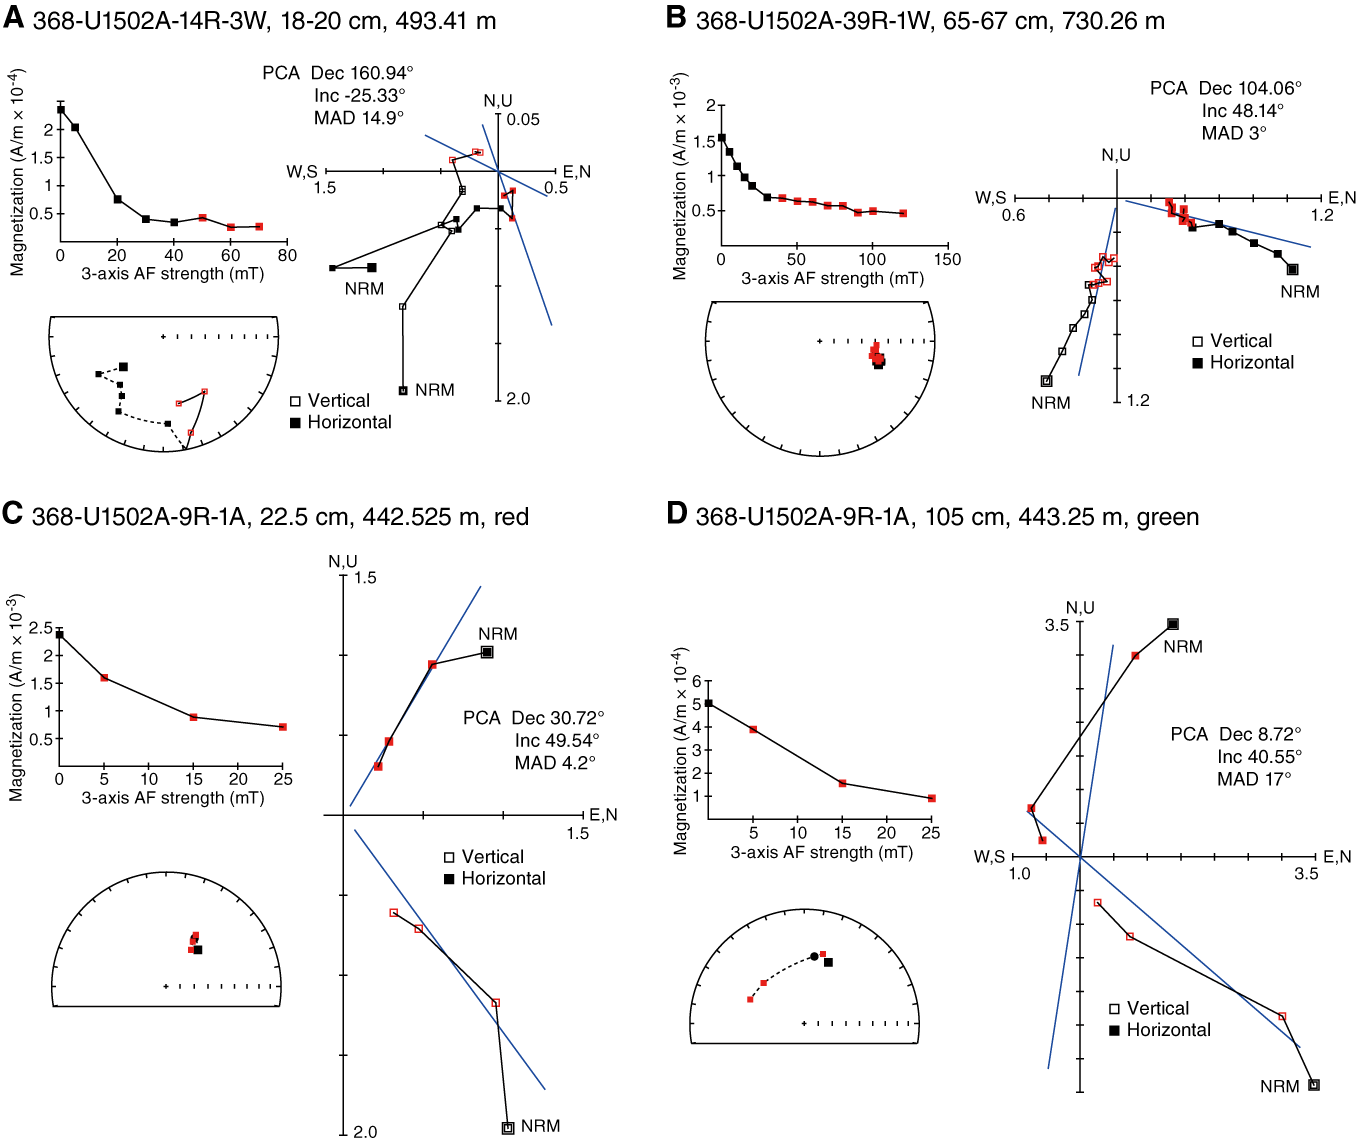
Figure F47. Demagnetization of discrete samples and archive-half sections.

Figure F48. Magnetization intensity vs. inclination.
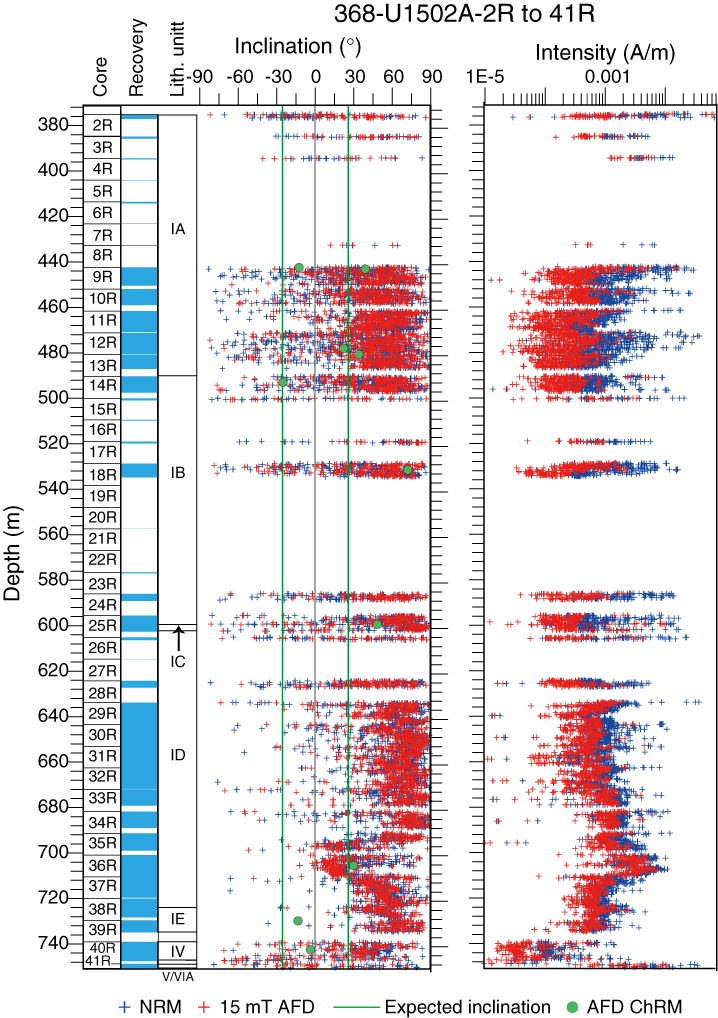
Figure F49. Paleomagnetic measurements.
Demagnetization behavior, rock magnetism data, and implications for magnetic assemblages of igneous rocks
The igneous rocks of Hole U1502B consist of various types of altered basalt (see Igneous and metamorphic petrology). The basalt cores have an average initial intensity (NRM) of magnetization one order of magnitude higher than sediments (Figure F48). This leads to successful AF and thermal demagnetization for both archive halves and discrete samples. Typical examples of demagnetization behavior and polarity interpretation are shown in Figure F50. AF and thermal demagnetization of twin samples collected at the same depth interval lead to comparable results. AF demagnetization shows two types of behaviors, with 90% magnetization loss either before 45 mT (soft) or 100 mT (hard).
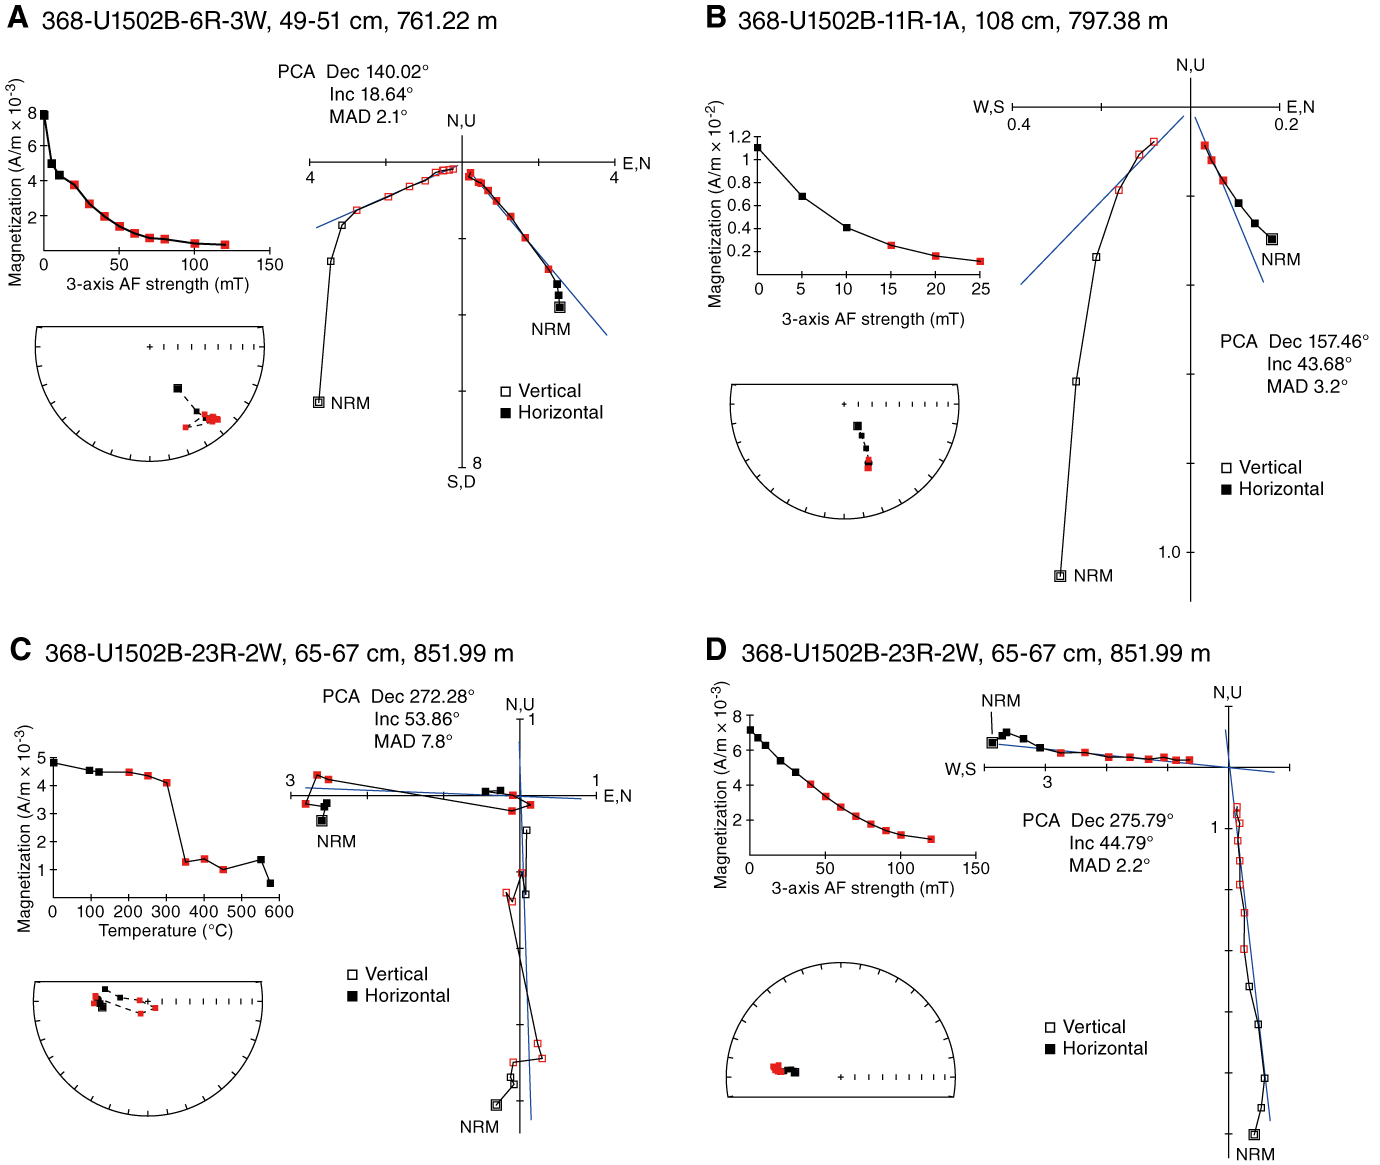
Figure F50. AF and thermal demagnetization.
Magnetic susceptibilities obtained by point measurement on section halves range widely from κ ≈ 18 × 10−6 SI to 33,000 × 10−6 SI, with median values around 327 × 10−6 SI (Figure F51). The distribution of magnetic susceptibility from 728 to 920.8 m CSF-A shows a bimodal distribution with two asymmetric maxima, negatively skewed toward lower κ values (histogram in Figure F51). Progressive increasing alteration of magmatic magnetite into maghemite and hematite, both phases with lower intrinsic magnetic susceptibilities, best explains the skewness of the κ distribution.
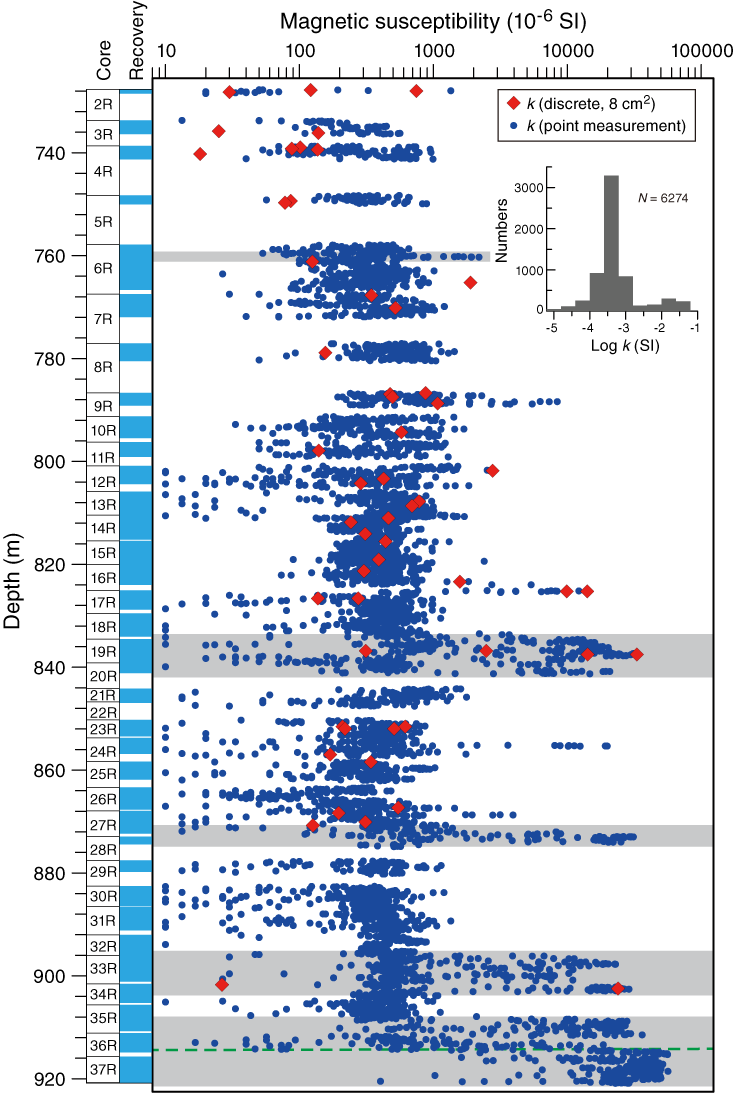
Figure F51. Magnetic susceptibility.
The bimodal nature of the κ distribution and the variations of κ with depth have a different origin. Although magnetic susceptibility κ decreases with increasing alteration, such a process should produce a continuum of κ values from fresh to altered rocks instead of a bimodal distribution. The Fe2O3 versus κ diagram (Figure F52) indeed shows a gap in magnetic susceptibility, which further questions a chemical alteration origin for the κ bimodality. Several 4 to 13 m thick discrete intervals of consistently high magnetic susceptibility occur throughout these volcanic rocks (gray intervals in Figure F51). These intervals show abrupt variations of κ with depth. These high-κ intervals could be interpreted as gravitational accumulation of magnetite toward flow bottoms, as has been observed in basalt flows elsewhere (e.g., Caballero-Miranda et al., 2016). Alternatively, since basaltic flows often develop a tabular structure with more massive lower parts (e.g., Boiron et al., 2013), the lack of fractures in basalts of the lowermost part of Hole U1502B could significantly prevent pervasive alteration, which in turn would result in higher κ values. In many other magnetic studies of basaltic flows, flow boundaries are marked by jumps in magnetic susceptibility (e.g., Cañón-Tapia, 2004; Boiron et al., 2013; Caballero-Miranda et al., 2016). Regardless of the origin of high-κ intervals, these intervals most likely mark boundaries between effusive units with unit thickness ranging between ≈14 and 28 m and an average thickness of ≈19 ± 5 m (Figure F51). The variation of magnetic susceptibility (point measurement on section halves) versus chemical composition from pXRF (see Igneous and metamorphic petrology) shows no distinct correlation (R2 = 0.343 for Fe2O3; Figure F52), suggesting that alteration may not be the primary control on κ.
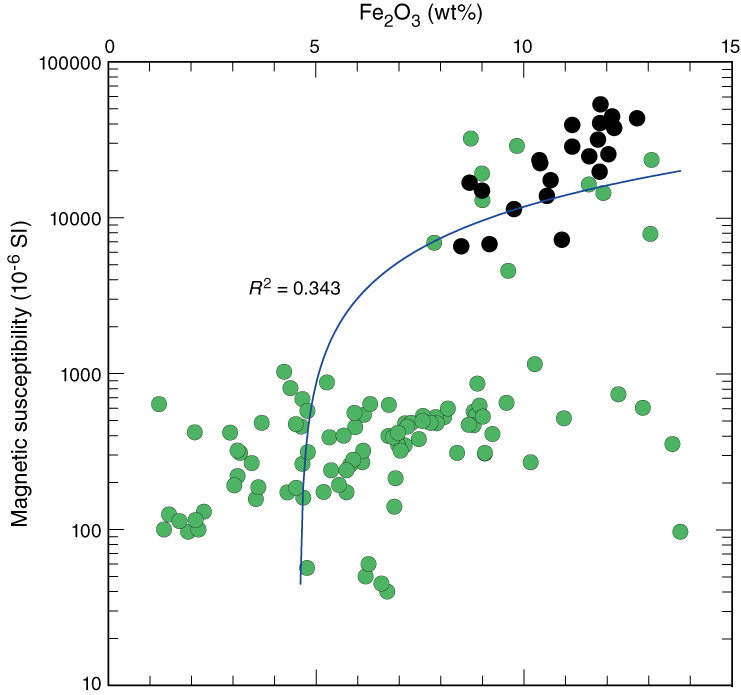
Figure F52. Fe2O3 vs. κ.
NRM at room temperature and magnetic susceptibility from archive halves were used to compute the Koenigsberger ratio, which indicates the capacity of a rock to carry magnetic anomalies. The Koenigsberger ratio (Qn) is defined as the ratio between the remanent magnetization and magnetization induced by the geomagnetic field (43,103.1 nT = 34.3 A/m at Site U1502 according to World Magnetic Model 2015; Chulliat et al., 2015):
The distribution of the Koenigsberger ratio (Figure F53) indicates that altered basalts may contribute more to magnetic anomalies (Qn = 1–10) than fresher basalts (Qn = 0.001–1).
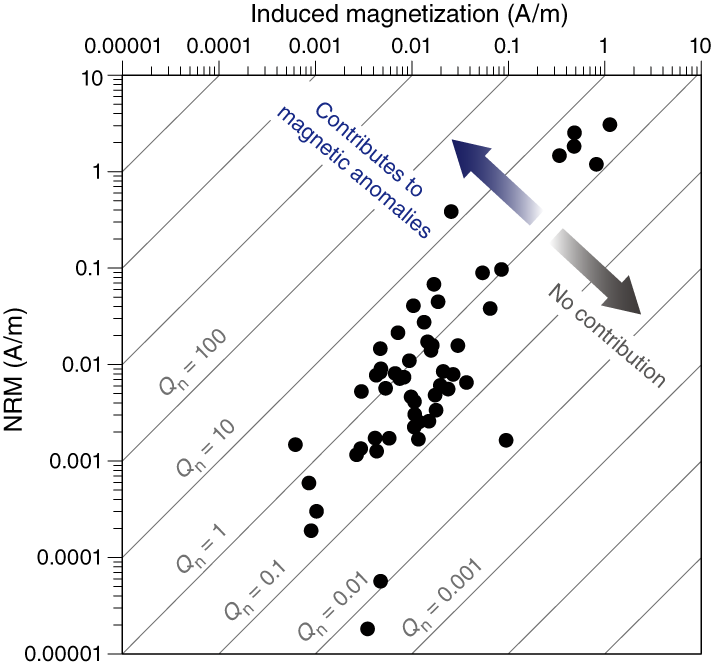
Figure F53. Koenigsberger ratio.
The mean dip angle of magnetic foliation calculated for Hole U1502B basalts (43 discrete samples, most of which are anisotropic samples is 8° (at the 95% confidence level) and thus lower than expected considering the apparent dip of seismic reflectors at this site (see Background and objectives), but it is characterized by a large ellipse of confidence. It is not possible to determine if this dip angle is primary or was acquired during subsequent tilting. However, the degree of magnetic anisotropy (P′) of these basalts is overall very small: P′ < 1.02 (Figure F54). Such low degrees of anisotropy are common in basaltic flows that rapidly cooled on gentle slopes with <10° of dip (e.g., Boiron et al., 2013).

Figure F54. AMS data.
The magnetic shape parameter (T) shows a general ellipsoid symmetry close to 0, as would be expected from a magnetostatic fabric carrier such as magnetite or titanomagnetite (Figure F54). The low magnetite content in the altered basalts combined with the contribution of mafic silicates results in weak anisotropy of magnetic susceptibility (AMS). Hence, this type of volcanic material is unlikely to yield valuable AMS data for subsequent magma flow studies.
Magnetostratigraphy
The general AF demagnetization behavior of sedimentary rocks shows that 80% of the NRM is removed with a field of 25 mT. However, the predominance of steep normal inclinations (≈75°) across all late Oligocene to late Miocene units (375.00–750.67 m CSF-A) indicates that this remanence is caused by a large magnetic drilling overprint (Figure F49). Notwithstanding their higher NRM, the drilling overprint is partially removed but still present in most of the archive sections (Figure F55). This steep overprint is so strong that we are unable to remove it with in-line AF on the SRM, making paleoinclination data suspicious and preventing any reliable magnetostratigraphy to be established for both Holes U1502A and U1502B. This situation arises from (1) the use of the RCB coring system, which is known to impart a strong overprint (e.g., Richter et al., 2007), (2) the naturally weak NRM of sediments, and (3) the magnetically soft nature of the magnetic assemblage present in these sediments.
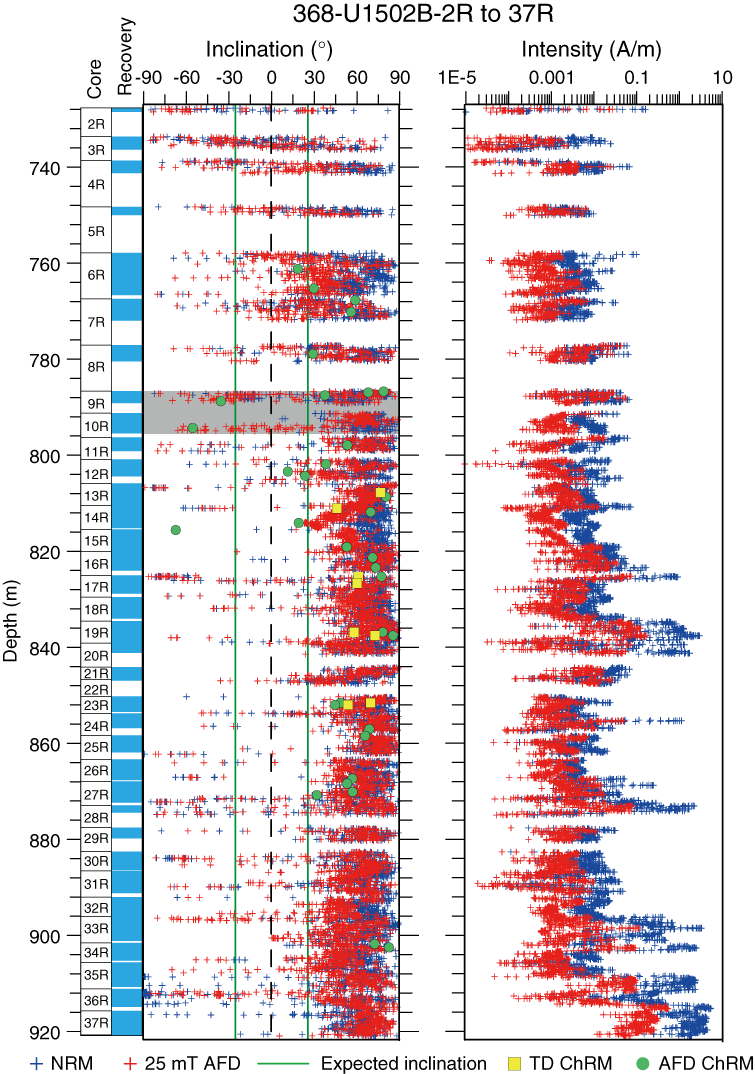
Figure F55. Paleomagnetic measurements.
The drilling overprint also considerably affects basalt. In several intervals between 728 and 920.8 m CSF-A, magnetic inclination displays negative values (Figure F55). However, the only data validating this magnetic reversal hypothesis occurs in Cores 368-U1502B-9R and 10R in two discrete samples (9R-2, 79–81 cm, and 10R-3, 16–18 cm). In this interval (gray shaded zone in Figure F55), the drilling overprint is less pervasive and the two discrete samples document both a normal (soft) component and a reversed (hard) component. Should this reversal be confirmed, it would imply that magmatic activity at Site U1502 lasted long enough to record a magnetic polarity reversal.
Geochemistry
Hydrocarbon gases were not abundant at Site U1502, and TOC, nitrogen, and sulfur contents were low, likely reflecting the poor preservation of organic matter. Instances of high carbonate content were associated with siderite and hydrothermal alteration, with siderite comprising greater than 50% of rock mass in parts of lithostratigraphic Subunit ID. The interstitial water at Site U1502 is enriched in Ca, Mg, K, and alkalinity and depleted in Na, Cl, and Br. The linear decrease and increase of major anion and cation contents, respectively, imply the upward diffusion of fluid from the deep sediment. Sediments within lithostratigraphic Unit I have some geochemical similarity to hemipelagic and pelagic units from Site U1501, but Site U1502 sediments have distinctively higher iron, potassium, and clay contents, likely due to patches of alteration resulting from different processes acting over various different timescales. Thus, the mechanisms and timing of iron enrichment do not need to be the same. Analyzed igneous rocks from lithostratigraphic Units II and VI (i.e., igneous lithologic Units 1 and 2) are all altered, and in general, samples from igneous Subunit 2b are altered to a lesser degree than those from igneous Subunit 2a.
Headspace gas
Headspace gas samples were taken at a frequency of one sample per core or per 10 m of drilling advance for routine safety monitoring to Core 368-U1502B-16R. Because of the absence of methane in previous samples and the nature of the igneous lithologies encountered, an operational decision was made to no longer collect headspace samples after this point. A small cluster of high methane values was encountered deeper than 650 m in an interval corresponding to a zone of intense siderite formation in lithostratigraphic Subunit ID, but at no point did hydrocarbon gas levels exceed the 5 ppmv detection limit. Traces of propene and butene were observed on chromatograms, but their occurrence was sporadic and not quantified.
Bulk sediment organic geochemistry
Lithostratigraphic Unit I
TOC, nitrogen, and sulfur levels were low in all samples collected from lithostratigraphic Unit I (TOC < 1 wt%, nitrogen < 0.1 wt%, and sulfur frequently less than detection limit) (Table T12; Figure F56). These levels likely represent the consequence of a bioturbated environment that was unfavorable for the preservation of high quantities of organic matter (Morris and Calvert, 1977). The low C/N ratios (C/N < 10) are consistent with organic carbon being derived from marine sources (Hedges et al., 1988) or with a very high level of thermal alteration.
Table T12. Carbon, nitrogen, and sulfur. View table in PDF format. Download table in CSV format.
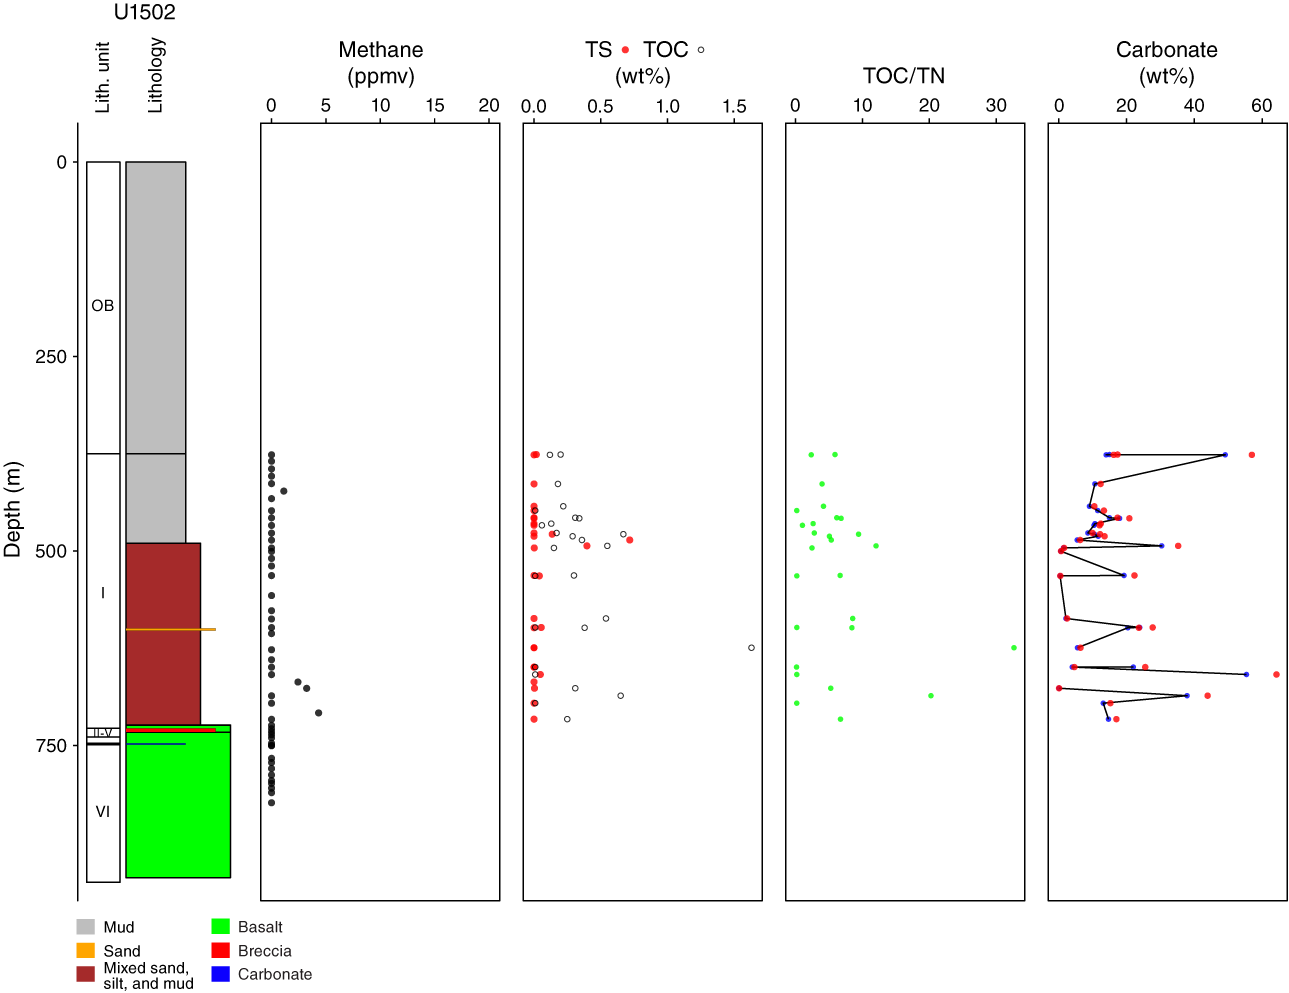
Figure F56. Carbon, sulfur, and TOC/TN.
Higher carbonate contents are found where greater quantities of siderite occur within sediments, such as in lithostratigraphic Subunits IB and ID. Siderite can affect the acid digestion–based assay used by IODP to estimate carbonate contents. In Figure F56, siderite-corrected values are shown as red circles (assuming 100% siderite) alongside calcite values (blue, assuming 100% calcite). Because TOC is determined by the difference between total carbon and carbonate carbon, the anomalously high value for TOC in Table T12 likely reflects underestimation of the amount of inorganic carbon present.
Crossplots (Figure F57) do not help discriminate different organic geochemical units on the basis of lithostratigraphic units. In most cases there is a cluster of values with one or two outliers, which could be a consequence of comparing similar depositional environments (e.g., the units are all the same from a geochemical perspective) or indicate that hydrothermal alteration has overprinted any variation by reducing organic carbon and nitrogen content to levels beneath which it can be accurately measured.
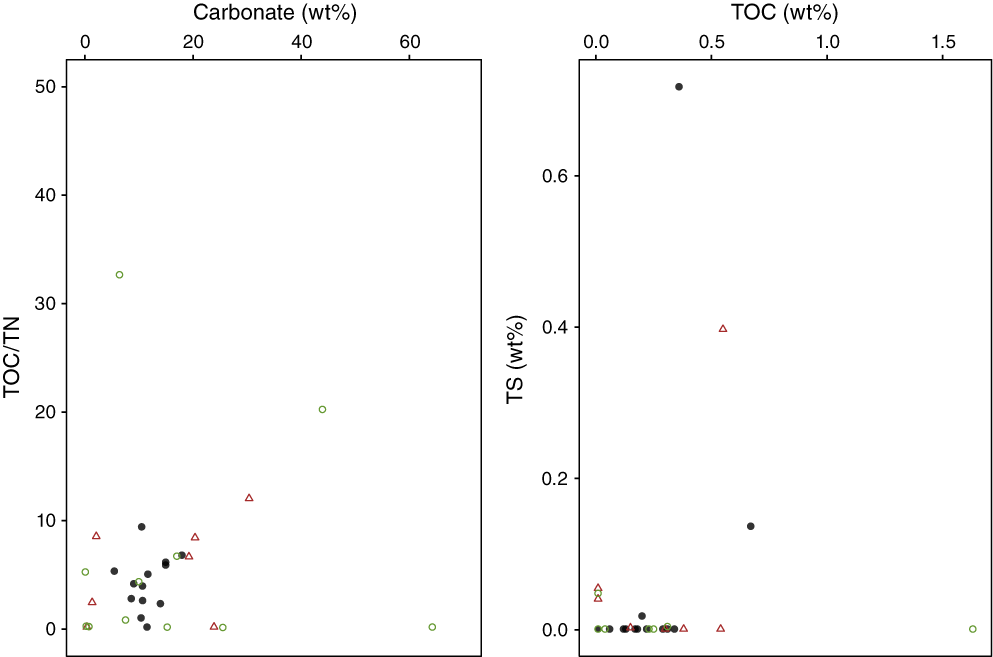
Figure F57. Organic geochemical parameters.
Lithostratigraphic Units II–VI
Only sporadic samples were collected from lithostratigraphic Units II–VI. These units are not organic carbon rich, and carbonate content is mostly low. The few instances of high TOC often correspond to carbonate-rich intervals, many of which are Fe, Mn, and Mg rich and could represent types of carbonate that are underestimated by the carbonate assay employed. The low sulfur content for some of these intervals may be unexpected given the prominence of pyrite within many cores. However, the metal content of most sulfides is high; thus, pyrite has a relatively low sulfur content in comparison to the mass of iron.
Raman and surface-enhanced Raman spectroscopy
Because of time and resource constraints, Raman measurements were not performed at this site.
Interstitial water chemistry
We collected 19 whole-round samples (15–20 cm long) for interstitial water measurements in Hole U1502A. For Cores 2R through 33R, 15 cm long samples were squeezed for interstitial water and yielded ~15 mL per sample. For Cores 34R and 35R (15 cm long) and 37R (20 cm long), whole-round samples yielded <8 mL of interstitial water per sample and even then only after squeezing for durations longer than 8 h. Interstitial water geochemical parameters are listed in Table T13 and presented by depth in Figure F58.
Table T13. Interstitial water analyses. View table in PDF format. Download table in CSV format.
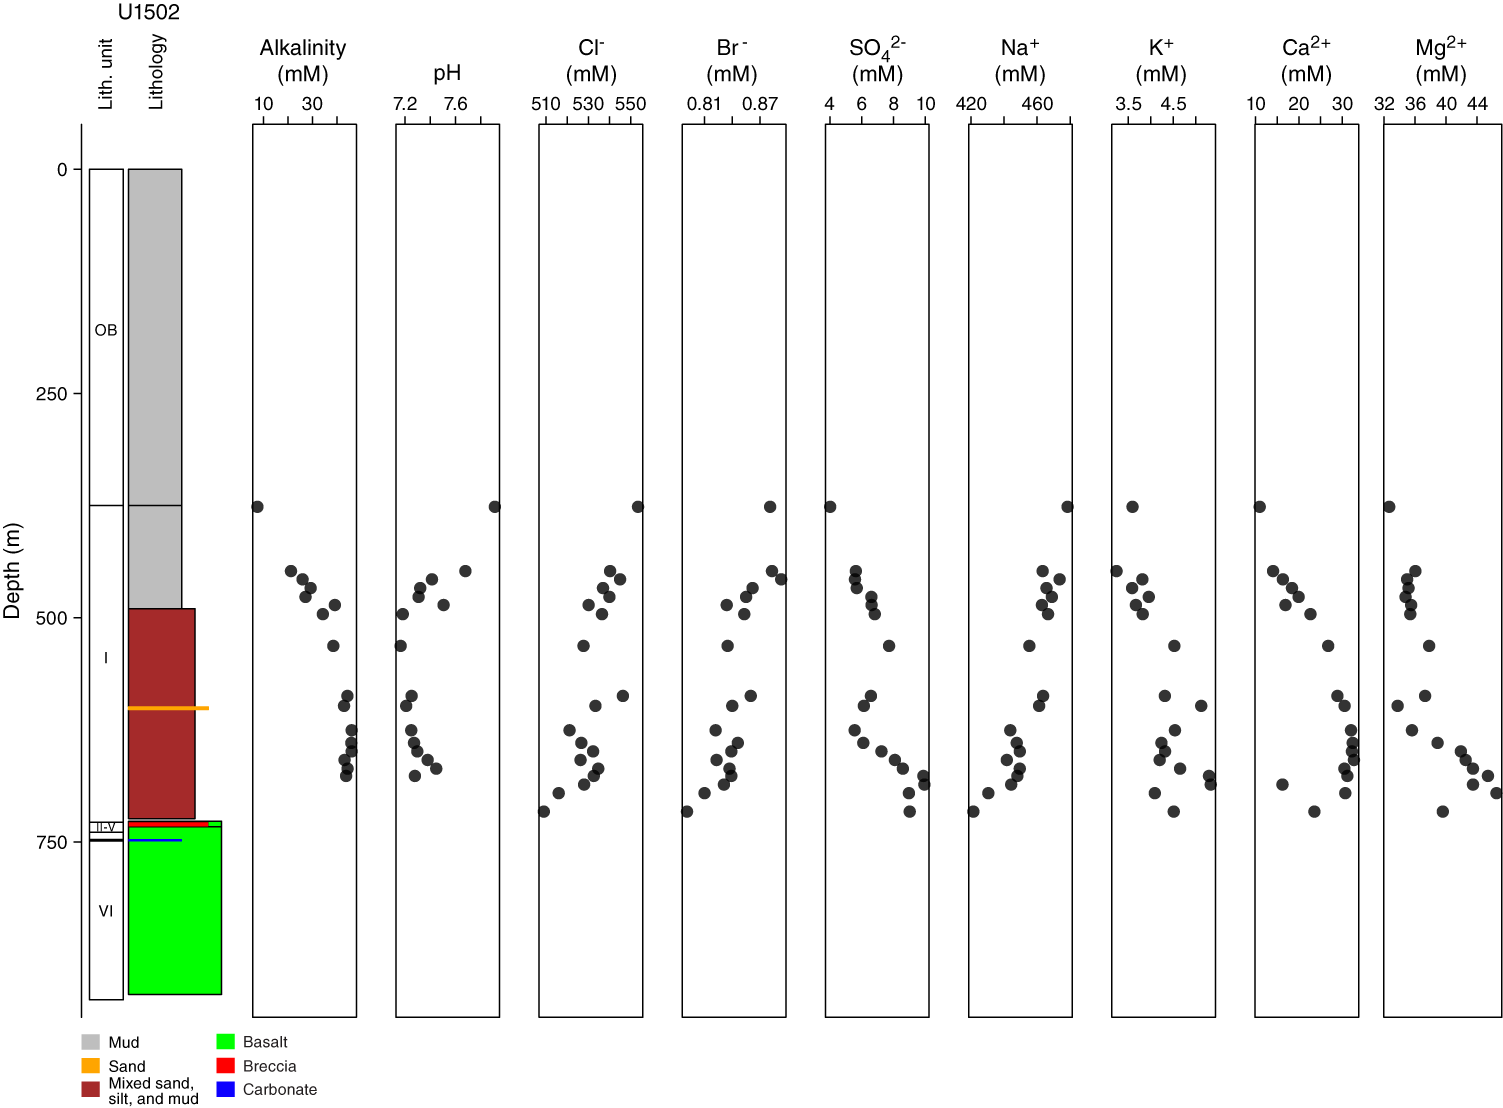
Figure F58. Interstitial water alkalinity, major cations, and anions.
No samples were obtained from depths shallower than 376.39 m (Section 2R-1) because this section was not cored (see Operations); therefore, in the following discussion comparisons are made to geochemical data from Holes U1499A and U1501C to set the data in context. In Hole U1502A, alkalinity increases linearly with depth from 7.6 to 45.9 mM. The maximum alkalinity was measured at 625 m, and the remaining measurements are constant at ~45 mM. In Hole U1501C, the alkalinity is at least 10 times greater than that found at the equivalent depth in Hole U1502A. At the same time, pH in Hole U1502A is lower than in Holes U1501C and U1499A, ranging from 7.2 to 7.9. The pH value decreases sharply from 376 to 531 m and is 7.3 at the bottom of the hole. Sulfate concentrations range from 4.0 to 9.9 mM with an increase from Core 2R to Core 37R. The bottom water in Hole U1502A is thus enriched in alkalinity and sulfate and has a higher pH than both modern seawater and most other interstitial water obtained in the region.
The chlorinity, bromide, and sodium depth profiles are similar; there is a 10% decrease from Core 2R to Core 37R (Figure F58). The uppermost sample from Core 2R is similar to modern seawater (Cl = 569 mM; Br = 0.89 mM; Na = 478 mM), whereas the bottom sample from Core 37R has low values of Cl (509 mM), Br (0.79 mM), and Na (421 mM). The decreased chlorinity, bromide, and sodium are similar to the “freshwater” in interstitial water Zone 3 in Hole U1501C.
Contrary to the halide anions, Ca, Mg, and K concentrations increase with depth (Figure F58). The calcium concentration ranges from 11 to 32.7 mM; the maximum is about three times that of modern seawater (10.5 mM). K concentrations vary between 3.2 and 5.3 mM; the maximum concentration is twice that found at similar depth samples in Holes U1501C and U1499A.
Dissolved strontium concentrations range from 61.9 to 144 μM and decrease with increasing depth, in contrast to the chemically similar Ca and Mg (Ca, Mg, and Sr covary in Hole U1499A). Interstitial water Sr concentration is often controlled by the dissolution of biogenic calcite. The minimum Sr concentration (61.9 μM) at 676 m is lower than modern seawater and corresponds to elevated Ca and Mg.
Concentrations of Fe, Si, and Li vary in a similar way and generally increase with depth. Dissolved Fe concentrations range from 1.68 to 102.3 μM in the 477–716 m interval. The maximum Fe (102.3 μM) at 676 m corresponds to maximum values of Si, Mg, and Ca. The abnormally high Fe is likely related to the dissolution of mafic minerals within the basalt. Silica concentrations increase from 250 to 1182 μM in Hole U1502A and are much higher than both modern seawater (0–180 μM) and Hole U1499A (280–822 μM) contents. The dissolved Si profile reflects lithology and silicate mineral diagenesis. Lithium concentrations increase linearly from 91 μM at 376 m to the maximum of 855 μM at 695 m, which is higher than the Li concentration at Site U1499 (13.7–31.2 μM).
Dissolved Mn concentrations increase from 1.14 to 47.73 μM to the bottom of the hole.
Bulk sediment and rock geochemistry
The following sections describe sediments and igneous rock geochemistry based on ICP-AES analysis. Compositions are reported in Table T14.
Table T14. Major element oxide and trace elements. View table in PDF format. Download table in CSV format.
Lithostratigraphic Unit I
Site U1502 sediments have high and variable Fe2O3 contents (2.81–38.59 wt%) that are significantly higher than those at Site U1501 (Figure F59). Manganese is also enhanced (MnO = 0.01–1.49 wt%), with the highest contents found in carbonate-rich intervals, likely a result of the presence of Mn within siderite-rich intervals. PCA was used to compare sediments at Sites U1501 and U1502 (Figure F60) and shows some overlap with the oozes and hemipelagic mudstones (lithostratigraphic Units I and II at Site U1501), indicating unaltered samples. However, the greatest difference between the sediment samples is the proportion of K, Na, and Al (PC1) and the proportion of Si (PC2) (see Table T15). Some of the samples from Site U1502 contain notably more K, Al, and Ti (as well as Fe, although this was not included in the PCA), although by no means all of them. Given the hydrothermal alteration observed at this site, the enrichment of these elements in some of the sediment samples could reflect a clay or carbonate zone within an epithermal hydrothermal system (a low-temperature zone of phyllosilicate and carbonate formation; Sillitoe and Hedenquist, 2003), an increased proportion of clays in a depositional environment far from siliciclastic sources (Heezen and Hollister, 1972), poor preservation of siliceous fossils, or a combination of these processes. Lesser Ca contents within carbonate intervals may be the result of hydrothermal alteration and replacement by Fe, Mn, and Mg.

Figure F59. Major oxide composition.
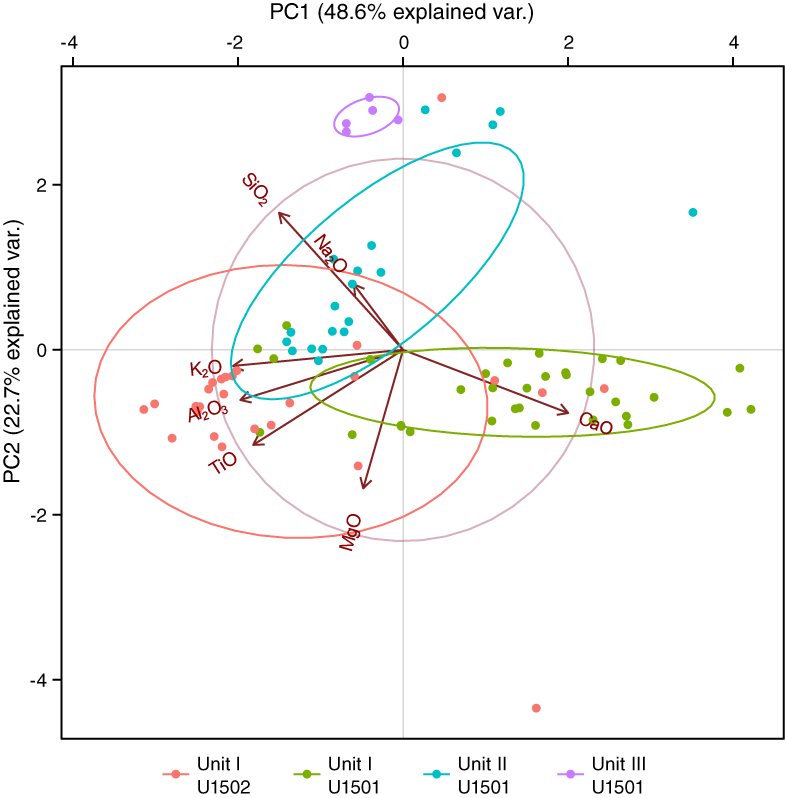
Figure F60. Principal component analysis data.
Table T15. Major element oxide variance. Download table in CSV format.
Lithostratigraphic Units II and VI (igneous lithologic Units 1 and 2)
Major element oxides and minor element concentrations were normalized to TiO2, which is thought to be constant during aqueous alteration processes (Staudigel, 2014). To provide a frame of reference, the resulting element ratios are plotted next to samples from IODP Expedition 349 Sites U1431, U1433, and U1434 in Figure F61.
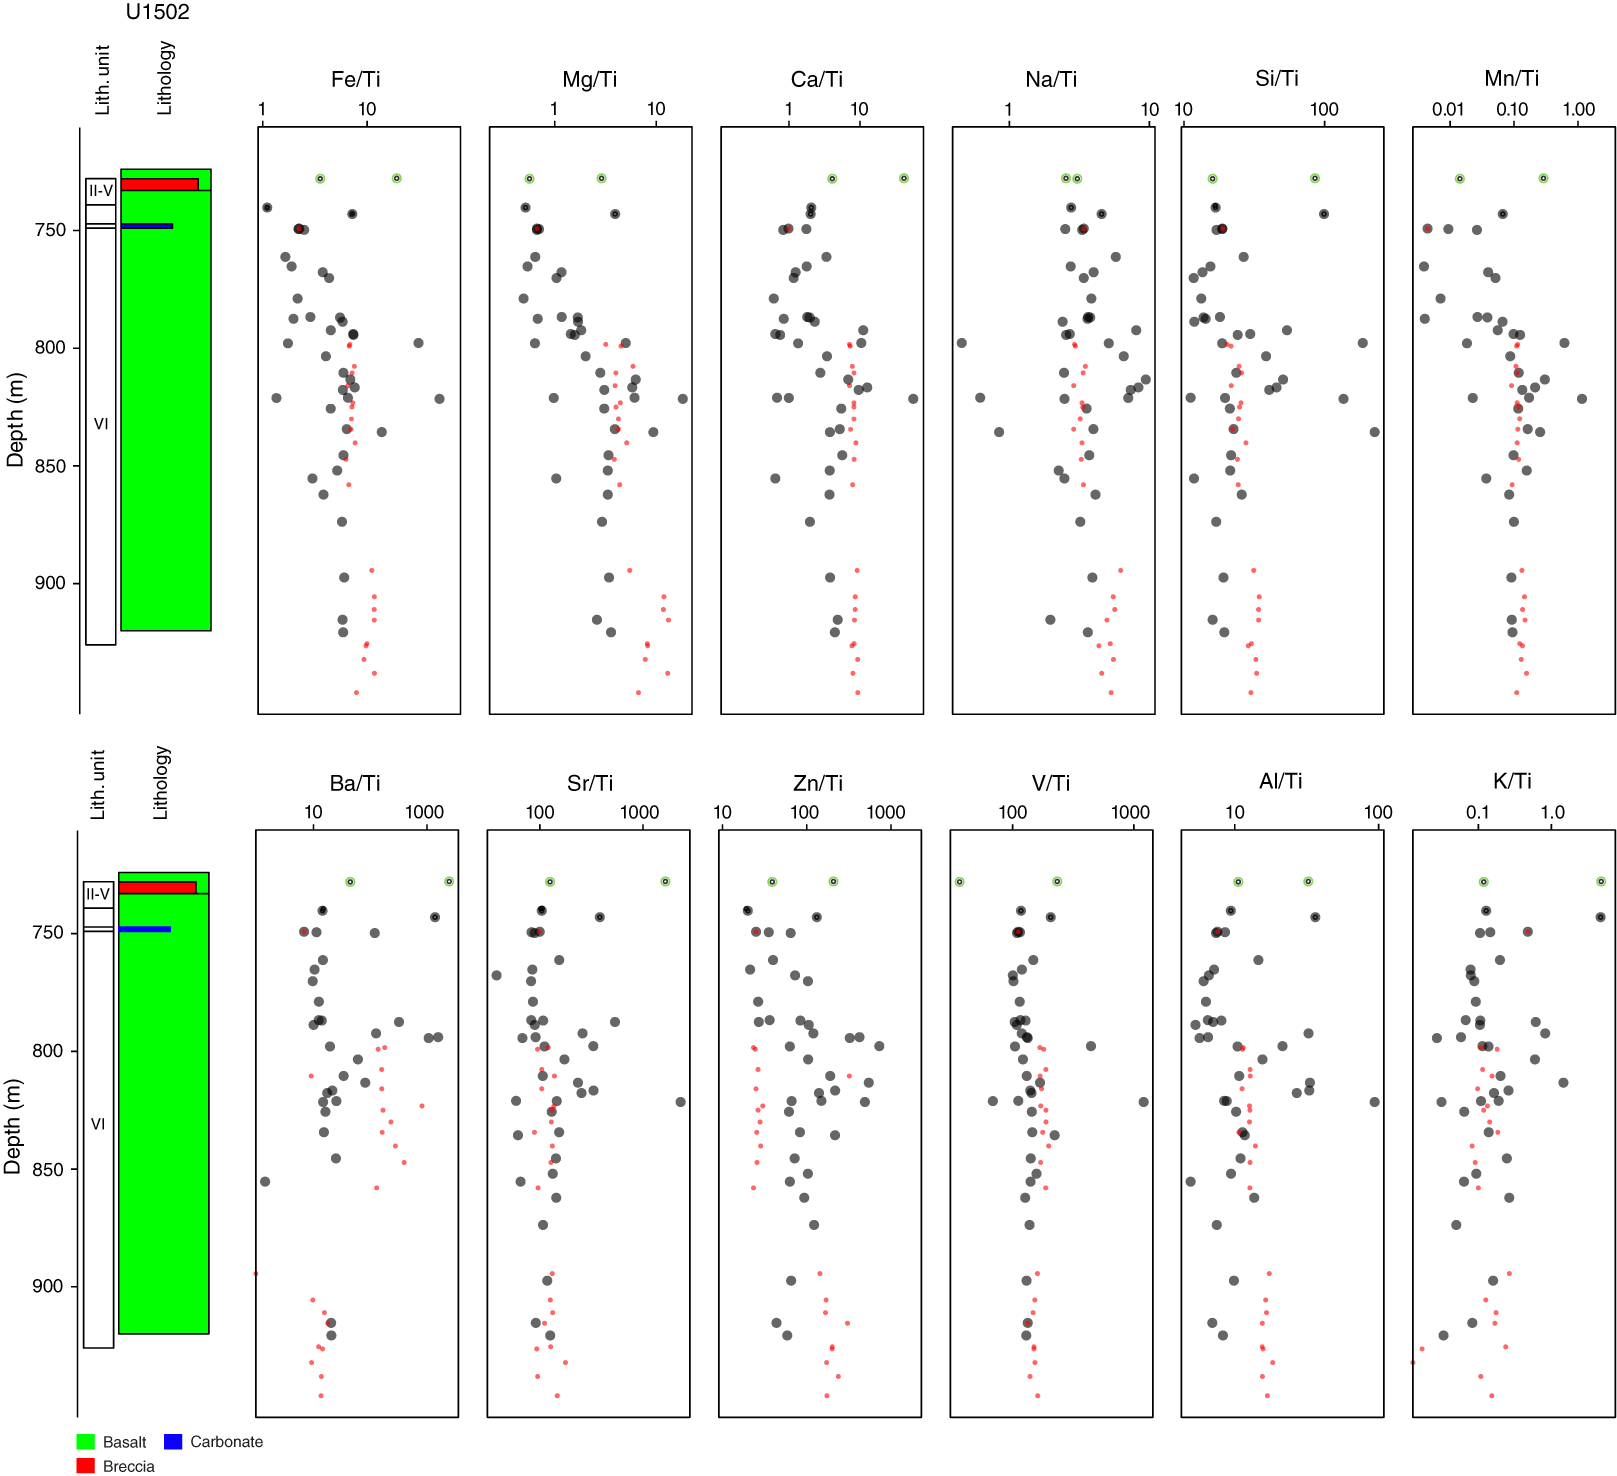
Figure F61. Ti-normalized major element oxide and minor element concentrations.
When considered as a depth profile, a significant boundary appears to separate the samples into two groups of basalts at around 797.9 m (interval 368-U1502B-11R-2, 18–20 cm). This interval roughly corresponds with the boundary between igneous Subunits 2a and 2b (~801.55 m). Samples from shallower than 797.9 m are depleted in Fe, Mg, and Mn compared to those from deeper than 797.9 m (797.9–920.8 m). Also, these elements reveal lower contents than those of samples from fresh/less altered basalts from Expedition 349 (Figure F61). This depletion is less pronounced with depth. The Site U1502 basalts recovered from shallower than 797.9 m are also slightly less enriched in Ca, Si, Al, and subordinate V.
Na and K vary mostly within the ranges observed for fresher basalts from the study area, except for the 727.9–821.5 m interval (Figure F61). Ba, Sr, and Z are generally enriched relative to the samples of fresh/less altered basalts from the study area, which reflects the presence of veins rather than demonstrating a primary geochemical feature. Overall, when normalized to TiO2, there are differences in the degree of alteration between igneous Subunits 2a and 2b; rock samples from igneous Subunit 2b suffered less alteration than those from igneous Subunit 2a.
Acidic interstitial water was encountered in overlying sediments, and if taken as representative of water from deeper sections could indicate the potential for metasomatic alteration. Fe, Mg, Mn, and Al could all be mobilized by the dissolution of Fe-, Mg- or Al-bearing silicates such as olivine, pyroxene, and plagioclase (Pirajno, 2009). The likely products of such alteration are chlorite, phyllosilicates, and zeolites.
Discussion
To gain insight into the nature of authigenic mineralization in Hole U1502A, a 1-D material balance was performed (e.g., results are returned as grams Fe2O3 per square centimeter). The net gain or loss in Fe2O3 was calculated by making a comparison to Site U1501 in terms of sediment, to Site U1500 with respect to the basalts, and to shallower samples from Site U1501 in the case of interstitial water. For a given unit, the 1-D concentration was calculated as
where [Fe]balance is the net gain or loss in grams Fe per square centimeter for a given unit, [Fe]U1502 is the measured iron content of a unit (grams Fe per square centimeter) at Site U1502, and [Fe]ref is the expected Fe content based on the lithologic points of reference listed above.
Fe contents per unit area were obtained using
where ρ is the average moisture and density (MAD) density within a given interval (in grams per cubic centimeter), h is the length of a given interval (in centimeters), and %Fe2O3 is the Fe content of a given interval expressed as a fractional content from 0 to 1. The results are displayed in Figure F62.
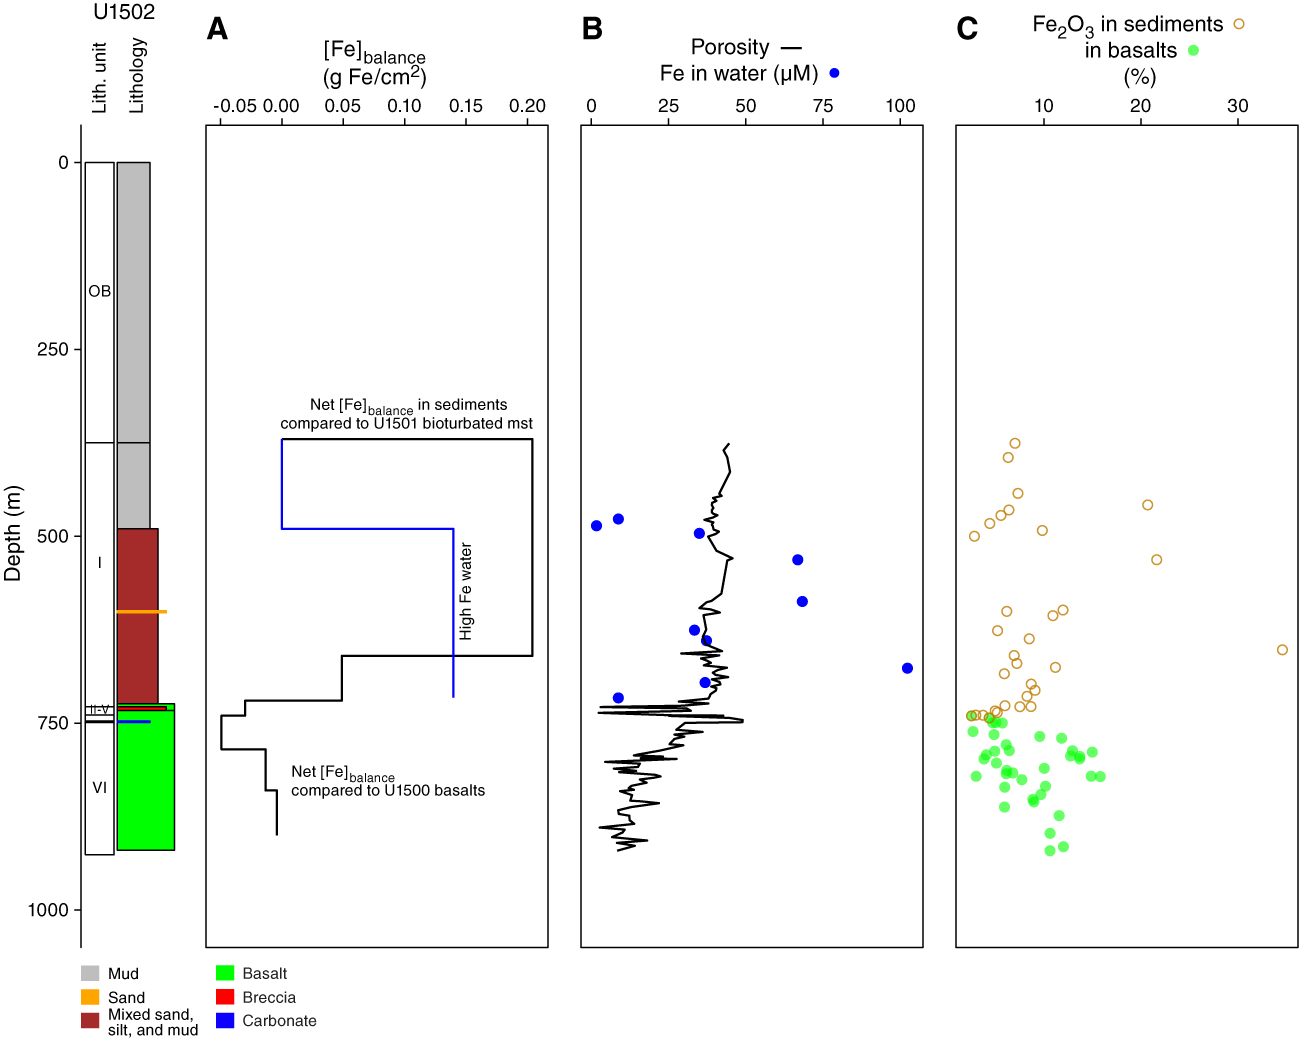
Figure F62. Ti-normalized major element oxide and minor element concentrations.
Interstitial water present in lithostratigraphic Subunits IA–IC and in intervals with a high siderite content is greatly enriched in Fe. The base of the interval spanning lithostratigraphic Subunits IA–IC coincides with Fe-enriched interstitial water that is consistent with instances of very low porosity that likely indicate hydraulic barriers that bound the interstitial water body. On a 1-D basis, it would be difficult to account for the high Fe content within the interstitial water by dissolution of the basalts at the top of lithostratigraphic Unit VI because of the magnitude of Fe involved.
The basalts at the top of lithostratigraphic Unit VI (igneous lithologic Unit 2) are depleted in Fe but are not significantly depleted in Fe at the bottom of the recovered volcanic section, implying not that these basalts are not altered or depleted relative to Ti or in terms of their mineralogy, but that relative to the area of the rock the net depletion in Fe is slight. The slightness of the depletion may reflect the presence of Fe within the basalts in the form of sulfides or veins that precipitated from water not enriched in dissolved Ti (Staudigel, 2014). The level of Fe enrichment in sediment immediately above the basement (lithostratigraphic Subunit ID) is of a similar magnitude to the loss of Fe from the shallower basalt units. Compared to the upper part of lithostratigraphic Unit I, it is more reasonable that Fe mineralization within the lower part is genetically linked to the Fe depletion in parts of lithostratigraphic Unit VI.
These considerations represent a 1-D approximation and thus do not enable implications for structure, sedimentary architecture, or the geological history of the site. Therefore, they would not apply if the Fe was released from basalts significantly before the deposition of lithostratigraphic Unit I or if the precipitation of Fe occurred only within a small area yet leached from a greater area.
Physical properties
Physical properties were measured on cores from Holes U1502A (375–758.2 m) and U1502B (727.7–920.8 m). Magnetic susceptibility, gamma ray attenuation (GRA) bulk density, and P-wave velocity were measured on the whole-round cores using the Whole-Round Multisensor Logger (WRMSL) at a 2 cm interval. NGR was then measured on whole-round cores with the Natural Gamma Radiation Logger (NGRL). Color reflectance and point magnetic susceptibility were measured on all archive-half sections. P-wave velocity was also measured along the x-axis with the P-wave caliper (PWC) system on working-half sections with liner and on discrete samples without liner. MAD measurements were performed on discrete samples taken at a sampling resolution of one every other section per core. Thermal conductivity measurements were performed on the third section of every core. Based on the variations of physical properties, four petrophysical (PP) units were distinguished at Site U1502 (Figure F63):
- PP Unit 1 (375–740 m in Hole U1502A),
- PP Unit 2 (740–750 m in Hole U1502A and 727.7–740 m in Hole U1502B),
- PP Unit 3 (740–808 m in Hole U1502B), and
- PP Unit 4 (808–920 m in Hole U1502B).
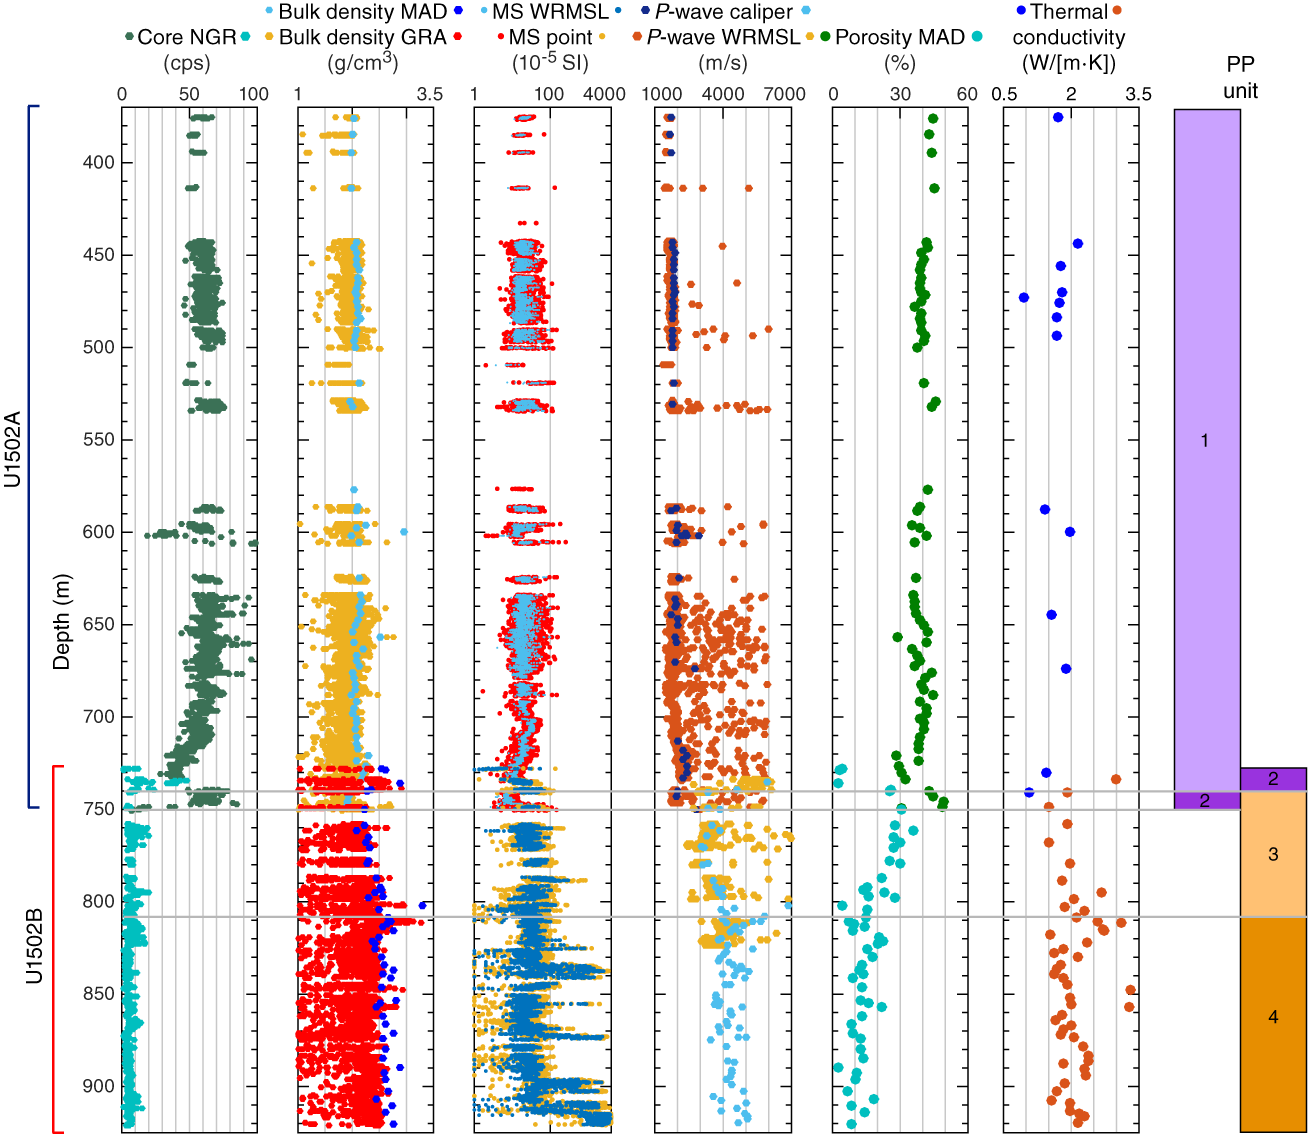
Figure F63. Physical properties, Holes U1502A and U1502B.
PP Unit 1 is characterized by slight increases with depth in bulk density (average = 2.1 g/cm3) and P-wave velocity (average = 1950 m/s) and NGR values of 50–70 counts/s. PP Unit 2 lies immediately above the basaltic basement and is defined in both holes by a variety of different lithostratigraphic units. PP Unit 2 in Hole U1502A is marked by lower P-wave velocity and bulk density and higher NGR values than overlying PP Unit 1. The base of PP Unit 2 is marked by a sharp decrease in NGR in both holes (Figures F63, F64). PP Units 3 and 4 represent the basaltic basement and are characterized by relatively low NGR (<10 counts/s) and a wider range of P-wave velocities (3000–5000 m/s). The interface between PP Units 3 and 4 is marked by an abrupt increase in density, P-wave velocity, and thermal conductivity and corresponds to the boundary between igneous Subunits 2a and 2b (see Igneous and metamorphic petrology).
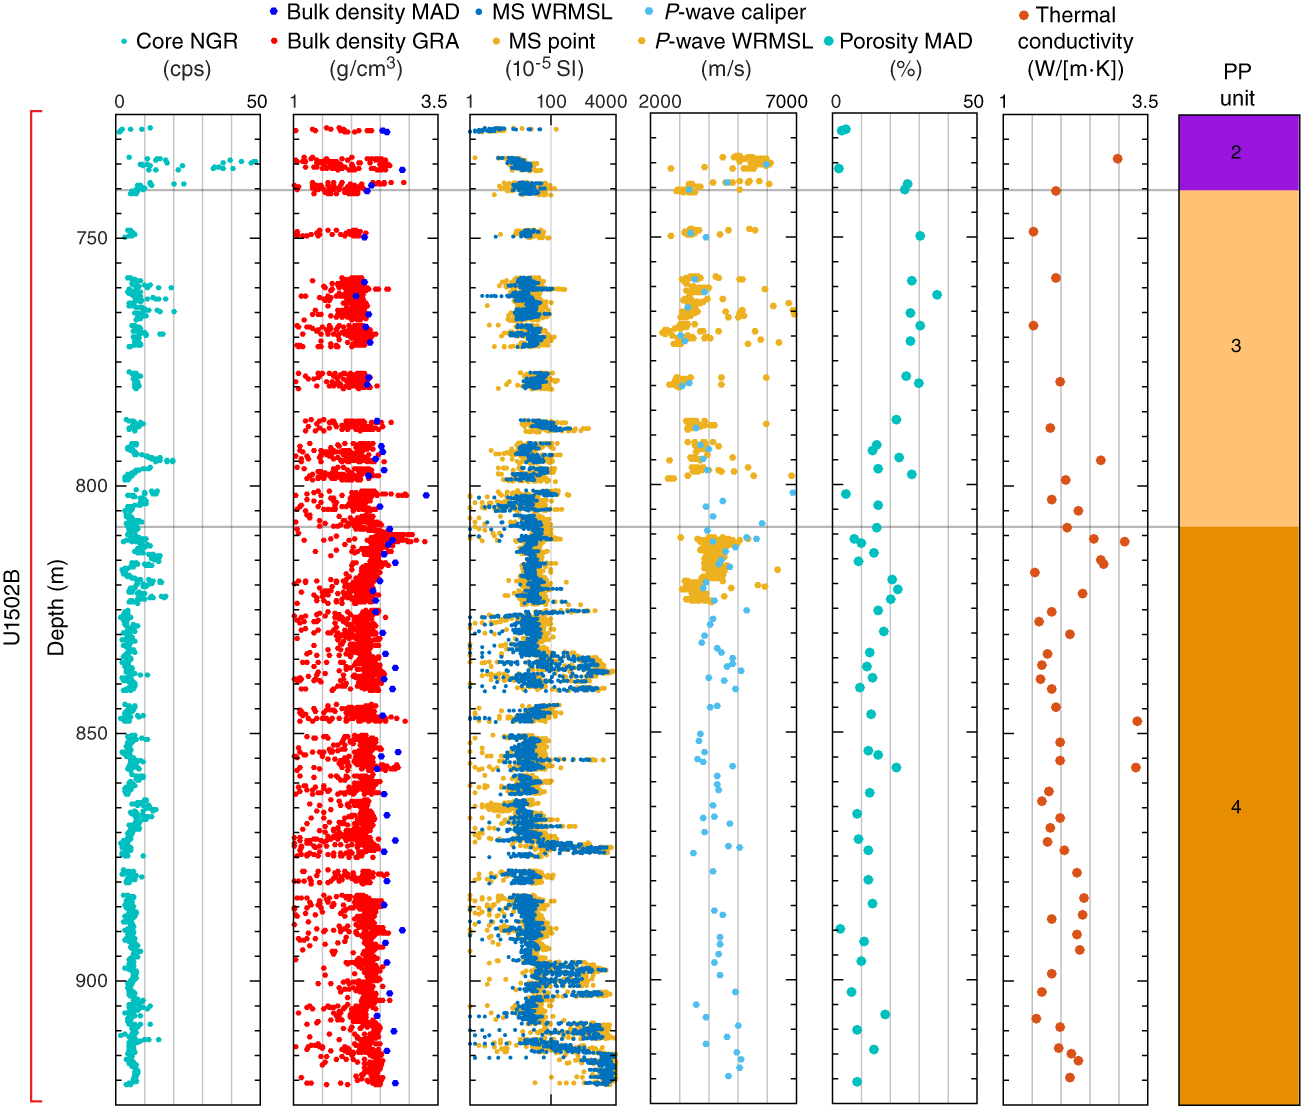
Figure F64. Physical properties, Hole U1502B.
Natural gamma radiation
In PP Unit 1, NGR counts generally range between 50 and 70 counts/s with two exceptions (Figure F63). The first is a decrease in NGR at ~600 m to ~30 counts/s. The second interval starts at ~710 m, where NGR begins to decrease with depth, reaching ~35 counts/s at ~730 m, close to the top of PP Unit 2. PP Unit 2 is characterized by high NGR (70 counts/s) that decreases sharply near the base of this unit.
PP Unit 3 is characterized by relatively low NGR (3–10 counts/s) that decreases slightly with depth (Figures F63, F64). At 735 m, close to the top of PP Unit 3, a spike in NGR to ~50 counts/s correlates with high P-wave velocity. Numerous smaller excursions in NGR values are present between 760 and 825 m. In contrast, deeper than 825 m (PP Unit 4), NGR values show only small-scale variations and remain less than ~5 counts/s.
Concentrations of K, U, and Th were estimated using the NGR counts and bulk density measurements for Hole U1502A according to the methods by De Vleeschouwer et al. (2017). Overall, element concentrations have trends similar to the total NGR counts per second values (Figure F65).
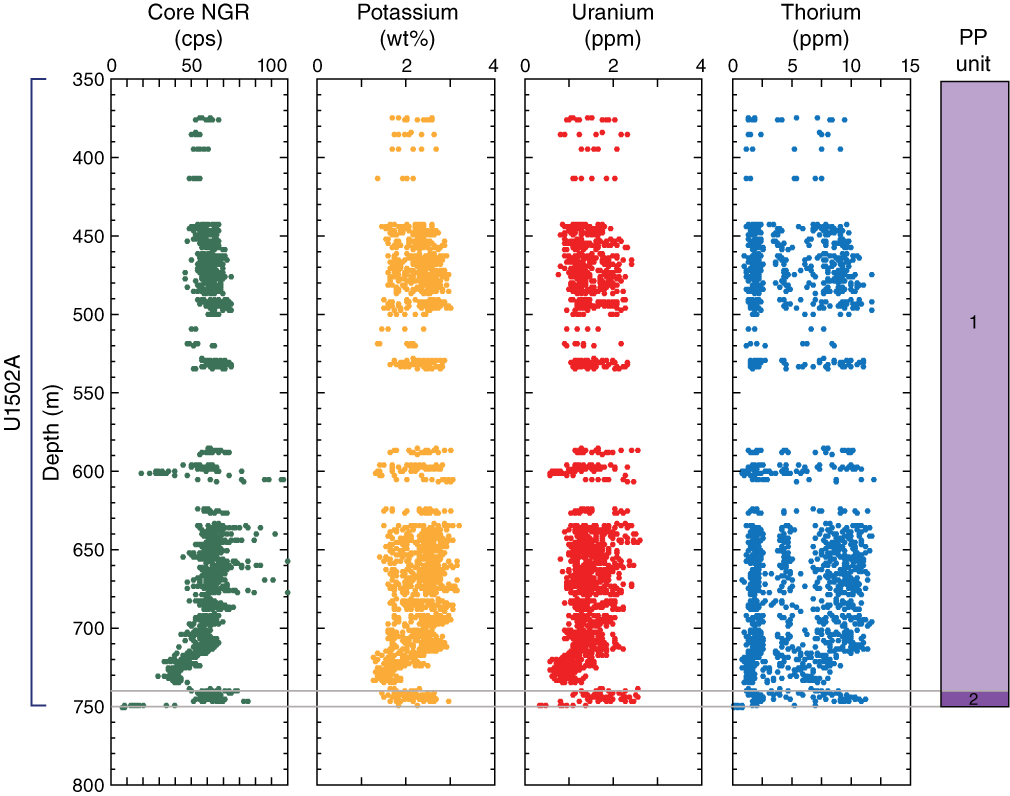
Figure F65. NGR measurements.
P-wave velocity
Descriptions of variations in P-wave velocity are based on measurements made with the PWC system because measurements on the whole-round cores are more scattered due to the space between the core and core liner. In PP Unit 1, P-wave velocities increase gradually from 1735 m/s at ~375 m to ~2000 m/s at 715 m (Figure F63). This trend is interrupted by a spike in velocity at ~600 m to ~2910 m/s. Another spike in velocity occurs in the lowermost section of Hole U1502A, where velocity increases to ~2500 m/s over a narrow depth range (715–725 m). Below this interval, velocity rapidly decreases to ~1995 m/s at 740 m, marking the top of PP Unit 2. At the base of PP Unit 2 (~750 m), P-wave velocity increases abruptly to 2810 m/s.
In contrast to Hole U1502A (375–750 m), where P-wave velocity is consistently <3000 m/s, velocities in Hole U1502B (727.7–920.8 m) all exceed 3000 m/s (Figure F64). Two main intervals were observed in Hole U1502B: a shallower interval at 740–795 m in basaltic basement (PP Unit 3; see Lithostratigraphy) with velocities in the 3000–4000 m/s range, and a deeper interval (PP Unit 4) starting at ~800 m with velocities that generally exceed 4000 m/s.
Thermal conductivity
Thermal conductivity within PP Unit 1 varies between ~0.98 and ~1.90 W/(m·K) (Figure F63). A slight decrease in values from 1.5 to 1.1 W/(m·K) was observed at the bottom of PP Unit 1. A gradual increase in PP Unit 3 (740–808 m) from 1.9 to 2.3 W/(m·K) is followed by a sharp increase to 2.7 W/(m·K) at the boundary with PP Unit 4. Thermal conductivity decreases to 1.6 W/(m·K) in the upper portion of PP Unit 4 (843 m) (Figure F64) and averages ~2.2 W/(m·K) to the bottom of the unit. Two elevated thermal conductivity measurements (~3.2 W/[m·K]) were observed at 848 and 857 m.
Density and porosity
In general, bulk density determined from discrete samples agrees well with those obtained from GRA on the whole-round cores (Figure F66). However, GRA bulk density displays large variations throughout Holes U1502A and U1502B because of space between the core and core liner. Thus, the following descriptions of variations in bulk density are based on measurements from discrete samples. Bulk density increases slightly with depth in PP Unit 1, varying from 1.9 to 2.3 g/cm3. Porosity decreases from 45% to 35% with depth and shows a good negative correlation with bulk density. Grain density remains relatively constant at 2.8 g/cm3. At 725 m, bulk density increases from 2.1 to 2.3 g/cm3 and dry density increases from 1.7 to 1.9 g/cm3. A sharp shift toward lower values at the bottom of this interval (740 m) marks the boundary with PP Unit 2. Densities then decrease slightly with depth to the bottom of PP Unit 2.
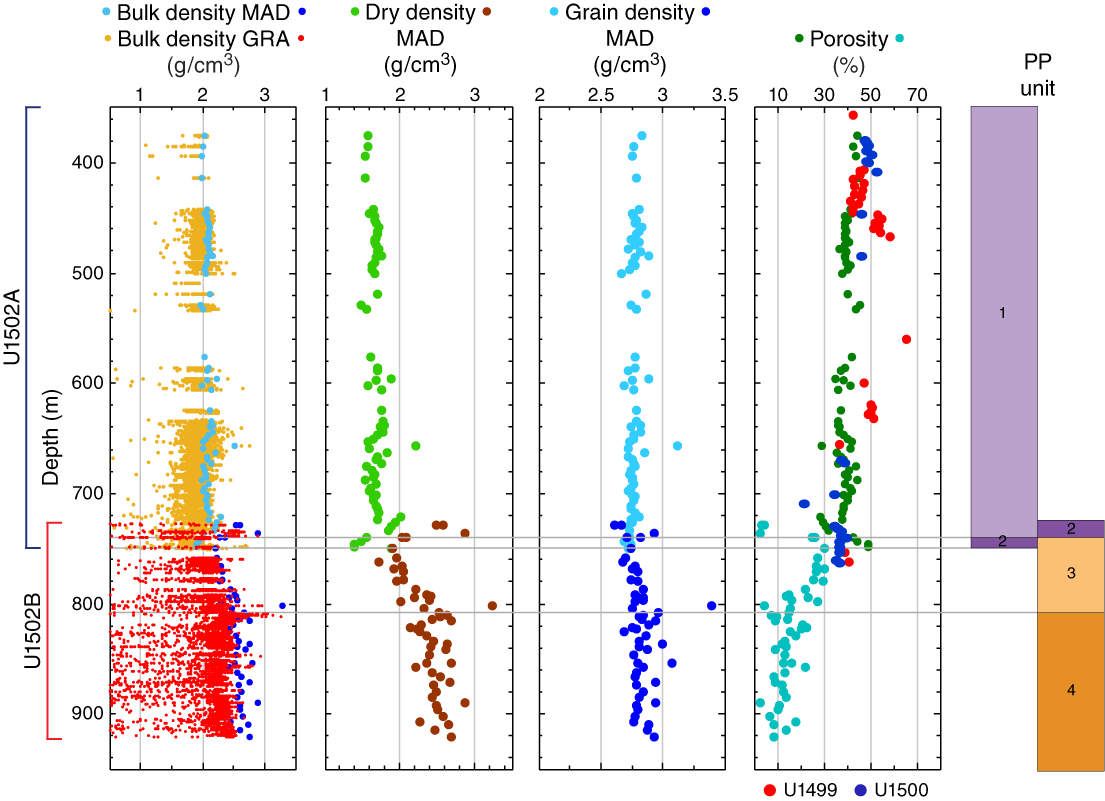
Figure F66. Density and porosity.
Bulk density in PP Unit 3 varies between 2.1 and 2.6 g/cm but generally increases with depth (Figure F66). Porosity fluctuates between 5% and 35% but decreases overall downhole.
The boundary between PP Units 3 and 4 is marked by a sharp increase followed by a drop in bulk, dry, and grain densities from 2.5 to 2.7 g/cm3, 2.3 to 2.5 g/cm3, and 2.8 to 3.0 g/cm3, respectively. Grain, bulk, and dry densities in PP Unit 4 are slightly more variable, ranging from 2.7 to 3.0 g/cm3, 2.4 to 2.8 g/cm3, and 2.1 to 2.7 g/cm3, respectively. Bulk and dry densities increase slightly with depth throughout PP Unit 4.
Color reflectance spectrophotometry
L* values in PP Unit 1 remain relatively constant with an average of 40 and abruptly increase to 60 at the onset of PP Unit 2 (Figure F67). Throughout PP Units 2–4, L* values fluctuate between 20 and 70 without any general trend. From 375 to 675 m, reflectance parameters a* and b* show relatively narrow ranges of ~0–5 and approximately –4 to 2, respectively. Toward the lower portion of PP Unit 1 (~675–740 m), a* and b* display high values of ~5–10 and ~0–10, respectively, corresponding to the interbedded brownish and reddish clay (see Lithostratigraphy). The beginning of PP Unit 2 is marked by a rapid decrease in a* and b* followed by an overall decreasing trend through PP Units 2–4.

Figure F67. Sediment color reflectance.
Magnetic susceptibility
Magnetic susceptibility varies between ~10 × 10−5 and 100 × 10−5 SI in the upper portion of PP Unit 1 without any general trend, and the fluctuations are relatively muted and narrow to 5 × 10⁻⁵ to 40 × 10−5 SI between ~700 and 740 m (Figure F63). Throughout PP Units 3 and 4, magnetic susceptibility generally has a narrow range between ~10 × 10−5 and 80 × 10−5 SI (Figure F64), except for the intervals where it peaks to ~2000 × 10−5 to 4000 × 10−5 SI (~835–842, 855–855.4, 872–875, 896–903, 908–912, and 914–921 m).
RGB color values
Red, green, blue (RGB) values are generally constant with depth in PP Unit 1 (Figure F68). A marked increase in RGB from 100 to 150 occurs in the lower portion of PP Unit 1 (~725 m) and is related to the presence of brownish nannofossil-rich clay in the sediment cores (see Lithostratigraphy). RGB decreases in PP Unit 2 (740 m), marking a transition to dark gray biosiliceous clay over this interval (see Lithostratigraphy). RGB increases in PP Units 3 and 4 to between 100 and 200.
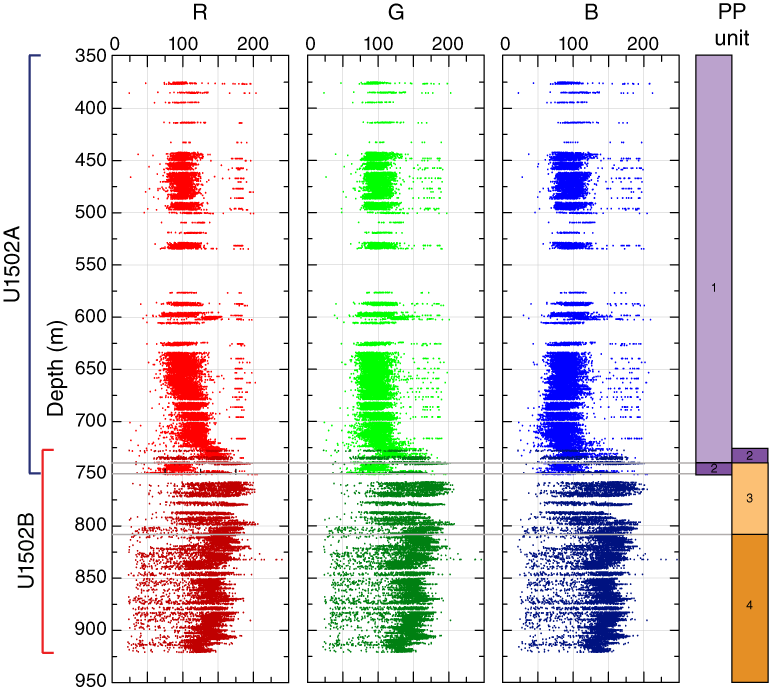
Figure F68. RGB values.
Discussion and summary
The trends of physical properties allow us to characterize four petrophysical units at Site U1502. PP Unit 1 (375–740 m) reflects nannofossil- and biosiliceous-rich clay lithologies (see Lithostratigraphy) and exhibits small-scale changes in NGR values between 50 and 70 counts/s and uniformly increasing P-wave velocities with depth that are <2500 m/s. PP Unit 1 sediments have porosities similar to those recorded at nearby Sites U1499 and U1500 in the same depth interval, suggesting the same compaction history. A significant increase in bulk density (up to 2.7 g/cm3) was observed in Core 368-U1502B-3R and is associated with strongly lithified limestone beds (Figure F69A). Variations of high and low magnetic susceptibility values correspond to sediment color changes in PP Unit 1 (Figure F69B) and may be controlled by the amount of pyrrhotite within the sediment (Tauxe, 2010; see Paleomagnetism).
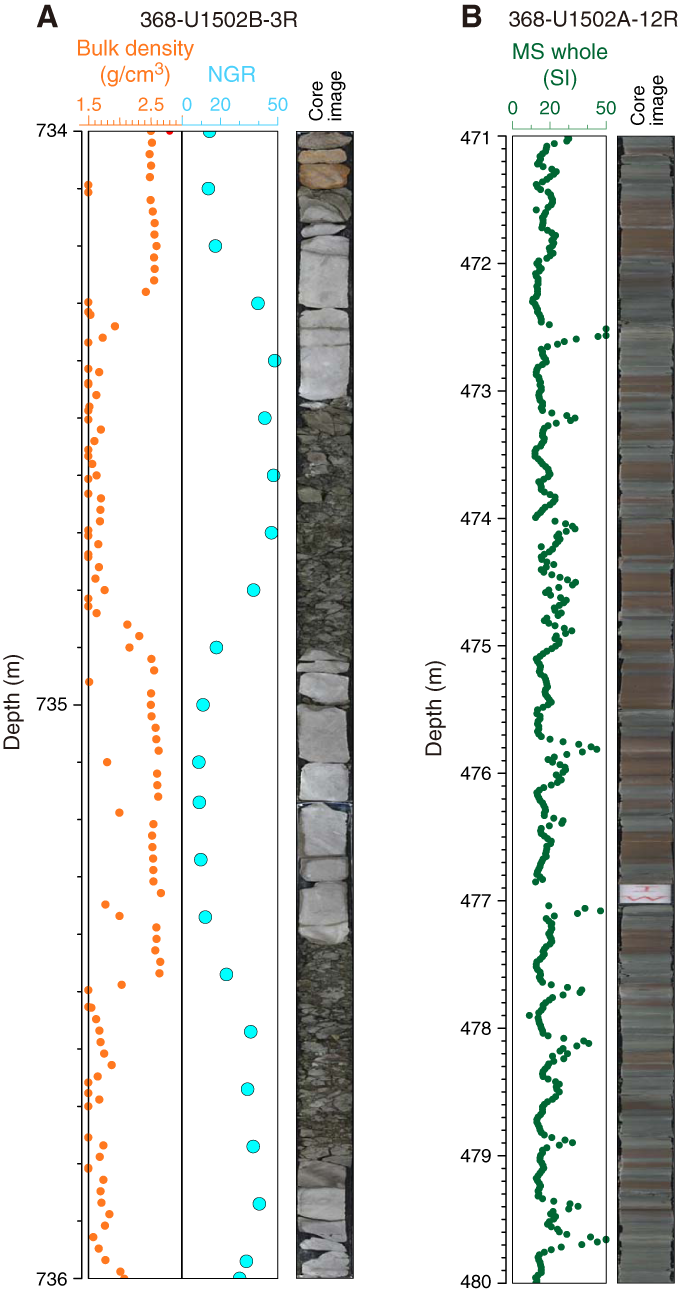
Figure F69. Sediment physical properties and lithology comparison.
PP Unit 2 (740–750 m) in Hole U1502A is characterized by lower P-wave velocities and bulk densities and higher gamma ray readings than the strata above. Low densities and P-wave velocities suggest that PP Unit 2 is less compacted and highly saturated with pore water.
PP Units 3 and 4 represent the basaltic basement and are characterized by relatively low NGR values (<10 counts/s), high densities, and P-wave velocities that vary over a broad range (3000–6000 m/s) (Figure F64). The boundary between PP Units 3 and 4 is marked by an abrupt increase in physical properties (i.e., density, P-wave velocity, and thermal conductivity) and coincides with the change from igneous Subunit 2a to 2b (Figures F64, F65, F66; see Igneous and metamorphic petrology). Prominent peaks of magnetic susceptibility (up to 4000 × 10−5 SI) in PP Units 3 and 4 correspond to relatively less altered basalt. Reflectance L* from these basalt layers records the lowest values in PP Unit 4, reflecting the dark nature of the less altered basalts. Thermal conductivities in PP Units 3 and 4 are variable but with an overall increasing trend, in line with the decreasing porosities with depth (Figure F64).
Downhole measurements
Logging operations
Two downhole logging strings were run in Hole U1502B. The first string was the triple combo tool string with DSI, and the second was the VSI tool string (Figures F70, F71). The end of the 10¾ inch casing was at 723 m, and the end of the drill pipe was initially set at 747.3 m. The modified triple combo tool string was able to reach 875 m in the open hole (~46 m above the total depth of RCB coring), and data were collected from that depth. The VSI tool string could not pass into the open hole, and check shots were conducted inside the casing. A summary of the log data compared to lithostratigraphy is shown in Figure F72.
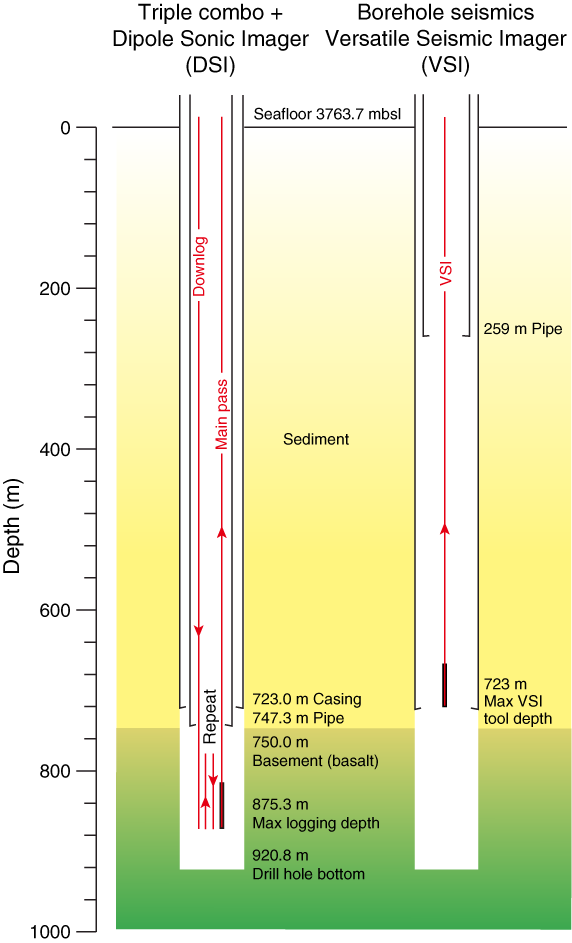
Figure F70. Logging operations summary.
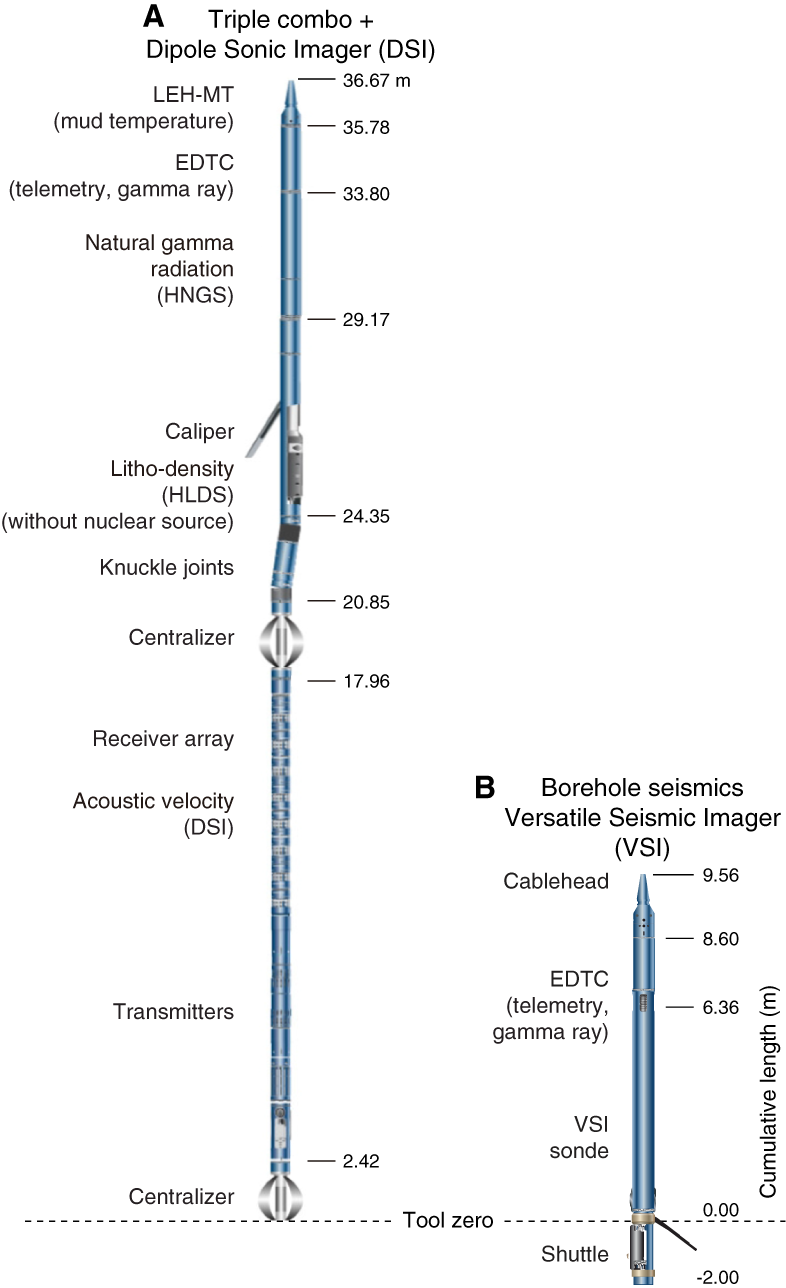
Figure F71. Downhole logging tool strings.
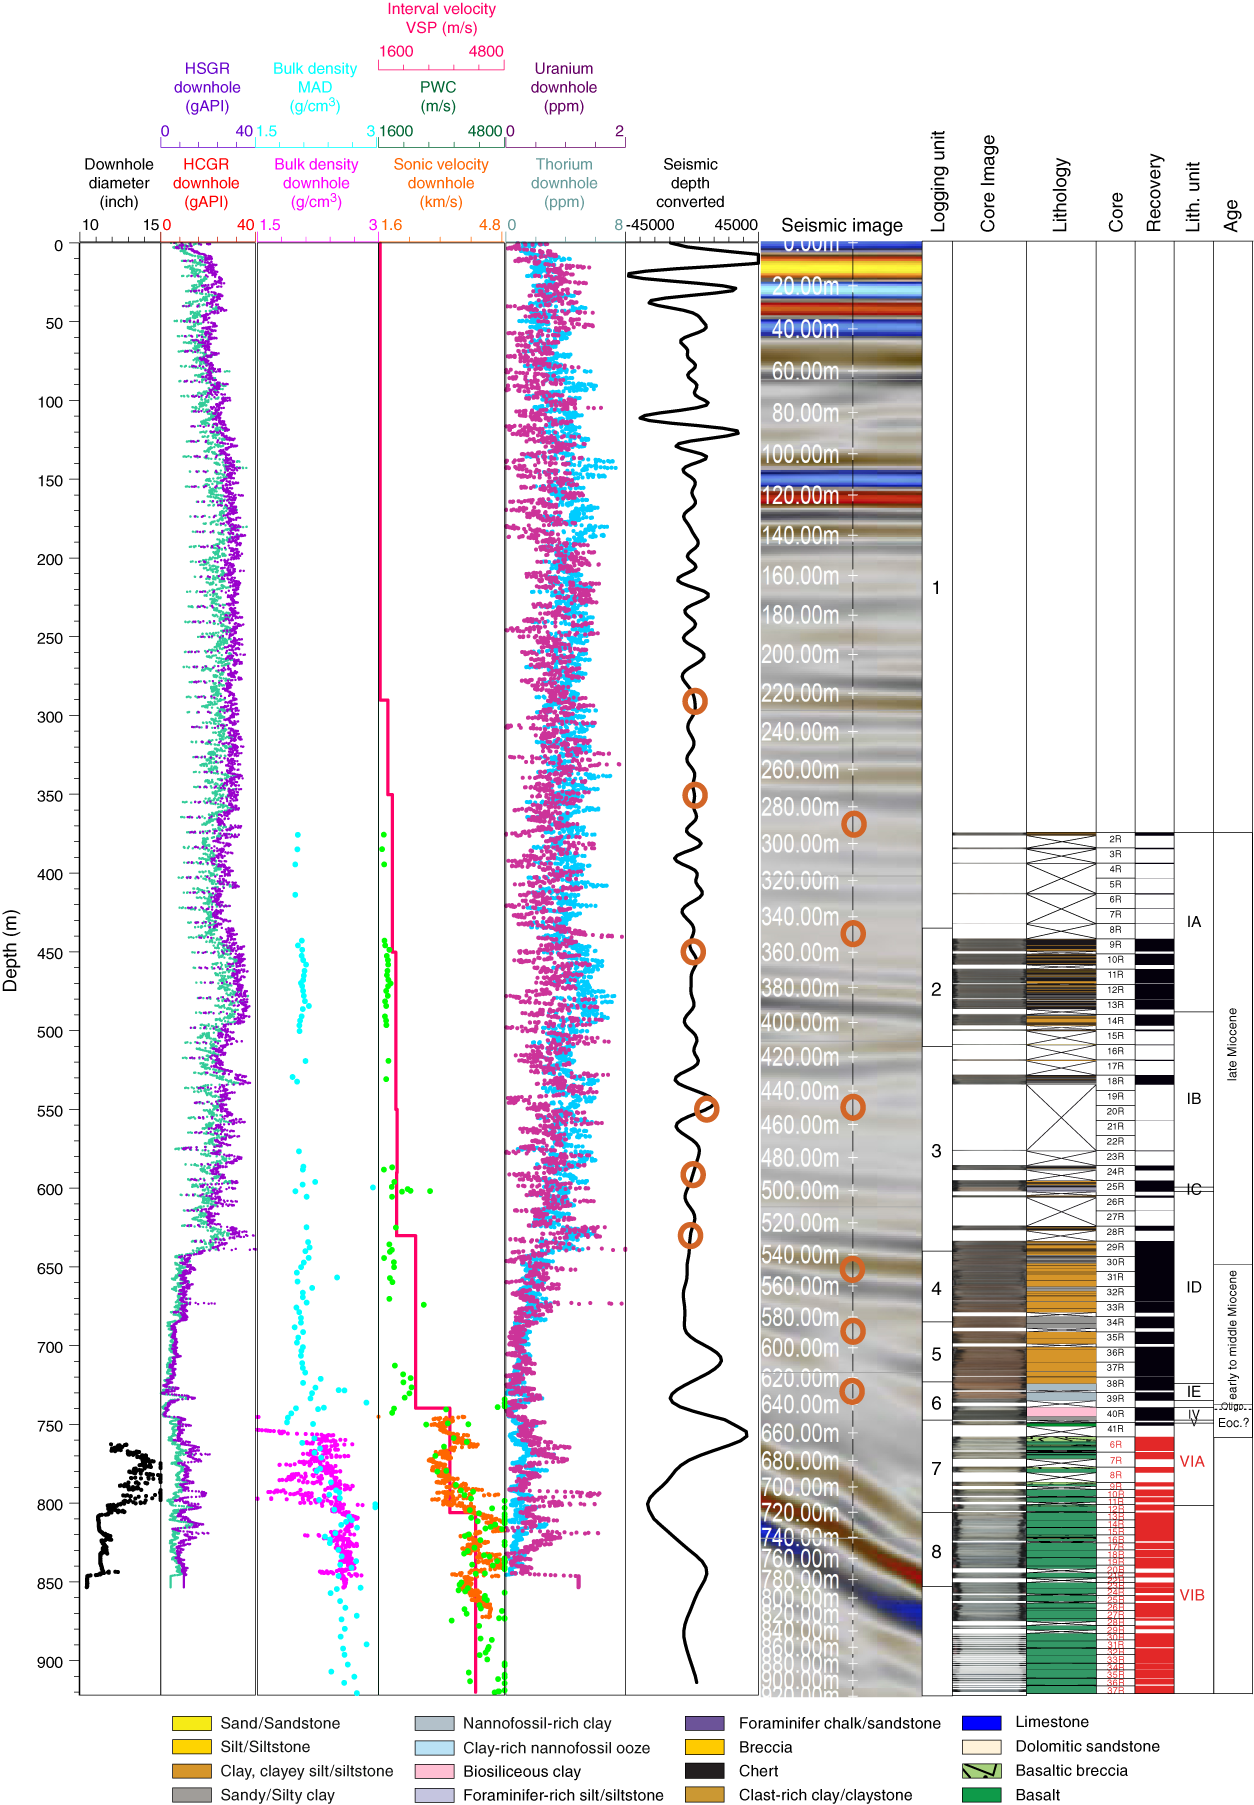
Figure F72. Downhole logs, lithostratigraphic units, and logging units.
Logging Run 1: triple combo with sonic tool
After coring to 920.8 m in Hole U1502B, a wiper trip was made to verify the condition of the hole, and the RCB drill bit was released at the bottom of the hole. The drillers noted a ledge that might have developed a few meters below the casing; thus, the end of the drill pipe was raised to 747.3 m (~24 m below the end of casing), which became the top of open-hole logging in Run 1 (Figure F70).
Rig-up for the first downhole logging run started at 0000 h (local time; UTC + 8 h) on 13 May 2017. A modified triple combo with a sonic tool string was lowered into the hole at 0320 h and reached a maximum depth of 875.3 m at 0655 h, ~45 m above the total cored depth of Hole U1502B. The first upward pass began at 0655 h and ended at 0710 h, reaching 785.3 m in the open hole. The second upward pass started at 0720 h and ended at 0835 h, reaching close to the seafloor. Heave conditions were excellent for the entire logging operation, so the active heave compensator was not used.
In the modified triple combo run, the tool string included the HNGS, HLDS, and DSI for acoustic velocity (Figure F71). The centralized tools were run in the lower part of the tool string so that it would be easier to lower the tool string past ledges than it would be with an eccentralized tool (see Downhole measurements in the Expedition 367/368 methods chapter [Sun et al., 2018a]). The triple combo tool string did not encounter obvious obstructions in the open hole below the end of the drill pipe.
Logging Run 2: VSI tool
Rig-up for the second downhole logging run using a VSI tool string started at 1230 h on 13 May 2017. By 1430 h, the drill pipe was pulled up to ~259 m, which was still deeper than the original planned depth of 80 m for the end of the drill pipe. However, it was determined that this would not affect the overall check shot stations, and thus the drill pipe was not pulled up any further. The VSI tool string was deployed at 1520 h and reached the end of casing (723.0 m) at 1730 h. Several attempts were made to get the VSI tool string to pass into the open hole below the casing, but it appeared to be hanging up on a ledge and was unable to pass into the open hole section. With very little daylight remaining, we decided to concentrate on getting as many check shots inside the cased hole as time permitted.
In all, eight stations were attempted, all in casing. The two deepest stations (at 715.17 and 695.20 m) are associated with large noise, suggesting possible poor mechanical coupling of the casing with the surrounding rock formation. During the first run with the triple combo tool string, we noted that the amplitude of the natural gamma dropped significantly at the depth interval of ~640–747 m. Therefore, we suspected that the rock formation behind the casing might have collapsed and the debris fallen to the bottom of the hole, resulting in poor casing/hole contact. The remaining upper six stations, located at 290.23, 350.28, 450.31, 550.09, 590.27, and 630.34 m, recorded good quality waveforms (Figure F73; Table T16).

Figure F73. Waveforms and first arrivals.
Table T16. VSI check shot stack summary. Download table in CSV format.
During the VSI operation, the IODP protected species procedures were implemented. A soft ramp-up of the seismic source was performed to a maximum pressure of 2000 psi. No protected species were observed. The seismic source was deployed by the aft port crane at 38 m from the moonpool and 7 m below the sea surface (Figure F74). The seismic source has a cluster of two generator-injectors, each with a volume of 250 inch3. A MP-24 hydrophone was deployed at 9 m below the sea surface. The sea condition was calm. The VSI tool string was combined with telemetry and gamma ray tools (Figure F71). The VSI tool string has a downhole sampling rate and recording length of 1.0 and 3000 ms, respectively. A total of 47 seismic source shots were made during the experiment, from which 29 downhole seismic traces were used and processed to identify waveforms and first arrivals. After the VSI experiment, the tool was brought back to the surface and rigged down at 2200 h on 13 May.

Figure F74. Seismic source deployment scheme.
Logging units
The triple combo tool string run in Hole U1502B allowed us to define eight logging units (Table T17), many of which are correlated with changes in lithostratigraphic units, lithology, and physical properties (Figure F72). Logging Units 1–5 are inside both the casing and drill pipe, Unit 6 is outside the casing but inside the drill pipe, and Units 7 and 8 are in the open hole. When the logging tool is inside the casing and/or drill pipe, only measurements of NGR and the associated K, Th, and U components are meaningful, together with the understanding that the measured values were highly attenuated by the casing and/or drill pipe.
Table T17. Logging units. Download table in CSV format.
Logging Units 1–6: seafloor to 747.3 m
Logging Units 1–5 were defined primarily based on the characteristics of the measured NGR within the casing (Figure F72). In Logging Unit 1 (seafloor–435.0 m), the amplitude of NGR increases gradually with depth from ~150 to 350 m to a relatively constant value; the amplitude of NGR then decreases toward the bottom of logging Unit 1 at 435 m. The bottom part of this logging unit (~380–435 m) corresponds to a zone of relatively poor recovery in Hole U1502A.
In logging Unit 2 (435.0–510.0 m), NGR is greater than it is in the adjacent logging units. Logging Unit 2 coincides with the interval of good core recovery in Hole U1502A and corresponds to the lower portion of lithostratigraphic Subunit 1A (Figure F72; see Lithostratigraphy). Logging Unit 3 (510.0–640.0 m) has NGR values similar to the bottom part of logging Unit 1. This unit coincides with the poor core recovery interval and is interpreted to represent sandy layers.
Logging Unit 4 (640.0–685.0 m) is associated with a major reduction (>50%) in the amplitude of NGR compared to logging Unit 3. Logging Unit 5 (685.0–723.0 m) has even greater reduction in the amplitude of NGR compared to logging Unit 4. We hypothesize that the rock formation throughout logging Units 4 and 5 might have become unstable and collapsed behind the casing. Such failure could cause poor acoustic contact between the casing and the adjacent formation, as reflected in the significant noise in the waveforms of the two check shot stations (at 715.17 and 695.20 m).
Logging Unit 6 (723.0–747.3 m) is outside of the casing but still inside the drill pipe. This logging unit corresponds to lithostratigraphic Subunit IE (Figure F72; see Lithostratigraphy).
Logging Units 7 and 8: 747.3–853.0 m
Logging Units 7 and 8 are both in the open hole, outside of the casing and drill pipe. Logging Unit 7 (747.3–806.0 m) has relatively large hole diameters of 12–14.5 inches, logging bulk densities of 1.7–2.7 g/cm3, and VP values of 2.8–4.0 km/s. Logging bulk density is more scattered than the core sample density from MAD laboratory measurements. The logging velocity values are consistent with the P-wave velocity of core samples. The top of logging Unit 7 corresponds to a major change in lithology from sediment to altered basalt. Logging Unit 7 corresponds to lithostratigraphic Subunit VIA (Figure F72; see Lithostratigraphy).
Logging Unit 8 (806.0–853.0 m) has a relatively stable hole diameter of ~11–12 inches. Logging density and VP of Unit 8 are consistent with those measured from core samples. Density and VP in logging Unit 8 are greater than in logging Unit 7. Logging Unit 8 corresponds to the top part of lithostratigraphic Subunit VIB (Figure F72; see Lithostratigraphy).
Correlation to seismic data
We conducted two sets of analyses to correlate the core measurements (in meters below seafloor) to the time-based seismic data at Site U1502. First, we analyzed core data and investigated correlation to the seismic reflection profile. Second, we constructed synthetic seismograms using Site U1502 core data and compared the results with the traces in seismic profiles. Preliminary calculations were done during the expedition using a combination of Matlab scripts and Petrel software.
Velocity and density data and comparison with seismic reflectors
Whole-round core measurements, including P-wave velocity logger (PWL) and GRA density measurements, were conducted from 375.0 to 750.7 m in Hole U1502A and from 727.7 to 920.8 m in Hole U1502B (Figure F75). P-wave velocity was also measured along the x-axis with the PWC on working-half sections. MAD measurements were performed on discrete samples, one every other section. Sonic velocity and HLDS density measurements were obtained from downhole logging in Hole U1502B at 747.3–853.0 m (see Physical properties and Downhole measurements).
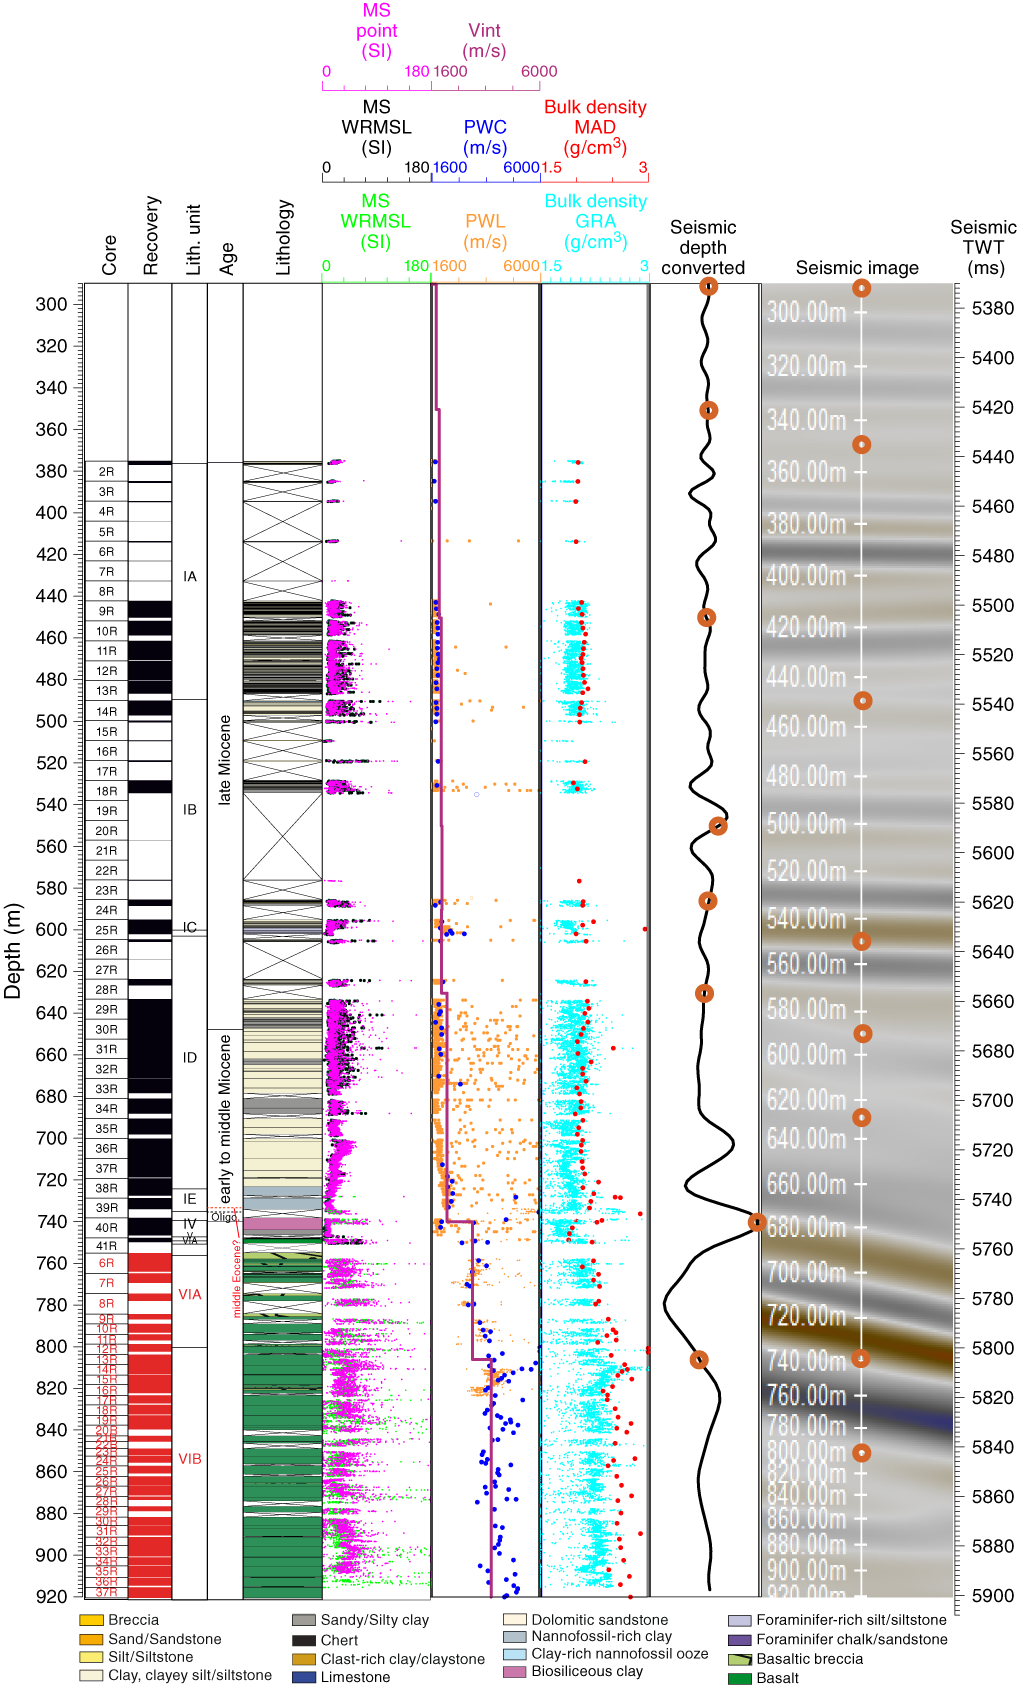
Figure F75. Physical properties and seismic waveform comparison.
With the outliers filtered out, the whole-round PWL velocity and GRA density data are in good agreement with the PWC velocity and MAD density of core samples, respectively (Figure F75). Sonic velocities from downhole logging agree well with the PWC data, and the HLDS density from logging is also in good agreement with the MAD core density for intervals away from borehole enlargements (Figure F72; see Physical properties and Downhole measurements).
The VSI logging run yielded one-way traveltime (OWT) values at six depths: 290.23, 350.28, 450.31, 550.09, 590.27, and 630.34 m (Figure F75; see Downhole measurements). The corresponding interval velocities were calculated for six depth intervals, respectively: 0–290.23, 290.23–350.28, 350.28–450.31, 450.31–550.09, 550.09–590.27, and 590.27–630.34 m. VP and density noticeably increase at ~740 m, coinciding with the lithologic change from sediment to altered basalt (see Lithostratigraphy). We hypothesize that the strongest amplitude in the seismic traces in Hole U1502A might correspond to the major changes in lithology and physical properties at 740 m and define a first reference point (RP1). To correlate the maximum amplitude in the seismic trace expressed in time (milliseconds) with the depth of 740 m, the calculated interval velocity for the 630.34–740.0 m interval should be 2.5 km/s. Another depth of noticeable changes in VP and density is at ~800.0–806.0 m, which we chose as a second reference point (RP2). For the 740.0–806.0 m interval, an interval velocity of 3.3 km/s was chosen, which corresponds to the average PWC and PWL velocity. Similarly, for the 806.0–920.0 m interval, an interval velocity of 4.0 km/s was calculated based on the average PWC and PWL VP values (Figure F75).
Time-depth relationship
The check shot data from Hole U1502B and the PWC data from Holes U1502A and U1502B were used to calculate the time-depth relationship (TDR) model of seismic waves. OWT values were directly observed at the six check shot depths from 290.23 to 630.34 m, from which a TDR model was readily calculated (Figure F76). The TDR for the deeper sections was based on the interval velocity at intervals of 630.34–740.0, 740.0–806.0, and 806.0–920.8 m. The calculated TDR model was similar to that of Site U1500 for depths shallower than 740 m. For depths greater than 740 m, however, the Site U1502 TDR model corresponds to the relatively high velocities of altered basalts, whereas the Site U1500 model corresponds to the relatively low velocities of sediment layers.

Figure F76. Site U1502 TDR compared to Site U1500.
Using the best-fitting TDR model for Site U1502 (Figure F76), we were able to convert “depth scale” to “timescale” for all core measurements. This conversion enabled us to display the core measurements directly on top of the time-based seismic sections, facilitating identification of correlated features, as illustrated in the example of Figure F77.
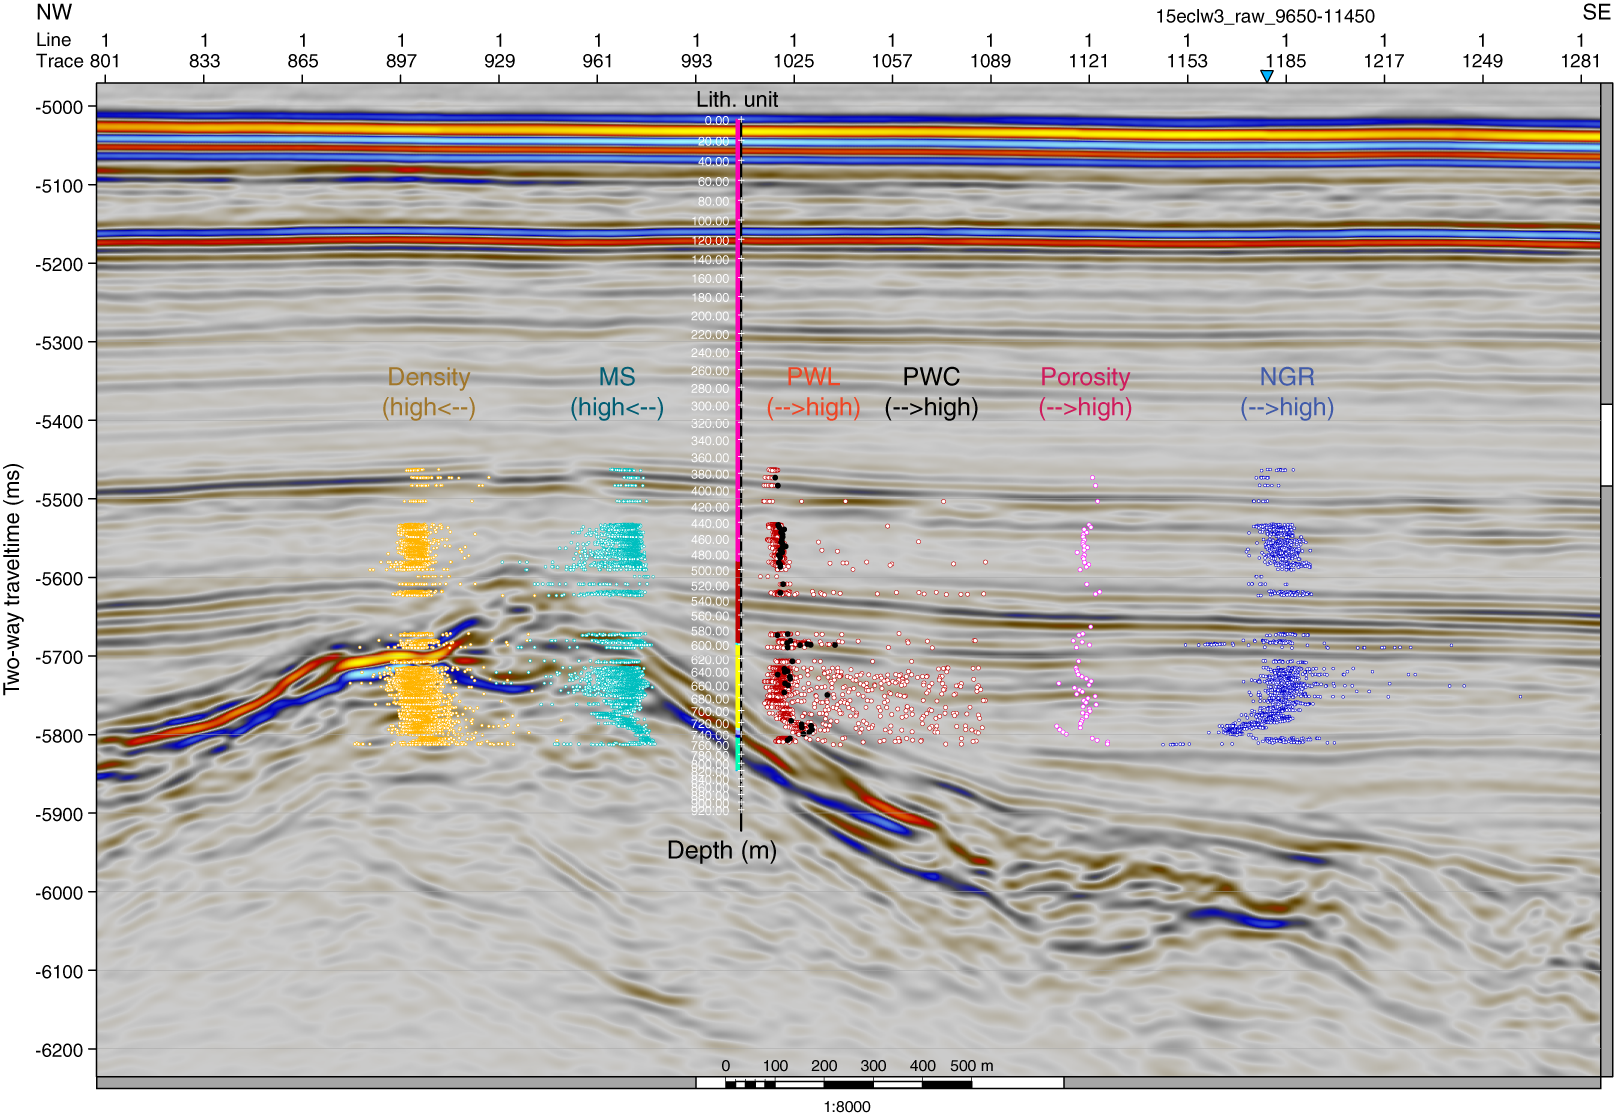
Figure F77. Seismic section with lithostratigraphic units overlain at drill hole location.
Synthetic seismograms
To further illustrate the relationship between the core measurements at Site U1502 and the seismic reflection profile, the Seismic interpretation module in Petrel was used to compute synthetic seismograms based on the relevant core measurements (Figure F78). Synthetic traces were generated by convolving the reflectivity from the density of core samples after smoothing by a 20-point running window, by a smoothed-interval velocity model, and with the source wavelet that best fits the seismic data (Ricker 2; Figure F78).
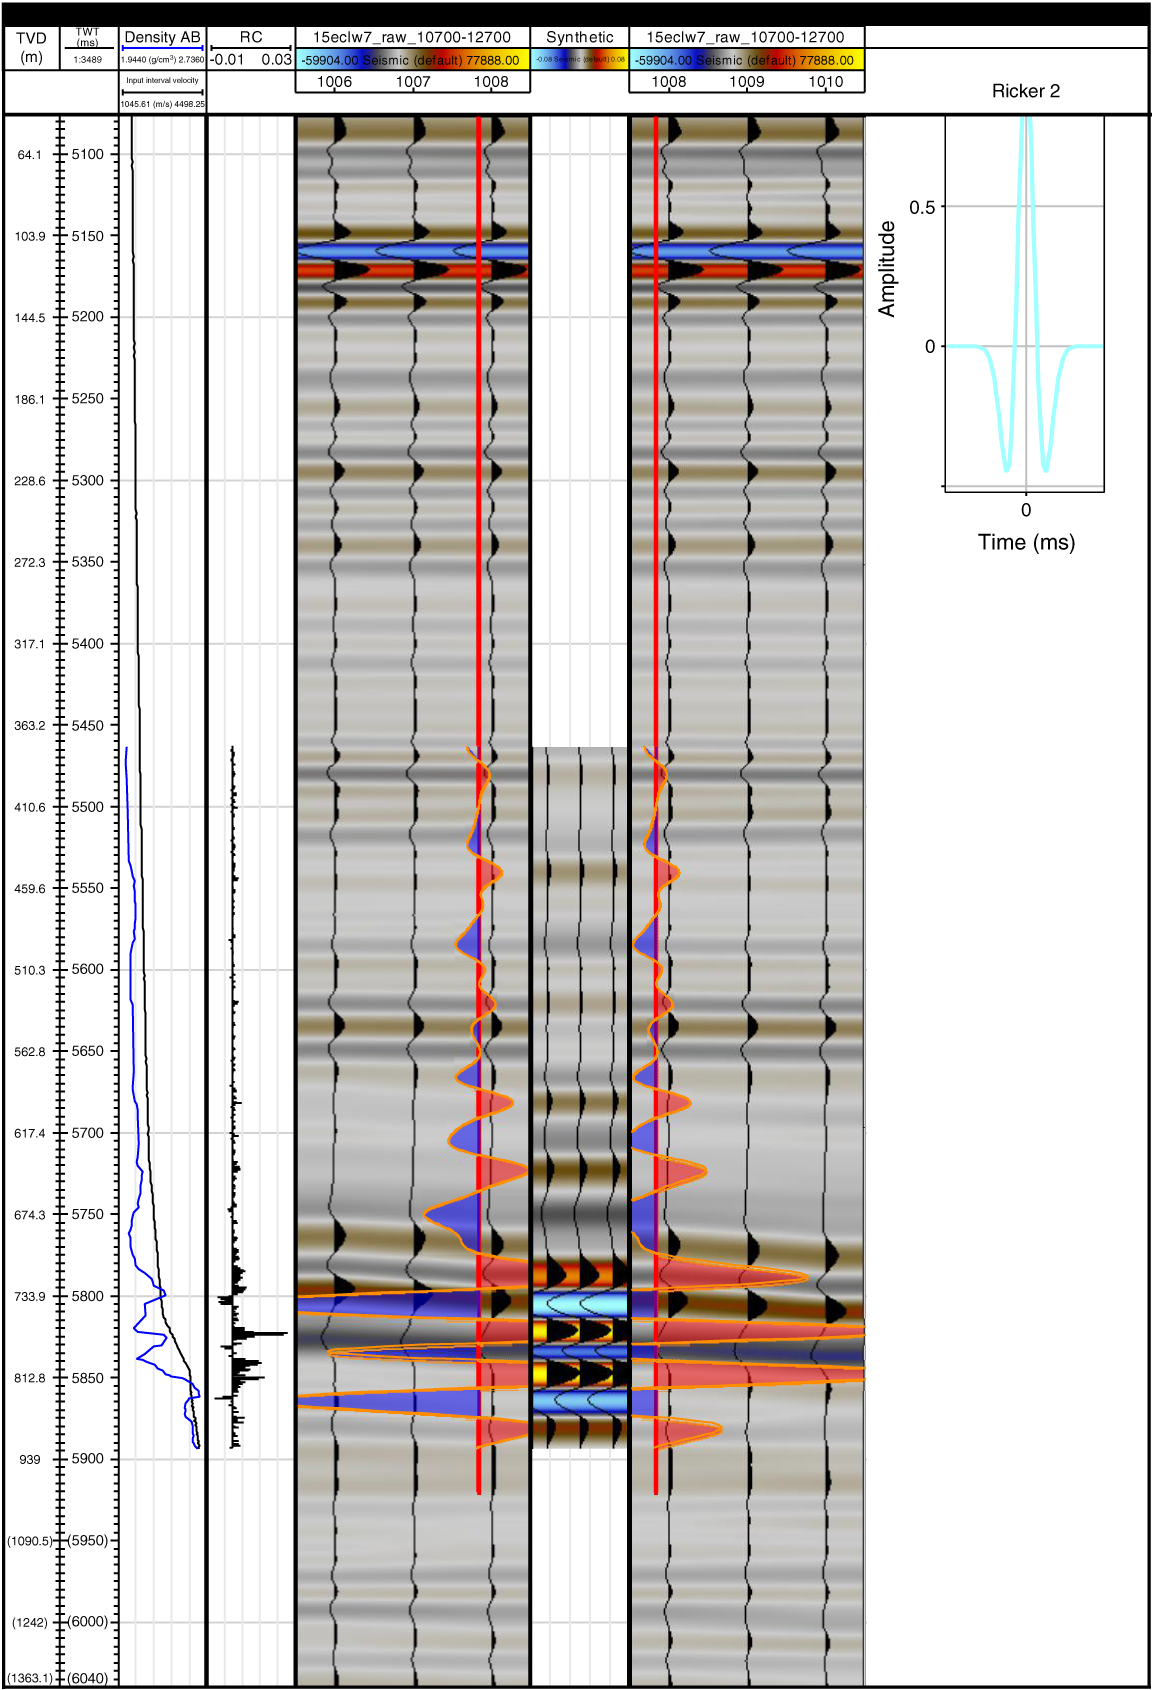
Figure F78. Synthetic seismogram.
Seismic impedance (SI) of a rock layer is the product of its average seismic velocity (VP) and density (ρ) (i.e., SI = VP × ρ). The seismic reflection coefficient (RC), in turn, equals the change in the seismic impedance between two adjacent rock layers. Thus, we can expect greater amplitudes in the modeled seismogram for rock interfaces with larger values of RC. The resulting synthetic seismogram shows strong reflectors at 730 and 810 m, consistent with the observed range of seismic reflectors (Figure F78).
References
Barron, J.A., 1985. Miocene to Holocene planktic diatoms. In Bolli, H.M., Saunders, J.B., and Perch-Nielsen, K. (Eds.), Plankton Stratigraphy: Cambridge, United Kingdom (Cambridge University Press), 763–809.
Briais, A., Patriat, P., and Tapponnier, P., 1993. Updated interpretation of magnetic anomalies and seafloor spreading stages in the South China Sea: implications for the Tertiary tectonics of Southeast Asia. Journal of Geophysical Research: Solid Earth, 98(B4):6299–6328. https://doi.org/10.1029/92JB02280
Boiron, T., Bascou, J., Camps, P., Ferré, E.C., Maurice, C., Guy, B., Gerbe, M.-C., and Launeau, P., 2013. Internal structure of basalt flows: insights from magnetic and crystallographic fabrics of the La Palisse volcanics, French massif central. Geophysical Journal International, 193(2):585–602. https://doi.org/10.1093/gji/ggs115
Caballero-Miranda, C.I., Alva-Valdivia, L.M., González-Rangel, J.A., Gogitchaishvili, A., Urrutia-Fucugauchi, J., and Kontny, A., 2016. Vertical AMS variation within basalt flow profiles from the Xitle volcano (Mexico) as indicator of heterogeneous strain in lava flows. Journal of Volcanology and Geothermal Research, 311:9–28. https://doi.org/10.1016/j.jvolgeores.2016.01.003
Cañón-Tapia, E., 1994. Anisotropy of magnetic susceptibility parameters: guidelines for their rational selection. Pure and Applied Geophysics, 142(2):365–382. https://doi.org/10.1007/BF00879310
Chulliat, A., Macmillan, S., Alken, P., Beggan, C., Nair, M., Hamilton, B., Woods, A., Ridley, V., Maus, S., and Thomson, A., 2015. The US/UK World Magnetic Model for 2015–2020: Technical Report. Boulder, CO (NOAA National Geophysical Data Center). https://doi.org/10.7289/V5TB14V7
Clark, C., and James, P., 2003. Hydrothermal brecciation due to fluid pressure fluctuations: examples from the Olary Domain, South Australia. Tectonophysics, 366(3–4):187–206. https://doi.org/10.1016/S0040-1951(03)00095-7
Cullen, A., Vicenzi, E., and McBirney, A.R., 1989. Plagioclase-ultraphyric basalts of the Galapagos Archipelago. Journal of Volcanology and Geothermal Research, 37(3–4):325–337. https://doi.org/10.1016/0377-0273(89)90087-5
Dean, W.E., Gardner, J.V., and Hemphill-Haley, E., 1989. Changes in redox conditions in deep-sea sediments of the subarctic North Pacific Ocean: possible evidence for the presence of North Pacific Deep Water. Paleoceanography, 4(6):639–653. https://doi.org/10.1029/PA004i006p00639
De Vleeschouwer, D., Dunlea, A.G., Auer, G., Anderson, C.H., Brumsack, H., de Loach, A., Gurnis, M., et al., 2017. Quantifying K, U, and Th contents of marine sediments using shipboard natural gamma radiation spectra measured on DV JOIDES Resolution. Geochemistry, Geophysics, Geosystems, 18(3):1053–1064. https://doi.org/10.1002/2016GC006715
Ellwood, B.B., Balsam, W., Burkart, B., Long, G.J., and Buhl, M.L., 1986. Anomalous magnetic properties in rocks containing the mineral siderite: paleomagnetic implications. Journal of Geophysical Research: Solid Earth, 91(B12):12779–12790. https://doi.org/10.1029/JB091iB12p12779
Fink, J., 2017. Laboratory Simulations of Submarine Lava Flow Morphology: A Quarter Century of Progress [presented at the American Geophysical Union 2017 Chapman Conference, Hobart, Tasmania, Australia, 29 January–3 February 2017].
Flower, M.F.J., 1980. Accumulation of calcic plagioclase in ocean-ridge tholeiite: an indication of spreading rate? Nature, 287(5782):530–532. https://doi.org/10.1038/287530a0
Gardner, J.V., Dean, W.E., Klise, D.K., and Baldauf, J.G., 1982. A climate-related oxidizing event in deep-sea sediment from the Bering Sea. Quaternary Research, 18(1): 91–107. https://doi.org/10.1016/0033-5894(82)90023-0
Gregg, T.K.P., and Fink, J.H., 1995. Quantification of submarine lava-flow morphology through analog experiments. Geology, 23(1):73–76. https://doi.org/10.1130/0091-7613(1995)023<0073:QOSLFM>2.3.CO;2
Hedges, J.I., Clark, W.A., and Come, G.L., 1988. Organic matter sources to the water column and surficial sediments of a marine bay. Limnology and Oceanography, 33(5):1116–1136. https://doi.org/10.4319/lo.1988.33.5.1116
Heezen, B.C., and Hollister, C.D., 1971. The Face of the Deep: New York (Oxford University Press USA).
Hirt, A., and Gehring, A.U., 1991. Thermal alteration of the magnetic mineralogy in ferruginous rocks. Journal of Geophysical Research: Solid Earth, 96(B6):9947–9953. https://doi.org/10.1029/91JB00573
Hu, S., Stephenson, A., and Appel, E., 2002. A study of gyroremanent magnetisation (GRM) and rotational remanent magnetisation (RRM) carried by greigite from lake sediments. Geophysical Journal International, 151(2):469–474. https://doi.org/10.1046/j.1365-246X.2002.01793.x
Jébrak, M., 1997. Hydrothermal breccias in vein-type ore deposits: a review of mechanisms, morphology and size distribution. Ore Geology Reviews, 12(3):111–134. https://doi.org/10.1016/S0169-1368(97)00009-7
Kaminski, M.A., and Gradstein, F.M., 2005. Atlas of Paleogene cosmopolitan deep-water agglutinated foraminifera. Grzybowski Foundation Special Publication, 10. http://www.foraminifera.eu/atlas.html
Kennish, M.J., and Lutz, R.A., 1998. Morphology and distribution of lava flows on mid-ocean ridges: a review. Earth-Science Reviews, 43(3–4):63–90. https://doi.org/10.1016/S0012-8252(98)00006-3
Kirschvink, J.L., 1980. The least-squares line and plane and the analysis of palaeomagnetic data. Geophysical Journal of the Royal Astronomical Society, 62(3):699–718. https://doi.org/10.1111/j.1365-246X.1980.tb02601.x
Lange, A.E., Nielsen, R.L., Tepley, F.J., III, and Kent, A.J.R., 2013. The petrogenesis of plagioclase-phyric basalts at mid-ocean ridges. Geochemistry, Geophysics, Geosystems, 14(8):3282–3296. https://doi.org/10.1002/ggge.20207
Larsen, H.C., Jian, Z., Alvarez Zarikian, C.A., Sun, Z., Stock, J.M., Klaus, A., Boaga, J., Bowden, S.A., Briais, A., Chen, Y., Cukur, D., Dadd, K.A., Ding, W., Dorais, M.J., Ferré, E.C., Ferreira, F., Furusawa, A., Gewecke, A.J., Hinojosa, J.L., Höfig, T.W., Hsiung, K.-H., Huang, B., Huang, E., Huang, X.-L., Jiang, S., Jin, H., Johnson, B.G., Kurzawski, R.M., Lei, C., Li, B., Li, L., Li, Y., Lin, J., Liu, C., Liu, C., Liu, Z., Luna, A., Lupi, C., McCarthy, A.J., Mohn, G., Ningthoujam, L.S., Nirrengarten, M., Osono, N., Peate, D.W., Persaud, P., Qui, N., Robinson, C.M., Satolli, S., Sauermilch, I., Schindlbeck, J.C., Skinner, S.M., Straub, S.M., Su, X., Tian, L., van der Zwan, F.M., Wan, S., Wu, H., Xiang, R., Yadav, R., Yi, L., Zhang, C., Zhang, J., Zhang, Y., Zhao, N., Zhong, G., and Zhong, L., 2018. Site U1501. In Sun, Z., Jian, Z., Stock, J.M., Larsen, H.C., Klaus, A., Alvarez Zarikian, C.A., and the Expedition 367/368 Scientists, South China Sea Rifted Margin. Proceedings of the International Ocean Discovery Program, 367/368: College Station, TX (International Ocean Discovery Program). https://doi.org/10.14379/iodp.proc.367368.105.2018
Li, C.-F., Lin, J., Kulhanek, D.K., Williams, T., Bao, R., Briais, A., Brown, E.A., Chen, Y., Clift, P.D., Colwell, F.S., Dadd, K.A., Ding, W., Hernández-Almeida, I., Huang, X.-L., Hyun, S., Jiang, T., Koppers, A.A.P., Li, Q., Liu, C., Liu, Q., Liu, Z., Nagai, R.H., Peleo-Alampay, A., Su, X., Sun, Z., Tejada, M.L.G., Trinh, H.S., Yeh, Y.-C., Zhang, C., Zhang, F., Zhang, G.-L., and Zhao, X., 2015. Expedition 349 summary. In Li, C.-F., Lin, J., Kulhanek, D.K., and the Expedition 349 Scientists, South China Sea Tectonics. Proceedings of the International Ocean Discovery Program, 349: College Station, TX (International Ocean Discovery Program). https://doi.org/10.14379/iodp.proc.349.101.2015
Lurcock, P.C., and Wilson, G.S., 2012. PuffinPlot: a versatile, user-friendly program for paleomagnetic analysis. Geochemistry, Geophysics, Geosystems, 13(6):Q06Z45. https://doi.org/10.1029/2012GC004098
McClinton, J.T., White, S.M., Colman, A., Rubin, K.H., and Sinton, J.M., 2014. The role of crystallinity and viscosity in the formation of submarine lava flow morphology. Bulletin of Volcanology, 76:854. https://doi.org/10.1007/s00445-014-0854-2
Morris, R.J., and Calvert, S.E., 1977. Geochemical studies of organic-rich sediments from the Namibian shelf: 1. The organic fractions. In Angel, M. (Ed.), Voyage of Discovery: Oxford, United Kingdom (Pergamon Press), 647–665.
Pan, Y., Zhu, R., Banerjee, S.K., Gill, J., and Williams, Q., 2000. Rock magnetic properties related to thermal treatment of siderite: behavior and interpretation. Journal of Geophysical Research: Solid Earth, 105(B1):783–794. https://doi.org/10.1029/1999JB900358
Pirajno, F., 2009. Hydrothermal Processes and Mineral Systems: Dordrecht, Netherlands (Springer). https://doi.org/10.1007/978-1-4020-8613-7
Reyes, A.G., 1990. Petrology of Philippine geothermal systems and the application of alteration mineralogy to their assessment. Journal of Volcanology and Geothermal Research, 43(1–4):279–309. https://doi.org/10.1016/0377-0273(90)90057-M
Richter, C., Acton, G., Endris, C., and Radsted, M., 2007. Technical Note 34: Handbook for Shipboard Paleomagnetists. Ocean Drilling Program. https://doi.org/10.2973/odp.tn.34.2007
Roberts, A.P., Chang, L., Rowan, C.J., Horng, C.-S., and Florindo, F., 2011. Magnetic properties of sedimentary greigite (Fe3S4): an update. Reviews of Geophysics, 49(1):RG1002. https://doi.org/10.1029/2010RG000336
Sillitoe, R.H., and Hedenquist, J.W., 2003. Linkages between volcanotectonic settings, ore-fluid compositions, and epithermal precious metal deposits. In Simmons, S.F., and Graham, I. (Eds.), Volcanic, Geothermal, and Ore-Forming Fluids: Rulers and Witnesses of Processes within the Earth. Society of Economic Geologists Special Publication, 10:315–343.
Snowball, I.F., 1991. Magnetic hysteresis properties of greigite (Fe3S4) and a new occurrence in Holocene sediments from Swedish Lappland. Physics of the Earth and Planetary Interiors, 68(1–2):32–40. https://doi.org/10.1016/0031-9201(91)90004-2
Soule, S.A., Fornari, D.J., Perfit, M.R., and Rubin, K.H., 2007. New insights into mid-ocean ridge volcanic processes from the 2005–2006 eruption of the East Pacific Rise, 9°46′N–9°56′N. Geology, 35(12):1079–1082. https://doi.org/10.1130/G23924A.1
Staudigel, H., 2014. Chemical fluxes from hydrothermal alteration of the oceanic crust. In Rudnick, R.L. (Ed.), Treatise on Geochemistry (2nd edition) (Volume 4): The Crust. Holland, H.D., and Turekian, K.K. (Series Eds.): New York (Elsevier), 583–606. https://doi.org/10.1016/B978-0-08-095975-7.00318-1
Stock, J.M., Sun, Z., Klaus, A., Larsen, H.C., Jian, Z., Alvarez Zarikian, C.A., Boaga, J., Bowden, S.A., Briais, A., Chen, Y., Cukur, D., Dadd, K.A., Ding, W., Dorais, M.J., Ferré, E.C., Ferreira, F., Furusawa, A., Gewecke, A.J., Hinojosa, J.L., Höfig, T.W., Hsiung, K.-H., Huang, B., Huang, E., Huang, X.-L., Jiang, S., Jin, H., Johnson, B.G., Kurzawski, R.M., Lei, C., Li, B., Li, L., Li, Y., Lin, J., Liu, C., Liu, C., Liu, Z., Luna, A., Lupi, C., McCarthy, A.J., Mohn, G., Ningthoujam, L.S., Nirrengarten, M., Osono, N., Peate, D.W., Persaud, P., Qui, N., Robinson, C.M., Satolli, S., Sauermilch, I., Schindlbeck, J.C., Skinner, S.M., Straub, S.M., Su, X., Tian, L., van der Zwan, F.M., Wan, S., Wu, H., Xiang, R., Yadav, R., Yi, L., Zhang, C., Zhang, J., Zhang, Y., Zhao, N., Zhong, G., and Zhong, L., 2018. Site U1500. In Sun, Z., Jian, Z., Stock, J.M., Larsen, H.C., Klaus, A., Alvarez Zarikian, C.A., and the Expedition 367/368 Scientists, South China Sea Rifted Margin. Proceedings of the International Ocean Discovery Program, 367/368: College Station, TX (International Ocean Discovery Program). https://doi.org/10.14379/iodp.proc.367368.104.2018
Sun, Z., Jian, Z., Stock, J.M., Larsen, H.C., Klaus, A., Alvarez Zarikian, C.A., Boaga, J., Bowden, S.A., Briais, A., Chen, Y., Cukur, D., Dadd, K.A., Ding, W., Dorais, M.J., Ferré, E.C., Ferreira, F., Furusawa, A., Gewecke, A.J., Hinojosa, J.L., Höfig, T.W., Hsiung, K.-H., Huang, B., Huang, E., Huang, X.-L., Jiang, S., Jin, H., Johnson, B.G., Kurzawski, R.M., Lei, C., Li, B., Li, L., Li, Y., Lin, J., Liu, C., Liu, C., Liu, Z., Luna, A., Lupi, C., McCarthy, A.J., Mohn, G., Ningthoujam, L.S., Nirrengarten, M., Osono, N., Peate, D.W., Persaud, P., Qui, N., Robinson, C.M., Satolli, S., Sauermilch, I., Schindlbeck, J.C., Skinner, S.M., Straub, S.M., Su, X., Tian, L., van der Zwan, F.M., Wan, S., Wu, H., Xiang, R., Yadav, R., Yi, L., Zhang, C., Zhang, J., Zhang, Y., Zhao, N., Zhong, G., and Zhong, L., 2018a. Expedition 367/368 methods. In Sun, Z., Jian, Z., Stock, J.M., Larsen, H.C., Klaus, A., Alvarez Zarikian, C.A., and the Expedition 367/368 Scientists, South China Sea Rifted Margin. Proceedings of the International Ocean Discovery Program, 367/368: College Station, TX (International Ocean Discovery Program). https://doi.org/10.14379/iodp.proc.367368.102.2018
Sun, Z., Stock, J., Jian, Z., McIntosh, K., Alvarez Zarikian, C.A., and Klaus, A., 2016. Expedition 367/368 Scientific Prospectus: South China Sea Rifted Margin. International Ocean Discovery Program. https://doi.org/10.14379/iodp.sp.367368.2016
Sun, Z., Stock, J.M., Klaus, A., Larsen, H.C., Jian, Z., Alvarez Zarikian, C.A., Boaga, J., Bowden, S.A., Briais, A., Chen, Y., Cukur, D., Dadd, K.A., Ding, W., Dorais, M.J., Ferré, E.C., Ferreira, F., Furusawa, A., Gewecke, A.J., Hinojosa, J.L., Höfig, T.W., Hsiung, K.-H., Huang, B., Huang, E., Huang, X.-L., Jiang, S., Jin, H., Johnson, B.G., Kurzawski, R.M., Lei, C., Li, B., Li, L., Li, Y., Lin, J., Liu, C., Liu, C., Liu, Z., Luna, A., Lupi, C., McCarthy, A.J., Mohn, G., Ningthoujam, L.S., Nirrengarten, M., Osono, N., Peate, D.W., Persaud, P., Qui, N., Robinson, C.M., Satolli, S., Sauermilch, I., Schindlbeck, J.C., Skinner, S.M., Straub, S.M., Su, X., Tian, L., van der Zwan, F.M., Wan, S., Wu, H., Xiang, R., Yadav, R., Yi, L., Zhang, C., Zhang, J., Zhang, Y., Zhao, N., Zhong, G., and Zhong, L., 2018b. Site U1499. In Sun, Z., Jian, Z., Stock, J.M., Larsen, H.C., Klaus, A., Alvarez Zarikian, C.A., and the Expedition 367/368 Scientists, South China Sea Rifted Margin. Proceedings of the International Ocean Discovery Program, 367/368: College Station, TX (International Ocean Discovery Program). https://doi.org/10.14379/iodp.proc.367368.103.2018
Tarling, D.H., and Hrouda, F., 1993. The Magnetic Anisotropy of Rocks: London (Chapman and Hall).
Tauxe, L., 2010. Essentials of Paleomagnetism: Berkeley, California (University of California Press).
Thompson, G.F., 1990. The anomalous demagnetization of pyrrhotite. Geophysical Journal International, 103:425–430.
White, W.M., and Klein, E.M., 2014. Composition of the oceanic crust. In Rudnick, R.L. (Ed.), Treatise on Geochemistry (2nd edition) (Volume 4): The Crust. Holland, H.D., and Turekian, K.K. (Series Eds.): New York (Elsevier), 457–496. https://doi.org/10.1016/B978-0-08-095975-7.00315-6
Wilson, T.R.S., Thomson, J., Hydes, D.J., Colley, S., Culkin, F., and Sørensen, J., 1986. Oxidation fronts in pelagic sediments: diagenetic formation of metal-rich layers. Science, 232(4753):972–975. https://doi.org/10.1126/science.232.4753.972
Yan, P., Zhou, D., and Liu, Z., 2001. A crustal structure profile across the northern continental margin of the South China Sea. Tectonophysics, 338(1):1–21. https://doi.org/10.1016/S0040-1951(01)00062-2
Zhao, F., Alves, T.M., Wu, S., Li, W., Huuse, M., Mi, L., Sun, Q., and Ma, B., 2016. Prolonged postrift magmatism on highly extended crust of divergent continental margins (Baiyun Sag, South China Sea). Earth and Planetary Science Letters, 445:79–91. https://doi.org/10.1016/j.epsl.2016.04.001
Zijderveld, J.D.A., 1967. AC demagnetization of rocks: analysis of results. In Collinson, D.W., Creer, K.M., and Runcorn, S.K. (Eds.), Developments in Solid Earth Geophysics (Volume 3): Methods in Palaeomagnetism: Amsterdam (Elsevier), 254–286. https://doi.org/10.1016/B978-1-4832-2894-5.50049-5
1 Larsen, H.C., Jian, Z., Alvarez Zarikian, C.A., Sun, Z., Stock, J.M., Klaus, A., Boaga, J., Bowden, S.A., Briais, A., Chen, Y., Cukur, D., Dadd, K.A., Ding, W., Dorais, M.J., Ferré, E.C., Ferreira, F., Furusawa, A., Gewecke, A.J., Hinojosa, J.L., Höfig, T.W., Hsiung, K.-H., Huang, B., Huang, E., Huang, X.-L., Jiang, S., Jin, H., Johnson, B.G., Kurzawski, R.M., Lei, C., Li, B., Li, L., Li, Y., Lin, J., Liu, C., Liu, C., Liu, Z., Luna, A., Lupi, C., McCarthy, A.J., Mohn, G., Ningthoujam, L.S., Nirrengarten, M., Osono, N., Peate, D.W., Persaud, P., Qui, N., Robinson, C.M., Satolli, S., Sauermilch, I., Schindlbeck, J.C., Skinner, S.M., Straub, S.M., Su, X., Tian, L., van der Zwan, F.M., Wan, S., Wu, H., Xiang, R., Yadav, R., Yi, L., Zhang, C., Zhang, J., Zhang, Y., Zhao, N., Zhong, G., and Zhong, L., 2018. Site U1502. In Sun, Z., Jian, Z., Stock, J.M., Larsen, H.C., Klaus, A., Alvarez Zarikian, C.A., and the Expedition 367/368 Scientists, South China Sea Rifted Margin. Proceedings of the International Ocean Discovery Program, 367/368: College Station, TX (International Ocean Discovery Program). https://doi.org/10.14379/iodp.proc.367368.106.2018
2 Expedition 367/368 Scientists’ addresses.
This work is distributed under the Creative Commons Attribution 4.0 International (CC BY 4.0) license. 
- F1. Northern SCS margin with seismic coverage.
- F2. Bathymetry with seismic lines.
- F3. Deep crustal time-migrated seismic reflection data.
- F4. Simplified lithology and unit descriptions.
- F5. Lithostratigraphic summary.
- F6. Two-way traveltime to Tg and T60 unconformities.
- F7. Original and predrilling interpretation of seismic Line 15ecLW7.
- F8. Original and predrilling interpretation of seismic Line 15ecLW3.
- F9. Reentry system and casing.
- F10. Lithostratigraphic summary, Hole U1502A.
- F11. Lithostratigraphic summary, Hole U1502B.
- F12. Bulk mineralogy.
- F13. Bioturbation and burrows.
- F14. Sediment color change from greenish gray to brown.
- F15. Dominant lithology, Subunit IC.
- F16. Dominant lithology, Subunit ID.
- F17. Dominant lithology, Subunit IE.
- F18. Core images.
- F19. Brownish yellow silicified breccia.
- F20. Dominant lithology, Unit IV.
- F21. Dominant lithology, Unit V.
- F22. Unit V/Subunit VIA contact.
- F23. Basaltic breccia, brecciated basalt, and sedimentary rocks.
- F24. Lithostratigraphic summary, igneous lithologic Unit 2.
- F25. Varying lithologies, Hole U1502B.
- F26. Representative minerals and textures, igneous Subunit 2b.
- F27. Representative minerals and textures, igneous lithologic Units 1 and 2.
- F28. Representative minerals and textures, igneous Subunit 2a.
- F29. Pillow lavas.
- F30. Basalt.
- F31. XRD data.
- F32. XRD bulk mineralogy.
- F33. pXRF compositional data.
- F34. Lithostratigraphic summary with bedding, fractures, and microfaults.
- F35. Lithostratigraphic subunit boundaries.
- F36. Microfaults.
- F37. Deformation structures.
- F38. Strongly fractured and fragmented basalt.
- F39. Breccias.
- F40. Progressing stages of brecciation process.
- F41. Calculated true dip angles.
- F42. Principal generations of veins.
- F43. Distinct vein shapes, connectivity, and mineral compositions.
- F44. Age-depth model.
- F45. Thermal demagnetization.
- F46. AF demagnetization.
- F47. Demagnetization of discrete samples and archive-half sections.
- F48. Magnetization intensity vs. inclination.
- F49. Paleomagnetic measurements.
- F50. AF and thermal demagnetization.
- F51. Magnetic susceptibility.
- F52. Fe2O3 vs. κ.
- F53. Koenigsberger ratio.
- F54. AMS data.
- F55. Paleomagnetic measurements.
- F56. Carbon, sulfur, and TOC/TN.
- F57. Organic geochemical parameters.
- F58. Interstitial water alkalinity, major cations, and anions.
- F59. Major oxide composition.
- F60. Principal component analysis data.
- F61. Ti-normalized major element oxide and minor element concentrations.
- F62. Ti-normalized major element oxide and minor element concentrations.
- F63. Physical properties, Holes U1502A and U1502B.
- F64. Physical properties, Hole U1502B.
- F65. NGR measurements.
- F66. Density and porosity.
- F67. Sediment color reflectance.
- F68. RGB values.
- F69. Sediment physical properties and lithology comparison.
- F70. Logging operations summary.
- F71. Downhole logging tool strings.
- F72. Downhole logs, lithostratigraphic units, and logging units.
- F73. Waveforms and first arrivals.
- F74. Seismic source deployment scheme.
- F75. Physical properties and seismic waveform comparison.
- F76. Site U1502 TDR compared to Site U1500.
- F77. Seismic section with lithostratigraphic units overlain at drill hole location.
- F78. Synthetic seismogram.
- T1. Site U1502 core summary.
- T2. Mineral percentages, Hole U1502A.
- T3. Mineral percentages, Hole U1502B.
- T4. Major element oxides and minor elements in rocks.
- T5. Calcareous nannofossil events.
- T6. Planktonic foraminifer events.
- T7. Calcareous nannofossils.
- T8. Planktonic foraminifers.
- T9. Diatoms.
- T10. Diatom event.
- T11. Rock magnetic properties of representative samples.
- T12. Carbon, nitrogen, and sulfur.
- T13. Interstitial water analyses.
- T14. Major element oxide and trace elements.
- T15. Major element oxide variance.
- T16. VSI check shot stack summary.
- T17. Logging units.