Sun, Z., Jian, Z., Stock, J.M., Larsen, H.C., Klaus, A., Alvarez Zarikian, C.A., and the Expedition 367/368 Scientists
Proceedings of the International Ocean Discovery Program Volume 367/368
publications.iodp.org
https://doi.org/10.14379/iodp.proc.367368.105.2018

Site U15011
Hans Christian Larsen, Zhimin Jian, Carlos A. Alvarez Zarikian, Zhen Sun, Joann M. Stock, Adam Klaus, Jacopo Boaga, Stephen A. Bowden, Anne Briais, Yifeng Chen, Deniz Cukur, Kelsie A. Dadd, Weiwei Ding, Michael J. Dorais, Eric C. Ferré, Fabricio Ferreira, Akira Furusawa, Aaron J. Gewecke, Jessica L. Hinojosa, Tobias W. Höfig, Kan-Hsi Hsiung, Baoqi Huang, Enqing Huang, Xiao-Long Huang, Shijun Jiang, Haiyan Jin, Benjamin G. Johnson, Robert M. Kurzawski, Chao Lei, Baohua Li, Li Li, Yanping Li, Jian Lin, Chang Liu, Chuanlian Liu, Zhifei Liu, Antonio Luna, Claudia Lupi, Anders J. McCarthy, Geoffroy Mohn, Lachit Singh Ningthoujam, Michael Nirrengarten, Nobuaki Osono, David W. Peate, Patricia Persaud, Ning Qiu, Caroline M. Robinson, Sara Satolli, Isabel Sauermilch, Julie C. Schindlbeck, Steven M. Skinner, Susanne M. Straub, Xiang Su, Liyan Tian, Froukje M. van der Zwan, Shiming Wan, Huaichun Wu, Rong Xiang, Rajeev Yadav, Liang Yi, Cuimei Zhang, Jinchang Zhang, Yang Zhang, Ning Zhao, Guangfa Zhong, and Lifeng Zhong2
Keywords: International Ocean Discovery Program, IODP, JOIDES Resolution, Expedition 367, Expedition 368, Site U1501, northern South China Sea, continent–ocean transition zone, outer margin high, hyperextension, continental breakup, thinning, rifting, basement, Cenozoic, Mesozoic, prerift, land facies, Eocene marine deposition, subsidence
MS 367368-105: Published 28 September 2018
Site summary
Background and objectives
Site U1501 (proposed Site SCSII-41A; 18°53.0923′N, 115°45.9455′E) (Sun et al., 2016) within the South China Sea (SCS) northern margin (Figure F1) is located on a broad regional basement high (outer margin high [OMH]). The OMH is the most landward of four distinct highs within the continent–ocean transition (COT) and is followed seaward by Ridges A, B, and C (Figures F2, F3, F4). Site U1501 is located at 2845.8 m below sea level (mbsl). Small rift basins of presumed Paleogene age are located on top of the OMH (Figure F2). These basins can be traced landward into much deeper half-graben basins that formed during the main phase of crustal extension. The rift basins located on the OMH, therefore, offer options to recover the stratigraphy of these basins by drilling to moderate depths, testing existing stratigraphic interpretations, and extrapolating the findings margin wide. Recovering and characterizing these sequences were key objectives at Site U1501, and the specific goal was to constrain the timing and duration of crustal extension, the tectonic vertical movements during rifting, and the subsequent postrift thermal subsidence. The crystalline basement at Site U1501 is most likely located far below the acoustic basement at ≈600 m and was not an objective for this site.
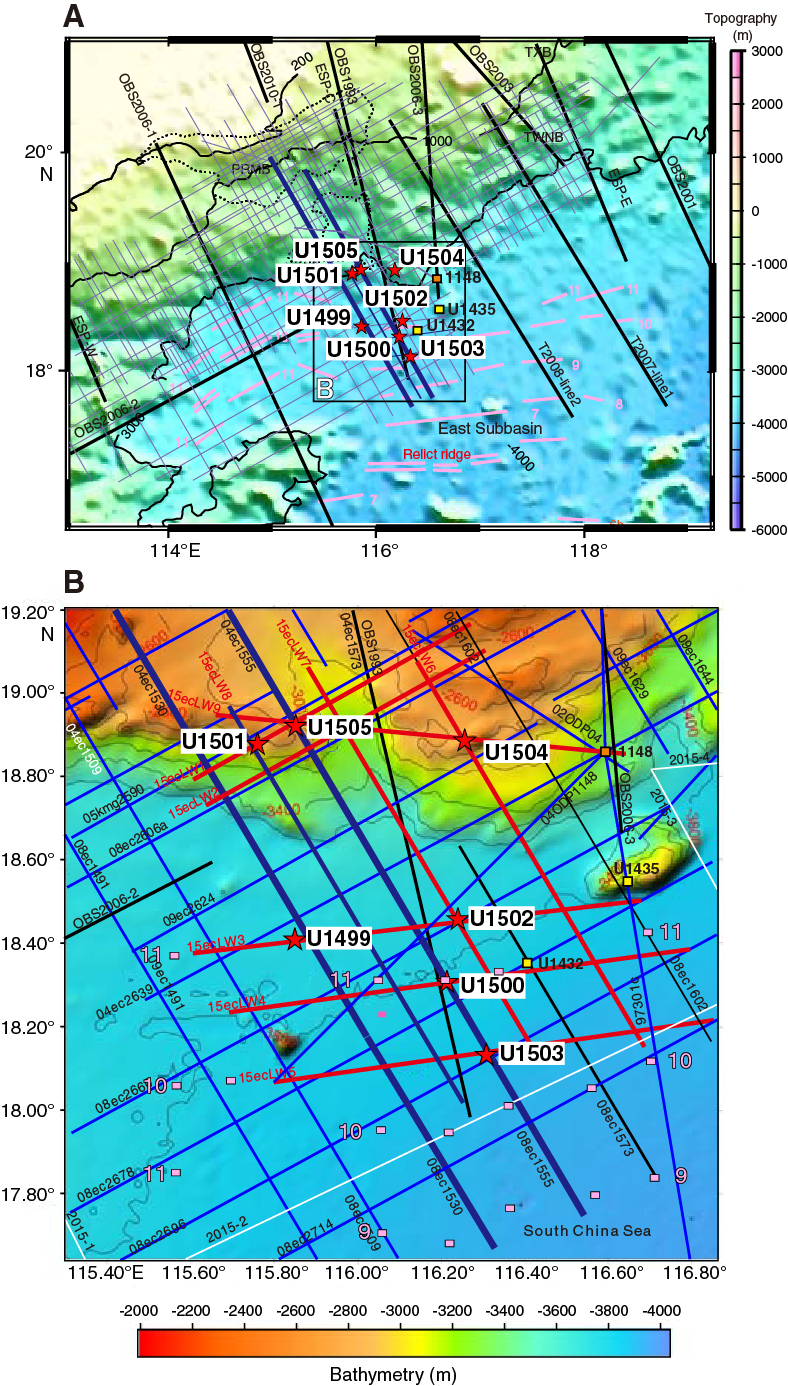
Figure F1. Seismic data coverage.
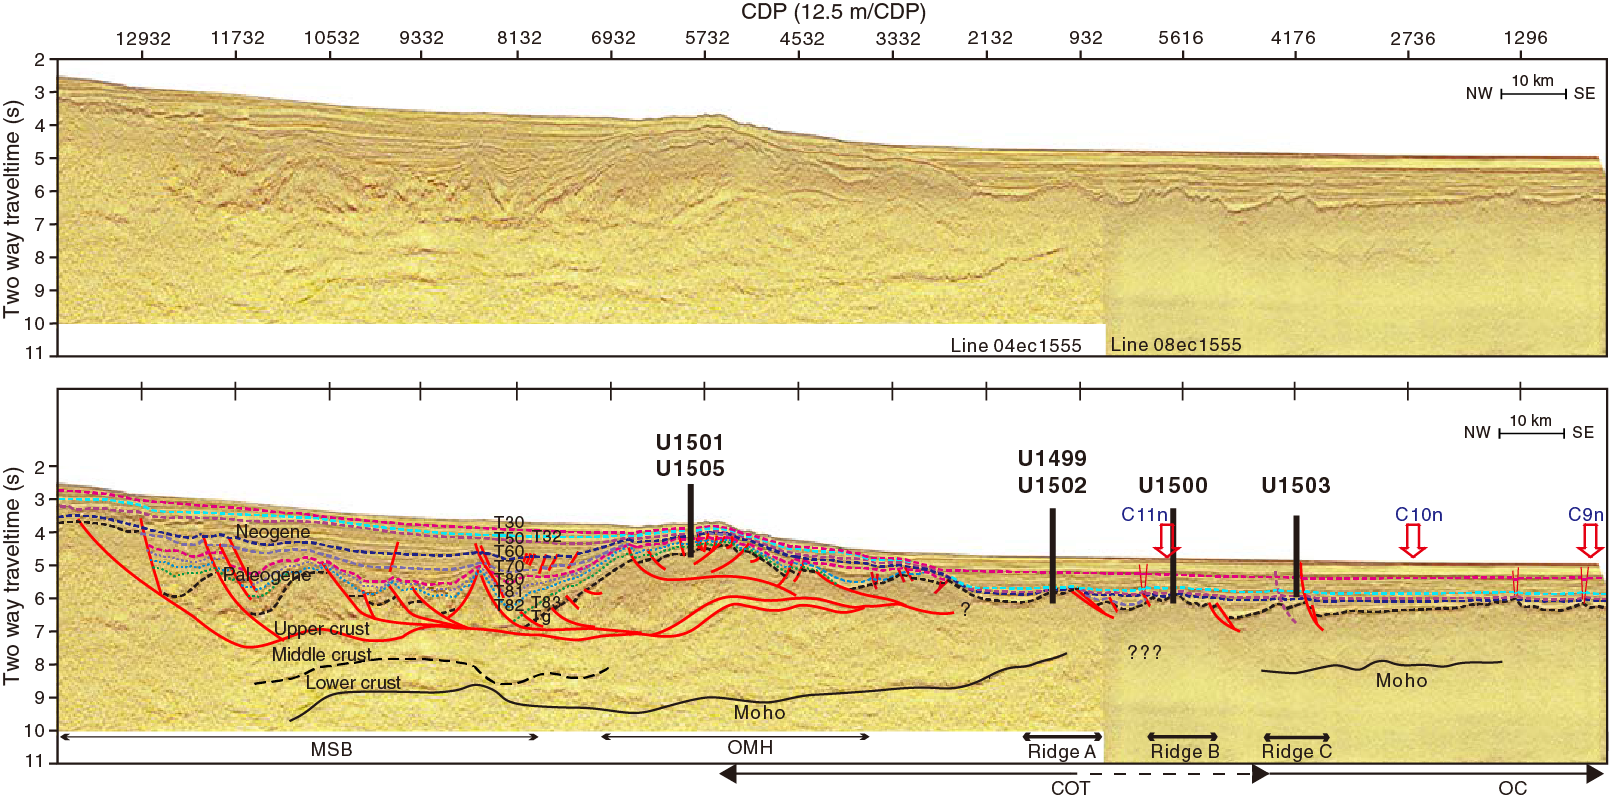
Figure F2. Seismic reflection data without and with interpretation.
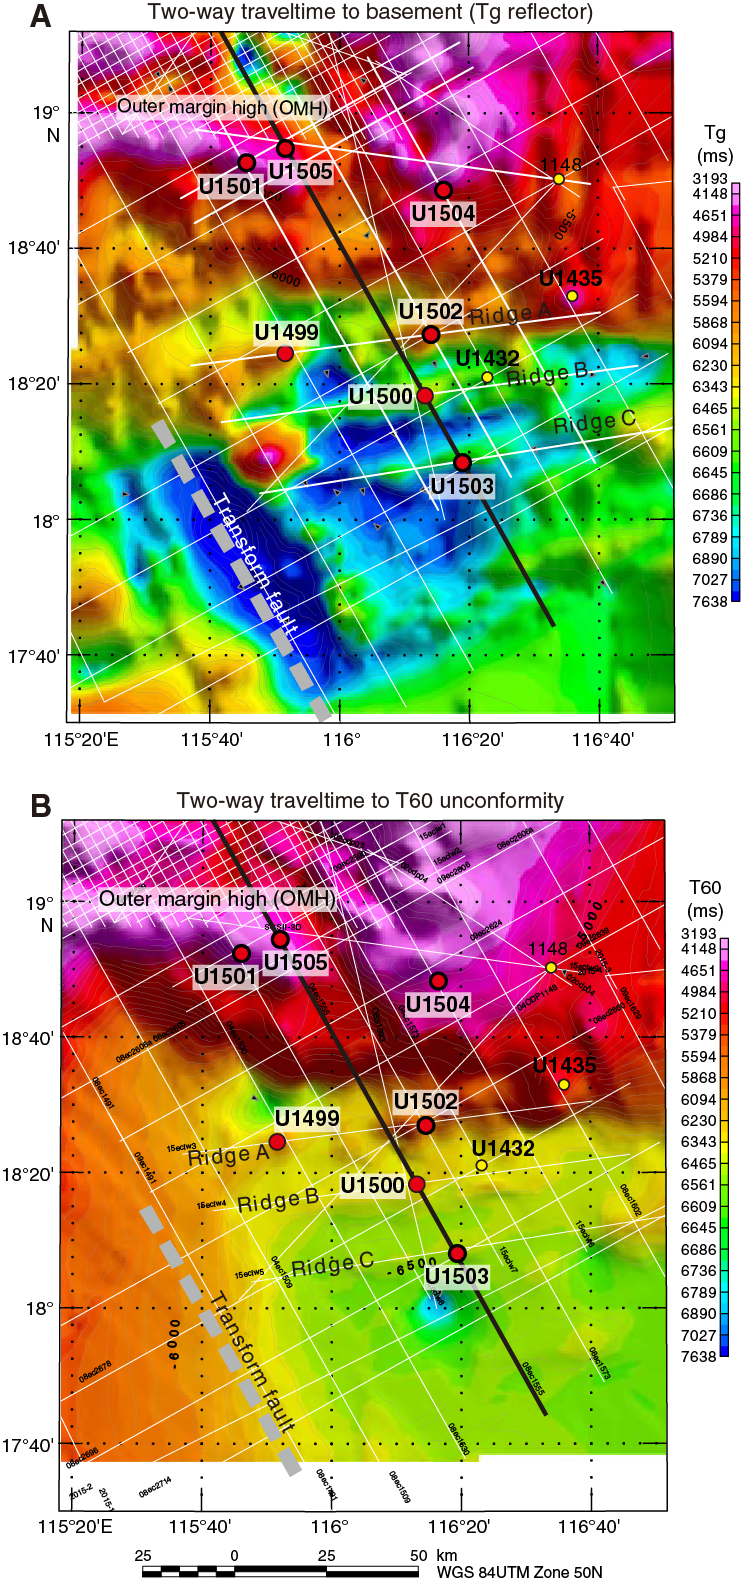
Figure F3. Two-way traveltimes to Tg and T60 unconformities.
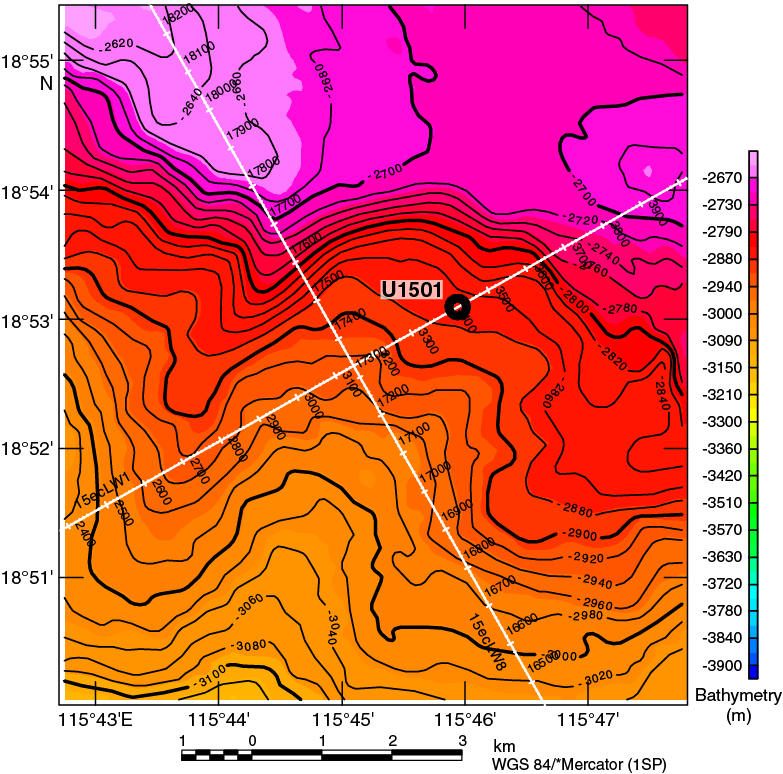
Figure F4. Bathymetry with seismic lines.
At 2846 mbsl, Site U1501 is one of the few Ocean Drilling Program (ODP) and Integrated Ocean Drilling Program sites in the SCS above the modern carbonate compensation depth (CCD) of the SCS. Sites U1504 and U1505, also at the OMH, are situated at <3000 mbsl. The younger stratigraphy is therefore also the focus of some secondary scientific objectives related to Neogene environmental development of the SCS and adjacent landmasses of Southeast Asia. Among these secondary objectives are to (1) reconstruct the history of the east Asian monsoon evolution and of deepwater exchanges between the SCS and Pacific Ocean and (2) explore the sedimentary responses to the Cenozoic regional tectonic and environmental development of the Southeast Asia margin.
Operations
We conducted operations in four holes at Site U1501. In Holes U1501A and U1501B, Core 1H missed the sediment–water interface and retrieved full core barrels, indicating that the core was shot from below the seafloor. Hole U1501C (18°53.0919′N, 115°45.9485′E; 2846 mbsl) was cored with the advanced piston corer (APC) system from the seafloor to 461.8 m and recovered 447.8 m (96.3%). Hole U1501D (18°53.0929′N, 115°45.9370′E; 2846 mbsl) was drilled without coring from the seafloor to 433.5 m and then cored with the rotary core barrel (RCB) system to 644.3 m. A total of 78.8 m of core was recovered (37.4%). Hole U1501D was logged with the triple combo tool string from 113 to 299.3 m.
Lithostratigraphy
The sedimentary succession recovered at Site U1501 is composed of clay-rich nannofossil ooze, silty clay, clayey silt, sand, siltstone, sandstone with minor conglomerate, and rare volcanic ash. The succession is divided into three major lithostratigraphic units (I, II, and III) distinguished on the basis of sediment composition, particularly the relative abundance of the calcareous and siliciclastic fractions (Figure F30).
Lithostratigraphic Unit I is a 303 m thick, Holocene–upper Oligocene succession dominated by clay-rich nannofossil ooze and nannofossil ooze with clay, with minor amounts of nannofossil-rich foraminifer sand or silty sand. A felsic volcanic ash layer occurs in Section 368-U1501A-1H-7, and an ash pod was observed in Section 368-U1501C-3H-1. Unit I is divided into the following subunits:
- Subunit IA (0−25.47 m),
- Subunit IB (25.47–66.17 m),
- Subunit IC (66.30–156.70 m),
- Subunit ID (156.80–191.99 m),
- Subunit IE (191.99–293.09 m), and
- Subunit IF (293.90–303.01 m).
These divisions are based on changes in lithology, particularly the clay to nannofossil ratio, the presence and abundance of foraminifers, and/or physical properties. The lower contact of Unit I is erosional and marked by the emplacement of a poorly sorted sandy layer. At the boundary, marked changes in P-wave velocity, natural gamma radiation (NGR), magnetic susceptibility, porosity, moisture and density (MAD), color, carbonate content, and biostratigraphy indicate a small hiatus (Figure F30). Unit I was deposited in a deep-marine environment, and lithologic changes between subunits likely reflect the amount of terrigenous input into a relatively open ocean setting. This input may be delivered as buoyant sediment plumes from shallower shelf environments and rarely by weak (distal) turbidity currents. Soft-sediment deformation in Subunit IB indicates slumping downslope of parts of the sequence.
Lithostratigraphic Unit II is 296 m thick and late Oligocene to late Eocene in age. The unit consists of variable amounts of clay, silt, and sand with minor nannofossil-rich clay, nannofossil ooze, and silt with organic matter. Gravel-sized grains occur, including shell fragments and glauconite, as well as carbonate and pyrite concretions. Unit II is divided into six subunits:
- Subunit IIA (303.01–385.26 m),
- Subunit IIB (388.80–452.69 m),
- Subunit IIC (452.60–482.33 m),
- Subunit IID (491.00–519.80 m),
- Subunit IIE (529.30–548.64 m), and
- Subunit IIF (548.64–598.91 m).
The uppermost two subunits define a fining-upward succession of glauconite-sand dominated to siltstone and clay overlain by clay with nannofossils. Subunits IIC and IE are dominated by sandstone with calcite; Subunit IID has more fine-grained, organic-rich lithologies; and Subunit IIF is similar to Subunit IIB but has more coarse-grained sediment and distinctive weak red and reddish gray intervals within the green glauconite-bearing sands. Coarse sand– to pebble-sized shell fragments are common in Unit II, and coral fragments were occasionally observed in the upper part of the unit. Glauconite and quartz minerals dominate the siliciclastic grain component. Diagenetic pyrite is common. Unit II most likely represents a gradual change upward from shallow-water (outer shelf or upper continental slope) to deepwater (lower slope) depositional environments. The Unit II/III boundary was not recovered but is marked by an abrupt change in magnetic susceptibility, NGR, and P-wave velocity. A change in the apparent dip of strata from near horizontal in Unit II to ~20° in Unit III suggests that the contact is unconformable.
Lithostratigraphic Unit III (598.91 m to the bottom of the hole) is well lithified and composed of poorly sorted, feldspar-rich sandstone interbedded with moderately to well-sorted, medium- to fine-grained sandstone and, rarely, siltstone and poorly sorted conglomerate. The age is unknown because no fossils were recognized. Unit III is divided into two subunits: IIIA (598.91–629.79 m) and IIIB (629.79–643.56 m). Subunit IIIA is composed of coarse-grained heterolithic sandstone, sandstone with calcite clasts, and minor conglomerate and siltstone. Pebble- to cobble-sized clasts include felsic intrusive and volcanic rocks, sedimentary rocks, metamorphic rocks, and rare gabbro. Subunit IIIB consists of sandstone and minor sandstone with organic matter. Subunit IIIB is finer grained than Subunit IIIA and has finely laminated intervals. We speculate that Unit III was formed in continental to littoral environments with a provenance not far from the site.
Structural geology
Unit I shows predominantly horizontal to subhorizontal bedding with local soft-sediment deformation structures such as slump folds. Unit I is devoid of any structures related to tectonic deformation, apart from some rare normal faults with minor offsets.
Unit II is characterized by subhorizontal to gently dipping bedding. Steep dips up to 40° are locally observed in close relation to parallel lamination and are therefore interpreted as cross-laminae. In contrast to Unit I, deformation structures were observed within Unit II, although their occurrence is rather heterogeneously distributed. Planar to irregular millimeter-scale normal faults and joints were observed in Subunit IIA, typically with offsets ranging from 0.1 to 0.5 cm and apparent dips of 10°–40°. Striations and slickensides were documented locally where the surfaces of such structures are exposed. Deformation in the underlying Subunits IIC–IIF is essentially characterized by randomly distributed occurrence of single to branched uniform calcite and quartz veins. Recognition of deformational structures was difficult due to drilling disturbance throughout this unit.
The acoustic basement marks the top of Unit III. This unit shows a weak tilting of stratified beds expressed in apparent dips on split core surfaces up to ~20°. Again, deformation structures remain scarce and heterogeneously distributed in Unit III. The recognized structures consist of veins, fractures, and local microfaults associated with cataclastic fault gouge.
In conclusion, despite the various tilting of reflectors (~5°) and the proximity of extensional structures observed on seismic profiles, only weak evidence of bedding tilting and/or deformation structures was observed at this site, possibly due to the nature of the sediments.
Biostratigraphy
All core catcher samples at Site U1501 were analyzed for calcareous nannofossils, diatoms, and foraminifers, with select core catchers examined for ostracods. Additional samples were taken from the split working-half sections when necessary to refine the ages between core catcher samples. Preservation of calcareous microfossils varies from good in Unit I (Cores 368-U1501A-1H, 368-U1501B-1H, and 368-U1501C-1H through 44X) to poor in Units II and III (Cores 368-U1501C-45X through 62X and 368-U1501D-2R through 5R). Planktonic foraminifers and calcareous nannofossils are abundant in Unit I, common to rare in Unit II and upper Unit III, and barren in the rest of Unit III (Cores 368-U1501D-6R though 27R). Diatoms are few with moderate preservation in Samples 368-U1501A-1H-CC, 368-U1501B-1H-CC, and 368-U1501C-1H-CC and 2H-CC. The rest of the core catcher samples are barren of diatoms with the exception of Samples 368-U1501C-3H-CC, 4H-CC, 33F-CC through 35F-CC, and 46X-CC, in which diatoms are rare with poor preservation. Diatoms are common in burrows found in interval 368-U1501C-35F-1, 118–119 cm, with poor preservation.
Forty biostratigraphic datums were identified in a mostly continuous succession from the Eocene to Holocene, which indicates that Holes U1501C and U1501D penetrated late Eocene or older strata (Figure F30). The Pleistocene/Pliocene boundary (~2.6 Ma) was placed within Core 368-U1501C-7H, the Pliocene/Miocene boundary (~5.3 Ma) within Core 9H, the Miocene/Oligocene boundary (~23.0 Ma) between Cores 41X and 42X, and the Oligocene/Eocene boundary (~33.9 Ma) between Cores 53X and 54X. Sedimentation rates vary from ~13 mm/ky in the early Oligocene, ~11 mm/ky in the Miocene, and ~14 mm/ky in the Pliocene to 24 mm/ky in the Pleistocene. Low sediment accumulation rates (~3.6 mm/ky) during the late Eocene through the early Oligocene and in the late Miocene suggest the presence of hiatuses in the sedimentary record during these periods. In contrast, higher sediment accumulation rates (35 mm/ky) exist during the late Oligocene and the early Miocene.
Predominance of shallow-water benthic foraminifer and ostracod assemblages in Cores 368-U1501C-45X through 62X and 368-U1501D-2R through 6R indicate an upper bathyal to continental shelf paleoenvironment during the Eocene to the early Oligocene. Predominantly abyssal benthic foraminifers and ostracods above Core 368-U1501C-44X indicate that deepwater conditions existed in this part of the SCS since the early Oligocene.
Paleomagnetism
Paleomagnetic investigations combined measurement and in-line alternating field (AF) demagnetization of archive-half sections on the 2G Enterprises superconducting rock magnetometer (SRM) with the measurement of discrete samples either AF or thermally demagnetized.
The rock magnetic experiments on six representative samples from Hole U1501C show saturation remanent magnetization (SIRM)/χ ratios between 12.8 and 14.6 kA/m, indicating the predominance of greigite in Unit I of Hole U1501C, also documented by scanning electron microscopy (SEM) in 2–10 µm grains. Thermal demagnetization behaviors show that greigite dominates the natural remanent magnetization (NRM), at least downhole to 83 m. However, the magnetic remanence left above 575°C suggests contributions from additional phases such as maghemite (Curie temperature [TC] = ~590°–675°C) or hematite (TC = ~675°C).
Both AF and thermal treatments on discrete samples successfully removed the steep low-temperature/coercivity component that represents the drilling overprint. The mean inclination gathered from the high-temperature component is 37.3° ± 6.6°, corresponding to a paleolatitude of 20.8° ± 3.3° for Unit I (see Lithostratigraphy). Many of the AF-demagnetized discrete samples reveal trends of reversed or normal polarity in the last step of demagnetization (50 mT) and are more difficult to interpret.
The magnetostratigraphy in Holes U1501C and U1501D is based on directions derived from the raw moments measured by the SRM after 25 mT demagnetization step and from the corroborative evidence from discrete samples. Magnetostratigraphy was correlated to the standard timescale and plotted along with the tie points from the microfossil ages from shipboard paleontologists. The paleomagnetic and paleontological age constraints match well over most of the section (Figure F30). A succession of eight normal and five reversed events was recognized in Hole U1501D. However, the lack of biostratigraphic constraints throughout Hole U1501D prevented even a tentative correlation of these events with the standard timescale.
Geochemistry
Interstitial water samples were obtained downcore to 450 m (Subunit IIB). Within Unit I, variations are mainly the result of diagenetic and microbial processes, and measurements of alkalinity, phosphate, ammonia, and sulfate are within the typical ranges for the region (3.5–5 mM alkalinity, 250–510 μM phosphate, <30 μM ammonia, and <26 μM sulfate). However, more atypically (particularly when compared to Expedition 367 Site U1499), the main changes associated with microbial processes are notable only within the uppermost 25 m in Subunit IA and are typical of organic matter degradation. Deeper than 25 m within Unit I, changes in interstitial water chemistry appear inhibited until 300 m. These changes may be a consequence of the low organic carbon concentration and high carbonate content (~50 wt%) of Unit I. Decreases in sulfate concentrations with depth are more pronounced in Unit II (>300 m), and within this zone there is heavy pyritization and total sulfur (TS) contents are high, suggesting sulfate reduction has taken place. Within the uppermost part of Unit II (300–370 m), chloride, bromide, and sodium are notably lower (chloride = 500 mM, cf. 565 mM; bromide = 0.75 mM, cf. 0.9 mM; and sodium = 410 mM, cf. 480 mM). This difference in interstitial water chemical composition is sharp and could result from pressure-isolated units retaining a distinct formation water chemistry or from the migration of chloride-poor formation water.
Headspace gas concentrations are below background laboratory levels in all samples collected from Site U1501 (<1% ppmv). Total organic carbon (TOC) content is typically <0.5 wt% in Unit I, except from 0 to 50 m (Subunit IA). Within this interval, a typical black marine mud has a TOC of ~1 wt%. TOC was also typically <0.5 wt% in Units II and III, except for a few carbonaceous lithologies: sandstones with plant phytoclasts associated with an ash-rich boghead coal in Unit II (interval 368-U1501D-9R-1, 10–15 cm) and a bitumen-impregnated sandstone in Unit III (interval 27R-1, 12–16 cm). TS content is low in Unit I: ~1 wt% in Subunit IA and below effective shipboard detection limits of 0.01 wt% for the rest of Unit I. TS content is higher in Unit II; >1 wt% in the muddier uppermost part of Unit II and an average of 0.5 wt% in the sandier, deeper part.
Elemental compositions primarily reflect geological units and changes in lithology. Within Unit I, carbonate contents are high and exceed 50 wt% within foraminifer-rich intervals (compositionally a limestone). Within Units II and III, carbonate is less common, and the units are predominantly siliciclastic with a distinction between units that are mud rich and feldspathic and sandier units toward the base of the hole. Calcium and strontium are associated with biogenic sediments in Unit I, but in deeper units they covary with aluminum. Within the base of Units II and III, sodium and potassium are both high, which is consistent with the dominant presence of feldspathic sediments. The higher aluminum proportion within the uppermost part of Unit II is consistent with the muddier, clay-rich lithologies present here.
Physical properties
Hole U150A is divided into four units based on the sediment and rock physical properties. Physical properties (PP) Unit 1 (0–300 m) experienced the most evident changes in sediment compaction, which is expressed by increasing bulk density (from 1.4 to 2.0 g/cm3) and P-wave velocities (from 1450 to 1930 m/s) and decreasing porosity (from 85% to 45%) with depth. Because PP Unit 1 consists mostly of calcareous ooze, it has relatively low NGR (between 20 and 40 counts/s) and magnetic susceptibility (between 10−6 and 10−5 SI). The onset of PP Unit 2 (300–450 m) is marked by a rapid increase in NGR and porosity values and a rapid decrease in bulk densities and P-wave velocities, corresponding to a shift to a different lithologic unit with sand, silt, and clay-enriched sediments. Within the entire unit, NGR is persistently high (60–80 counts/s), whereas magnetic susceptibility remains as low as 10 × 10−5 SI. P-wave velocities and bulk densities continue to increase with core depth. Most physical properties of PP Unit 3 (450–600 m) have similar values to those of Unit 2, except that P-wave velocities are extremely high, up to 4000–6000 m/s at some interbeds, and bulk densities and porosities increase and decrease to 2.6 g/cm3 and 2%–3%, respectively, at parallel depths. PP Unit 4 (600–657 m) is distinct from other units due to higher mean values of NGR (80 counts/s), bulk density (2.6 g/cm3), magnetic susceptibility (500 × 10−5 SI), and P-wave velocity (4500 m/s). Throughout the hole (0–657 m), thermal conductivities increase from 0.7 to 3.4 W/(m·K), most likely as a result of increasing sediment compaction and changes in sediment compositions. L* reflectance values are highly relevant to weight percent carbonate in sediments, which exhibit relatively high L* values between 100 and 160 in the upper 300 m and thereafter remain as low as 90.
Downhole measurements
Wireline logging was conducted in Hole U1501D using a modified triple combo tool string that included the Hostile Environment Natural Gamma Ray Sonde (HNGS), Hostile Environment Litho-Density Sonde (HLDS), High-Resolution Laterolog Array (HRLA), and magnetic susceptibility sonde (MSS). The triple combo run collected good data between 115.1 m (base of the drill pipe) and 300 m, where it encountered an impenetrable obstruction. Four logging units are defined:
- Logging Unit 1 (base of the drill pipe to 190 m wireline depth below seafloor [WSF]) is characterized by intervals of large hole diameter and relatively high variability in NGR and magnetic susceptibility.
- Logging Unit 2 (190–260 m WSF) is characterized by a relatively constant hole diameter, relatively homogeneous logs, and submeter-scale layering.
- Logging Unit 3 (260–275 m WSF) again shows a relatively large hole diameter, as well high variability in NGR, density, and resistivity logs.
- Logging Unit 4 (275–300 m WSF) exhibits relatively large values of resistivity and magnetic susceptibility.
The upward log pass indicated a collapsed hole at ~156.3 m drilling depth below seafloor (DSF) on the caliper curve, and for safety reasons no further attempts to descend deeper than that undergauge spot were made. Because the interval of the collapsed hole was located only ~40 m below the base of the pipe, the originally planned Formation MicroScanner (FMS)-sonic tool string was not run. Four in situ formation temperature measurements were made in Hole U1501C, yielding a geothermal gradient of 81.4°C/km and a calculated heat flow of 100.1 mW/m2. These values are comparable to the relatively high values observed at some ODP and Integrated Ocean Drilling Program sites in this part of the SCS.
Background and objectives
Site U1501 is located at 2845.8 mbsl on a broad, regional basement high (OMH) within the SCS northern margin (Figures F2, F4). The OMH features prominently in the two-way traveltime (TWT) depth to basement map and is one of four distinct basement highs found across the COT. The OMH is the most landward of these highs within the COT and is followed seaward by Ridges A, B, and C (Figure F3). The crustal thickness below the OMH is significantly greater than that of the ridges located more seaward within the COT. Site U1501 is located near the crossing of seismic Lines 15ecLW8 and 15ecLW1 (Figures F5, F6).
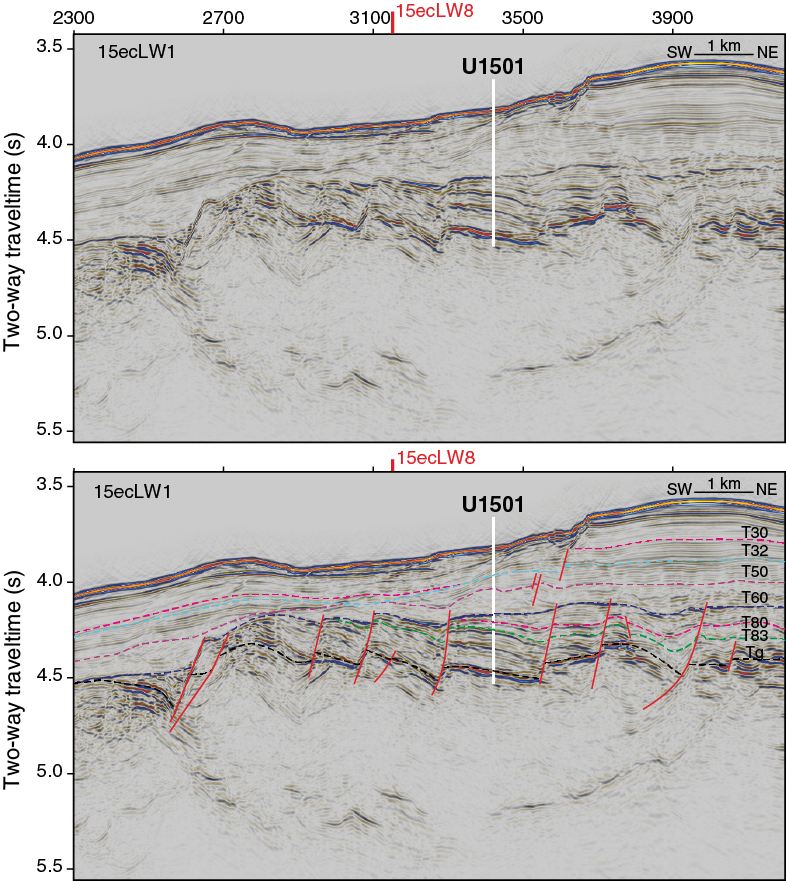
Figure F5. Seismic dip Line 15ecLW1.
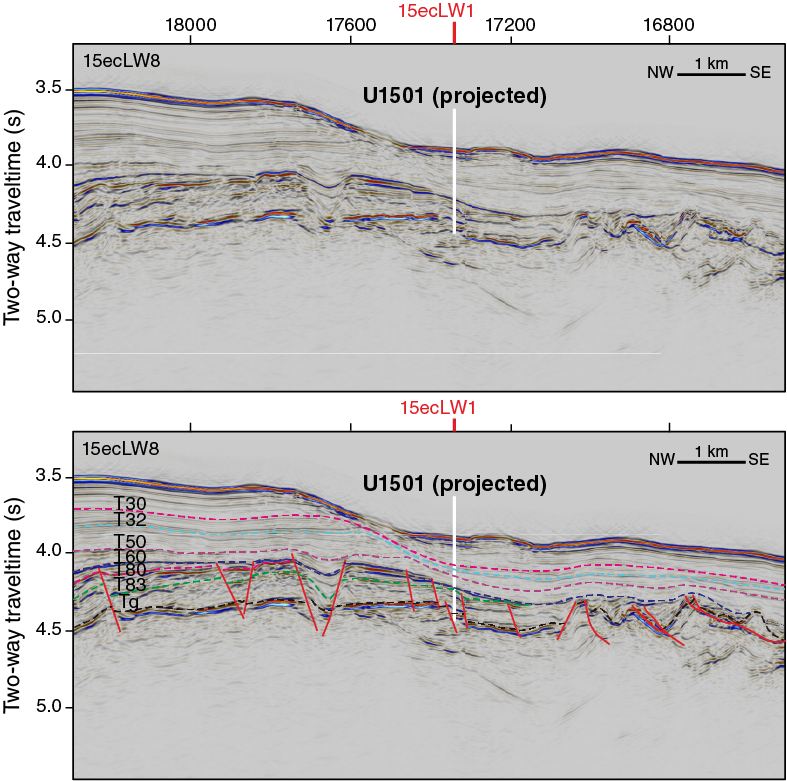
Figure F6. Seismic strike Line 15ecLW8.
Small rift basins are located on top of the OMH (Figure F3). An important feature of these OMH basins is that they can be traced landward on seismic data into much deeper half-graben basins that formed during the main phase of crustal extension. The sediment fill of these basins shows development from initial rifting and half-graben fill to subsequent postrift subsidence (Figure F2). The seismic stratigraphy established on industry seismic data (with well control) from the inner margin is extrapolated into these deep fault basins, including those located on the OMH (Figure F5). Therefore, the latter offers options to recover the stratigraphy of these basins by moderately deep drilling, testing existing stratigraphic interpretations, and extrapolating the findings margin wide. The key objective of Site U1501 is to sample the stratigraphic record from one of the small rift basins on top of the OMH. Ideally, the sequence targeted by Site U1501 would represent all stages from prerift sediments through synrift to postrift fill. To recover and characterize these sequences are key objectives of Site U1501, with the specific goal of constraining the timing and duration of crustal extension, the tectonic vertical movements during rifting, and the subsequent postrift thermal subsidence. Unlike the basement at Ridges A, B, and C, the nature of the crystalline basement below the OMH is not an objective at Site U1501 and is most likely located far below the Tg horizon planned as the deepest target at the site.
The predrilling interpretation of the seismic unconformities (T30 to T83 and Tg; see Correlation to seismic data in the Expedition 367/368 methods chapter [Sun et al., 2018a]) around Site U1501 is shown in Figure F5. There are clear indications of seismic reflectors below the Tg reflector in this location, so it is not interpreted as crystalline basement. Poorly constrained seismic velocities of these strata (stacking velocities; CNOOC, unpubl. data) suggest that older sediments could be present. The sub-Tg reflectors seem to be approximately conformal with the overlying package of sediments just around Site U1501. However, further to the southwest of the site around common depth point (CDP) 2800, the seismic data suggest that sub-Tg strata form a tight, synclinal structure truncated by the Tg reflector (Figure F5). The nature and age of the strata represented by these deeper sub-Tg reflectors are completely unknown but are generally considered to be of pre-Cenozoic age in this location.
Site U1501 is located on seismic Line 15ecLW1 at CDP 3421 (Figure F5). This seismic line is interpreted to be close to a true dip line with regard to the tilted faults blocks (tilted northeast) because crossing seismic Line 15ecLW8 (Figure F6) generally shows more horizontal orientation of the strata (i.e., strike line) within the fault blocks. Note, however, that the position of Site U1501 is projected ~1700 m from the northeast into Line 15ecLW8. This projection in a structurally complex area like the OMH must therefore be accounted for in any interpretation. Nevertheless, using the velocity structure obtained from drilling for depth conversion, the dip of the post-Tg strata within the fault block drilled at Site U1501 is estimated to be ~5° toward the northeast and likely to be close to the actual dip. Using the same velocity model (see Physical properties and Correlation to seismic data), the normal faults associated with the block rotation are estimated to dip 55°–65° southwest.
The faults offset the Tg reflector as much as 75 ms TWT (90–120 m pending seismic velocities). The faults also affect the interpreted T60 unconformity, but in most places these offsets are interpreted to be more like drape structures over a tectonically generated relief with only minor fault offsets, possibly generated by differential compaction. In some places, however, the T60 unconformity can be interpreted as having been significantly faulted (e.g., around CDP 2600 at Line 15ecLW1). Nevertheless, the main faulting is interpreted to be between the age of the lowermost post-Tg strata and the age of the T60 unconformity. This entire interval is therefore an important objective with regard to the timing and environment of rifting, including vertical crustal movements.
The predrilling interpretation of the seismic stratigraphy of this critical interval shows the T83 (unknown age) and T80 (38.0 Ma) unconformities to be present above the Tg reflector and below the T60 unconformity (23.0 Ma). Sampling this interval will help us determine the environment before the SCS ocean basin formed, possibly including its earliest transgression history. However, the T70 unconformity (33.9 Ma), interpreted to represent final breakup and the approximate start of seafloor spreading, is interpreted (predrilling) to have been eroded away at the OMH by the younger T60 unconformity (Figure F5). However, enough of the rift-to-drift sequence would likely be in place at Site U1501 to meet our objectives, and despite several alternate drill sites that were identified, none held better prospects to recover the T70 unconformity than Site U1501. The basin-wide T60 unconformity is prominently present at Site U1501. The nature of this profound unconformity is an objective together with the post-T60 unconformity stratigraphic interval. This upper interval is expected to provide information on paleowater depth changes within the lower to middle Miocene deposits and thereby constrain the rate of thermal subsidence following initial tectonic subsidence.
The younger stratigraphy is the focus of some secondary scientific objectives related to Neogene environmental development of the SCS and adjacent landmasses of Southeast Asia. Among these objectives are (1) to reconstruct the history of the East Asian monsoon evolution and of deepwater exchanges between the SCS and Pacific Ocean and (2) to explore the sedimentary responses to the Cenozoic regional tectonic and environmental development of the Southeast Asia margin.
The water depth (2850 m) at Site U1501 makes it one of the few ODP and Integrated Ocean Drilling Program sites within the SCS above the modern CCD. Its hemipelagic deposits, rich in calcareous microfossils, enable the application of stable isotopes and faunal analyses. Key objectives were reconstructions of the monsoonal climate changes of the SCS and surrounding land and upper and deep water variations in the western Pacific Ocean. Particularly, through a comparative study with ODP Leg 184 and IODP Expedition 349 sites, Site U1501, with its sequence of prerift, synrift, and postrift sediments, will greatly help us to understand the sedimentary and paleoenvironmental responses to the tectonic events and the basin evolution experienced by the SCS.
Operations
We conducted operations in four holes at Site U1501. The original plan included two holes. The first hole was to be cored to ~650 m with the APC/extended core barrel (XCB) system, followed by downhole measurements with the triple combo and FMS-sonic tool strings. The second hole was to have a reentry system to ~640 m followed by coring to ~1063 m and logging with the triple combo, FMS-sonic, and Versatile Seismic Imager (VSI) tool strings. Actual operations differed significantly from the original plan. Mudlines were missed in Holes U1501A and U1501B, with Core 1H for each hole retrieving a full core barrel. Hole U1501C (18°53.0919′N, 115°45.9485′E; 2845.8 m water depth) was cored from the seafloor to 461.8 m and recovered 447.8 m (96%). Hole U1501D (18°53.0929′N, 115°45.9370′E; 2845.8 m water depth) was drilled without coring from the seafloor to 433.5 m and cored to 644.3 m, recovering 78.8 m of core (37%). Coring summaries for Holes U1501A–U1501D are presented in Table T1. We also document our port call activities at the start of the expedition in this section.
Table T1. Site U1501 core summary. View table in PDF format. Download table in CSV format.
Hong Kong port call
Expedition 368 South China Sea Rifted Margin started at 0754 h (all times presented are UTC + 8 h) on 9 April 2017 with the first line ashore at the China Merchants Wharf in Hong Kong. After the ship cleared immigration and customs, the Expedition 368 Co-Chief Scientists, IODP staff, and a group of 11 scientists representing each ship laboratory moved onto the ship and started crossover with their Expedition 367 counterparts. Loading and offloading operations began after clearance was issued. Sixty tons of barite were loaded. The rig crew began breaking down 68 stands of 5½ inch drill pipe and laying them out on the riser hold hatch. All life rafts were offloaded for inspection and returned prior to sailing.
The rest of the Expedition 368 scientists boarded the ship on the morning of 10 April and settled into their rooms. Later that morning, they were introduced to life on board the R/V JOIDES Resolution and participated in the laboratory and ship safety tours. Loading and offloading operations continued with the loading of 40 short tons of sepiolite and the containerized science ocean freight, along with fresh and refrigerated food products and 300 metric tons of potable water. Cores from the two previous expeditions (366 and 367) were offloaded from the vessel and loaded into refrigerated containers for shipment to the Kochi Core Center (Japan) and Gulf Coast Repository (US), respectively. Ninety joints of 5½ inch drill pipe were offloaded to the pier, and another 72 were broken down and stowed on the riser hold hatch.
On 11 April, major port call activities included loading of 1212 metric tons of marine gas oil and 40 short tons of sepiolite mud (total = ~80 short tons). All dry food for Expedition 368 was loaded. The rest of the 204 joints of 5½ inch drill pipe were broken down and offloaded to the pier to be returned for inspection and refurbishment. The vessel continued conducting annual class, radio, and lifeboat surveys. Tours were conducted for members of the Hong Kong Sea Cadet Corps and Hong Kong Baptist University.
On 12 April, casing-loading operations were initiated and tours were conducted for students and faculty from the Southern University of Science and Technology. On 13 April, casing-loading operations were completed. Mud motors, underreamers, and reentry equipment were all loaded and stowed for transit. Annual lifeboat inspections and all other certifications were completed. All equipment was secured for sailing.
At 0600 h on 14 April, Hong Kong immigration authorities boarded the ship and cleared the personnel and vessel for departure. The harbor pilot arrived on board shortly after 0900 h, and with assistance from two harbor tugs, the JOIDES Resolution was underway, with the last line released at 0912 h. We proceeded to the pilot station, and after a 6 nmi transit, the pilot disembarked the ship at 0954 h. The sea voyage continued for the next 24 h. During the transit, the Co-Chief Scientists presented the scientific objectives for Site U1501 and the Captain held the first fire and boat safety drill. Later that day, the Co-Chief Scientists, key JOIDES Resolution Science Operator staff, and ship’s crew met to review the coring and logging plan for Site U1501. The scientists moved into their working shifts, and the noon-to-midnight shift resumed laboratory activities. The 255 nmi transit from Hong Kong to Site U1501 was completed at 0837 h on 15 April at an average speed of 10.6 kt.
Holes U1501A–U1501C
After arriving at Site U1501, we lowered the thrusters, deployed a seafloor beacon, and put together the APC/XCB bottom-hole assembly (BHA) and started lowering it to the seafloor (2857 mbsl) in preparation for coring. The calculated precision depth recorder (PDR) depth for the seafloor at Site U1501 was 2873.4 meters below rig floor (mbrf), and we chose to place the bit at 2868 mbrf to take the first core. An APC core barrel was lowered to the bit, and coring in Hole U1501A started at 2345 h on 15 April 2017. The mudline core recovered 9.5 m of sediment, and the seafloor depth was calculated to be 2868 mbrf (2857.1 mbsl). Hole U1501A was terminated at 0025 h on 16 April, and the drill string was repositioned to attempt to core a better mudline at the site. With the bit at 2863 mbrf, we started Hole U1501B at 0100 h and again recovered a full core barrel, indicating once again that the APC was fired at or below the seafloor, and Hole U1501B was terminated. The vessel was offset 10 m east. The bit was raised to 2843 mbrf in an attempt to start Hole U1501C, but the core barrel was retrieved empty. We then lowered the bit to 2848 mbrf for a second spud attempt at 0300 h and retrieved another empty core barrel. We then lowered the bit to 2856.4 mbrf and successfully spudded Hole U1501C at 0510 h, recovering 9.3 m of core and establishing a seafloor depth at 2856.7 mbrf (2845.8 mbsl).
Hole U1501C was cored to 156.8 m using the full-length APC coring system. The half-length APC (HLAPC) was deployed to deepen the hole to HLAPC refusal at 257 m. We changed to the XCB system and deepened the hole to a final depth of 469.1 m. Nonmagnetic core barrels were used on all cores. All full-length APC cores were oriented using the Icefield MI-5 core orientation tool. The APC system recovered 156.5 m of core (100%). Temperature measurements were taken on Cores 5H (47.3 m), 8H (75.8 m), 11H (104.3 m), and 14H (132.8 m). Partial strokes were recorded on Cores 16H and 17H (151.8 and 156.8 m, respectively). The HLAPC system penetrated 100.2 m and recovered 88.54 m (88%). Partial strokes were recorded on Cores 22F (180.3 m) and 25F through 39F (189.7–257.0 m). The bit was advanced 4.7 m after each core despite the partial strokes and 1.5 m after Core 39F.
The XCB system was deployed to core to refusal, recovering 199.5 m (97%). A hard layer was met at 383.5 m (Core 53X), and a small piece of sandstone was recovered in the cutting shoe after retrieving the core barrel. Core recovery after that consisted of mudstone. Three more hard layers were found at 447.1, 454, and 460 m. Refusal was reached after no advancement was accomplished for ~10 min at 469.1 m. There were no indications that casing would be needed to core deeper using the RCB system at this site. The bit was then retrieved to the rig floor, clearing the seafloor at 0935 h and clearing the rotary table at 1420 h on 19 April. Overall, 62 cores were taken over a 461.9 m interval with 444.8 m of recovery (96%). Time spent in Hole U1501C was 84.75 h (3.5 days).
Hole U1501D
The vessel was offset 20 m west for Hole U1501D. The RCB outer core barrel was set up in the rotary table, and the core barrels were spaced out. While making up the BHA, at 1600 h on 19 April 2017 a leak was detected in the low clutch diaphragm. The diaphragm was replaced and back on line by 0500 h on 20 April. The core barrels were prepared and spaced out, the remainder of the RCB BHA was made up, and the drill string was run in the hole to 2816 mbrf. The top drive was picked up, and the bit was spaced out to start Hole U1501D.
Hole U1501D was drilled without coring to 433.5 m, and then RCB coring penetrated from that depth to 644.3 m. The hole was conditioned for logging, the rotary shifting tool was run to release the bit, heavy mud was spotted at the bottom of the hole, the top drive was set back, and the bit was raised to 113 m for logging.
With an average heave of <1 m, the rig floor was set up for logging, and a modified triple combo tool string was made up and run into the open hole. During its descent, the tool string hung up at ~3030 mbrf (173.3 m). After six attempts, the tool string finally passed through the obstruction with significant drag and then continued downhole smoothly until it reached 3156 mbrf (299.3 m). At that depth, the full weight of the tool hung up, and it would no longer advance. The consensus between the wireline engineer and the drilling and operations personnel was that the hole was collapsed and logging would have to be conducted from that depth upward.
During the logging run, there was significant overpull at ~173.3 m. The caliper log indicated that the hole was collapsed to approximately the same diameter as the tool itself. It was deemed unsafe to go below that depth with any subsequent passes; therefore, the rest of the logging program was terminated. The drill pipe was recovered to the rig floor, clearing the seafloor at 1225 h on 24 April and the rotary table at 1715 h.
A total of 90 cores were recorded for the site. The full-length APC system was deployed 19 times. The HLAPC system was deployed 22 times, the XCB coring system was deployed 23 times, and the RCB coring system was deployed 26 times. The total drilled interval was 433.5 m without recovery. The interval cored with the APC system was 175.8 m with a recovery of 176.6 m (100%). The interval cored with the HLAPC system was 100.2 m with a recovery of 88.54 m (88%). The interval cored with the XCB system was 204.9 m with a recovery of 199.53 m (97%). The RCB system cored 210.8 m and recovered 78.77 m (37%). Total core recovered at Site U1501 was 543.10 m, and the overall recovery was 79%. Total time spent at Site U1501 was 224.75 h (9.4 days).
Lithostratigraphy
We constructed a composite lithostratigraphy by combining Holes U1501A–U1501D (Figure F7). We defined three lithostratigraphic units at Site U1501 based on visual core description, smear slide and thin section inspection, and X-ray diffraction (XRD) analysis (see Lithostratigraphy in the Expedition 367/368 methods chapter [Sun et al., 2018a]). The lithostratigraphic units and subunits are primarily defined by principal lithology. Several of the subunits exhibit gradual changes, complicating a sharp definition of their boundaries. The precise depth of boundaries between certain lithostratigraphic subunits in intervals of poor core recovery was difficult to determine; therefore, the boundaries were refined using physical property measurements (e.g., magnetic susceptibility, color reflectance spectroscopy, and seismic velocity) (see Physical properties; also see Physical properties in the Expedition 367/368 methods chapter [Sun et al., 2018a]) and CaCO3 measurements in Figure F8.

Figure F7. Lithostratigraphic summary.

Figure F8. Bulk mineralogy and carbonate content.
The sedimentary succession recovered at Site U1501 extends from the pre-Cenozoic(?) to the Holocene and is dominated by clay-rich nannofossil ooze, silty clay, clayey silt, sand, and sandstone. The succession is divided into three major lithostratigraphic units (I, II, and III) that are distinguished on the basis of sediment composition, particularly the relative abundance of calcareous and siliciclastic fractions. Unit I is dominated by clay-rich nannofossil ooze and nannofossil ooze with clay. The transition from Unit I to Unit II is abrupt and erosive and marked by a change from nannofossil-rich sediment in Unit I to siliciclastic-dominated clay, silt, and sand in Unit II.
The Unit II/III boundary was not recovered, but it is marked by an abrupt change in magnetic susceptibility, NGR, and P-wave velocity. Unit III is well lithified and comprises sandstone, sandstone with gravel, and minor conglomerate and laminated siltstone. Units I–III are further divided into several subunits.
Unit descriptions
Unit I
-
Intervals: 368-U1501A-1H-1, 0 cm, to 1H-CC, 14 cm;
368-U1501B-1H-1, 0 cm, to 1H-7, 14 cm;
368-U1501C-1H-1, 0 cm, to 45X-1, 51 cm - Depths: Hole U1501A = 0−9.73 m; Hole U1501B = 0–9.77 m; Hole U1501C = 0–303.01 m
- Age: Holocene to Oligocene
Lithology and sedimentary structures
Lithostratigraphic Unit I, in the upper part of the stratigraphy, was fully recovered in Hole U1501C. The top of Unit I was also recovered in Holes U1501A and U1501B. The dominant lithologies are clay-rich nannofossil ooze and nannofossil ooze with clay. Both lithologies can additionally have foraminifers, silt, or ash (e.g., “with foraminifers” as suffix) and minor amounts of nannofossil-rich foraminifer sand or silty sand. One discrete volcanic ash layer was found in Section 368-U1501A-1H-7, and an ash pod was found in Section 368-U1501C-3H-1. Ash is present in small amounts in some smear slides taken from other cores (e.g., Samples 368-U1501C-6H-5, 88 cm, and 6H-6, 78 cm). Unit I is divided into six subunits (IA–IF) based on minor changes in lithology and/or physical properties (Figure F9).
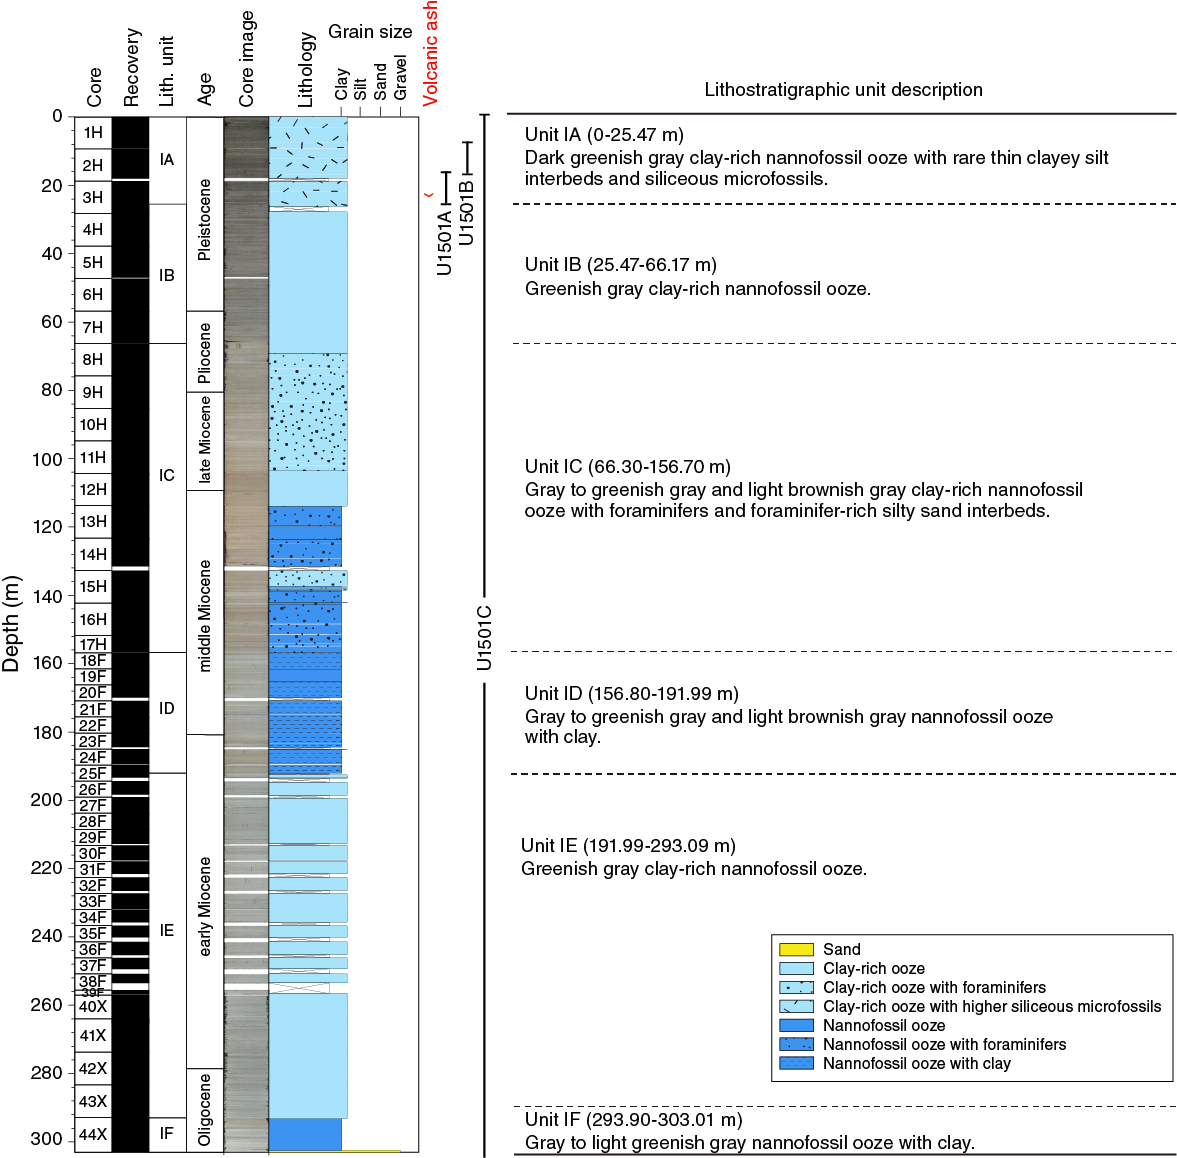
Figure F9. Simplified lithology and unit description overview, Unit I.
Bulk mineralogy and chemistry
The bulk mineralogy results of XRD analyses are listed in Table T2. Unit I sediments are composed mainly of calcite; halite; quartz; plagioclase; K-feldspar; clay minerals including smectite, illite, kaolinite, and/or chlorite; and minor amounts of pyrite. Calcite is present throughout Unit I (mostly in the form of nannofossils and foraminifers). Other minor minerals were observed in smear slides, but it was not possible to detect them through XRD analysis of bulk samples.
Table T2. Mineral percentages. View table in PDF format. Download table in CSV format.
Figure F8 shows the downcore variations in the relative abundance of minerals identified by XRD in bulk sediments at Site U1501. The percentages of most terrigenous minerals in Unit I (quartz, plagioclase, authigenic halite, and clay minerals such as illite, kaolinite, and/or chlorite) decrease downcore, whereas calcite and pyrite increase. In contrast, K-feldspar decreases downcore for the upper 60 m, increases between 60 and 140 m, and then decreases again from 140 to 280 m. These general characteristics are consistent with the observed lithologic change from clay-rich nannofossil ooze to nannofossil ooze with clay.
Compositional analyses of the nannofossil ooze in Sections 368-U1501C-44X-7, 44X-CC, and 45X-1 (Subunit IF) were made directly on the archive half of the core using the handheld portable X-ray fluorescence spectrometer (pXRF) (see Igneous and metamorphic petrology in the Expedition 367/368 methods chapter [Sun et al., 2018a]). The pXRF data are shown in Table T3. Eleven intervals of the nannofossil ooze show no variation in composition (CaO = 25–28 wt%, SiO2 = ~20 wt% and lower, Al2O3 = 4–5 wt%, Fe2O3 < 2 wt%, and MgO < 2 wt%). The lowermost few centimeters of Subunit IF close to the contact with Unit II contain black sand and have lower CaO (~18 wt%) and higher SiO2, Al2O3, and Fe2O3 (~25 wt%, ~5 wt%, and ~3 wt%, respectively). The dark nodules at the base of Subunit IF are iron and silica rich (Fe2O3 = ~10 wt% and SiO2 = 26 wt%). The Zr content of Subunit IF varies between 50 and 75 ppm. The ooze has high Sr (>750 ppm) and low Ni (<20 ppm) contents, whereas the nodules have low Sr (<100 ppm) and higher Ni (100 ppm) contents.
Table T3. Major element oxides and minor elements. View table in PDF format. Download table in CSV format.
Subunit IA
-
Intervals: 368-U1501A-1H-1, 0 cm, to 1H-CC, 14 cm;
368-U1501B-1H-1, 0 cm, to 1H-7, 14 cm;
368-U1501C-1H-1, 0 cm, to 3H-5, 84 cm - Depths: Hole U1501A = 0−9.73 m; Hole U1501B = 0–9.77 m; Hole U1501C = 0–25.47 m
- Age: Holocene to late Pleistocene
Subunit IA spans the uppermost 25.47 m of Unit I and is dominated by clay-rich calcareous ooze and clay-rich nannofossil ooze. The color of the ooze gradually changes from dark greenish gray to greenish gray. A distinct light-brown oxidized layer occurs at the top of this unit. The ooze comprises calcareous nannofossils and foraminifers, siliceous diatoms, sponge spicules, radiolarians, rare silicoflagellates, and terrigenous grains, including quartz, feldspar, clay minerals, and rare ferromagnesian minerals.
Bioturbation is moderate to heavy (apart from the slightly bioturbated top layer) with no clear layering visible. Individual burrows are difficult to distinguish but are mostly horizontal to inclined with recognizable Planolites, Thalassinoides, and Ophiomorpha (Figure F10). Distinct intervals (368-U1501C-1H-5, 6.0–6.5 cm, and 1H-5, 7.5–8.5 cm) contain more silt, and thin silt laminations are often disrupted by bioturbation (interval 3H-3, 89–133 cm).
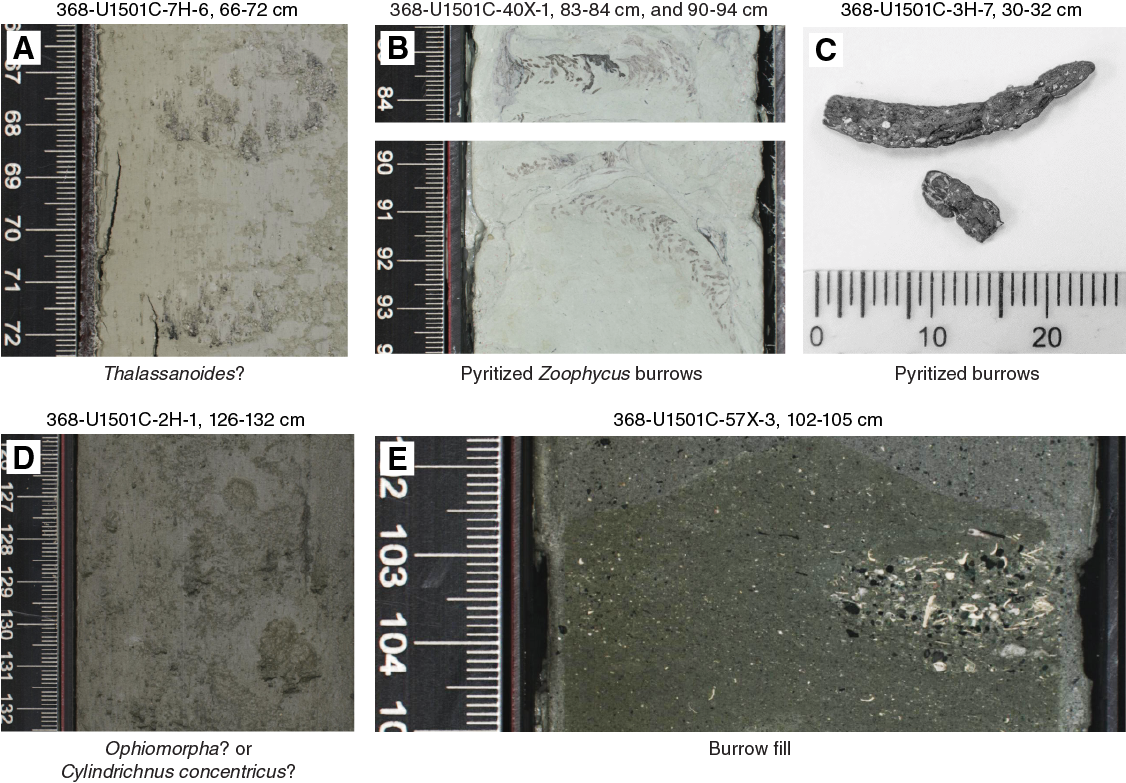
Figure F10. Diverse burrows.
Subunit IA has a discrete light gray silt-sized volcanic ash layer in interval 368-U1501A-1H-7A, 45–51 cm, and a centimeter-sized pod of volcanic ash in interval 368-U1501C-3H-1A, 29 cm. The ash is composed of silicic, platy, bubble wall, and lesser pumiceous glass shards and rare (1%–5%) plagioclase crystals (Figure F11). Although the mudline was not recovered in Hole U1501A, the drilling log indicates that the drill string was raised by 10 m before drilling of Hole U1501C commenced. The ash layer is found at 9.05 m in Hole U1501A, which is consistent with the depth of the ash patch in Hole U1501C (19.08 m). Furthermore, because the ash texture and composition is similar in the two holes, we assume that both intervals are the deposit of the same eruption. No other discrete ash intervals were observed at Site U1501.
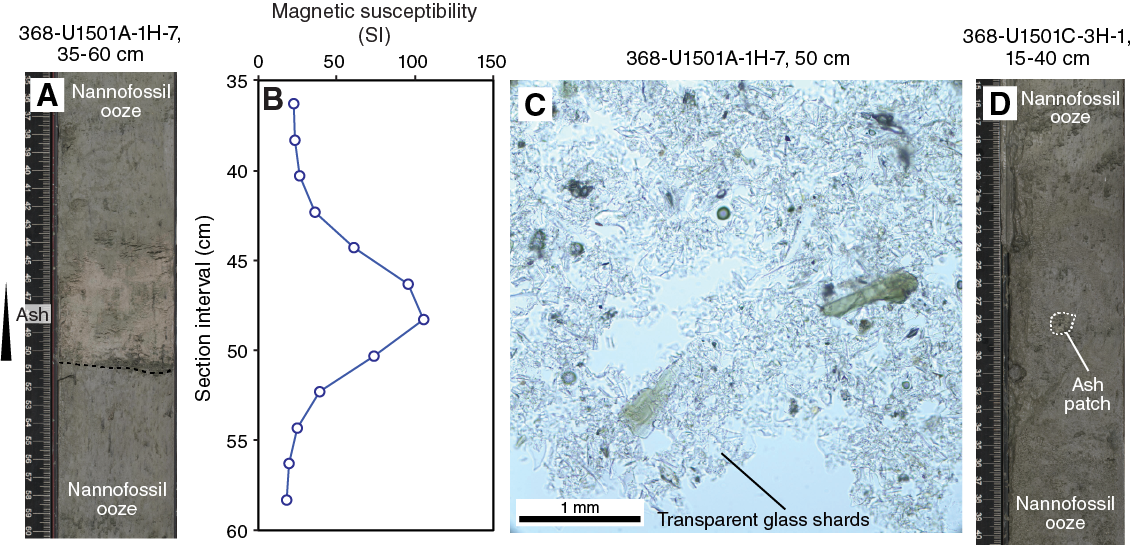
Figure F11. Ash layer.
Subunit IA shows a gradual lithologic transition into Subunit IB but with a clear change in magnetic susceptibility, porosity, density, and seismic velocity. From this boundary, there is an upward increase in biogenic silica, including diatoms, sponge spicules, and radiolarians.
Subunit IB
- Interval: 368-U1501C-3H-5, 84 cm, to 7H-CC, 11 cm
- Depth: 25.47–66.17 m
- Age: late Pleistocene to Pliocene
Subunit IB comprises a monotonous sequence of greenish gray and minor gray and dark greenish gray clay-rich nannofossil ooze. Minor dark greenish gray clay-rich nannofossil ooze with ash was found in Sections 6H-5 and 6H-6. The ooze comprises mainly calcareous nannofossils and foraminifers with minor quartz and clay minerals. Single foraminifer tests are visible on the core surface and become more abundant below Section 7H-3. Diagenetic pyrite grains are common.
The upper part of the subunit (Sections 3H-5 through 3H-7) is marked by slumping with inclined and convolute lamination and patchy color changes. Below these sections, bedding is difficult to determine due to lack of grain size or color variation and moderate bioturbation. Individual burrows are difficult to distinguish but are mostly horizontal to inclined with recognizable Planolites and Thalassinoides (Figure F10).
The base of Subunit IB is marked by both a color change to brown and light brownish sediment in Subunit IC and a lithologic change that reflects an increase in the percentage of foraminifers. This unit change is also seen in the progressive increase in measured carbonate content from ~20 wt% at the top of Subunit IB to ~40 wt% at the base (Figure F8).
Subunit IC
- Interval: 368-U1501C-8H-1, 0 cm, to 17H-4, 60 cm
- Depth: 66.30–156.70 m
- Age: Pliocene to middle Miocene
Subunit IC comprises an alternating sequence of gray, light gray, light brownish gray, greenish gray, and light greenish gray clay-rich nannofossil ooze with foraminifers; brown clay-rich nannofossil ooze with calcite; light brownish gray clay-rich nannofossil ooze and nannofossil ooze; light brownish gray silty sand; and greenish gray foraminifer-rich silty sand. The proportion of foraminifer-rich silty sand intervals increases from Core 16H to the base of the subunit.
Vague layering in the core is defined by color change. Boundaries between brownish and grayish intervals are mostly gradational, such as the color changes in Core 16H (Figure F12A), but sharp boundaries also occur, such as the one at Section 11H-6, 135 cm. Variation in color may indicate grading with fining-upward intervals recognized in Cores 11H, 14H, 16H, and 17H (Figure F12). Boundaries are usually horizontal but are inclined in Sections 10H-3 and 10H-4, possibly indicating intraformational slumping. The number of sand-sized fining-upward laminations increases from Core 15H to Core 17H.
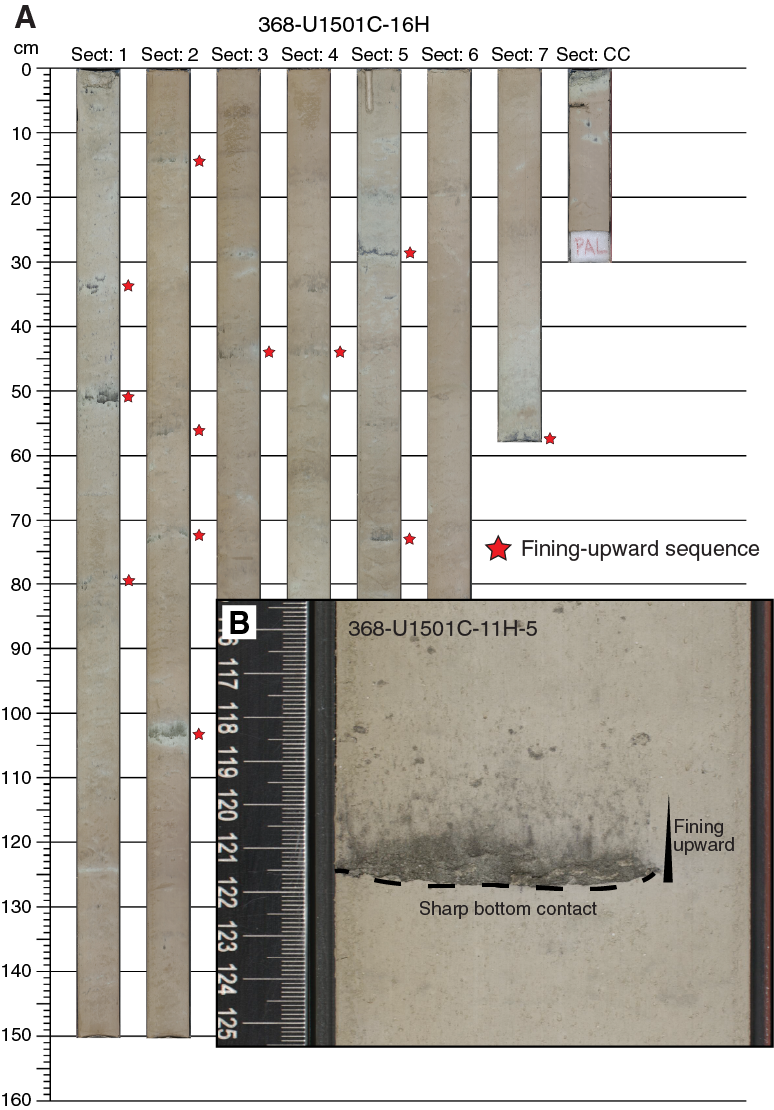
Figure F12. Core composite image.
Bioturbation varies from slight to heavy, but more intense bioturbation may be masked by the homogeneous sediment composition. Some burrows are filled with silty sand that consists mainly of foraminifers (Figure F10). Burrows are mostly horizontal to inclined, but some are vertical with recognizable Planolites.
The boundary between Subunits IC and ID is defined by a change in lithology from foraminifer-rich silty sand and nannofossil ooze with foraminifers (Subunit IC) to nannofossil ooze with clay (Subunit ID).
Subunit ID
- Interval: 368-U1501C-18F-1A, 0 cm, to 25F-2, 78 cm
- Depth: 156.80–191.99 m
- Age: middle to early Miocene
Subunit ID is dominated by nannofossil ooze with clay. The color changes gradually from the top of the subunit to the bottom from gray to light greenish gray to greenish gray to light brownish gray and gray. The sediment is well sorted and well consolidated. The average grain size is clay, and fine sand is the maximum grain size.
Contacts between layers are planar or irregular inclined and gradational horizontal. Some contacts between layers are also bioturbated. Bioturbation in Subunit ID is moderate to heavy.
The sediment is dominated by clay minerals and calcareous nannofossils, but quartz crystals are common and rare foraminifers are present, as well as traces of organic matter and pyrite. Measured carbonate content ranges from 18 to 48 wt% (Figure F8).
The lower boundary between Subunits ID and IE is characterized by a change in color and lithology, with more clay minerals in Subunit IE. A distinct increase in magnetic susceptibility and a slight decrease in NGR were observed at the transition.
Subunit IE
- Interval: 368-U1501C-25F-2, 78 cm, to 43X-CC, 38 cm
- Depth: 191.99–293.09 m
- Age: early Miocene to Oligocene
Subunit IE is composed of monotonous greenish gray clay-rich nannofossil ooze (Figure F13) that is well consolidated and well sorted with either silt or very fine sand as the maximum grain size. There is little perceptible variation in grain size, with only minor thin silt laminations. Contacts are horizontal and gradational. One thick (~1 cm) lamination with upward fining was observed. Light-colored foraminifer grains and pyrite were observed on the core surface. Pyrite also forms rare laminae. Another diagenetic feature is a 1 cm wide patch of calcite or dolomite (interval 27F-1, 29–30 cm). Bioturbation is moderate to high throughout the sequence, causing lens- and podlike textures.
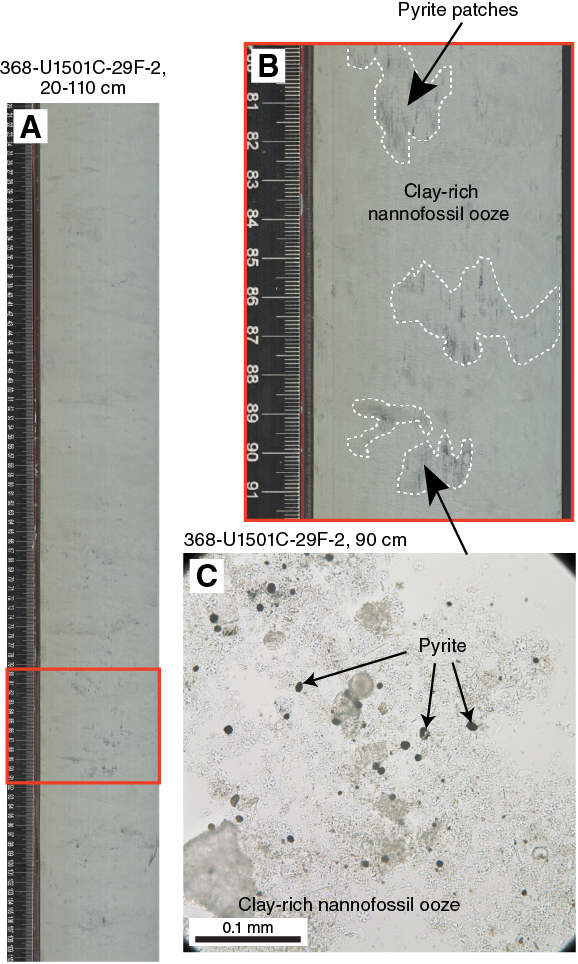
Figure F13. Clay-rich nannofossil ooze.
The nannofossil ooze of Subunit IE exhibits consistently low magnetic susceptibility (less than −20 × 10−5 SI), low NGR (<50 counts/s), high bulk reflectance, and low red color (reflectance a*), which is consistent with dilution by high carbonate content (31–46 wt%; Figure F8). Accordingly, nannofossils and foraminifers are common to abundant (50%–75%), whereas the amounts of quartz (<5%) and feldspar (<5%) are low.
The lower contact to Subunit IF is marked by the occurrence of nannofossil ooze with clay and a color change to gray and light greenish gray. Drilling disturbance varies from slight to high, and “biscuits” are the most common disturbance type.
Subunit IF
Subunit IF is a short interval (~11 m) of mainly gray to light greenish gray and greenish gray, well-sorted, well-consolidated nannofossil ooze with clay. The lowermost ~51 cm (interval 45X-CC, 0–51 cm) of this subunit is poorly sorted, matrix-supported sand with gravel. The lithologic components are heterogeneous and include cobble-sized rip-up clasts of nannofossil ooze with clay, pebble-sized botryoidal concretions (Figure F14), and sand-sized grains of glauconite and quartz embedded in a matrix of biogenic silt and clay (measured carbonate content = ~60 wt%; Figure F8). Subunit IF sediment fines upward in grain size and is heavily bioturbated. The cores are slightly to moderately biscuited or fractured due to drilling disturbances.
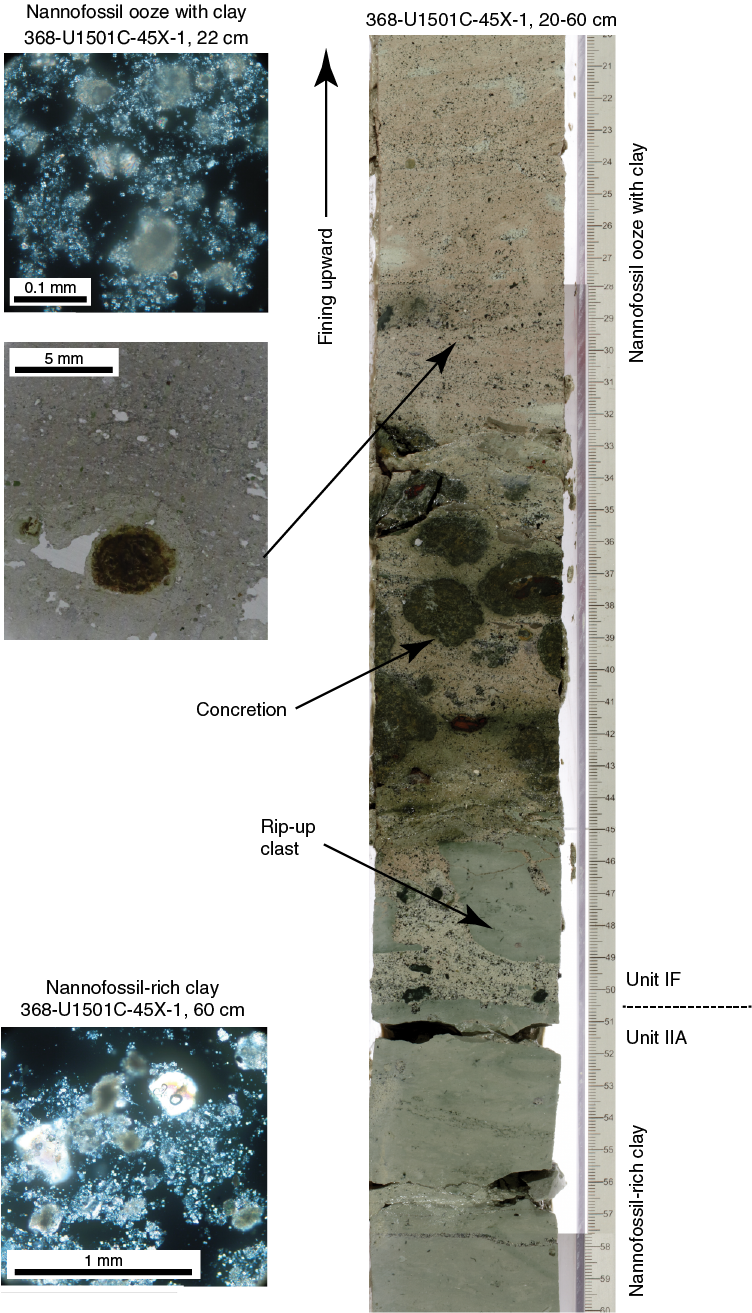
Figure F14. Contact between Units I and II.
The lower contact of Subunit IF, which is also the base of lithostratigraphic Unit I, is erosional and marked by the emplacement of a poorly sorted sandy layer (Figure F14). The lower Subunit IF boundary is also marked by distinct discontinuities in P-wave velocity, NGR, magnetic susceptibility, porosity, MAD, red-green-blue color space (RGB) colors, and blue color (reflectance b*; see Igneous and metamorphic petrology in the Expedition 367/368 methods chapter [Sun et al., 2018a]) but does not represent a major gap in sediment age (all Oligocene; see Biostratigraphy). Measured carbonate contents markedly decrease from 56–66 wt% in Subunit IF to 2–10 wt% in Subunit IIA.
Unit II
-
Intervals: 368-U1501C-45X-1, 51 cm, to 62X, 39 cm;
368-U1501D-2R-1, 0 cm, to 19R-2, 135 cm - Depths: Hole U1501C = 303.01–458.09 m (base of Unit II not recovered); Hole U1501D = 433.5–598.91 m (top of Unit II not recovered)
- Age: Oligocene to Eocene
Lithology and sedimentary structures
Lithostratigraphic Unit II was recovered in Holes U1501C and U1501D. It consists of variable amounts of clay, silt, and sand (clay, silty clay, clayey silt, sandy silt, silty sand, and sand, which may be clay rich, with sand or with clay) with some nannofossil-rich clay (Figure F14), clay with nannofossils and minor nannofossil ooze, and clayey silt and silt with organic matter. In addition, gravel-sized grains include shell fragments and glauconite, as well as carbonate and pyrite concretions. The overall carbonate contents of Unit II is significantly lower (2–10 wt%) than that of Unit I (12–66 wt%) (Figure F8). Unit II is divided into six subunits (Figure F15) based on minor changes in lithology and grain size.

Figure F15. Simplified lithology and unit description overview, Unit II.
Bulk mineralogy and chemistry
The bulk mineralogy results of XRD analyses are listed in Table T2. Unit II sediments are composed mainly of glauconite, quartz, plagioclase, K-feldspar, clay minerals (including smectite, illite, and kaolinite), and minor amounts of pyrite and halite.
Figure F8 shows the downcore variations in the relative contents of minerals identified by XRD in bulk sediments at Site U1501. Compared to Unit I, Unit II has distinct higher percentages of authigenic glauconite and terrigenous minerals, including quartz, plagioclase, K-feldspar, and clay minerals (illite and kaolinite). Unit II sediments have lower contents of calcite, pyrite, chlorite, and smectite. Most of the terrigenous minerals (illite, kaolinite, K-feldspar, and plagioclase) increase downcore in Unit II. We can only trace the downcore trend of glauconite content, rather than its precise abundance, because of its very poor crystallinity (wide peak around 7–8.9°Δ2θ) at the study site and the lack of a shipboard standard for calibration.
Compositional analyses of the clay in Sections 368-U1501C-45X-1 and 45X-2 were made directly on the archive half of the core using the handheld pXRF instrument (see Igneous and metamorphic petrology in the Expedition 367/368 methods chapter [Sun et al., 2018a]). The pXRF data are shown in Table T3. The nine analyzed intervals show no significant trends downhole. The clay has SiO2 contents between 30 and 38 wt%, Al2O3 contents between 8 and 11 wt%, and low CaO contents (<5 wt%). The intervals in Section 45X-2 have sulfur contents between 690 and 4600 ppm. Zr contents are constant at ~70 ppm.
The uppermost two subunits of Unit II define a fining-upward succession from glauconite sand dominated in Sections 61X-CC through 59X-5 to siltstone and clay in Sections 59X-5 through 53X-1 (Subunit IIB) and clay with nannofossils in Core 53X through Section 45X-1 (Subunit IIA). Subunit IIC is dominated by sandstone with calcite but shows poor recovery. Subunit IID is distinctive with more fine grained, organic-rich lithologies. Subunit IIE is similar to Subunit IIC, whereas Subunit IIF repeats Subunit IIB but has more coarse-grained sediment and distinctive weak red and reddish gray intervals between the green glauconite-bearing sands.
The sediment in Unit II is matrix supported and moderately to poorly sorted. Coarse sand- to pebble-sized shell fragments are common. Coral fragments occur occasionally in the upper part of the unit. Glauconite and quartz minerals dominate the siliciclastic grain component. Diagenetic pyrite concretions, patches, or laminae are common throughout Unit II (Figure F16). Locally, carbonate and clay concretions are found. The measured carbonate content of Subunits IIA and IIB ranges from 2 to 10 wt% (Figure F8).
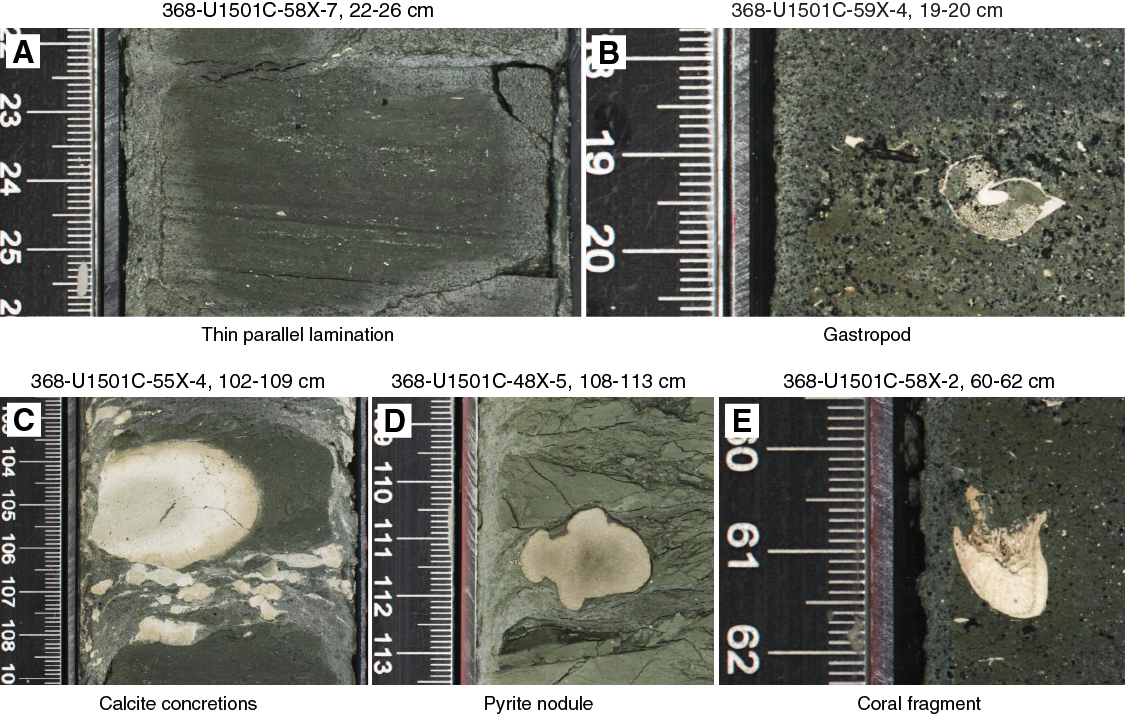
Figure F16. Special features in Subunits IIA and IIB.
Horizontal lamination and ripple lamination can be recognized even though the entire interval is variably affected by drilling disturbance. Cross-bedding is present, as well as occasional fining-upward lamination, mostly in Subunit IIB. Bioturbation in Unit II is moderate. Burrows are horizontal to gently dipping and belong to the Zoophycos ichnofacies in Subunit IIA.
Drilling disturbance within Unit II varies from slight to high. Cores are slightly to heavily biscuited and partly fractured. Core 368-U1501C-62X has basal flow-in, and Cores 368-U1501D-2R, 8R, and 15R have soupy intervals.
Subunit IIA
- Interval: 368-U1501C-45X-1, 51 cm, to 53X-CC, 26 cm
- Depth: 303.01–385.26 m
- Age: Oligocene to late Eocene
Subunit IIA is characterized by an overall fining-upward sequence from sand with clay to nannofossil-rich clay and clay-rich nannofossil ooze. The sediments are well consolidated and well sorted. Sections 45X-1, 51 cm, to 49X-CC, 39 cm, are composed of greenish gray to very dark greenish gray nannofossil clay and clay-rich nannofossil ooze with a maximum grain size of silt to fine sand. Several intervals fine upward from coarse sand to clay (e.g., intervals 48X-2, 103–151 cm, and 48X-3, 136–151 cm). Boundaries between sediment layers are horizontal and gradational. Very dark greenish gray silty clay with nannofossils was recovered from Section 50X-1, 0 cm, to 51X-CC, 34 cm. This interval shows cross-bedding, lamination, and a maximum grain size of fine sand. Grain size changes to silty clay with sand in Sections 52X-1, 0 cm, to 52X-CC, 45 cm. From Section 53X-1, 0 cm, to 53X-CC, 26 cm, the grain size increases from clayey silt with sand to silty sand and sand with clay (Figure F17). Boundaries between layers are gradational and horizontal, and lenticular bedding was observed in interval 53X-3A, 124–134 cm. The sediment is greenish gray and rich in sand-sized glauconite and quartz crystals. Shell fragments as large as 1 cm and foraminifers are common. Pyrite patches a few centimeters in size (Figure F16) occur throughout Subunit IIA. Bioturbation is moderate in the lower part of Subunit IIA (Sections 53X-1, 0 cm, to 53X-CC, 26 cm) and heavy in the upper part. The Subunit IIA/IIB boundary is characterized by a change in grain size. The recovered sediments are slightly to moderately disturbed with biscuits and fractures.
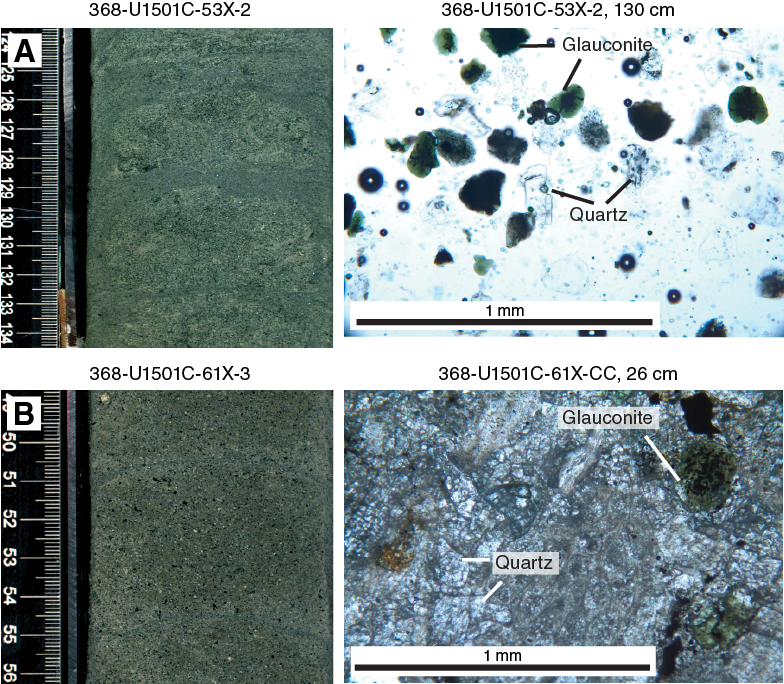
Figure F17. Glauconite sand.
Subunit IIB
-
Intervals: 368-U1501C-54X-1, 0 cm, to 61X-CC, 7 cm;
368-U1501D-2R-1, 0 cm, to 3R-CC, 40 cm - Depths: Hole U1501C = 388.80–452.69 m; U1501D = 433.5–448.24 m (top of Subunit IIB not recovered)
- Age: Eocene
Subunit IIB has well-consolidated sediment with fining-upward intervals that vary in grain size from clayey silt with sand to silty sand with clay to sand. The color changes from greenish gray (Core 368-U1501C-54X) to dark greenish gray (Sections 55X-1 through 57X-5) to very dark greenish gray (Sections 57X-6 through 58X-CC). The average grain size is silt to coarse sand, with a maximum grain size of granule and pebble. The sorting of the intervals in this subunit is moderate to poor.
Boundaries between sediment layers are gradational and horizontal, and layers fine upward (e.g., Section 59X-3). The sediment is rich in sand-sized glauconite and quartz crystals (Figure F17). There are pyrite patches throughout the subunit, especially in Sections 55X-1, 55X-2, 55X-5, 59X-3, 59X-5, 59X-6, and 60X-1 and in all sections of Core 61X. Shell fragments are common and horizontally oriented within the sediment (Figure F16). Calcite concretions occur in Section 58X-1, 42 cm, and interval 58X-CC, 16–18 cm. Bioturbation in Subunit IIB is moderate.
The Subunit IIB/IIC boundary is characterized by a change from glauconite-rich sand/sandstone to sandstone with calcite. NGR values decrease at the transition from Subunit IIB to IIC (see Physical properties). The sediment in Subunit IIB is biscuited due to drilling, with disturbance intensities from moderate to high.
Subunit IIC
-
Intervals: 368-U1501C-61X-CC, 7 cm, to 62X-CC, 39 cm;
368-U1501D-4R-1, 0 cm, to 7R-1, 93 cm - Depths: Hole U1501C = 452.69–458.09 m (base of subunit IIC not recovered); Hole U1501D = 452.60–482.33 m
- Age: Eocene
Subunit IIC is composed of gray sandstone with calcite, silty sandstone with calcite, and minor gray clayey silt with organic matter (Figure F18). The average grain size is coarse sand with a maximum of granule and pebble sizes, and the sediment is well to moderately sorted. Boundaries between sediment layers are planar and horizontal or erosive and curved. Recovery was very low (<10%) in this subunit (Figure F7). Shell fragments are abundant, and pyrite patches and calcite veins occur. The lithified sandstone is slightly bioturbated.
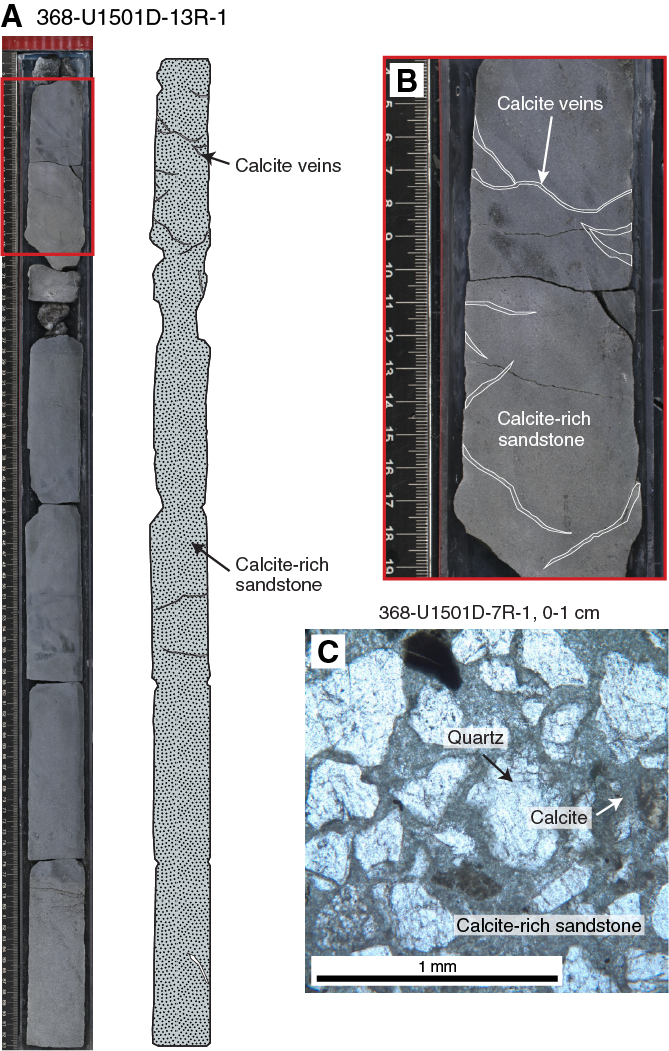
Figure F18. Calcite-rich sandstone with calcite-filled veins.
Drilling disturbance is moderate to high throughout Cores 368-U1501C-61X through 62X. The sediment is biscuited, fractured, and brecciated. Soft sediment recovered in Core 62X is interpreted as fall-in and basal flow-in and is therefore not described in any detail.
The boundary between Subunits IIC and IID is marked by a distinctive change from calcite-rich sandstone to more fine grained clay and organic-rich lithologies in Subunit IID.
Subunit IID
Subunit IID is composed of alternating laminae of dark gray to very dark gray clayey silt with organic matter or lignite (Figure F19). The sediment is slightly consolidated with an average grain size of silt and a maximum grain size of medium sand. The sediment is well to moderately sorted and characterized by very fine laminations and minor pebble-sized wood fragments. The organic matter occurs in clasts, lenses, or laminae. There is no bioturbation. The sediment is slightly soupy. Sandstone layers, similar to those described in Subunit IIC, are intercalated with the clayey silt.
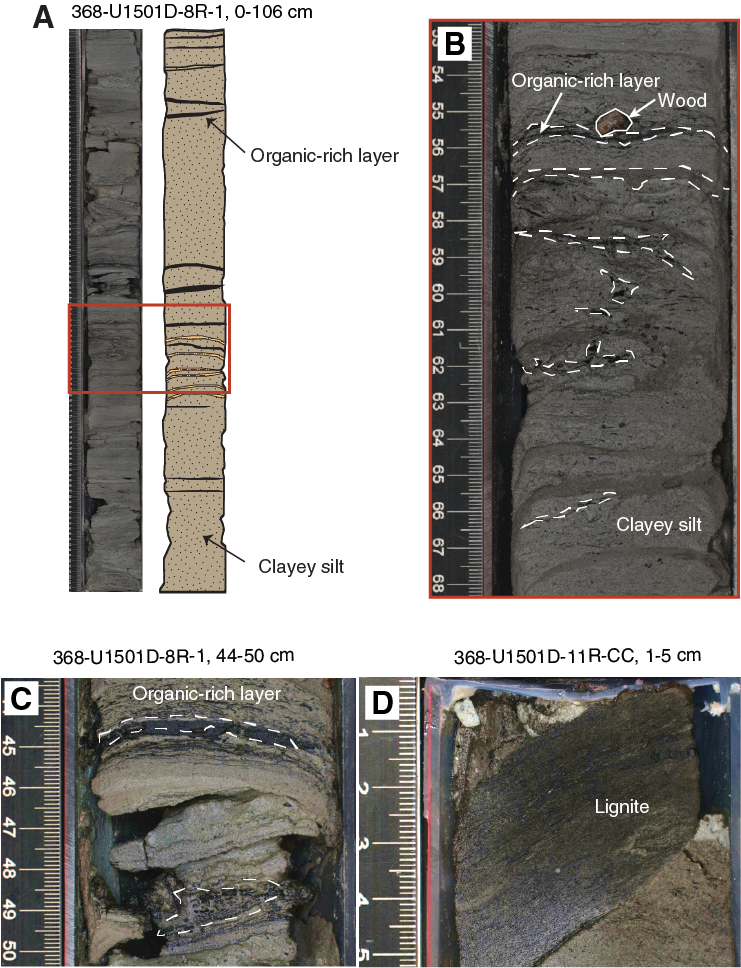
Figure F19. Thin layers of organic matter within a clayey silt.
Similar to Subunit IIC, recovery in this unit is also very low (<10%). The boundary between Subunits IID and IIE is characterized by a lack of organic-rich layers and a change to calcite-rich sandstone in Subunit IIE.
Subunit IIE
Subunit IIE is composed of gray silty sand with calcite, silty sandstone with calcite, and sandstone with calcite. The sediment is well consolidated to lithified, and the average grain size is fine to medium sand. The sediment is well sorted. Bioturbation is slight to moderate. The sediment is slightly fragmented due to drilling. This subunit appears similar to Subunit IIC (Figure F18).
Recovery in this subunit is extremely low (<6%). Subunit IIE is similar to Subunit IIC, whereas Subunit IIF repeats Subunit IIB. The boundary between Subunits IIE and IIF is marked by a change from sandstone with calcite to gray and dark greenish gray glauconite-bearing silty sand and silty sandstone.
Subunit IIF
Subunit IIF is composed of gray, dark greenish gray, greenish gray silty sand, sandy silt and sand, and silty sandstone, as well as weak red silty sand and silty sandstone. A color change to weak red is observed in Sections 17R-1, 101 cm, to 17R-2, 47 cm. The consolidation varies from well consolidated to lithified. The average grain size is from fine to coarse sand to a maximum of granule, and the sediment is well to moderately sorted. The bedding thickness is medium to thick (see Lithostratigraphy in the Expedition 367/368 methods chapter [Sun et al., 2018a]), and contacts between the beds are planar to gradational and horizontal to curved. The majority of the beds fine upward or are massive (Figure F20). The sands are rich in glauconite and quartz minerals. Pyrite is common, and patches are as large as centimeter sized (e.g., interval 16R-2, 77–129 cm). The sediment and lithified sandstone are slightly to moderately bioturbated. The sandstone is slightly fractured due to drilling disturbance. The contact with Unit III was not recovered, but Subunit IIF has marked brown- to ochre-colored alteration patches at the base (Figure F21).

Figure F20. Glauconite-rich coarse sandstone.
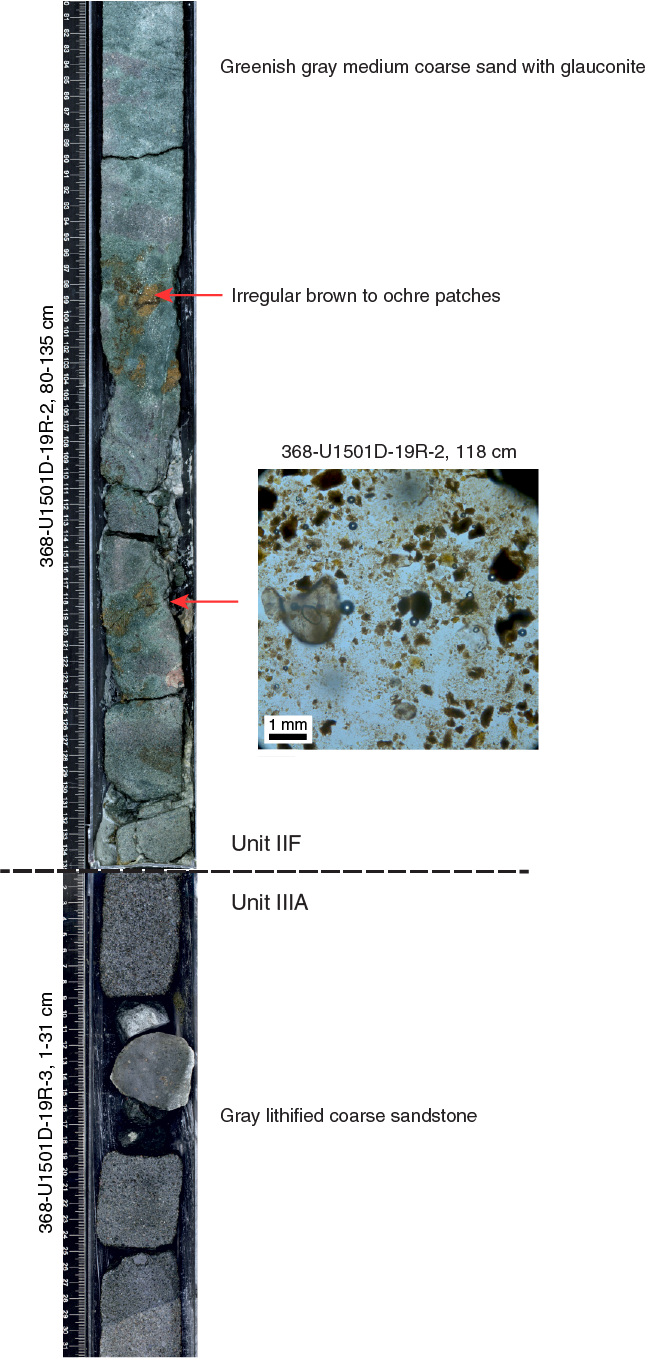
Figure F21. Lithologic change from sand to sandstone.
Unit III
Lithology and sedimentary structures
Unit III was only recovered in Hole U1501D and consists of lithified sandstone, sandstone with gravel, and minor conglomerate and laminated siltstone. Unit III is divided into two subunits (Figure F22). Pebble- to cobble-sized clasts include felsic volcanic and plutonic rocks, sedimentary rocks, metamorphic rocks, and rare gabbro (Figure F23).
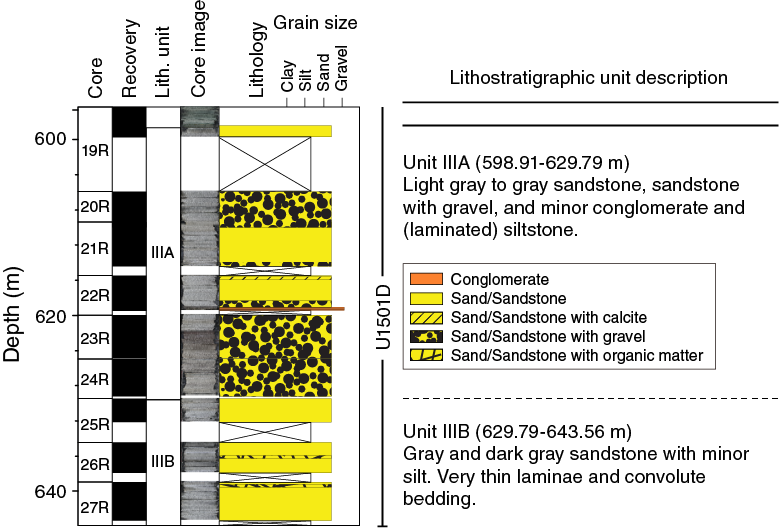
Figure F22. Simplified lithology and unit description overview, Unit III.
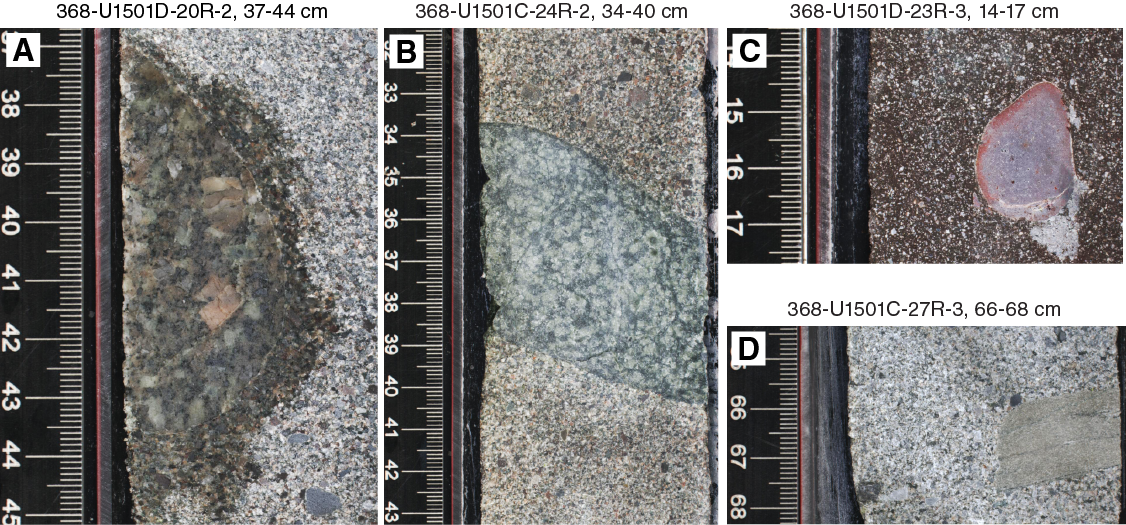
Figure F23. Diverse lithologies of pebble- to cobble-sized clasts.
The contact between Units II and III was not recovered. The base of Section 19R-2 represents Unit II, and the top of Section 19R-3 is in Unit III (Figure F21). However, the low recovery (26%) indicates that intervals are missing. The boundary is marked by an abrupt downhole increase in magnetic susceptibility, NGR, and P-wave velocity, so it is assumed that this boundary is sharp. A change in the apparent dip of strata from approximately horizontal (seismics show ~5°) in Unit II to ~20° in Unit III (see Structural geology) suggests that the contact is unconformable.
Bulk mineralogy
The bulk mineralogy results of XRD analyses are given in Table T2 and Figure F8. Unit III sediments are composed mainly of quartz, plagioclase, and K-feldspar, as well as minor amounts of kaolinite and mica. Compared to Units I and II, Unit III sediments have much higher K-feldspar and plagioclase abundances but almost no calcite, glauconite, or pyrite.
Subunit IIIA
Subunit IIIA is composed of light gray to gray lithified sandstone, sandstone with gravel, and sandstone with calcite clasts (Figure F24), along with minor conglomerate and siltstone. The average grain size is medium to very coarse sand, and the maximum grain size is as large as cobble sized. The sorting is well to moderate, but some intervals are poorly sorted because of large pebbles or cobbles. The pebble- to cobble-sized clasts consist of felsic volcanic and plutonic rocks (granite), sedimentary rocks, and rare gabbro. The bottom contacts of beds are planar, erosional, gradational, and horizontal. The sandstone layers are massive or fine upward. Interval 22R-3, 80–102 cm, contains an ~22 cm thick interval of dark gray siltstone. The contact with the overlying sandstone was not recovered, but the bottom contact with the underlying conglomerate is erosive and inclined. Intervals 22R-3, 102–105 cm, and 22R-CC, 0–19 cm, are composed of poorly sorted conglomerate.
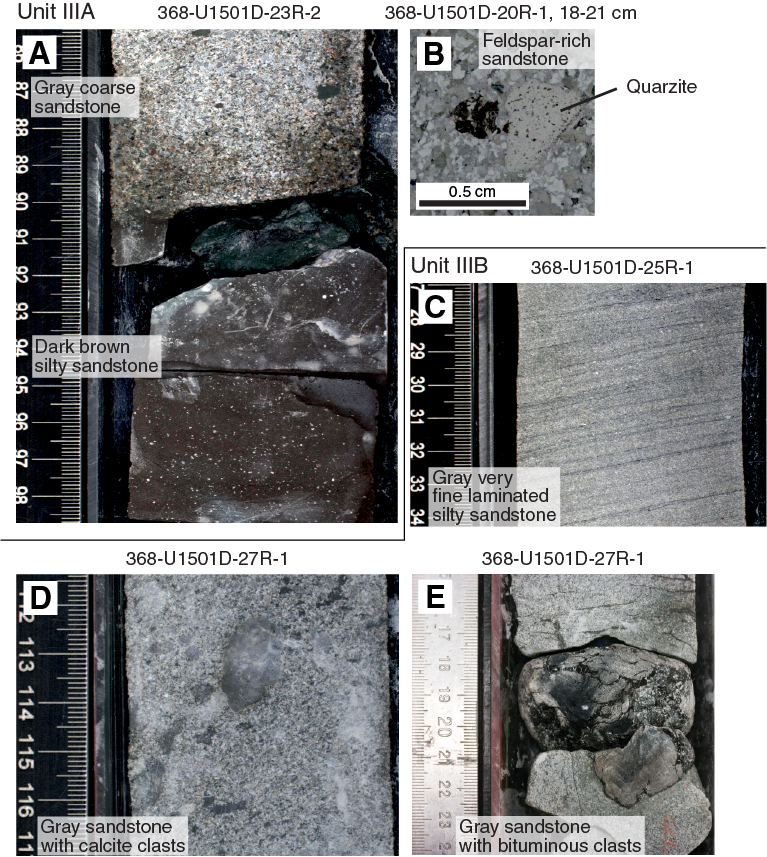
Figure F24. Overview of Unit III sandstone.
This subunit consists of heterolithic, densely packed, moderately sorted siltstone to coarse-grained heterolithic sandstone rich in quartz, feldspar, and sedimentary lithoclasts (mudstone) (Figure F24). The grains are cemented with a mixture of clay and calcite. There are minor amounts of mica, amphibole, and opaque minerals, as well as traces of glauconite pellets. Igneous (volcanic and plutonic) and metamorphic lithoclasts (quartzite) are rare. Alteration is pervasive, and most feldspar grains have been pseudomorphed by clay minerals. A cobble of slightly recrystallized granite was recovered in interval 19R-3, 13–28 cm, and is composed of quartz, feldspar, mica, and amphibole with traces of apatite and zircon.
A distinctive thick bed of dark brown clay-rich silty sandstone and clay-rich silty sandstone with gravel occurs in Sections 23R-2 (Figure F24) and 23R-3. This bed has a massive base and grades into gray silty sandstone with gravel in Section 23R-4. The fine-grained upper interval of the bed is poorly sorted with millimeter-sized feldspar grains in a fine-grained red clayey matrix.
The transition to Subunit IIIB is sharp and marked by a change from sandstone and sandstone with gravel to sandstone and sandstone with silt. Magnetic susceptibility decreases toward the base of Subunit IIIA.
Subunit IIIB
Subunit IIIB consists of light gray, gray, and minor dark gray sandstone, sandstone with silt, and minor sandstone with organic matter (Figure F24). This subunit is different from Subunit IIIA in that it is finer grained overall and has finely laminated intervals. The average grain size is fine to very coarse sand, and the maximum grain size is as large as pebble sized. The sediment is very well to moderately sorted, but some intervals are poorly sorted because of pebbles. The pebble-sized clasts consist of felsic volcanic rocks and fine-grained quartzite. The bottom contacts of the beds are planar to erosional to gradational and subhorizontal to horizontal. The sandstone layers are massive or fine upward.
Interval 26R-3, 7–54 cm, has convolute lamination intercalated between planar laminated intervals that is interpreted as soft-sediment deformation. Some intervals of fine sandstone and siltstone have plane and ripple cross-lamination. However, most beds are fairly massive or show weak grading. A bituminous clast was recovered in Section 27R-1 (Figure F24).
Discussion
Depositional environment of Unit III
Unit III consists of poorly sorted, feldspar-rich, coarse-grained sandstone with pebbles or cobbles that is interbedded with light gray and gray to dark gray moderately to well-sorted medium- to fine-grained sandstone and rarely siltstone and poorly sorted conglomerate. Both massive bedding and fining-upward grading is common in the coarse-grained sandstone and conglomerate, whereas the relatively well sorted medium- to fine-grained sandstone intervals have thin parallel bedding. Finely rippled cross-lamination, convolute bedding, pyrite patches, and organic-rich laminae and lenses were found in the fine-grained interbeds. In addition, glauconite particles occur in some thin sections. No fossils were found. In general, we speculate that Unit III was formed in a terrestrial to littoral environment with a provenance not far from the site (Figure F25). The well-sorted sandstone with parallel to low-angle cross-lamination could have been formed by wave reworking in a littoral environment. Overall, the downhole color change from more or less brownish to grayish rock and the decrease in average grain size may indicate a change to a deeper water environment.
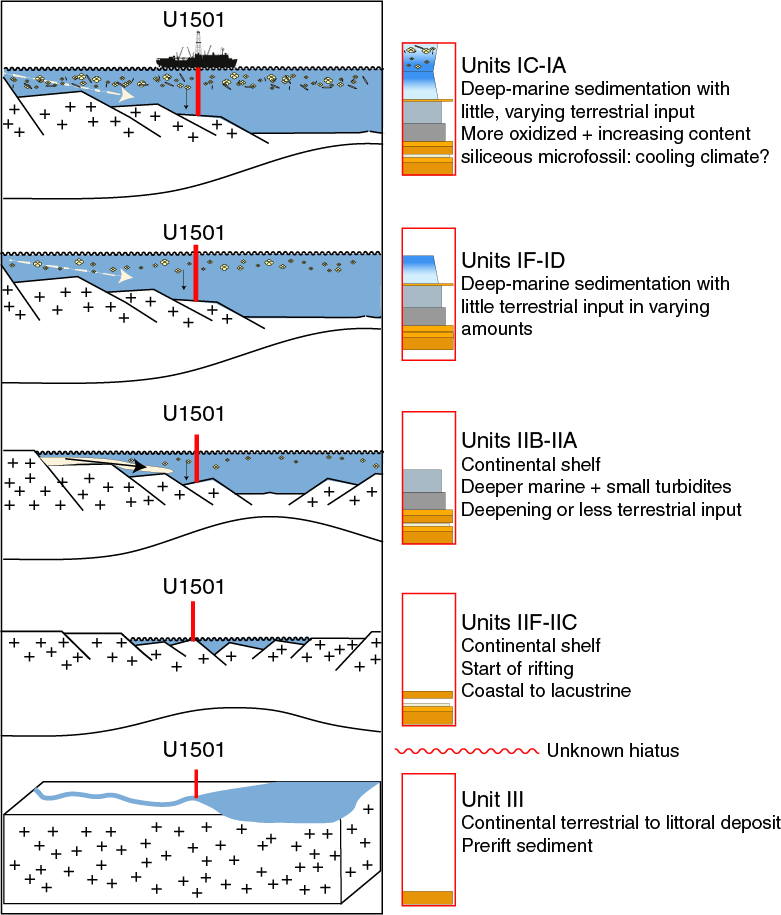
Figure F25. Preliminary model for deposition and sedimentary environments.
Transition between Units II and III
The boundary between Units II and III is in Core 368-U1501D-19R at around 598.91 m. The boundary separates the overlying greenish to dark greenish and less consolidated glauconite-bearing silty sand/sandstone of Unit II from the underlying dark brownish to gray and well-lithified sandstone with minor conglomerate and siltstone interbeds. The Unit II/III boundary is marked by an abrupt change in magnetic susceptibility, NGR, and P-wave velocity. In the seismic data, the boundary is tied to the acoustic basement (Tg), a high-amplitude reflector separating the overlying high-amplitude reflections in Unit II from the underlying low-amplitude reflections in Unit III (see Background and objectives).
We speculate if the Tg reflector between Units II and III might represent a boundary between possible early synrift (Paleocene?) deposits and the Eocene synrift sediments of Unit II or simply a hiatus between the Eocene synrift deposits of Unit II and a pre-Cenozoic basement (Unit III) (Shi et al., 2014; Dai et al., 2015). In the first case, Unit III could be similar to the Paleocene nonmarine sandstone and conglomerate successions common in the petroleum-bearing basins of eastern China. However, we found glauconite particles in the Unit III sandstone, which is commonly an indicator of marine environments (McRae, 1972; Wigley and Compton, 2007; Harris and Whiting, 2000). Most importantly, the sandstone in Unit III is quite different from the overlying sand/sandstone in Unit II in terms of color, composition of clastic components, degree of lithification, and physical properties, including seismic velocity (see Physical properties). Therefore, we suggest the transition from Unit II to III represents a significant hiatus that formed in late Mesozoic to perhaps early Cenozoic time and that the sand-dominated terrigenous clastic rocks of Unit III represent a pre-Cenozoic basement succession. Regional geologic research (e.g., Yao et al., 1994; Zhou et al., 1995, 2006) indicates that in the late Mesozoic there was an active continental margin in eastern Asia, including the northern SCS margin, where the paleo-Pacific Ocean plate was subducted under the Eurasia plate. Therefore, the Unit II/III boundary could represent the transition from an active margin to a passive margin setting. Obviously, postexpedition research is needed to further constrain the age and nature of the boundary between Units II and III.
Depositional environment of Unit II
Unit II most likely represents a gradual change from shallow-water (outer shelf or upper continental slope) to deepwater (lower slope) depositional environments (Figure F25). In general, the sediments of the lower part, including Subunits IIB–IIF, are dominated by terrigenous materials (quartz and clay minerals) and/or authigenic minerals (glauconite and calcite), with very rare calcareous nannofossils or foraminifer tests. Moreover, the glauconite (Figure F17) and large shell fragments become more common downhole and are even abundant in these subunits.
Glauconite is a clay- or mica-like mineral that usually forms from the absorption of potassium and iron by a degraded-layer silicate lattice. Glauconite formation appears related to organic activity because grains are often found with decaying organic matter or the tests of marine organisms (McRae, 1972). Glauconite grains may form as clasts or fecal pellets or by accretionary growth, leading to a wide range of external morphologies (McRae, 1972). Glauconite clasts in Unit II have a range of morphologies from angular to well rounded and equant to more elongate. Some well-rounded glauconite grains occur mixed with subangular terrigenous quartz grains (Figure F17), suggesting that the rounded morphology is not a result of reworking but due to their formation as fecal pellets.
Modern deposits typically occur at low latitudes (temperatures ranging from 7° to 15°C) (Margielewski et al., 2017) and where there are low oxygen contents, mostly in the shelf to lower-slope environments from 20 to 700 mbsl (e.g., Drzewiecki and Simó, 2002; Margielewski et al., 2017) but also (less common) in anoxic and salty lake or marginal sea environments such as the Black Sea (Suttill, 2009). Glauconite forms where sedimentation rates are low and the formation can be stopped by rapid sedimentation. Glauconite grains are often associated with marine transgressions, unconformities, condensed sections, or transgressive systems tracts (McRae, 1972; Wigley and Compton, 2007; Harris and Whiting, 2000). However, because glauconite can form in a wide range of environments, it may not be a good tool for use in paleoenvironmental studies (McRae, 1972). Margielewski et al. (2017) found that glauconite grains are not destroyed when transported for short distances but break down to become part of the finer sediment fraction in high-energy environments. Glauconite grains could therefore be found in redeposited sediment sequences but only if mechanical abrasion and chemical destruction is limited.
A remarkably similar Tertiary sequence was described by Exon et al. (2002) for sites drilled during ODP Leg 189 offshore Tasmania. The glauconite-bearing silty claystone and clayey siltstone was deposited very slowly, representing a condensed sequence with sedimentation rates of <1 cm/ky. The comparable sediment at Site U1501 was deposited at an approximate rate of 2.5–3 cm/ky based on a preliminary shipboard age/depth curve. This rate is much greater than expected for a sediment-starved glauconite sand shelf and supports redeposition of the glauconite-bearing silts and sands in Subunits IIA, IIB, and IIF.
Subunit IID, between the calcite-rich sandstones of Subunits IIC and IIE, is different than other parts of Unit II and is characterized by alternating laminae of dark gray clayey silt with organic matter or lignite. The lack of marine fossils and authigenic glauconite and the frequent thin organic-rich laminae with pyrite and very fine grained clayey silt sediment likely indicate a very low sedimentation rate and a reducing, coastal brackish environment. A similar depositional environment was observed in a petroleum well of the eastern Pearl River Mouth Basin (Shao et al., 2016). Therefore, this unit may represent a temporary switch from shallow-marine environment to brackish facies.
The upper section of Unit II fines upward from sandy, silty, and clayey sediment in Subunit IIB to clayey sediment in Subunit IIA. This trend is accompanied by an upward increase in bioturbation intensity. The occurrence of a Zoophycos trace fossil assemblage in Subunit IIA indicates a moderate- to deepwater environment. We propose that this gradual transition is the result of a deepening of the basin. Benthic foraminifers from Subunit IIA suggest water depths of 300–800 m.
The coexistence of deepwater nannofossils and shallow-water shell and coral clasts suggests that the sediment was deposited by resedimentation processes. This idea is supported by the matrix-supported texture of the sediment and structures such as fining-upward strata and cross-bedding. These features indicate that the sediment may have been deposited by turbidity currents (Figure F20). We interpret the sediment intervals with horizontal and ripple laminations in Unit II as representing the Tc and Td divisions of a Bouma sequence.
Transition between Units I and II
The boundary between Units I and II is located at Section 368-U1501C-45X-1, 51 cm, and corresponds to a high-amplitude seismic unconformity. The boundary is dated at 24–27 Ma by the shipboard paleontologists based on foraminifer and nannofossil assemblages. We suggest this boundary can be correlated with the T60 unconformity at ODP Site 1148 (Li et al., 2005) (Figure F5). Above the boundary, Unit I is dominated by carbonate sediment, whereas Unit II is dominated by terrigenous material. The color of the sediment also varies abruptly from light brown in Unit I to dark and very dark greenish gray in Unit II.
Depositional environment of Unit I
Unit I was deposited in a deep-marine environment (Figure F25). The dominant lithologies are clay-rich nannofossil ooze and nannofossil ooze with clay. There are variable amounts of foraminifers. Lithologic changes between subunits likely reflect the amount of terrigenous input into a relatively open ocean setting. This input may be delivered as buoyant plumes from shallower shelf environments and rarely by weak (distal) turbidity currents. There is little change in the composition of the terrigenous grains, so we envisage a similar source for these grains throughout Unit I. Thin laminae of silt are found rarely but throughout Unit I. Some are graded, and all have sharp bases; however, many are disrupted by bioturbation and are interpreted as distal turbidites.
Soft-sediment deformation in Subunit IB, including inclined and convolute bedding, indicates slumping downslope of parts of the sequence. Bedding above and below this interval is consistently horizontal, indicating the deformation was synsedimentary.
Structural geology
Site U1501 is located on the OMH in a water depth of 2846 m. The southwest–northeast-oriented seismic profile (Figure F5) across the OMH reveals the occurrence of extensional structures controlled by steeply dipping southwest-normal faults with obvious offset and tilting of seismic reflectors (~5°). The T60 seismic unconformity is supposed to represent the Oligocene/Miocene boundary. Downsection, the Tg reflector may mark the base of the Cenozoic sediments (Pang et al., 2007). This site was considered a high-priority target to recover pre- (below Tg), syn-, and postrift sediments (see also Background and objectives).
Lithostratigraphic Unit I structures
Lithostratigraphic Unit I, which essentially consists of nannofossil oozes, has predominantly horizontal to subhorizontal bedding that in most cases is erased due to moderate to strong bioturbation. This unit is devoid of any structures related to tectonic deformation, apart from some rare normal faults, such as the one observed in interval 368-U1501C-19F-1, 109–127 cm (Figure F26), which preserves a high-angle planar normal fault with an apparent dip of 65° and an offset of 6 cm. In addition, local soft-sediment deformation structures such as slump folds were observed in Subunits IB and IC.

Figure F26. Deformation structures, Unit I.
Lithostratigraphic Unit II structures
Lithostratigraphic Unit II is characterized by subhorizontal to gently dipping bedding. Dips as steep as 40° were locally observed in close relation to parallel lamination and therefore interpreted as cross-laminae (see Lithostratigraphy). In contrast to Unit I, deformation structures were observed within Unit II, although their occurrence is rather heterogeneously distributed. Subunit IIA is affected by millimeter-scale normal faults and joints, especially across Cores 368-U1501C-47X and 48X (Figure F27). In these cores, normal faults are typically planar to irregular with small apparent offsets as large as 0.5 cm and apparent dips of 10°–40°. They form semiregular arrays with millimeter- to centimeter-scale spacing, often arranged in an “en echelon” geometry (e.g., interval 47X-6, 126–129 cm). Striations and slickensides were observed locally where the surfaces of such structures are exposed. The occurrence of slickensides and the overall polished appearance of such planes are clear evidence for a natural deformation process. However, the recognition of these original deformation structures remains locally difficult due to drilling disturbances caused by the XCB and RCB coring systems. Deformation in the underlying Subunits IIC–IIF is essentially characterized by the variably distributed occurrence of single to branched uniform calcite and quartz veins (Figure F28).
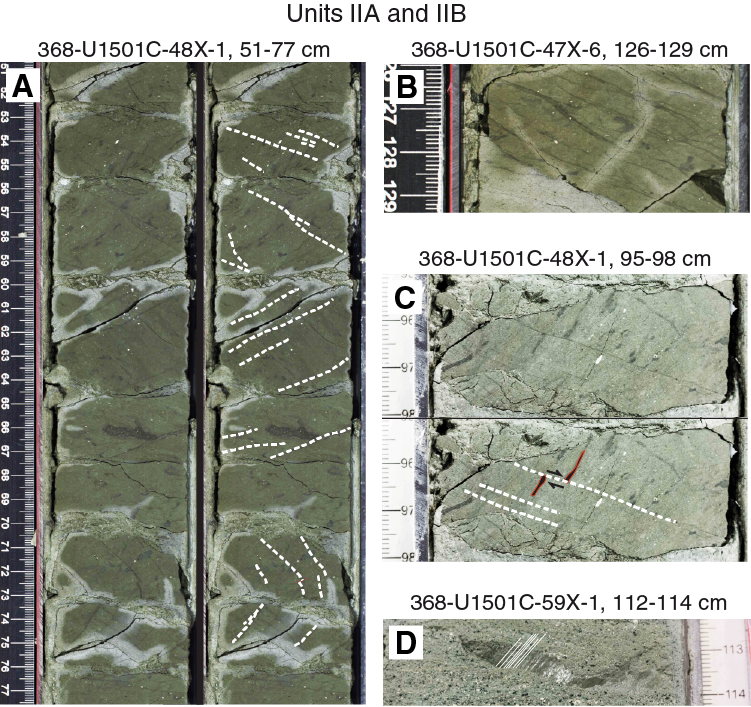
Figure F27. Deformation structures, Subunits IIA and IIB.
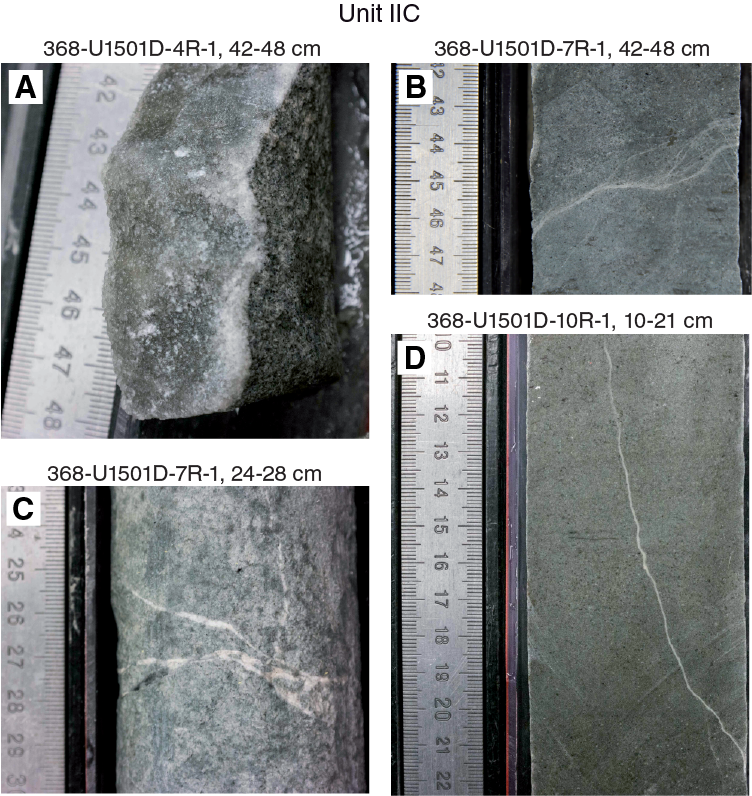
Figure F28. Distinct vein shapes and structures.
Lithostratigraphic Unit III structures
The prominent Tg reflector marks the top of lithostratigraphic Unit III, which is composed of lithified sandstone, sandstone with gravel, and minor conglomerate and laminated siltstone. This unit shows weak tilting of stratified beds expressed in apparent dips on split core surfaces as shallow as approximately 20°, which are best observed in the two last cores (368-U1501D-26R and 27R). Again, deformation structures remain scarce and heterogeneously distributed in Unit III. The recognized structures consist of veins, fractures, and local microfaults associated with cataclastic fault gouge. Locally structures associated with soft-sediment deformation are preserved. Single, branched, and en echelon uniform veins are filled by calcite or quartz (e.g., Cores 25R and 27R) (Figure F29). Planar and straight fractures were also observed with various dips from 40° to 55° showing locally striations and slickensides. In the sandstones, these fractures are often associated with alteration zones and filled by green fine-grained minerals likely resulting from diffusion-controlled chemical reactions between the matrix and a migrating reducing fluid (Figure F29A, F29D). Finally, slump folds were recovered in Core 26R (Figure F29F), providing evidence for soft-sediment deformation during mass movements.
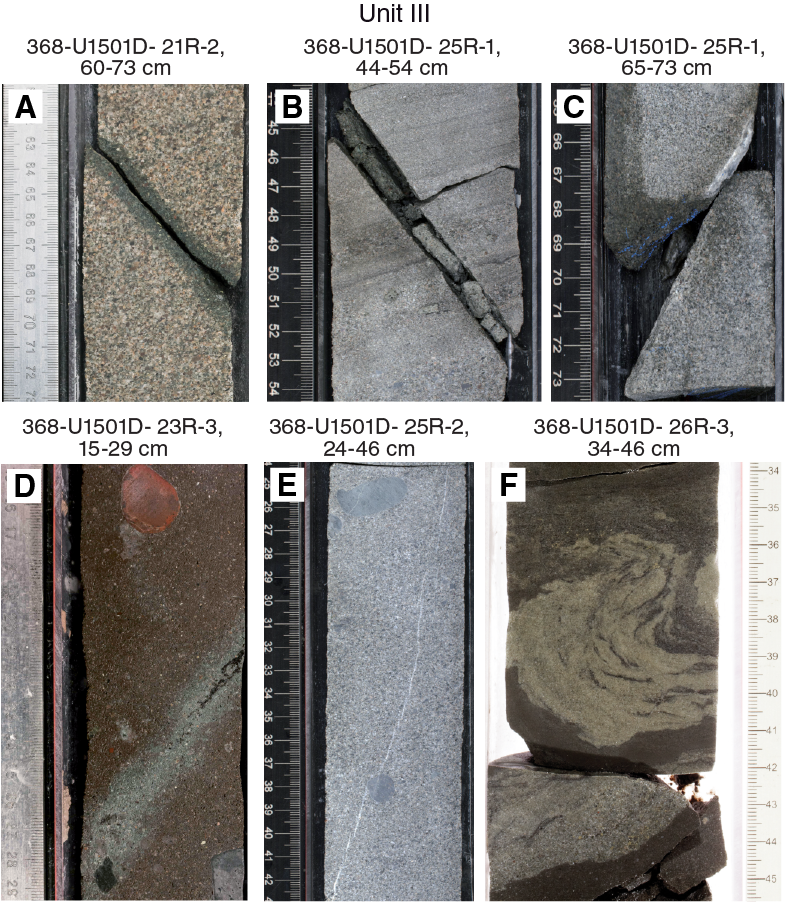
Figure F29. Deformation structures, Unit III.
Interpretation
Despite the various tilting of seismic reflectors in the proximity of extensional structures, especially between the T60 seismic unconformity and the Tg reflector observed on the seismic profile (Figure F5), no evidence of significant bedding tilting and/or deformation structures was observed at this site. However, the observed millimeter-scale normal faults in Unit II may be related to an extensional event during or soon after its deposition. In seismic data, the top of Unit II describes a wedge geometry controlled by southwest-dipping normal faults (Figure F5). The end of this extensional event may correspond to the marked decrease of terrigenous input and the transition from clays, silts, and sands in Unit II to clearly pelagic nannofossil oozes in Unit I. In line with lithostratigraphic observations and physical properties, the boundary between Units I and II is extremely sharp, reflecting a switch from bathyal marine depositional conditions in Subunit IIA to deep-sea depositional conditions in Unit I.
Unit III records a slight tilting compared to Units I and II, suggesting an unconformable relationship between them. This unit was likely deposited before the main Cenozoic rifting of the SCS continental margin. Despite relatively minor evidence for internal deformation, the tilting of beds, the soft-sediment deformations, and the nature of the lithostratigraphic succession may suggest that this unit was deposited during active tectonic processes. Mesozoic basins documented onshore (e.g., Nanni et al., 2017) may represent a possible analog for the tectonic setting during Unit III deposition.
Biostratigraphy
All core catcher samples at Site U1501 were analyzed for calcareous nannofossils, planktonic and benthic foraminifers, diatoms, and ostracods. Additional samples were taken from intervals in the working-half cores when necessary to refine the ages. Preservation of calcareous microfossils is good to very good in samples from Cores 368-U1501A-1H, 368-U1501B-1H, and 368-U1501C-1H through 44X and moderate to poor in Cores 368-U1501C-45X through 62X and 368-U1501D-2R through 5R. Samples 368-U1501A-1H-CC, 368-U1501B-1H-CC, and 368-U1501C-1H-CC and 2H-CC are composed of as much as 10% diatoms with moderate preservation, whereas other core catcher samples are rare or barren of diatoms (Table T4). Planktonic foraminifers and calcareous nannofossils are abundant in Cores 368-U1501A-1H, 368-U1501B-1H, and 368-U1501C-1H through 44X; rare to common in Cores 368-U1501C-45X through 62X and 368-U1501D-2R through 5R; and barren in Cores 368-U1501D-6R through 27R.
Table T4. Distribution of diatoms species. View table in PDF format. Download table in CSV format.
Forty biostratigraphic datums were identified in a generally continuous succession from the Holocene to the late Eocene (Tables T5, T6; Figure F30).
Table T5. Calcareous nannofossil events. Download table in CSV format.
Table T6. Planktonic foraminifer events. Download table in CSV format.

Figure F30. Age-depth model.
The Pleistocene/Pliocene boundary is placed within Core 368-U1501C-7H, the Pliocene/Miocene boundary is placed within Core 9H, the Miocene/Oligocene boundary is placed between Cores 41X and 42X, and the Oligocene/Eocene boundary is placed between Cores 53X and 54X. Sedimentation rates varied from ~13 mm/ky in the early Oligocene to ~11 mm/ky in the early–middle Miocene, ~14 mm/ky in the Pliocene, and 24 mm/ky in the Pleistocene. Sedimentation rates during the late Oligocene and late Miocene were much lower (~36 mm/ky), suggesting hiatuses may be present during these periods, whereas a relatively higher sedimentation rate (35 mm/ky) existed during the upper late Oligocene to the lower early Miocene.
Relatively higher abundances of benthic foraminifers with dominant shallow-water marker species in Cores 368-U1501C-45X through 62X and 368-U1501D-2R through 5R indicate an upper-slope environment during the Eocene to early Oligocene, whereas there is a higher abundance of planktonic foraminifers above Core 368-U1501C-44X, suggesting a deep ocean environment since the late Oligocene.
Calcareous nannofossils
Core catchers from Holes U1501A–U1501D were examined (Table T7). Calcareous nannofossil biostratigraphy for Site U1501 was based mainly on the analysis of all core catcher samples from Hole U1501C. To better constrain biostratigraphic events, a number of samples from intervals within cores were analyzed.
Table T7. Nannofossil abundance. View table in PDF format. Download table in CSV format.
Calcareous nannofossils are very abundant and well preserved in the upper part of the succession (Cores 368-U1501C-1H through 45X). Nannofossils in samples below Section 46X-CC (321.81 m) generally degrade to low abundance and moderate preservation with intermittent abundance increases down to the bottom of Hole U1501C. In Cores 368-U1501D-2R through 5R, nannofossils are rare to common with moderate preservation. Nannofossils are barren below Section 6R-CC (471.99 m) to the bottom of Hole U1501D. Some of the samples from Hole U1501C exhibit signs of slight reworking, overgrowth, and fragmentation.
Twenty-four nannofossil biostratigraphic datums were recognized in the Oligocene through Pleistocene sediment sequence at Site U1501 (Table T5). The oldest nannofossil event identified at Site U1501 is the last appearance datum (LAD) of Coccolithus formosus at 379.64 m (Sample 368-U1501C-52X-CC), which indicates an age older than 32.92 Ma.
Pleistocene
The top of Hole U1501C (Samples 1H-CC to 2H-CC; 0–17.98 m) is dated as late Pleistocene based on the presence of Emiliania huxleyi (marker species for Zone NN21). The LAD of Pseudoemiliania lacunosa in Sample 3H-CC (28.56 m) defines the top of Zone NN19. Zone NN19 is further divided by two nannofossil events: the LAD of large Gephyrocapsa spp. (>5.5 µm) in Sample 4H-CC (38.08 m) and the LAD of Calcidiscus macintyrei in Sample 5H-CC (46.95 m). The top of Zone NN18 is marked by the LAD of Discoaster brouweri in Sample 6H-CC (57.07 m).
Pliocene
Pliocene nannofossil Zone NN16 was recognized in Hole U1501C. Two events occur in the lower part of Zone NN16: the LAD of Discoaster tamalis (2.8 Ma) in Sample 7H-CC (66.22 m) and the LAD of Sphenolithus spp. (3.54 Ma) in Sample 8H-CC (75.81 m). The Miocene/Pliocene boundary in Hole U1501C is placed between Samples 8H-CC (75.81 m) and 9H-CC (85.5 m) based on the LADs of Sphenolithus spp. (3.54 Ma) and Discoaster quinqueramus (5.59 Ma), respectively.
Miocene
Three events occur in the upper Miocene strata of Hole U1501C. The top of Zone NN11 is defined by the LAD of D. quinqueramus (5.59 Ma) in Sample 9H-CC (85.5 m). The first appearance datum (FAD) of Discoaster berggrenii (8.29 Ma) was found in Sample 10H-CC (94.91 m). The FAD of Catinaster coalitus was used to mark the base of Zone NN8 (10.89 Ma) in Sample 11H-CC (104.91 m). The late/middle Miocene boundary in Hole U1501C was assigned between Samples 11H-CC (104.91 m) and 14H-CC (131.53 m) based on the FAD of C. coalitus (10.89 Ma) and the LAD of Discoaster kugleri (11.58 Ma), respectively.
Four events occur in the middle Miocene strata of Hole U1501C. The LAD of D. kugleri (11.58 Ma) within Zone NN7 occurs in Sample 14H-CC (131.53 m). The top of Zone NN6 is marked by the LAD of Cyclicargolithus floridanus (11.85 Ma) in Sample 15H-CC (142.19 m). The top of Zone NN5 is marked by the LAD of Sphenolithus heteromorphus (13.53 Ma) in Sample 16H-CC (151.8 m). The top of Zone NN4 is defined by the LAD of Helicosphaera ampliaperta (14.91 Ma) in Sample 22F-CC (180.6 m). The middle/early Miocene boundary was assigned between Samples 22F-CC (180.6 m) and 24F-CC (189.47 m).
Four events occur in the lower Miocene strata of Hole U1501C. The top of Zone NN2 is marked by the LAD of Triquetrorhabdulus carinatus (18.28 Ma) in Sample 24F-CC (189.47 m). The bottom of Zone NN2 is approximated by the FAD of Sphenolithus disbelemnos (22.76 Ma) in Sample 40X-CC (265.35 m). Two additional events were found in Zone NN2: the FAD of Sphenolithus belemnos (19.03 Ma) in Sample 26F-CC (198.38 m) and the FAD of H. ampliaperta (20.43 Ma) in Sample 27F-CC (204.08 m). The Miocene/Oligocene boundary was assigned between Samples 40X-CC (265.35 m) and 42X-CC (283.46 m) based on the FAD of S. disbelemnos (22.76 Ma) and the LAD of Sphenolithus delphix (23.11 Ma), respectively.
Oligocene
Six events were identified in the Oligocene strata of Hole U1501C. The LAD of S. delphix (23.11 Ma) within Zone NN1 occurs in Sample 42X-CC (283.46 m), the LAD of Sphenolithus ciperoensis (24.43 Ma) within Zone NP25 occurs in Sample 44X-CC (302.56 m), and the LAD of Sphenolithus predistentus (26.93 Ma) and FAD of S. ciperoensis (29.62 Ma) within Zone NP24 occur in Sample 45X-CC (312.2 m). The top of Zone NP22 is marked by the LAD of Reticulofenestra umbilicus (32.02 Ma) in Sample 49X-CC (350.49 m). The top of Zone NP21 is marked by the LAD of C. formosus (32.92 Ma) in Sample 52X-CC (379.64 m).
From Sample 52X-CC (379.64 m) to the bottom of Hole U1501C (Sample 62X-CC, 457.83 m), the nannofossil assemblage includes Chiasmolithus altus, C. formosus, Discoaster nodifer, Discoaster tani, Discoaster williamsii, Helicosphaera bramlettei, Helicosphaera recta, Helicosphaera compacta, Lanternithus minutus, Pontosphaera exilis, Pontosphaera punctosa, Reticulofenestra circus, Reticulofenestra, R. umbilicus, Reticulofenestra erbae, and Reticulofenestra lockeri. Such a nannofossil assemblage indicates a late Eocene age for the base of Hole U1501C.
The nannofossil assemblages in Cores 368-U1501D-2R through 5R are similar to those in samples from the bottom part of Hole U1501C, so they were also assigned to the late Eocene. Nannofossils are barren from Sample 6R-CC (471.99 m) to the bottom of Hole U1501D, so we cannot determine the age of these samples.
Planktonic foraminifers
All core catcher samples and several additional samples from the split cores in Holes U1501A–U1501D were processed for planktonic foraminiferal analyses (Table T8). Planktonic foraminifers are well preserved and abundant for samples from Cores 368-U1501A-1H, 368-U1501B-1H, and 368-U1501C-1H through 44X and moderate to poorly preserved or even recrystallized and less abundant in Cores 368-U1501C-45X through 62X.
Table T8. Planktonic foraminifers. View table in PDF format. Download table in CSV format.
Only one core was drilled in Holes U1501A and U1501B. Abundant pink Globigerinoides ruber specimens were observed in the core catcher samples, indicating an age between 0.12 and 0.4 Ma for the bottom of these two holes. No planktonic foraminifer was observed in Hole U1501D.
Sixteen planktonic foraminiferal datums were recognized in Hole U1501C, spanning the late Eocene (<37.75 Ma) to the late Pleistocene (Plate P1; Table T6). The planktonic foraminiferal biostratigraphy for Hole U1501C was established by these events and the planktonic foraminiferal assemblages at successive depth intervals.
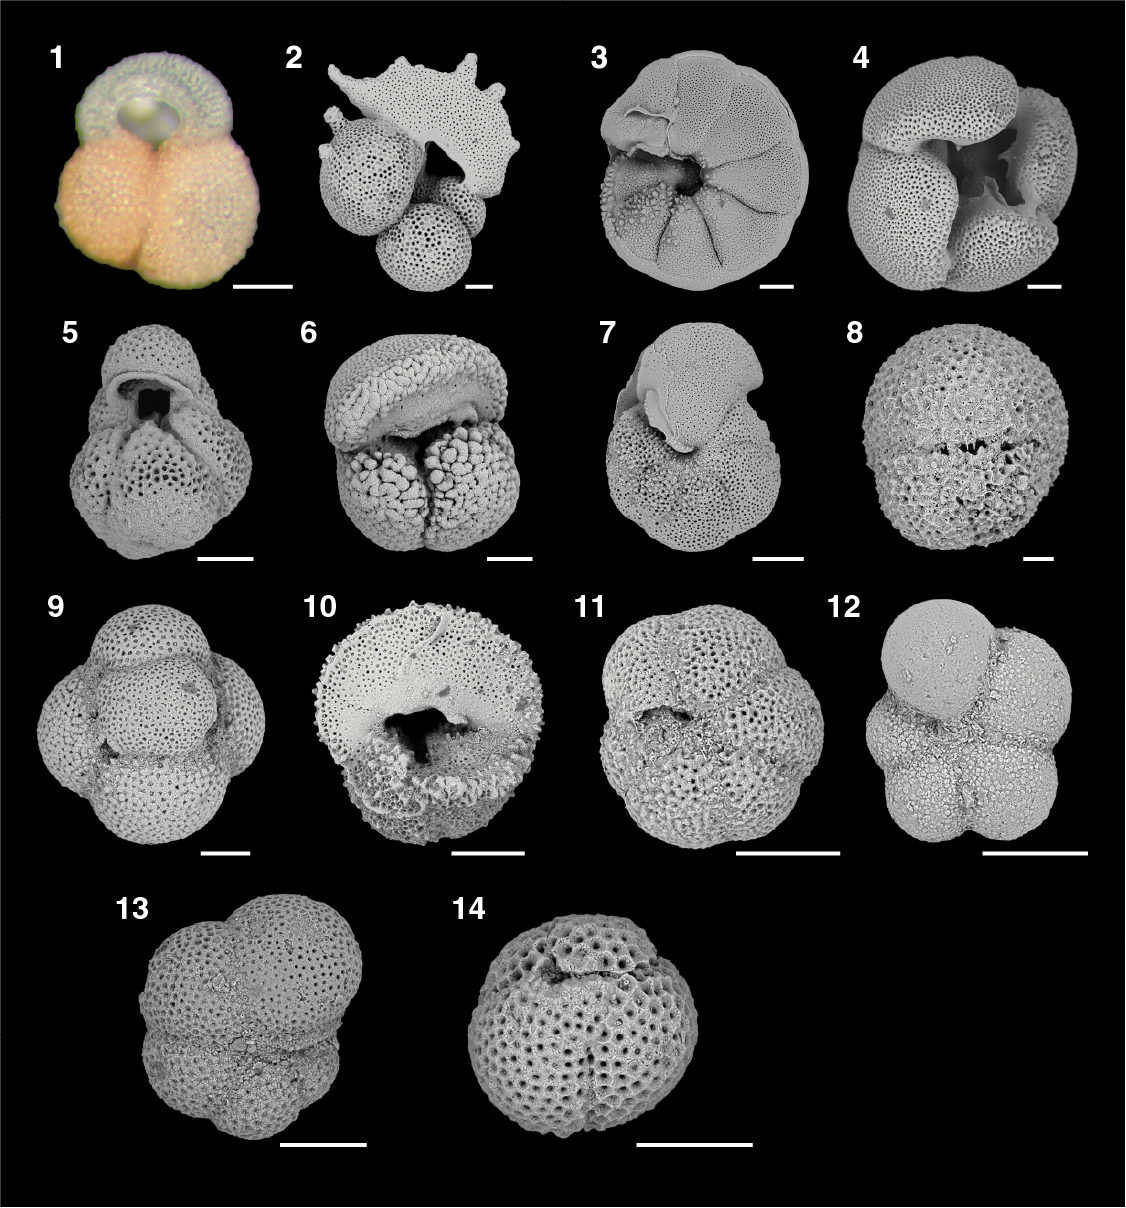
Plate P1. Principal planktonic foraminifers.
The Pleistocene planktonic foraminifers are composed of G. ruber, Globigerinoides sacculifer, Globorotalia menardii, Pulleniatina obliquiloculata, and Neogloboquadrina dutertrei. The LAD of pink G. ruber (0.12 Ma) and FAD of pink G. ruber acme (0.40 Ma) are placed between Samples 1H-CC and 2H-CC and Samples 2H-CC and 3H-CC, respectively. The LAD of Globigerinoides fistulosus (1.88 Ma) is located between Samples 4H-CC and 5H-CC and marks the Zone N22/N21 boundary. The LAD of Globorotalia multicamerata (2.18 Ma) is located between Samples 5H-CC and 6H-CC.
The Pliocene planktonic foraminiferal assemblage is characterized by the higher content of Dentoglobigerina altispira and Sphaeroidinellopsis seminulina. The LAD of D. altispira (3.47 Ma) is located between Samples 7H-CC and 8H-CC. The LAD of Globoturborotalita nepenthes (4.37 Ma) is located between Samples 8H-CC and 9H-CC and defines the Zone N20/N19 boundary.
The middle–late Miocene foraminiferal assemblage is dominated by D. altispira, Globoquadrina dehiscens, and Praeorbulina circularis/glomerosa. The LAD of G. dehiscens (5.92 Ma) is located between Samples 10H-CC and 11H-CC and defines the boundary of Zones N18/N17. The LAD of Fohsella fohsi (11.79 Ma) is located between Samples 12H-CC and 13H-CC and defines the boundary of Zones N13/N12. The FAD of Praeorbulina sicana (16.38 Ma) is located between Samples 22F-CC and 23F-CC and marks the boundary of Zones N8/N7.
The late Oligocene–early Miocene planktonic foraminifers are characterized by G. dehiscens, Globoquadrina venezuelana, and Paragloborotalia mayeri. The LAD of Catapsydrax dissimilis (17.54 Ma) is located between Samples 24F-CC and 25F-CC and defines the boundary of Zones N7/N6. The LAD of Globoquadrina binaiensis (19.09 Ma) is located between Samples 27F-CC and 28F-CC. The LAD of Paragloborotalia kugleri (21.12 Ma) is located between Samples 32F-CC and 33F-CC as the boundary of Zones N5/N4. The LAD of Globigerina ciperoensis (22.90 Ma) is located between Samples 40X-CC and 41X-CC and represents the Miocene/Oligocene boundary.
Compared to the large planktonic foraminiferal components during the late Oligocene–early Miocene, the early Oligocene planktonic foraminifers are characterized by small Paragloborotalia nana and Paragloborotalia opima. The LAD of P. opima (26.93 Ma) is located between Samples 43X-CC and 44X-CC as the boundary of Zones P22/P21. The LAD of Turborotalia ampliapertura (30.28 Ma) is located between Samples 46X-CC and 47X-CC as the boundary of Zones P20/P19.
In Sample 54X-CC, late Eocene planktonic foraminiferal components such as Globigerinatheka subconglobata and Globigerinatheka index rubriformis were observed, suggesting a late Eocene age. Because of the low abundance and poor preservation of the planktonic foraminifers in Samples 368-U1501C-55X-CC to 62X-CC and their absence from Samples 368-U1501D-2R-CC to 27R-CC, a definite age for the lowest part of Holes U1501C and U1501D could not be determined.
Benthic foraminifers
Benthic foraminifers in Samples 368-U1501C-41X-CC to 62X-CC and 368-U1501D-2R-CC to 4R-CC were counted (~300 random specimens) from the >150 µm size fraction (Figure F31). Benthic foraminifers are abundant in Samples 368-U1501C-46X-CC and 368-U1501D-4R-CC and are more abundant than planktonic foraminifers in samples deeper than Sample 368-U1501C-54X-CC. Bulimina spp., Melonis spp., Cibicidoides spp., Lenticulina spp., and some agglutinated benthic foraminifers were observed in these samples. From the planktonic foraminifer/total foraminifer ratios, it is inferred that the paleoenvironment at this site changed from shelf (Samples 368-U1501C-54X-CC and 368-U1501D-4R-CC) to upper slope (Samples U1501C-46X-CC to 53X-CC) and then to deep sea (Samples 41X-CC to 45X-CC), clearly indicating an increasing water depth.
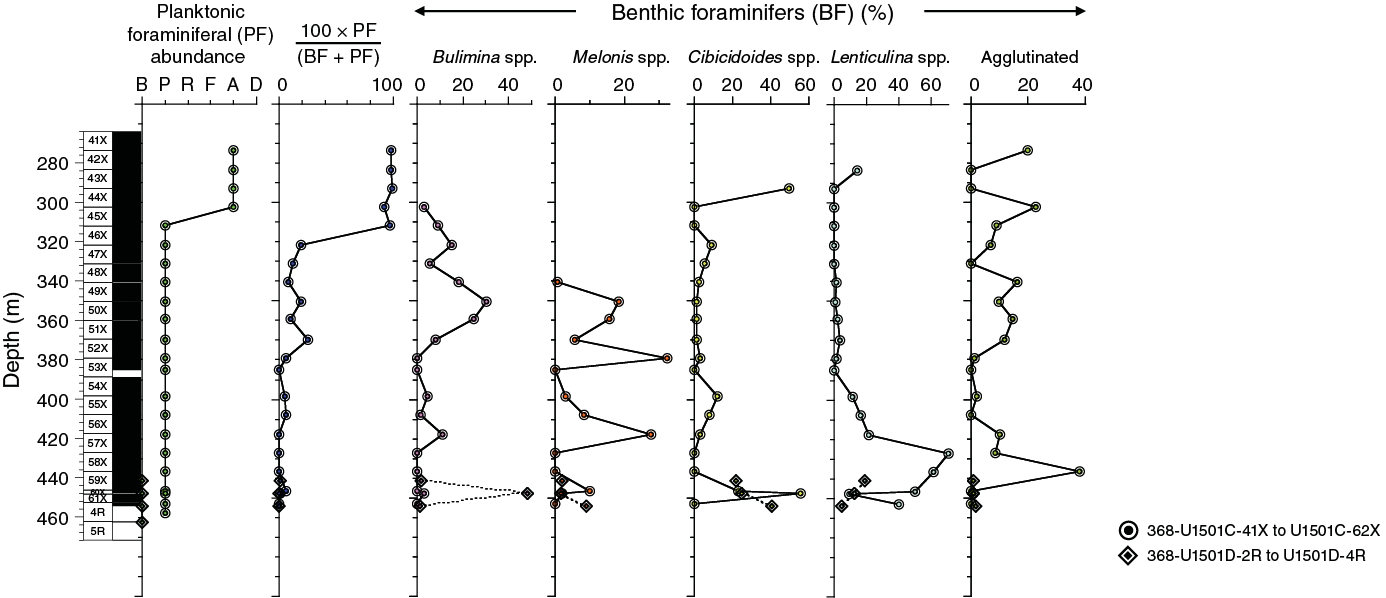
Figure F31. Benthic foraminifers.
Diatoms
Core catcher samples from Holes U1501A–U1501D were processed into smear and strewn slides for diatom analysis. An additional 21 toothpick samples were taken from selected intervals of the working-half cores for better resolution. Samples 368-U1501A-1H-CC, 368-U1501B-1H-CC, and 368-U1501C-1H-CC and 2H-CC are composed of as much as 10% diatoms with moderate preservation. Smear slides from Samples 368-U1501C-3H-CC, 4H-CC, 35F-CC, 45X-CC, and 46X-CC contain <1% diatoms with poor preservation. The rest of the core catcher samples from Cores 368-U1501C-5H through 62X and 368-U1501D-2R through 27R are barren of diatoms (Table T4).
Toothpick samples of burrows in the working-half sections of Holes U1501C and U1501D were found to contain between 0% and 60% diatoms with poor to moderate preservations. Samples 368-U1501A-1H-CC, 368-U1501B-1H-CC, and 368-U1501C-1H-CC and 2H-CC contain a few specimens of Fragilariopsis doliolus, indicating an age of 2.0–0.6 Ma. A smear slide of a partially pyritized burrow in Sample 368-U1501C-35F-1, 118 cm, contains a few specimens of Azpetia bukryi with Cestodiscus trochus commonly observed, indicating an age range between 20.8 and 30.8 Ma (Table T9).
Table T9. Diatom events. Download table in CSV format.
Ostracods
A preliminary examination of ostracods was conducted in core catcher samples from Holes U1501C and U1501D (Table T10) to characterize the assemblage variability through time and to reconstruct paleoenvironmental changes throughout the Cenozoic. Ostracod abundance ranges from absent to >60 valves per sample, and preservation varies from good (mostly in the Pleistocene section) to poor, although most specimens are moderately preserved. The highest incidences of ostracods were observed in Samples 368-U1501C-10H-CC to 16H-CC (94–151 m), 27F-CC to 31F-CC (204–221 m), 40X-CC to 43X-CC (265–293 m), and in particular Samples 49X-CC to 51X-CC (350.44–369.9 m) and 60X-CC (447.92 m). In Hole U1501D, ostracods are only present in Samples 2R-CC to 6R-CC.
Table T10. Ostracods. View table in PDF format. Download table in CSV format.
In Hole U1501C, lower bathyal to abyssal genera (Krithe, Legitimocythere, Henryhowella, Bradleya, Abyssocythereis, Argilloecia, Pennyella, Poseidonamicus, Pelecocythere, Arcacythere, Cytheropteron, Eucythere, Abyssocythere, and Parakrithe) dominate the Oligocene through Pleistocene assemblage, indicating that deepwater conditions have existed in the SCS since the early Oligocene. Below 349 m (Sample 50X-CC, 40–45 cm, estimated to be of late Eocene age), the assemblage is characterized by upper bathyal and continental shelf taxa (e.g., Heinia, Cytheropteron, Xestoleberis, Abrocythereis, Neomonoceratina, Trachyleberis, Cytherelloidea, and Cytherella), although deep-sea genus Krithe remains present. In Hole U1501D, Samples 2R-2, 111–114 cm, and 4R-CC to 6R-CC (estimated to be middle to late Eocene in age) are composed of Paranesidea sp., Cytherelloidea cf. Cytherelloidea asatoensis Nohara, Coquimba sp., Schizocythere? sp., and Paijenborchella sinensis, among others. Paleoecologically, the absence of abyssal to upper bathyal or brackish water taxa in the assemblage indicates a shallow-marine environment (Plates P2, P3).

Plate P2. Representative Miocene to Pleistocene abyssal ostracods.
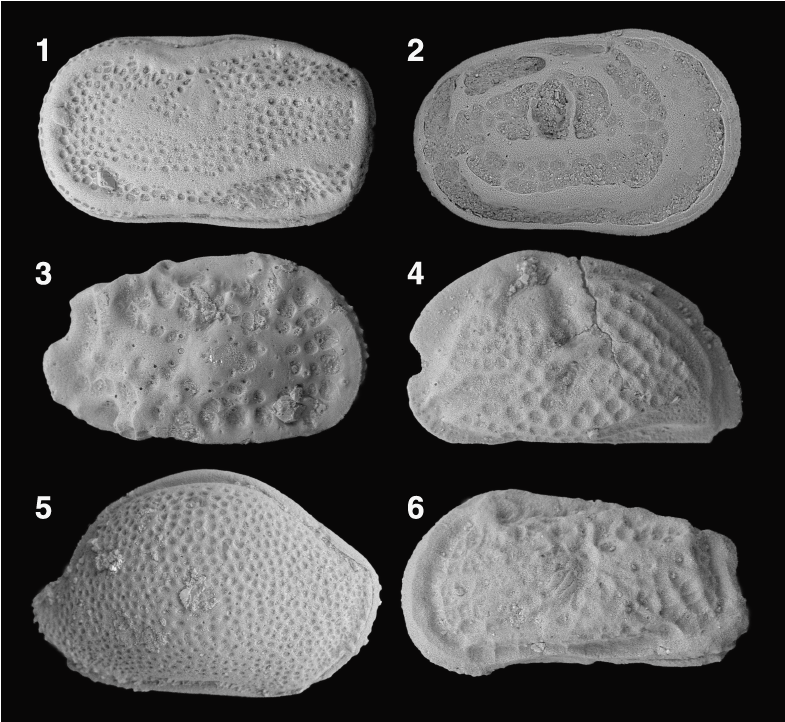
Plate P3. Representative late Eocene shallow-water marine ostracods.
Paleomagnetism
Shipboard measurements
Shipboard paleomagnetic investigations combined three complementary approaches (see Paleomagnetism in the Expedition 367/368 methods chapter [Sun et al., 2018a]): (1) measurement and in-line AF demagnetization of archive-half sections on the pass-through 2G Enterprises SRM, (2) measurement and thermal demagnetization of oriented discrete samples on the SRM, and (3) measurement and AF demagnetization of oriented discrete samples on the spinner magnetometer (Agico JR-6A). Representative discrete samples were collected from every two sections (3 m), except where drilling disturbance was high or where core recovery was low.
First, we used scalar data from AF demagnetization up to 50 mT and thermal demagnetization on discrete samples to constrain the nature of the magnetic assemblage. Second, we used the directional and intensity data of archive-half sections, measured after the highest in-line AF demagnetization step (25 mT), to determine magnetic polarity along the core. Third, we used the directional and intensity data from discrete samples to validate the polarities inferred from section measurements. Directional data were analyzed using Zijderveld diagrams (Zijderveld, 1967), and the characteristic remanent magnetization (ChRM) direction(s) were calculated by principal component analysis (PCA) (Kirschvink, 1980) using the software PuffinPlot (version 1.03, 23 April, 2015) (Lurcock and Wilson, 2012).
Demagnetization behavior and implications for magnetic assemblages
Stepwise demagnetization of the NRM shows that 91% of analyzed samples lost the bulk of their magnetic remanence between 200° and 300°C. For all steps of thermal demagnetization, the cumulative behavior of all samples was analyzed (each sample having the same statistical weight). The loss of remanent magnetization was normalized to NRM and expressed as a percentage (Figure F32). This behavior shows that one or several phases with low TC, such as pyrrhotite (TC ≈ 325°C; Tauxe, 2010) or greigite (TC ≈ 330°C; Tauxe, 2010), dominate the NRM. High SIRM/χ ratios are widely considered characteristic of greigite in sediments (e.g., Snowball, 1991; Roberts, 1995; Roberts et al., 2011). The rock magnetic experiments on six representative samples from Hole U1501C (Table T11), after magnetic saturation at 2.3 T, show SIRM/χ between 12.8 and 14.6 kA/m. These values rule out pyrrhotite and confirm the predominance of greigite in lithostratigraphic Unit I of Hole U1501C. Using a rare-earth magnet on a slurry from Section 368-U1501A-1H-CC (PAL), greigite was separated and concentrated. The grains observed with an optical binocular microscope are subhedral, pale yellow, partially corroded metallic cubes (≤10 µm in length). These grains, documented with SEM (Figure F33), have physical sizes in the 2–10 µm range, which corresponds to pseudosingle to multidomain magnetic grain sizes (Roberts et al., 2011). Overall, thermal demagnetization behaviors suggest that greigite dominates the NRM, at least to 83 m. However, the magnetic remanence remaining above 575°C (Figure F34) strongly suggests contributions from additional phases such as maghemite (TC ≈ 590°–675°C; Tauxe, 2010) or hematite (TC ≈ 675°C; Tauxe, 2010). The NRM remaining above 575°C increases notably in the 50–85 m interval in Hole U1501C. The maximum field strength of in-line AF demagnetization used on the archive-half sections is limited because of the destructive nature of the treatments and our limited ability to measure weak magnetizations in the magnetically noisy shipboard environment. To evaluate the effectiveness of AF demagnetization of the NRM, experiments were performed on six discrete samples from Hole U1501C (Table T11). These experiments reveal the existence of a high-coercivity phase characterized by self-reversal behavior (Figure F35). This self-reversal behavior is typical of greigite (Krs et al., 1992; Horng et al., 1998) and has recently been reported in Pleistocene sediments of the South Yellow Sea (Liu et al., 2014).
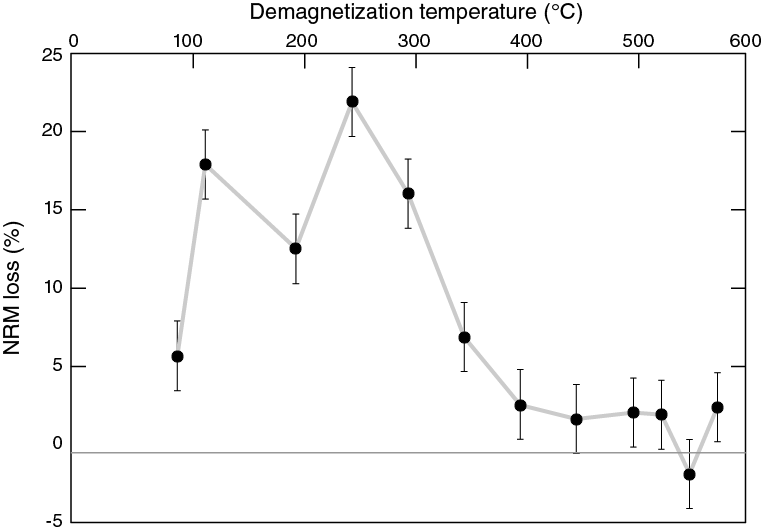
Figure F32. Percentage of NRM loss.
Table T11. Rock magnetic properties. Download table in CSV format.
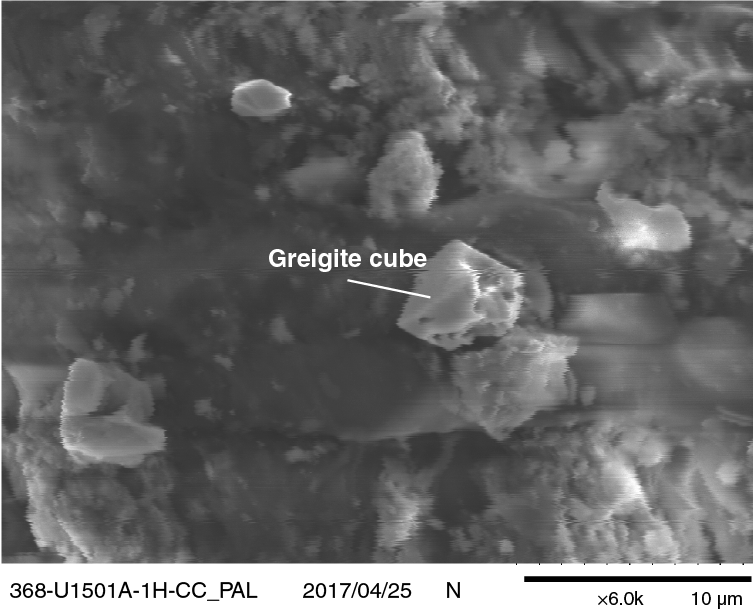
Figure F33. SEM image of greigite cube.
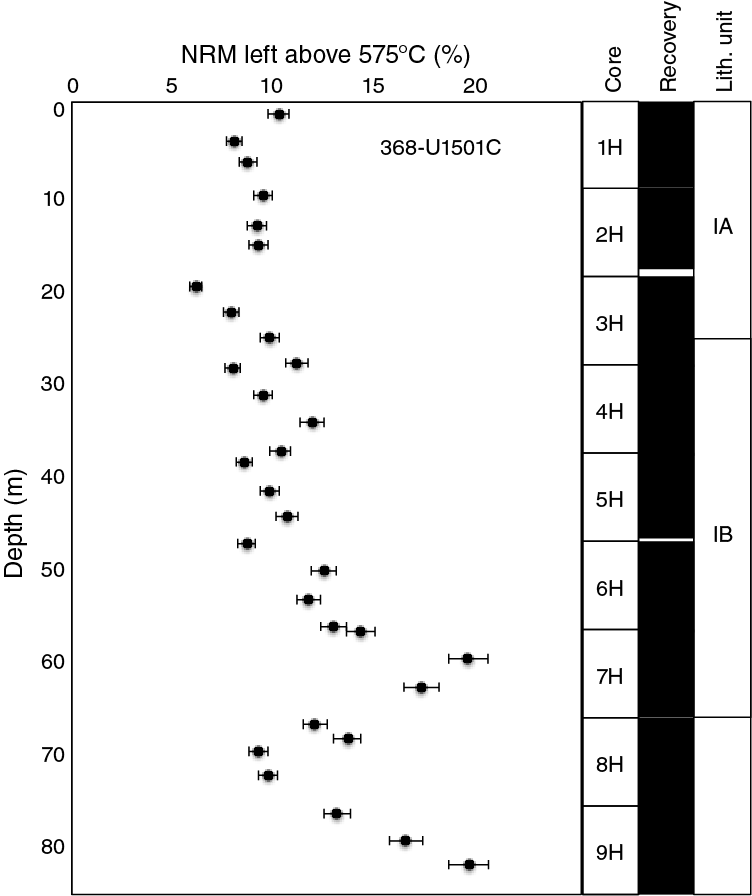
Figure F34. Variation of percentage of NRM left above 575°C.
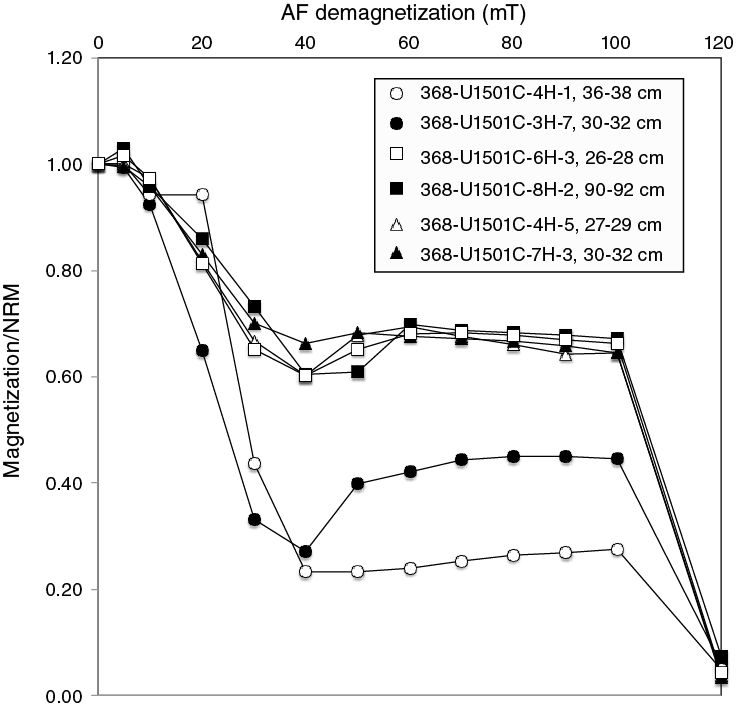
Figure F35. Magnetization normalized to NRM as a function of AF demagnetization.
Typical behaviors of demagnetization from the three complementary approaches are shown in Figure F36. AF demagnetization of these samples with in-line AF produces demagnetization paths that are easier to interpret than the results of discrete samples subjected to AF demagnetization. Both AF and thermal treatments on discrete samples effectively remove a steep low-temperature/low-coercivity component, which represents the drilling overprint. However, thermal demagnetization is more effective at isolating ChRM, as evident by comparing results from twin samples collected from the same core and section (e.g., Figure F36C). The mean inclination gathered from the high-temperature component is 37.3° ± 6.6°, corresponding to a paleolatitude of 20.85° ± 3.3° for Unit I (see Lithostratigraphy).
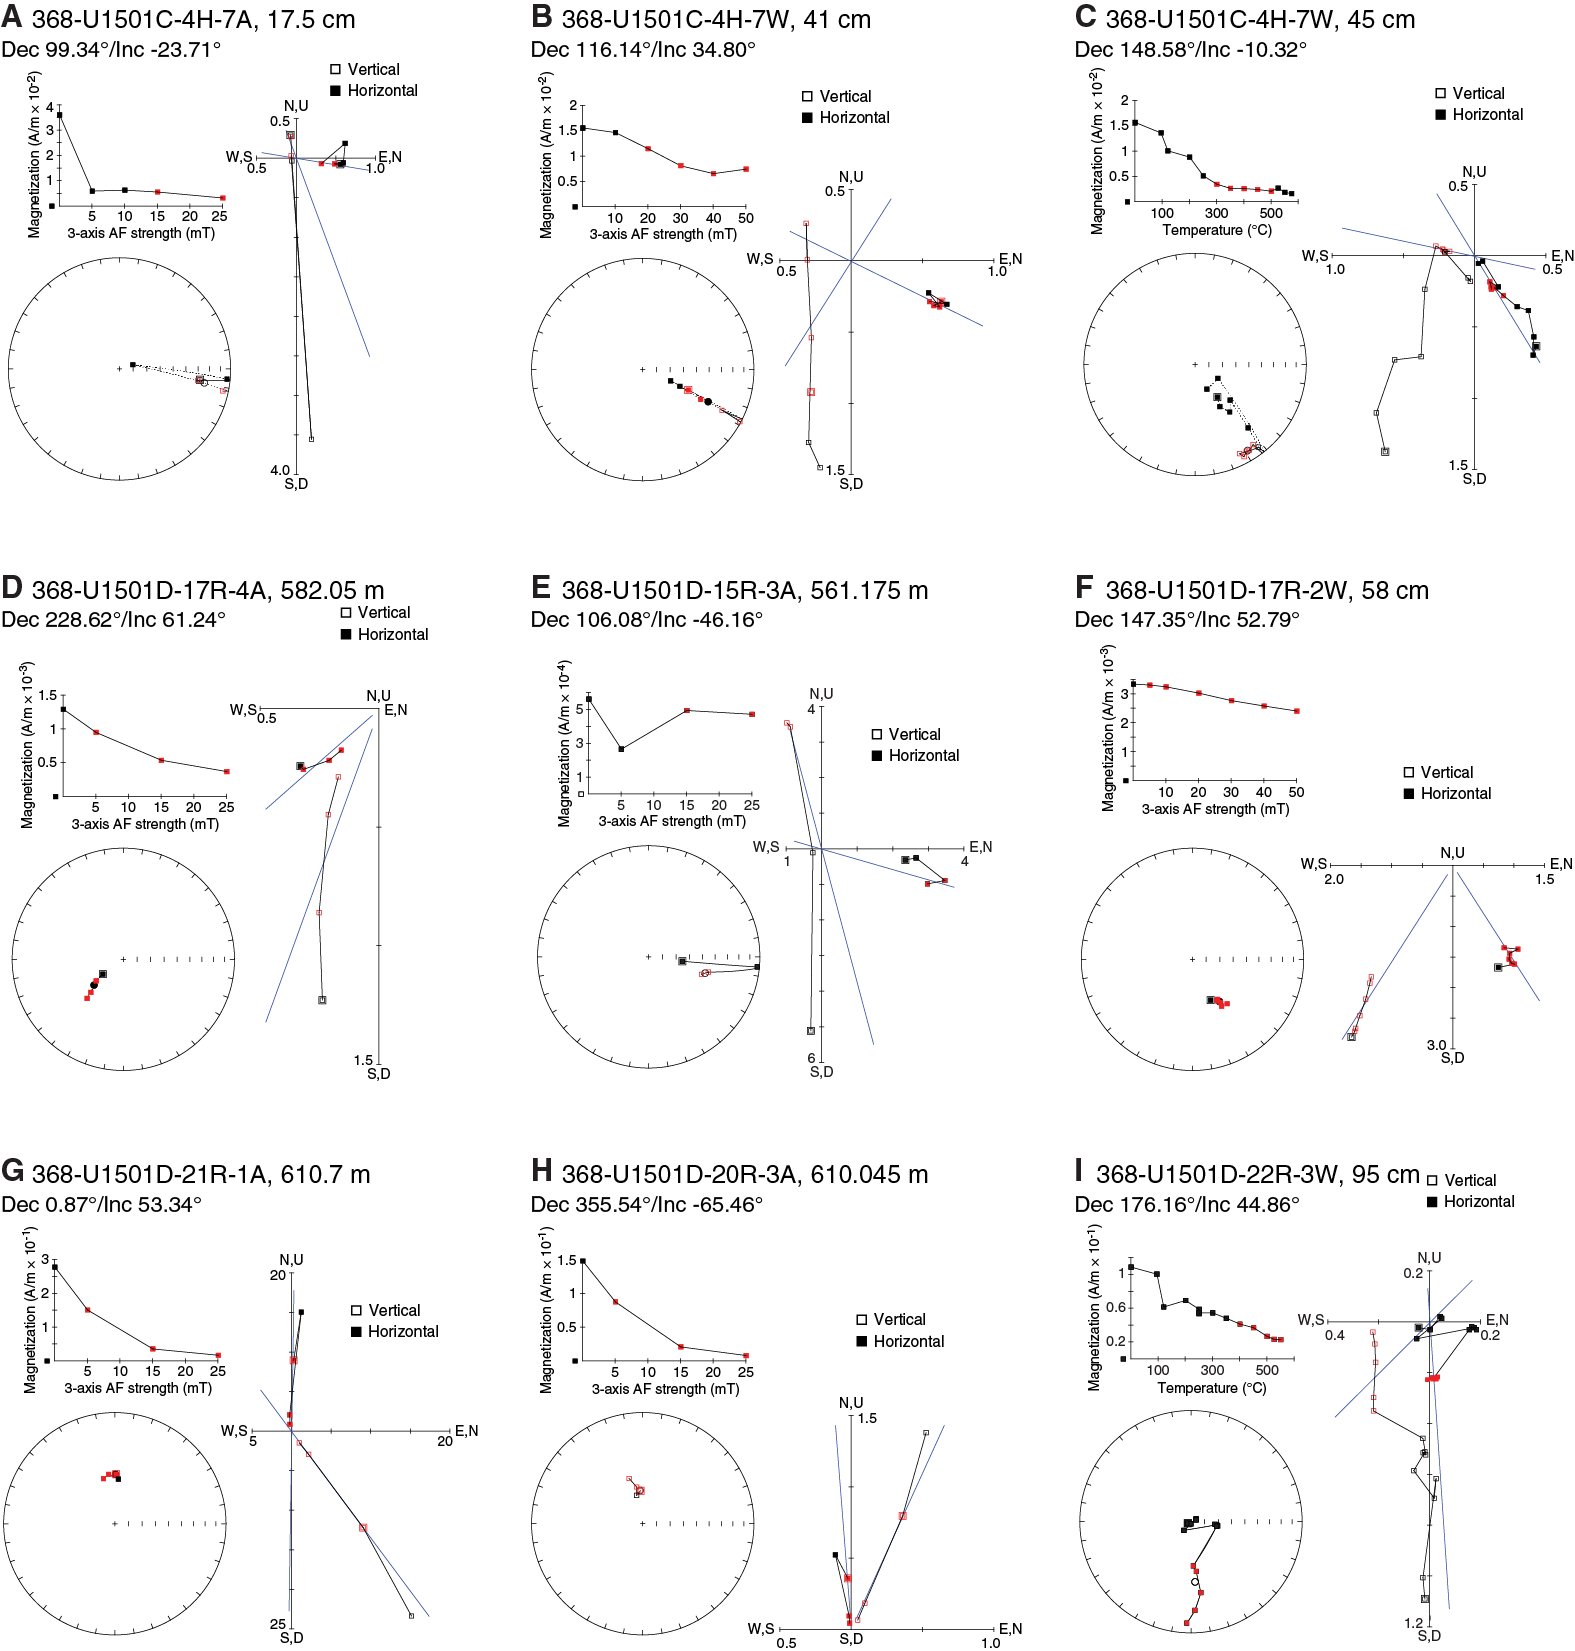
Figure F36. Demagnetization plots.
Many of the AF-demagnetized discrete samples reveal trends showing reversed or normal polarity in the last step of demagnetization (50 mT).
Thermal demagnetization shows removal of a steep low-temperature normal component which is carried up to 300°C.
Magnetostratigraphy
Inclination, declination, and intensity for Holes U1501A–U1501D are reported in Figures F37, F38, and F39. We constructed the magnetostratigraphy of Site U1501 based on the polarity assigned to the archive-half cores and recognized polarity reversals in Hole U1501D (Figures F39, F40, F41; Tables T12, T13). We did not use data from Hole U1501C from ~240 m to the bottom of the hole (Cores 35F through 62X) because a decrease in NRM moment hampers the determination of magnetic polarity.
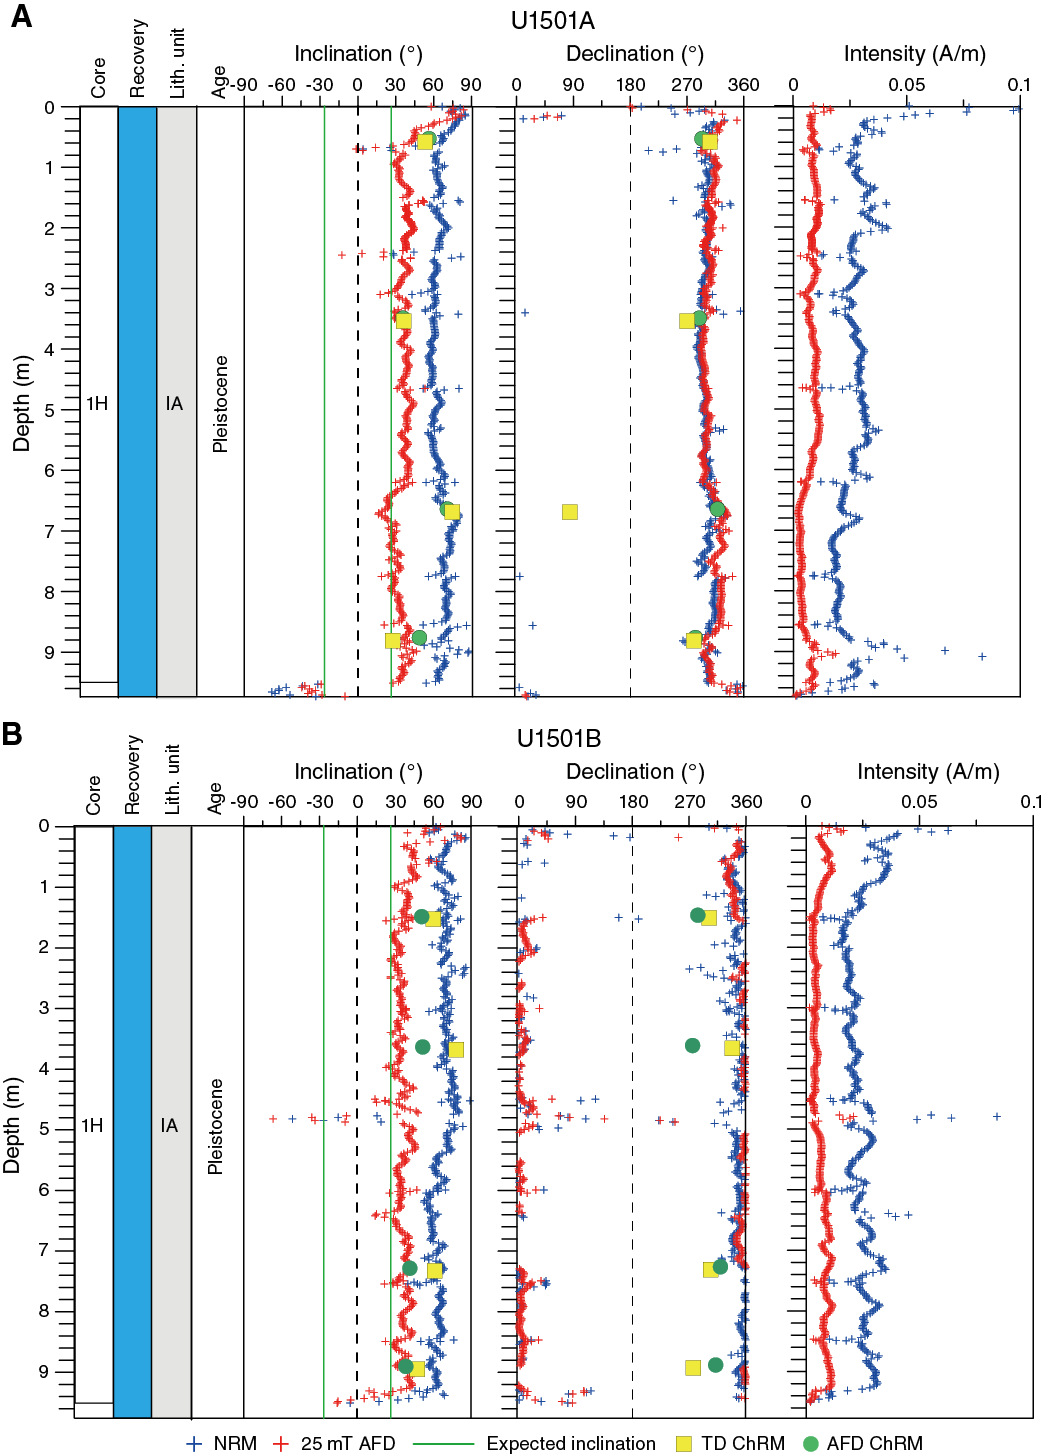
Figure F37. Magnetic measurements, Holes U1501A and U1501B.
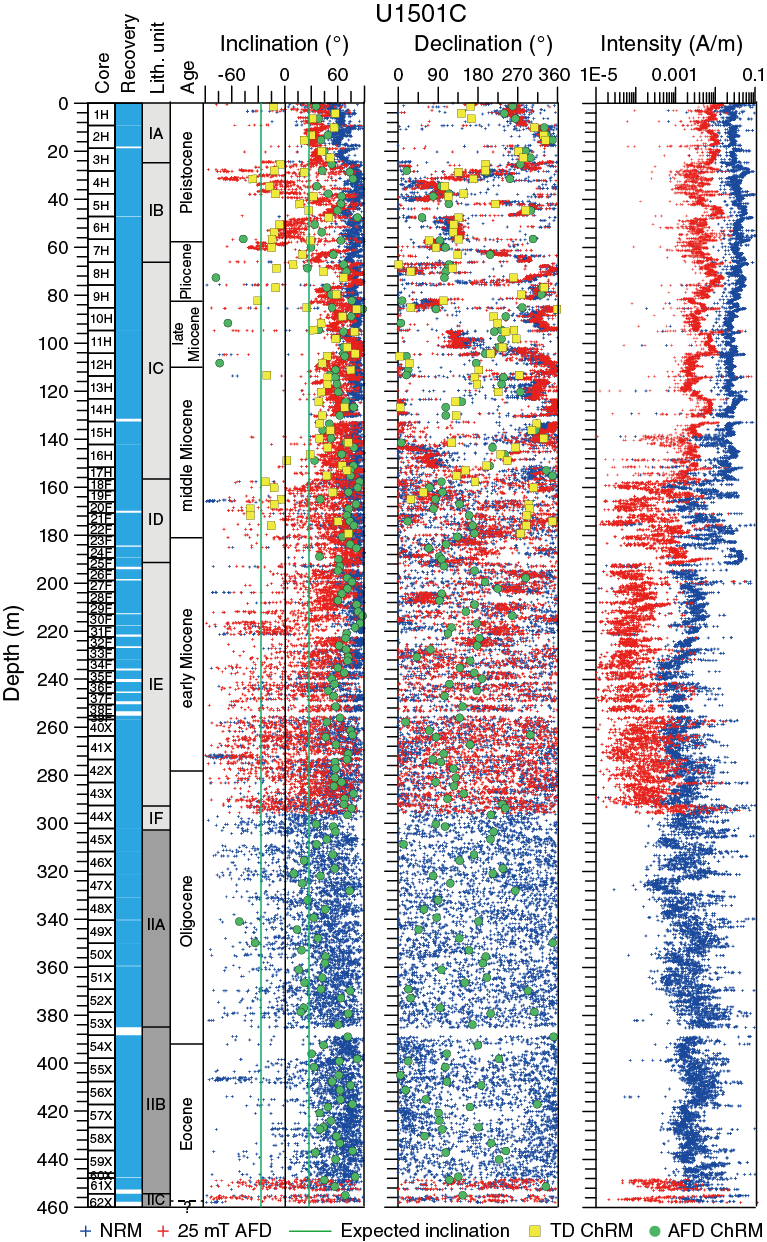
Figure F38. Magnetic measurements, Hole U1501C.
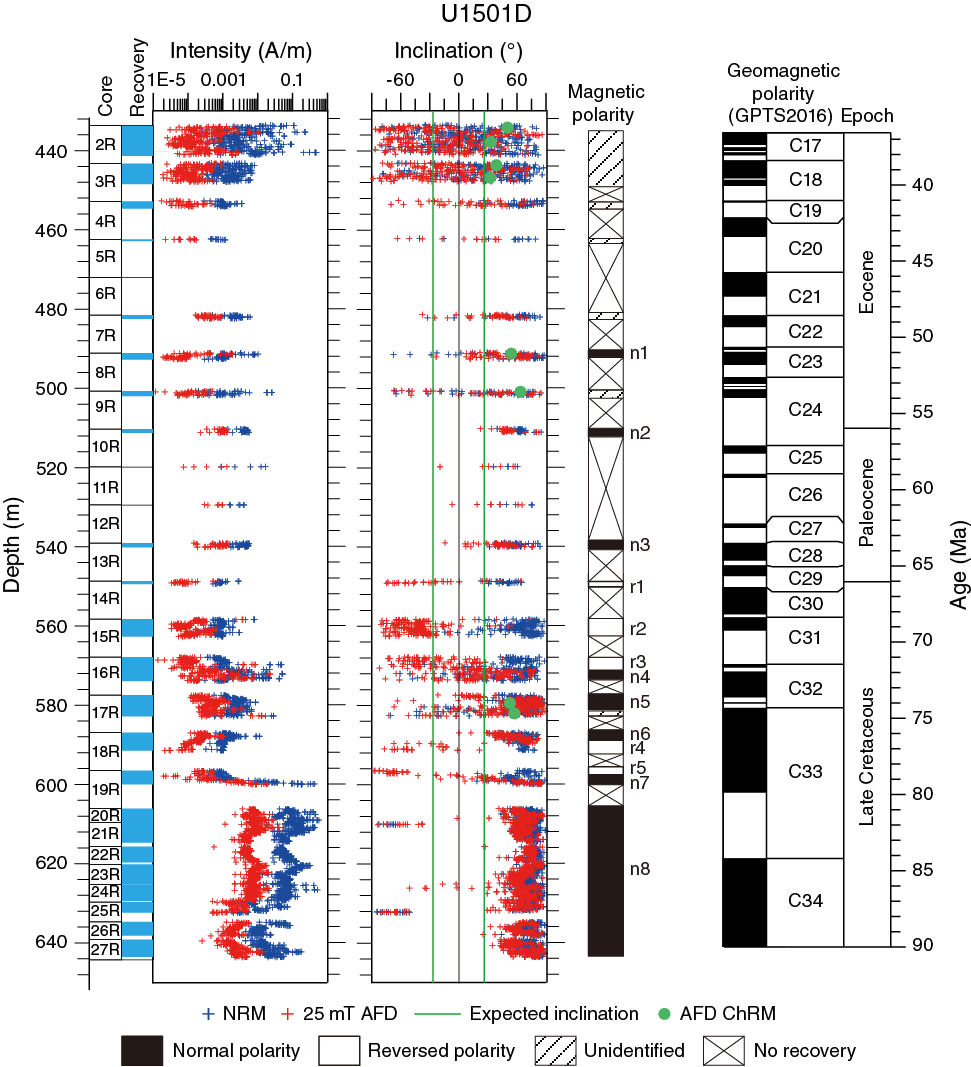
Figure F39. Magnetic measurements, Hole U1501D.
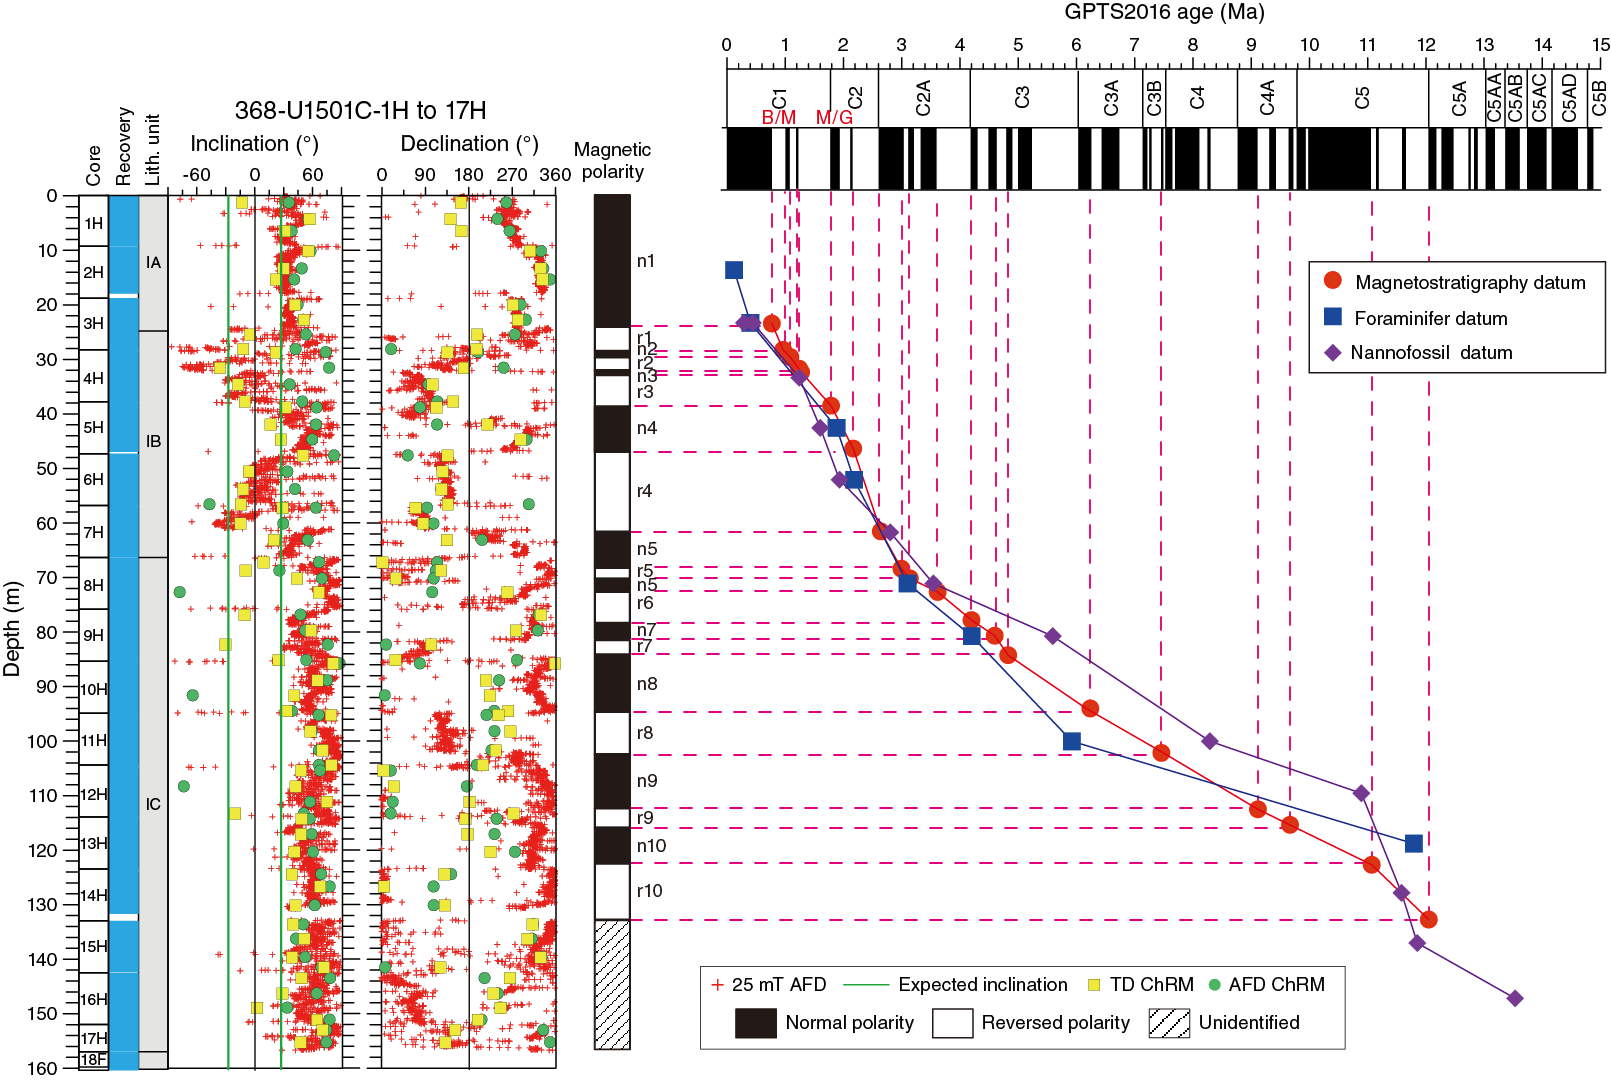
Figure F40. Correlation to magnetostratigraphy, Cores 1H through 17H.
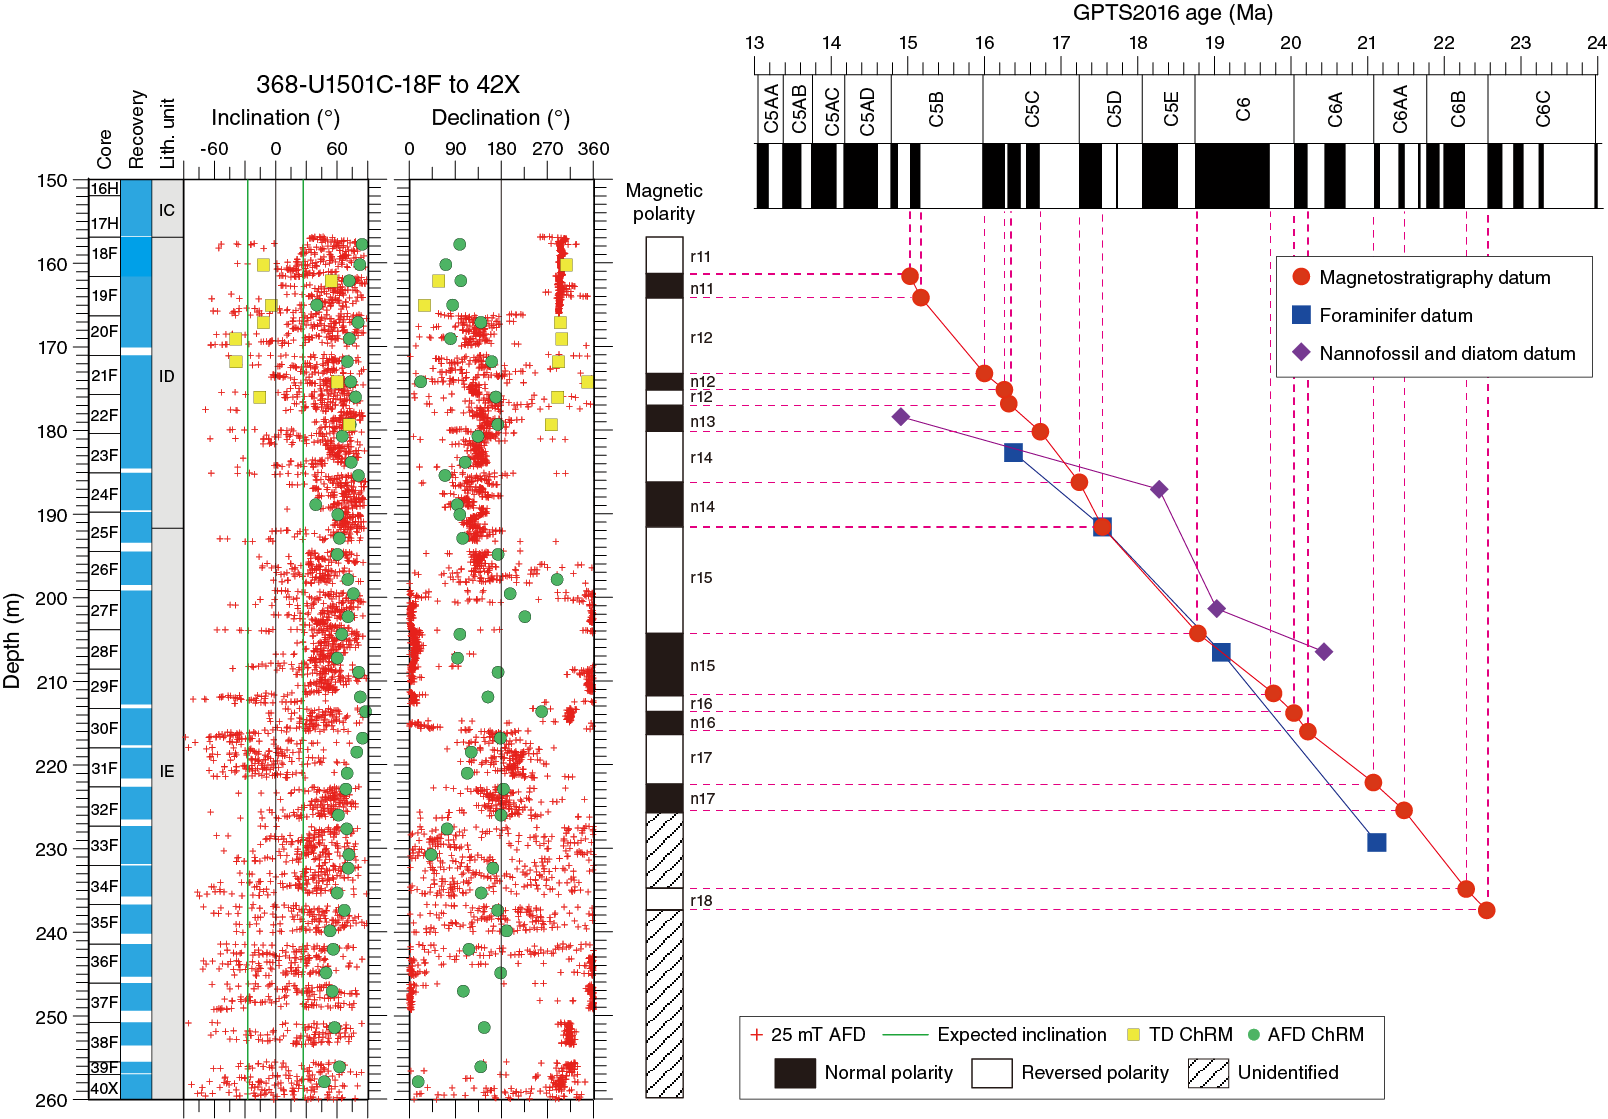
Figure F41. Correlation to magnetostratigraphy, Cores 18F through 40X.
Table T12. Paleomagnetic age datums. Download table in CSV format.
Table T13. Interpreted possible magnetic polarity sequence. Download table in CSV format.
Declinations from Holes U1501A and U1501B and Cores 368-U1501C-1H through 17H were corrected using the Icefield MI-5 core orientation tool (see Paleomagnetism in the Expedition 367/368 methods chapter [Sun et al., 2018a]). In Holes U1501C and U1501D, the interpretation of polarity deeper than 156.8 m is based only on the inclination data because the XCB and RCB coring processes disturb the geographic core orientation. Our interpretations of inclination are based on directions derived from the raw moments measured by the SRM at 25 mT and from the corroborative evidence from AF demagnetization of discrete samples.
We then correlated the magnetostratigraphic data of Site U1501 to the standard timescale (Ogg et al., 2016) and plotted them along with the tie points from the microfossil ages from shipboard paleontologists (Figures F40, F41). The paleomagnetic and paleontological age constraints match well over most of the section. A succession of eight normal and five reversed intervals was recognized in Hole U1501D (Table T13; Figure F39). The lack of fossils in Unit III prevents correlation of magnetostratigraphic features (n1 to n8 in Figure F39) to the geologic timescale. The apparently long n8 interval (~37.45 m thick) may only represent a relatively short duration (0.37 My) if the sedimentation rate was high (~100 mm/ky) at that time.
Based on both inclination and declination, we placed the boundary between the Brunhes and Matuyama Chrons at ~24 m in Hole U1501C. Based on our shipboard paleomagnetic age model, the middle/early Pleistocene boundary (0.78 Ma) is at ~24 m, the Pleistocene/ Pliocene (2.58 Ma) boundary is at ~62 m, and the Pliocene/ Miocene boundary (5.33 Ma) is at ~90 m (Table T12).
Geochemistry
Headspace gas concentrations were below detection due to low TOC contents <0.25 wt% and low levels of thermal alteration within underlying units. The bulk sediment geochemistry was controlled by lithology. High calcium carbonate content in lithostratigraphic Unit I reflects its high biogenic carbonate content. TOC and sulfur are mostly low in Unit I, with higher sulfur concentrations observed in lithostratigraphic Unit II. The low TOC concentrations in much of Unit I likely reflect poor preservation under aerobic conditions. The interstitial water concentration depth profiles show atypical redox zones for marine sediments with rates of sulfate reduction appearing to be inhibited, much as methanogenesis has likely been inhibited at this site. Sulfate reduction is more pronounced in Unit II (>300 m), and within this interval there is also heavy pyritization. Raman spectroscopy was applied shipboard to organic materials and indicates a mild thermal history for Units I and II. Surface-enhanced Raman spectroscopy yielded Raman bands diagnostic of asphaltene within the sediments of Unit I.
Headspace gas
Headspace gas samples were taken at a frequency of one sample per core or per 10 m of drilling advance for routine safety monitoring. Where possible, samples were collected from sections adjacent to interstitial water samples. At no point did hydrocarbon gas levels exceed a 12 ppmv detection limit—a limit corresponding to background values in air. Methane was detected in standard reference materials and within a paleomagnetism sample obtained from the core catcher of Core 368-U1501C-62X that evidenced drilling disturbance (frictional heating induced by rotation). A typical safety gas chromatogram is shown in Figure F42, in which hydrocarbons up to propane (C4H10) can be seen in the drilling-disturbed sample (propane is the highest carbon number that is quantified by the method used). Also shown are data for the analysis of a paleomagnetism sample obtained from the core catcher that was altered by drilling disturbance and contains light hydrocarbon gases. Analytical methods were capable of detecting light hydrocarbon gases, but none were present at significantly high concentrations within safety gas samples. Traces of propene were also detected, particularly from headspace samples collected close to the core liner and from RCB cores.
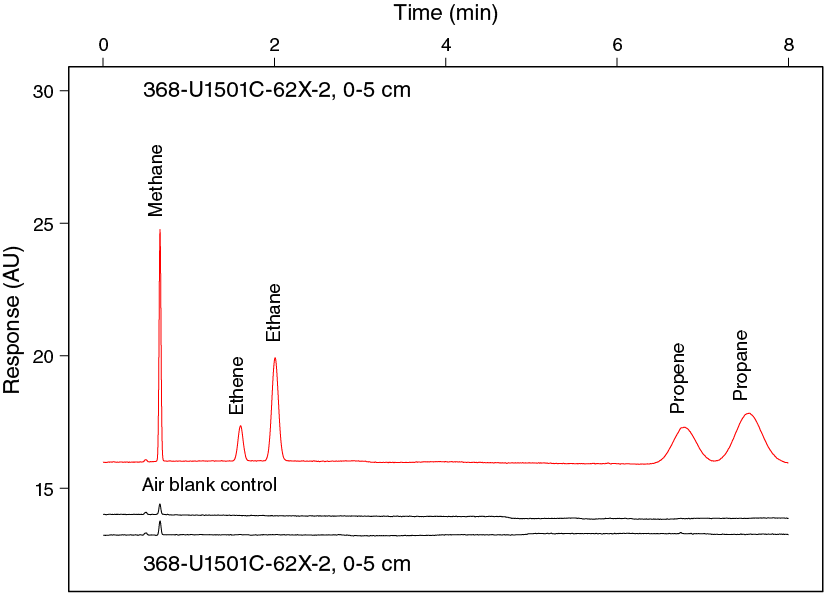
Figure F42. Gas chromatograms.
Bulk sediment organic geochemistry
Bulk sediment organic geochemical parameters are presented by depth in Figure F43 and Table T14 and cross-plotted by unit in Figure F44.
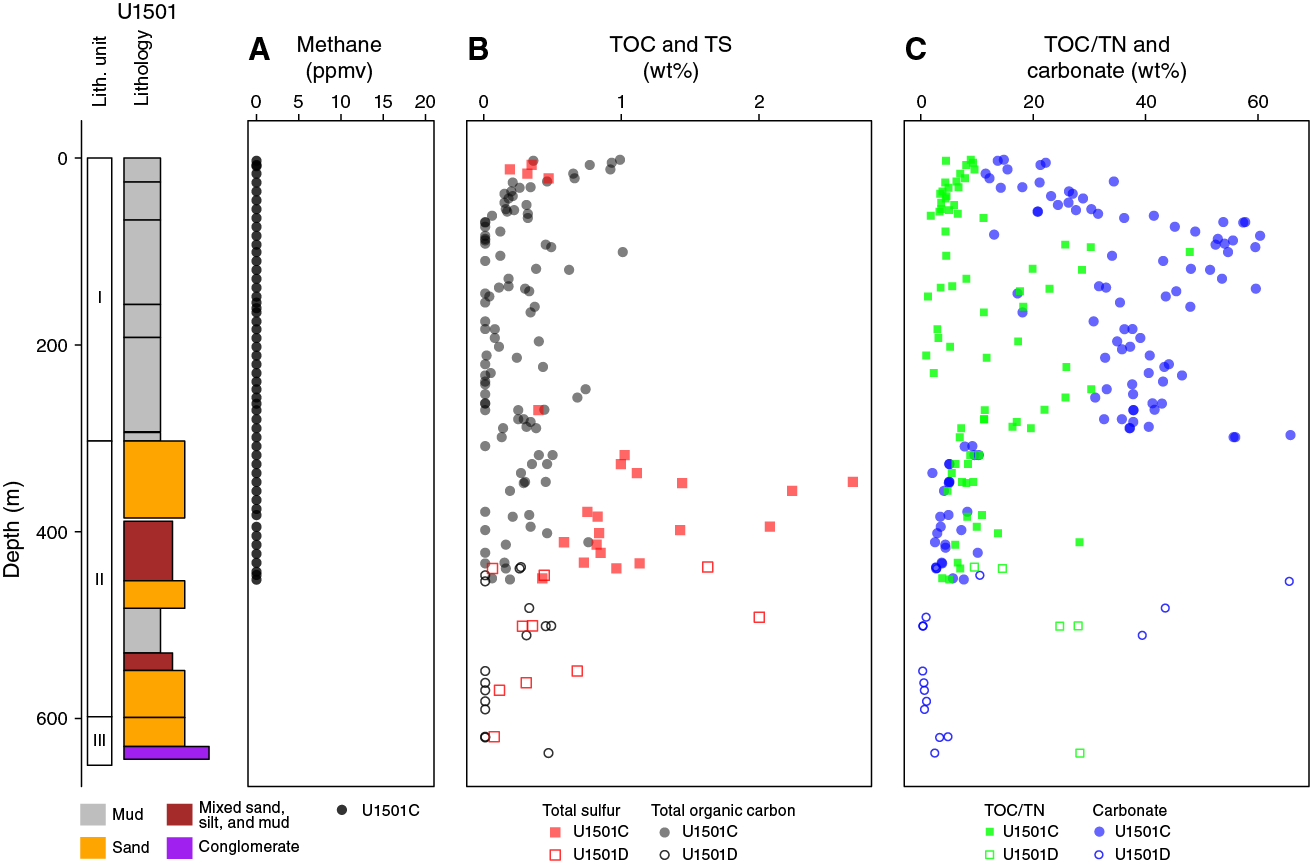
Figure F43. Carbon, sulfur, and TOC/TN.
Table T14. Carbon, nitrogen, and sulfur. View table in PDF format. Download table in CSV format.
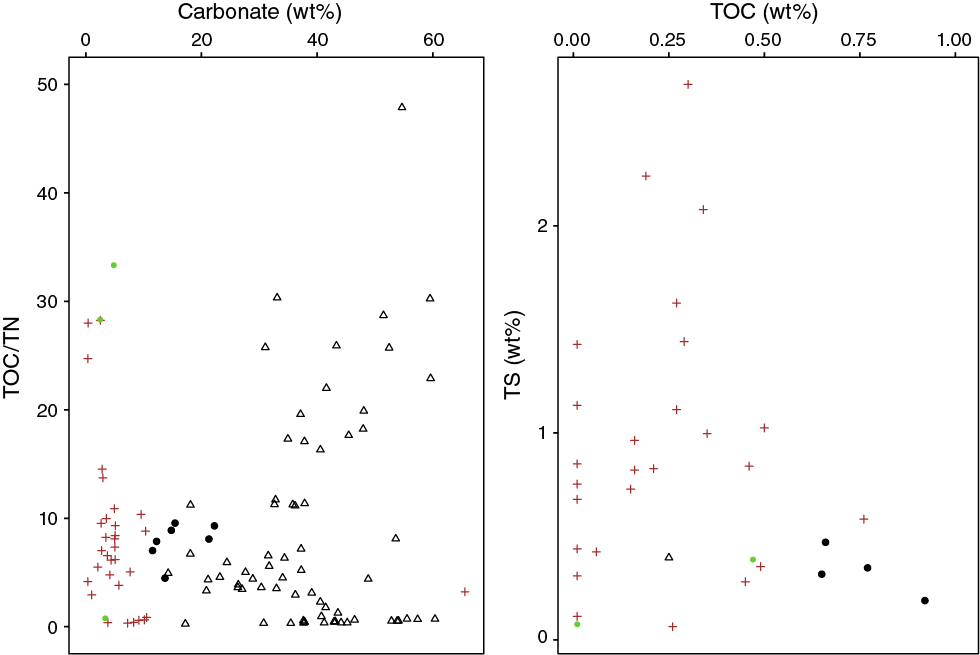
Figure F44. Organic geochemical parameters.
Lithostratigraphic Unit I
Sediments from the uppermost 30 m of lithostratigraphic Unit I (seafloor to Core 368-U1501C-5H) generally have high TOC and low carbonate contents. The top of the section to ~25 m has low but measurable sulfur contents. Otherwise, lithostratigraphic Subunits IB–IF have very low sulfur values. This is distinct from the underlying members of Unit I that have an average carbonate content of ~40 wt% and low TOC, typically <0.25 wt%. Given the fossiliferous nature of the lithologies (nannofossil ooze with foraminifers), it is unlikely that these carbon results represent low levels of biological productivity. More likely, they represent poor preservation of organic matter, which is typical of accumulation under aerobic rather than anaerobic conditions (Demaison and Moore, 1980). The preservation of sulfur in sediments is biologically mediated by sulfate reduction to form sulfide, which in turn forms pyrite (Berner and Raiswell, 1984). Under aerobic conditions, this process is inhibited and would not occur as readily, although organic matter starvation also inhibits sulfate reduction because organic matter forms part of the vital redox couple for sulfate reduction. Whatever the cause, dissolved sulfate concentrations within interstitial water, as described later, did not decline markedly within Subunits IB–IF, supporting the notion that TS levels are low because sulfur has not been reduced during early diagenesis and fixed as pyrite. The instances of very high TOC/total nitrogen (TN) ratios (>10) may reflect an autochthonous input of terrestrial-derived organic matter to the sediments but may also be produced by a lower detection limit for organic carbon than for nitrogen (Hedges et al. 1988).
Lithostratigraphic Unit II
Lithologies within lithostratigraphic Unit II include both high and low TOC members that likely reflect sandy and mud-rich lithologies. The highest TOC values have the highest TOC/TN ratio, consistent with organic carbon being derived from terrestrial organic matter (Hedges et al., 1988). This unit also has high sulfur content, likely reflecting the fixation of interstitial water sulfate as sulfide that becomes incorporated within sulfide minerals during diagenesis (Raiswell and Berner, 1984). The unit has low carbonate contents relative to Unit I, but overall an 8–10 wt% carbonate content is still significant and must represent either a bioclastic or authigenic component.
Lithostratigraphic Unit III
Only a few lithologies within lithostratigraphic Unit III were analyzed (three samples in all). A TOC content of 0.5 wt% was obtained for gray mudstone, but otherwise Unit III sediments have very low TOC and carbonate contents. The sulfur content of <0.5 wt% is low but higher than might be expected given the unit’s lithologic associations (gravel) and when compared to Unit I (see Lithostratigraphy).
Raman and surface-enhanced Raman spectroscopy
Conventional Raman spectroscopy was applied to organic materials, including samples of amber, ash-rich lignite, and bitumen. For reference purposes, they are compared to a sample of Midlothian bituminous coal from the Midlothian coalfields (Scotland) and a sample of pre-oil-window oil-shale from the Brora Coal Member (Caithness, Scotland). Raman spectra are shown in Figure F45. Raman spectra obtained from solid carbon-rich fossil organic matter typically have two broad composite bands (or peaks). The first is centered at 1460 cm−1, is relatively broad and wide, and is termed the disordered band (D-peak). Another band at 1600 cm−1 is produced by vibrational modes generated by aromatic sheets with a graphite-like structural ordering (Pasteris and Wopenka, 2003) and is termed the graphite (G) or ordered (O) peak.
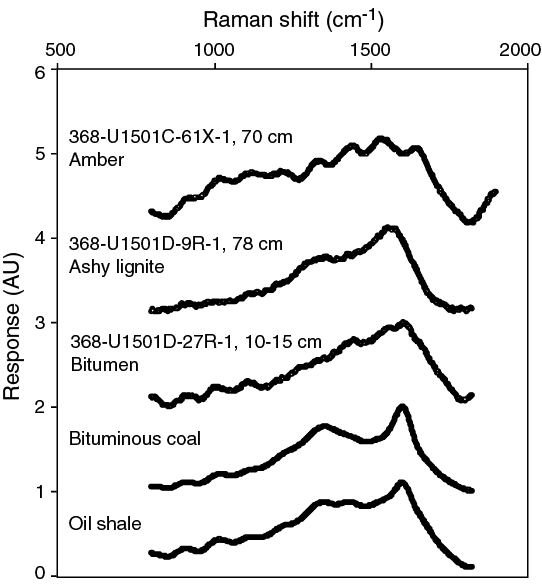
Figure F45. Raman spectra of carbonaceous materials.
Fluorescence dominates the spectra obtained for the amber sample (368-U1501C-61X-1, 70 cm), with no clear band distinguished at 1460 or 1600 cm−1, although the broad band observed around 1550 cm−1 likely derives from the ordering of π-bonded aromatic sheets with graphite-like structures. A D-peak is also present, but is so broad it cannot be reasonably interpreted. Thus, the sample can be shown to contain organic carbon, but beyond this no other information can be obtained. Relative to the high molecular weight aromatic compounds within humic organic macerals or kerogen, amber comprises plant resins that are highly aliphatic, lack strong aromatic cores, and fluoresce strongly. These qualities make these materials poorly suited for analysis by Raman spectroscopy using a 532 nm light source.
The sample of lignite (light brown streak, no cleats, and partial humification; Sample 368-U1501D-9R-1, 78 cm) yielded broad D and G bands characteristic of levels of thermal maturation typical of brown coal (preoil and gas generation) and levels of thermal alteration that indicate heating at temperatures <40°C.
In most cases, the bitumen impregnating a sandstone clast from Section 368-U1501D-27R-1, 10–15 cm, yielded fluorescence only, but Raman spectra were obtained from a solvent-insoluble component present on the clast’s exterior and within a fracture. The D band for these spectra was shrouded by fluorescence, but a G peak could be observed, and the Raman shift was notably high (equal to or greater than that of the coal, ~1600 cm−1), possibly indicating a higher level of thermal maturity than observed for the lignite. This higher level would be consistent with the insolubility of the bitumen in solvent.
Surface-enhanced Raman spectroscopy detected 0.2–2 ng asphaltene/g sediment in lithostratigraphic Units I and II. Detection required deconvolution of surface-enhanced Raman spectra (Figure F46). Primarily, two components were considered: solvent extracts of sedimentary organic matter (SOM) that exhibited relatively narrow Raman bands at shifts of 1310, 1448, and 1650 cm−1 and asphaltene that exhibited broad Raman bands at 1380 and 1575–1585 cm−1 (Alabi et al., 2015). A small Raman band at ~1522 cm−1 was often left as a residual. The two broad Raman bands are at positions consistent with previous studies of asphaltene and are similar to the D and G bands of solid carbonaceous materials, whereas the band at ~1522 cm−1 is a position, based on previous surface-enhanced Raman scattering studies, that likely corresponds to carotenoids (Wilson et al., 2007), which are also a likely component of marine SOM. The detection of surface-enhanced Raman scattering bands diagnostic for asphaltene and thereby residual petroleum (asphaltene is the most resistant component of petroleum and bitumen and accumulates as residues) is important given the context of the SOM. There is no evidence of recent petroleum migration at Site U1501, and indeed headspace hydrocarbon gases remained below detection. The single instance of bitumen was a highly thermally matured solid component, unlikely to have migrated in recent geological history.

Figure F46. Surface-enhanced Raman spectra.
Interstitial water chemistry
Shipboard analyses were performed on interstitial water squeezed from 5–15 cm long whole-round sediment samples from Hole U1501C. For Cores 1H through 10H, 5 cm long interstitial water samples were squeezed and yielded >40 mL of interstitial water per sample. For Cores 11H through 37F, 10 cm long whole-round sediment cores were squeezed and yielded ~30 mL of interstitial water. For Cores 39F through 61X, 15 cm long whole-round interstitial water samples yielded <15 mL of interstitial water per sample. In Hole U1501D, only one sample from Core 2R yielded water on squeezing and then only at a maximum pressure of 30,000 lb for 6 h.
Interstitial water geochemical parameters are listed in Table T15 and presented by depth in Figures F47 and F48.
Table T15. Interstitial water analyses. View table in PDF format. Download table in CSV format.
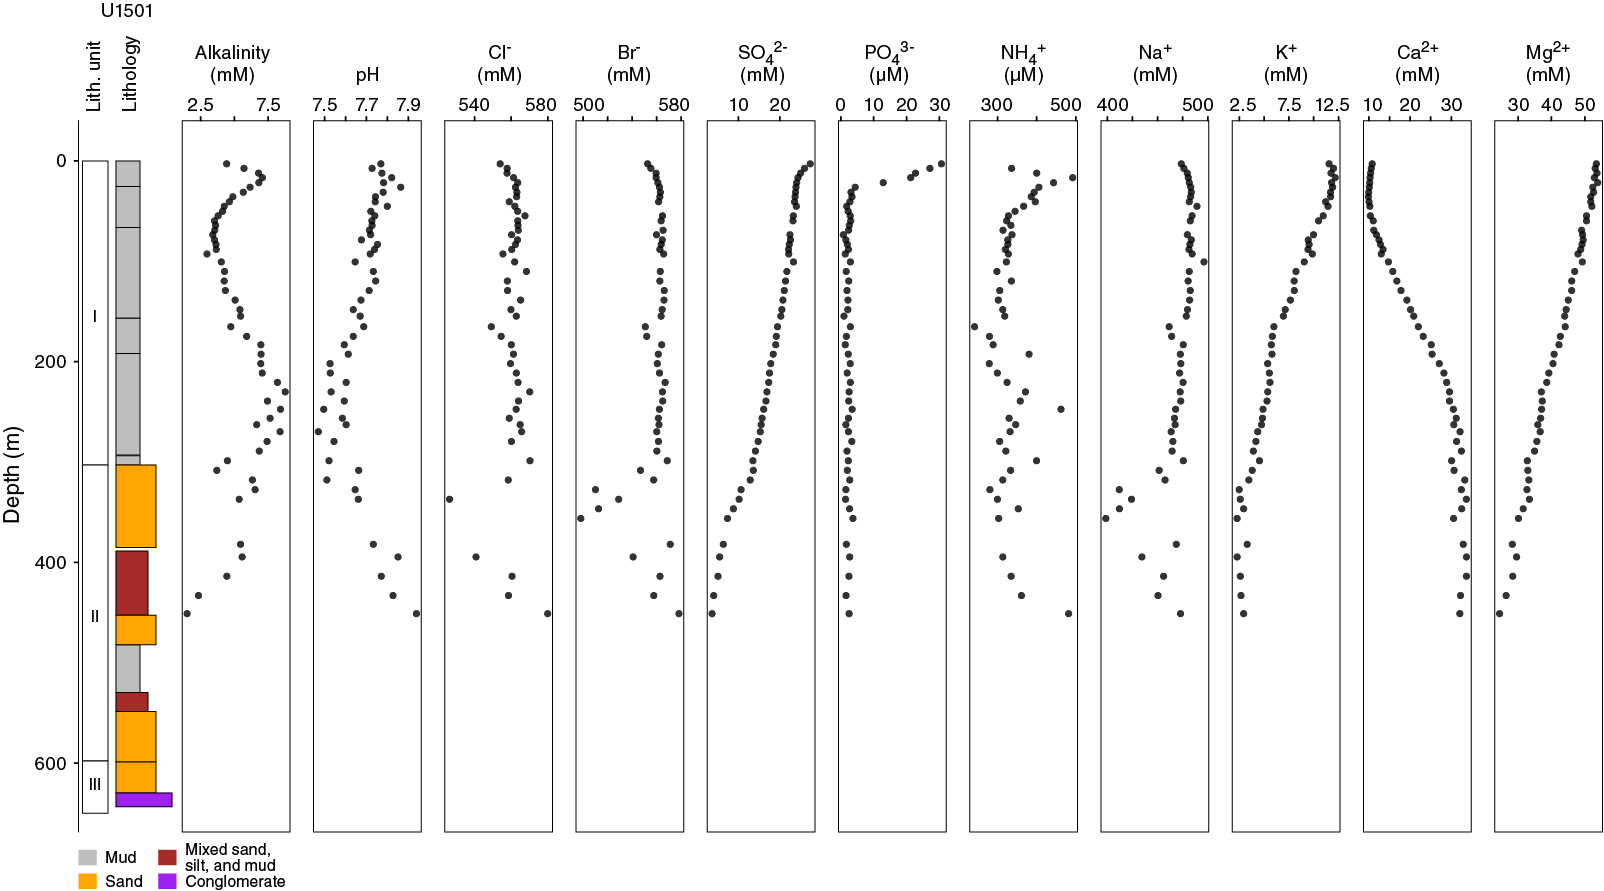
Figure F47. Interstitial water concentration profiles.
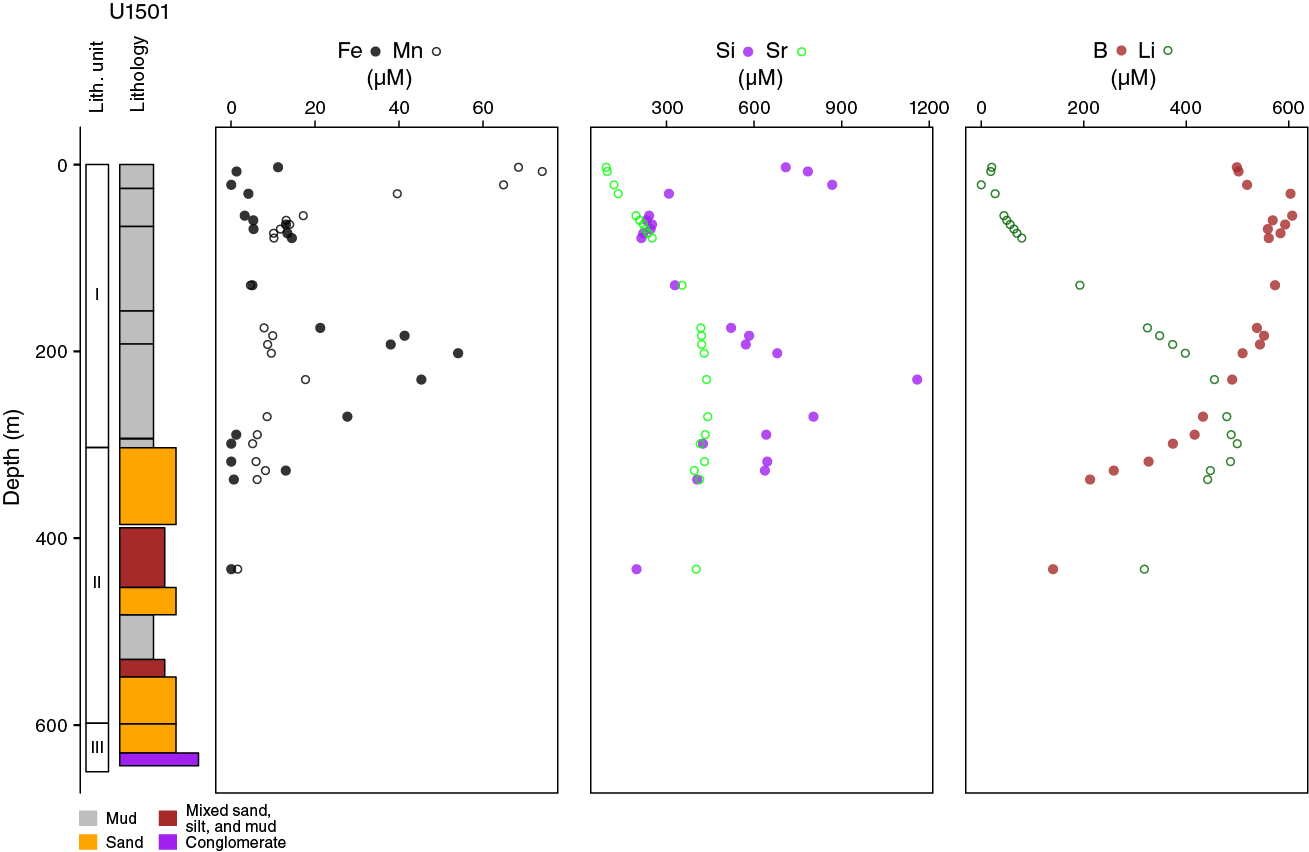
Figure F48. ICP-AES concentration profiles.
We defined four geochemical interstitial water zones at Site U1501 based on the variation of geochemical parameters (listed in Table T15). Interstitial water Zone 1 (interval 368-U1501C-1H-2, 0–5 cm, through 2H-5, 0–5 cm) comprises samples obtained close to the mudline (sediment/water interface). Within this interval, maximum sulfate, alkalinity, phosphate, ammonium, boron, silica, lithium, and manganese concentrations are likely related to degradation of organic matter. In interstitial water Zone 2 (interval 3H-2, 0–5 cm, through 43X-4, 0–15 cm), sulfate slightly decreases and alkalinity is buffered by high carbonate concentrations within foraminifer-rich oozes. Atypically for this marine setting (Li et al., 2015a), in which sulfate reduction is prevalent in marine sediments, diffusion processes dominate the sulfate profile. Decreasing K and Mg and increasing Ca and Li reflect the typical diffusion-formed profile of interstitial water, but in interval 19F-3, 0–15 cm, and Section 27F-2, there is an obvious increase in Fe, Si, and Mn and a slight decrease in Na, Cl, and Br. This atypical profile is similar to that of the deep fluids in Hole U1502A, which are suggested to derive from basalt. In interstitial water Zone 3 (interval 44X-4, 0–15 cm, through 50X-4, 0–15 cm) sulfate, chloride, and bromide concentrations are anomalously low. One possible origin for this fluid migration is along sand and silt layers in which a fluid depleted in Cl, Br, and Na migrates. Alternatively, the chemical composition may be explained by a sand body or sand-rich unit being isolated by differential compaction within a hydraulically sealed mudstone; in such a case, the water would represent relict formation water. In interstitial water Zone 4 (interval 53X-4, 0–15 cm, through 61X-2, 0–15 cm), all major anion and cation concentrations are normal for that depth and the region (Li et al., 2015a).
Alkalinity varies within Hole U1501C, ranging from 1.5 to 8.8 mM (shown in Figure F47). In interstitial water Zone 1, alkalinity increases to a peak concentration of 7.1 mM at 16.72 m (Sample 2H-5, 0–5 cm). This change in alkalinity is most likely caused by degradation of organic matter. In interstitial water Zone 2, alkalinity decreases to ~3.5 mM at 59 m and remains constant at ~3.5 mM to 100 m. Alkalinity increases again to a peak concentration of 8.8 mM at 230 m and then decreases downhole to the base of interstitial water Zone 2. The changes of alkalinity in interstitial water Zone 2 are similar to those of carbonate, suggesting that alkalinity might be influenced by the dissolution of carbonate. The pH value decreases slowly from the seafloor to the bottom of interstitial water Zone 2 and then increases to a maximum (pH = 7.94) at the bottom of interstitial water Zone 4 (Sample 61X-2, 0–15 cm).
In interstitial water Zones 1 and 2, interstitial water chlorinity values are mostly ~560 mM, similar to the standard seawater value (559 mM; Figure F47). In interstitial water Zone 3, chlorinity values decrease to the minimum (498 mM) at 356 m. About 10% decreased chlorinity implies that a “freshwater” component might be present. The bromide depth profile is similar to the variation observed for chlorinity but with a maximum that occurs at a different depth. Bromide concentration also decreases to a minimum in interstitial water Zone 3. It is worth noting that slightly decreased chlorinity and bromide concentrations were observed in Cores 19X-3 and 21X-3.
The dissolved sulfate profile decreases from 27.2 mM at the seafloor to 3.7 mM at the bottom of Hole U1501C (Figure F47). In interstitial water Zone 1, sulfate concentrations decrease sharply, most likely caused by bacterially mediated organic matter diagenesis in upper sediments. Downhole, this decline is more gradual and can best be explained by diffusion processes. The interstitial water contains significant amounts of sulfate (3.7 mM) to the bottom of the hole, indicating that sulfate is not completely consumed in Hole U1501C. A similar case was observed at IODP Site U1431 (Li et al., 2015b), but otherwise this lack of sulfate reduction is unusual. Dissolved NH4+ concentrations increase from 336 μM at 7.5 m to a maximum of 492 μM at 16 m in interstitial water Zone 1. Interstitial water Zones 2–4 have slight variations in NH4+ concentrations. A maximum in dissolved phosphate concentrations is 30.6 μM at 3 m in interstitial water Zone 1. In interstitial water Zones 2–4, phosphate concentrations are generally low, just about several micromolars.
The Na+ profile is similar to Cl− and Br− (Figure F47). Sodium concentrations are mostly constant (~480 mM) in interstitial water Zones 1 and 4, decrease to a minimum (399 mM) in interstitial water Zone 3, and increase to standard seawater value (~480 mM) in interstitial water Zone 4 (likely representing contamination). Sodium concentrations in interstitial water Zone 3 are about 20% of that in other units. The K+ and Mg2+ profiles decrease in a similar way to each other from the surface to the bottom of the hole. Decreases in potassium and magnesium are possibly due to diagenetic reactions occurring in sediment, such as clay ion exchange. Contrary to the potassium and magnesium pore water profiles, the Ca2+ profile increases from the surface to a maximum concentration (33.7 mM) at 337 m, and below this depth calcium has a near-constant concentration. Changes in calcium concentration are mostly caused by carbonate diagenesis (i.e., dissolution and recrystallization of biogenic carbonate). The strontium profile in interstitial water is controlled by the dissolution of biogenic carbonate, so it is similar to the profile of calcium. Strontium concentrations increase from the subsurface to the maximum (440 μM) at 269 m and remain around 400 μM until the bottom of the hole (Table T16).
Table T16. Interstitial water minor elements. View table in PDF format. Download table in CSV format.
Dissolved Ba concentrations in the interstitial water are controlled by the formation and stability of the mineral barite (BaSO4). Barium and sulfate concentrations are negatively correlated. In interstitial water Zone 1, the dissolved Ba concentration is very low (0.05 μM) and corresponds with the maximum in sulfate. In interstitial water Zones 2–4, Ba concentrations increase linearly to a maximum (2.49 μM) at the bottom of Hole U1501C at the same time sulfate concentrations decrease to a minimum.
In interstitial water Zone 1, degradation of organic matter releases B into the interstitial water (Li and Jiang, 2010), so the dissolved B concentrations increase with depth (Figure F48). In interstitial water Zone 2, the B profile is likely driven by clay mineral cation exchange (e.g., adsorption onto and desorption from clay minerals). Decreased B concentrations are observed in interstitial water Zones 2 and 3. Lithium is also easily adsorbed onto clay minerals such as kaolinite and smectite and/or other terrigenous sediments. Thereafter, in interstitial water Zone 1, the concentration of Li is lower than modern seawater (25 μM). In interstitial water Zone 2, Li concentrations increase gradually from 27 μM to a maximum (499 μM) and then decrease to lower concentrations in interstitial water Zones 3 and 4. The increases in Li concentration are possibly due to the diagenetic release of Li from clay minerals and/or diffusion from Li-enriched deep fluids.
Silica concentrations in interstitial water Zone 1 are controlled by the dissolution of siliceous microfossils that release silica into interstitial water. In interstitial water Zone 2, peaks in Si, Fe, and Mn concentrations were observed between Sample 368-U1501C-21F-3, 0–10 cm, and Section 27F-2 at the same time as decreased Na, Cl, and Br concentrations. The changes in geochemical parameters are similar in character to those of the deeper fluids in Hole U1502A. The profiles of dissolved Fe and Mn change in a way similar to that of Si, perhaps because Fe and Mn are affected by the degradation of organic matter, which also occurs in surface sediments. At Site U1502, there was enrichment in Mg and Ca, but in Hole U1501C changes in Ca and Mg do not appear to be off-trend.
In summary, the most obvious changes in interstitial water chemical composition occur in Sections 368-U1501C-19F-3 through 27F-2 and deeper than 300 m. Fluid from these sections have similar geochemical parameters to the deep fluid from Hole U1502A, which is suggested to be influenced by the dissolution of mafic minerals within basalt. The fluid below 300 m corresponds to a boundary between lithostratigraphic Units I and Unit II. A sharp change in interstitial water chemistry at very shallow subseafloor depths suggests very rapid degradation of organic matter within the uppermost 16 m.
Bulk sediment and rock geochemistry
We analyzed a total of 64 sediment samples from Holes U1501B, U1501C, and U1501D for major and minor element concentrations by inductively coupled plasma–atomic emission spectroscopy (ICP-AES) (Table T17).
Table T17. Major element oxide and minor elements. View table in PDF format. Download table in CSV format.
Elemental compositions primarily reflect geological units and changes in lithology. Silica, aluminum, and calcium oxides are the major elements and typically account for greater than 90 wt% of the elemental composition of most lithologies (Figure F49). In lithostratigraphic Unit I, calcium oxide contents are high, and within the foraminifer-rich interval they exceed 40 wt% (consistent with the unit being a high-carbonate ooze, e.g., >50% carbonate). Within lithostratigraphic Units II and III, calcium (as carbonate) is less common and the units are predominantly siliciclastic with sharp distinctions between units that are mud-rich and the feldspathic, sandier lithologies toward the base of the hole. In lithostratigraphic Unit III, a steady decrease in potassium content reflects the upward transition from an orthoclase-rich to less orthoclase-rich sandstone. Sandstones at the top of lithostratigraphic Unit II are far muddier than those beneath, and the relatively increased potassium content is associated with increased aluminum content. Likely, these changes reflect an upward increase in clay content in lithostratigraphic Unit II. Such a progression is consistent with increased compositional maturity within the sediment, brought on by the transition from first- to second-cycle sediments (Suttner et al., 1981) (e.g., the breakdown and conversion of orthoclase to clay minerals during weathering in the sediment source). Within the basal part of lithostratigraphic Unit II, sodium and potassium are both high, which is also consistent with the presence of first-cycle feldspathic sediments.
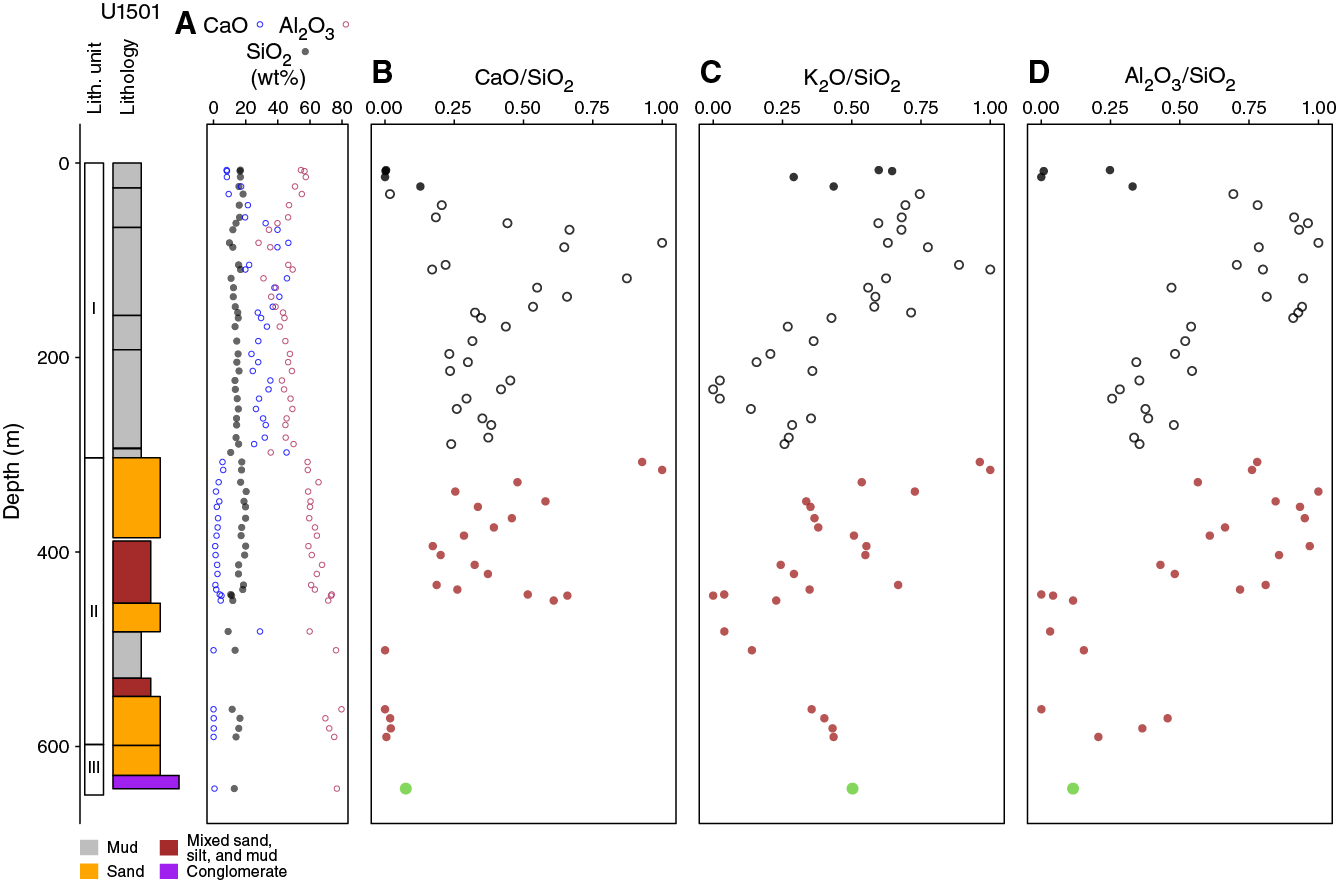
Figure F49. Major element oxide abundances.
Parameters previously proposed to represent sedimentological processes for the SCS were also evaluated (Clift et al., 2014). In detail, Figure F50 shows the depth profile of a parameter based on the major cations in smectite (Mg and Na) and illite (K). The variation of (Mg + Na)/K values reflects the different clay assemblages in the lithostratigraphic units. The Ti/Ca parameter has previously been used as a proxy of clastic flux (Clift et al., 2014), with Ti being dominated by the presence of heavy detrital minerals (e.g., rutile and titanite) and Ca by biogenic carbonate. The high peak in Ti/Ca depth profile (lithostratigraphic Subunit IA) is most possibly correlated with intensified clastic delivery from continents; furthermore, the high Ti/Ca with low Al/Si (low ratios of clay and quartz sand) values in Subunit IA (Figure F49) may indicate a high-energy transport regime during this period.
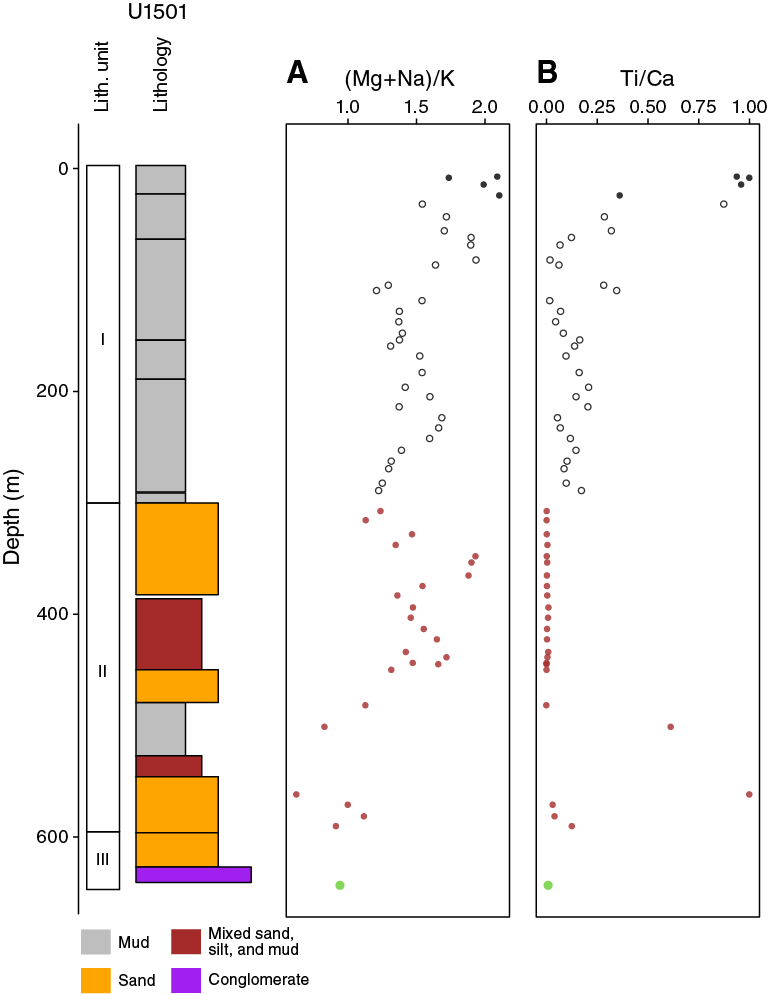
Figure F50. Geochemical parameters correlated with sedimentological processes.
Discussion of organic, formation water, and inorganic chemical results
The following synthesis is based on the geochemical data presented in the preceding sections. Based on the lack of methane generation and sulfate reduction and the fixation of sulfur as pyrite within sediments, aspects of early diagenetic environments at Site U1501 are atypical in comparison to other sites in the region (Li et al., 2015a). Deepwater marine mudstones do not regularly have high TOC values, largely because their depositional environments in general do not favor high rates of organic carbon preservation (Demaison and Moore, 1980). However, the low TOC values (<0.5 wt%) found in lithostratigraphic Subunit IIA are also at odds with nearby sites such as Site U1499. The low methane content of sediments and sulfate reduction profiles also differ markedly between the two sites; there is no evidence of a present-day sulfate–methane transition zone (SMTZ) at Site U1501 (Barnes and Goldberg, 1976). Figure F51 summarizes these features. Within lithostratigraphic Unit II, sulfate reduction is inhibited relative to Site U1499. Perhaps unsurprisingly, because sulfate is ultimately converted to pyrite, the main form in which pyrite is stabilized within sediments, the TS content of Unit I is mostly low, except for the topmost interval, where both iron and organic carbon contents are high.
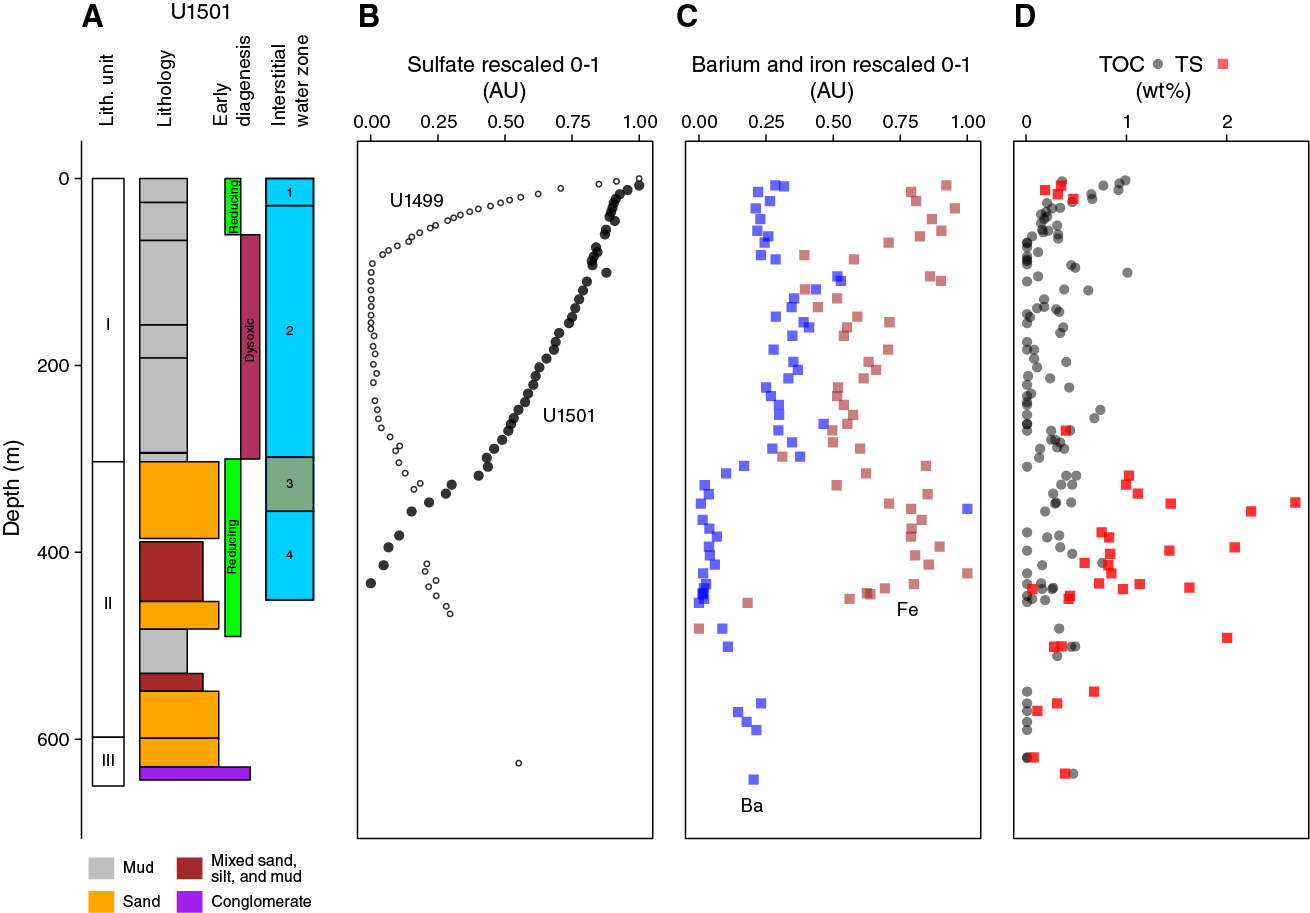
Figure F51. Variations in diagenetic history.
Causes for inhibited pyrite formation and sulfate reduction might include a lack of iron, low organic matter content (organic matter serves as a reductant), and a dysoxic environment (Berner and Raiswell, 1984). Both factors are present at Site U1501, as can be seen in Figure F51. Iron, which is particularly noticeable in this regard, has an inverse correlation to barite. Barite and thereby Ba can also serve as indicators for past redox boundaries in sediments (Torres et al., 1996). Barite precipitates and is fixed in sediment where sulfate is stable under oxic conditions, generally found above the SMTZ where sulfate is most abundant. The inversely varied Ba and Fe thus likely denote varying diagenetic conditions within the sediment column. Overall, this strongly indicates that Site U1501, situated at a basement high, has seen a substantial change in early diagenesis conditions during recent geological history.
Physical properties
Sediment and rock physical properties were measured on cores from Holes U1501A (0–9.5 m), U1501B (0–9.5 m), U1501C (0–461.9 m), and U1501D (433.5–644.3 m). After cores reached thermal equilibrium with ambient temperature at ~20°C, gamma ray attenuation (GRA) density, magnetic susceptibility, and P-wave velocity were measured every 2 cm using the Whole-Round Multisensor Logger (WRMSL). After WRMSL scanning, NGR was measured on the whole-round sections with a counting period of 10 min and a measurement spacing of 10 cm. Thermal conductivity was measured next with a needle probe inserted into whole-round cores on unconsolidated sediments and with a puck probe on split section halves on hard rocks. Following core splitting, color reflectance and magnetic susceptibility measurements were taken from the archive halves using the point magnetic susceptibility (MSP) sensor on the Section Half Multisensor Logger (SHMSL). Discrete MAD measurements were obtained on every other section of the working halves. P-wave velocity was also measured on the working halves with the P-wave caliper (PWC) and P-wave bayonet (PWB) pulser-receiver systems of the Section Half Measurement Gantry (SHMG).
The following major physical property units were distinguished at Site U1501:
These units are described below. The results from the WRMSL, SHMSL, SHMG, and discrete sample measurements are shown in Figure F52.
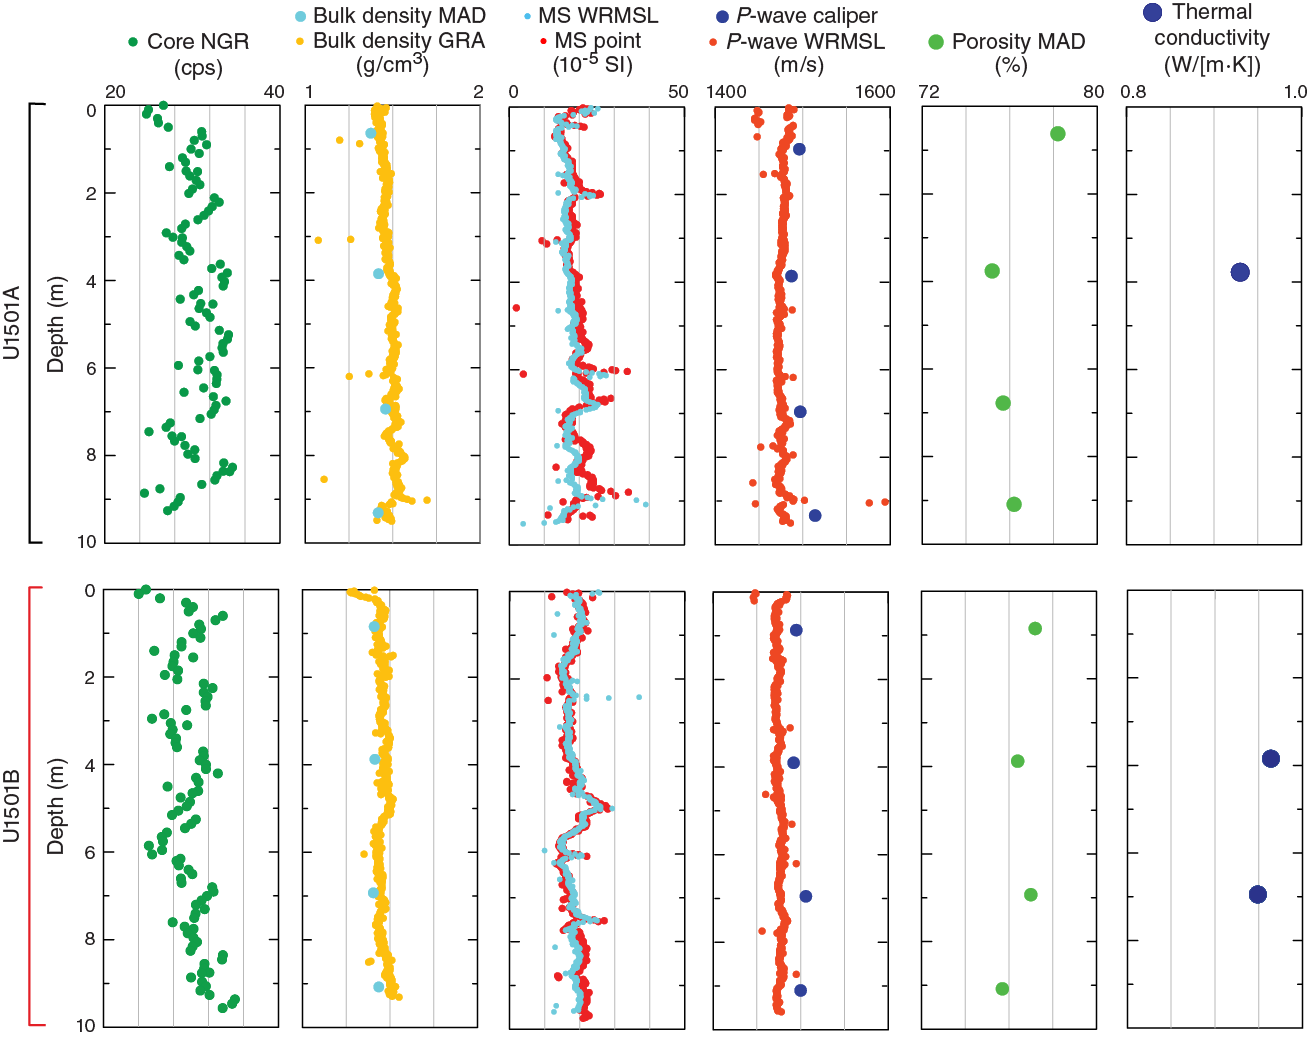
Figure F52. Physical properties, Holes U1501A and U1501B.
Natural gamma radiation
The NGR intensity measured at an energy level characteristic for K, U, or Th is proportional to the content of that element in the sediment. These elemental proportions can help improve stratigraphic correlation and may be indicative of the geochemistry and mineralogy of the sediments (e.g., De Vleeschouwer et al., 2017). In general, the NGR count of sandstones increases with silt and shale content and a higher percentage of minerals other than quartz (Russell, 1944).
NGR values in PP Unit 1 are represented by two major intervals (Figure F53). The upper interval from the seafloor to ~65 m ranges from ~20 to ~50 counts/s and is associated with NGR values that peak around the middle of this depth range. The lower interval of PP Unit 1 has a similar but broader trend and ends at an abrupt increase in NGR values to ~60 counts/s at ~300 m. In PP Unit 2, NGR values vary rapidly, showing an overall increase followed by a decrease in values with depth to the top of PP Unit 3 at ~450 m. PP Unit 3 has a steady rise in NGR values and a sharp increase at ~600 m to ~80 counts/s that characterizes PP Unit 4.

Figure F53. Physical properties, Holes U1501C and U1501D.
Concentrations of K, U, and Th were estimated using the NGR counts and bulk density measurements for Hole U1501C according to the methods by De Vleeschouwer et al. (2017). The trends in the NGR counts are not as clearly expressed in the Th concentrations as they are in the K percent weight and U concentrations, which show very similar variations to the total NGR count values (Figure F54).
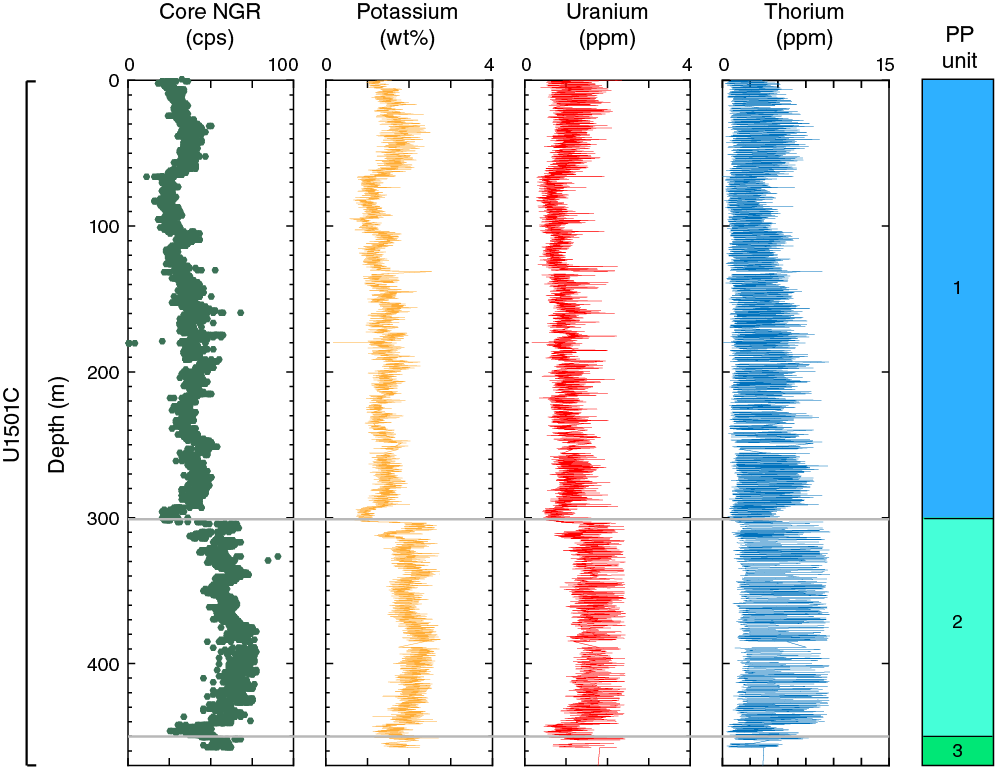
Figure F54. NGR measurements.
P-wave velocity
In PP Unit 1, P-wave velocities gradually increase with depth from ~1450 to 1931 m/s, reflecting sediment compaction (Figure F53). P-wave velocities decrease sharply at the boundary between PP Units 1 and 2 to 1650 m/s. In PP Unit 2 (300–450 m), velocities increase again with depth but remain lower than 2000 m/s downhole to ~450 m, where they spike to values of ~3500 m/s and higher. Scattered high velocity measurements continue to the bottom of PP Unit 3 (450–600 m), but they become the norm in PP Unit 4 (600–657 m), where they generally exceed ~3500 m/s.
Thermal conductivity
In PP Unit 1, thermal conductivity increases gradually with depth from ~0.88 W/(m·K) near the seafloor to ~1.64 W/(m·K) at ~300 m (Figure F53). The increasing trend is interrupted at ~265 m by a slight reduction in thermal conductivity caused by poor connection between the core and the probe. Reliable measurements resumed below 267 m. A drop in thermal conductivity from 1.576 to 1.255 W/(m·K) occurs at the boundary between PP Units 1 and 2 (~300 m), followed by increasing trends in PP Unit 2. Thermal conductivity is more variable in the lowermost section of PP Unit 2 and in PP Units 3 and 4 (440–622 m), where it ranges from ~1.350 to 3.600 W/(m·K).
Density and porosity
In PP Unit 1, GRA and MAD bulk densities increase gradually from ~1.3 g/cm3 just below the seafloor to ~1.9 g/cm3 (Figure F55) at ~300 m. Dry density increases with depth from ~0.6 to ~1.5 g/cm3, and porosity decreases with depth from 80% to 45%, consistent with increasing compaction. At the boundary with PP Unit 2 (~300 m), bulk and dry densities abruptly decrease, whereas porosity increases up to 60%. Grain density remains constant at 2.7 g/cm3.
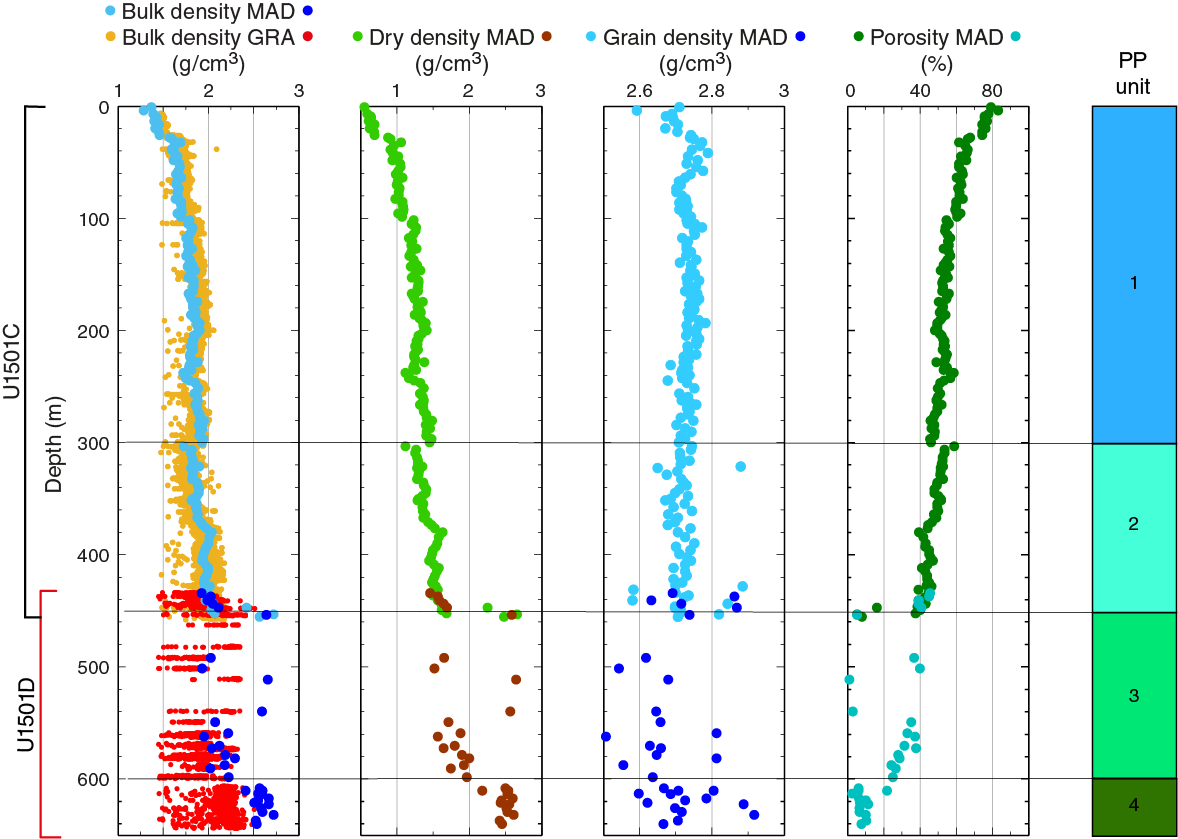
Figure F55. Density and porosity.
In PP Unit 2, bulk and dry densities slightly increase with depth from 1.7 to 2.0 g/cm3 and from 1.1 to 1.7 g/cm3, respectively. Scattered grain density values range from 2.6 to 2.9 g/cm3. Porosity decreases with depth from 60% to 40%. The boundary between PP Units 2 and 3 (450 m) is marked by an abrupt increase in bulk (2.0 to 2.7 g/cm3) and dry (1.7 to 2.7 g/cm3) densities. In PP Unit 3, densities vary, with an overall increasing trend toward the bottom of the unit. At ~600 m, corresponding to the transition between PP Units 3 and 4, bulk and dry densities increase rapidly from ~2.2 to >2.6 g/cm3 and from 2.0 to 2.5 g/cm3, respectively. In contrast, porosity at this depth decreases sharply from 20% to 5%.
PP Unit 4 has an average bulk density of 2.6 g/cm3 and dry density of 2.5 g/cm3 (Figure F55). Grain densities and porosities in this unit fluctuate between 2.5 and 2.9 g/cm3 and 3% and 10%, respectively.
Color reflectance spectrophotometry
L* values are higher in PP Unit 1, reflecting the higher concentration of biogenic carbonate in the uppermost 300 m. Reflectance parameters a* and b* increase sharply from the seafloor to ~120 m to their highest values and then drop in similar fashion before ~180 m. Values remain low thereafter to the boundary with PP Unit 2. L* drops sharply at the boundary at ~300 m, marking the transition between PP Units 1 and 2 and reflecting the increase in clay in the formation (Figure F56). L*, a*, and b* values in PP Unit 2 show relatively constant trends with a variable range. The transition between PP Units 2 and 3 is characterized by a slight increase of L* and b*. An abrupt increase in a* occurs at 600 m, coinciding with the change from glauconite sand to sandstone (see Lithostratigraphy). Below this depth, all reflectance values remain relatively constant.
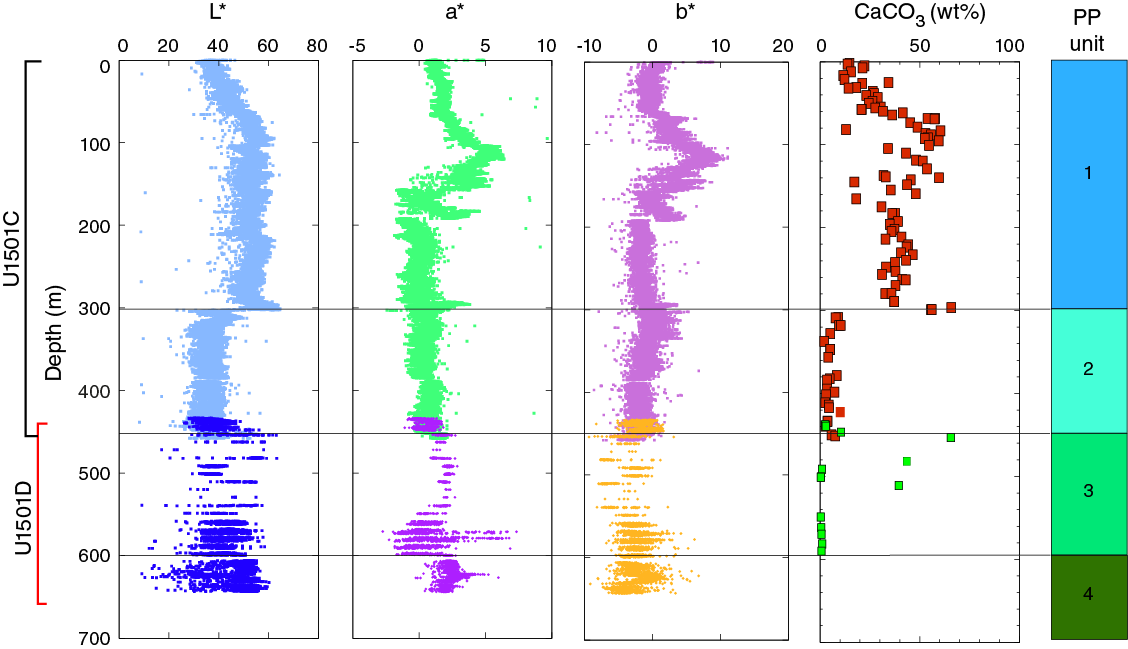
Figure F56. Sediment color reflectance.
Magnetic susceptibility
Magnetic susceptibility rapidly increases from the seafloor to ~50 m and then gradually decreases downhole throughout the lower section of PP Unit 1 until abruptly increasing at the boundary between PP Units 1 and 2, coinciding with the change from nannofossil ooze to nannofossil-rich clay (see Lithostratigraphy). Magnetic susceptibility remains constant in PP Unit 2, with a slight decrease at the boundary between PP Units 2 and 3 (450 m) from 15 × 10−5 SI to 5 × 10⁻⁵ SI that is followed by an abrupt increase at the transition between PP Units 3 and 4. Magnetic susceptibility values in PP Unit 4 are relatively high, locally exceeding 500 × 10−5 SI (Figure F53).
Red, green, blue
Red, green, blue (RGB) values show similar trends to the L* values throughout Holes U1501A–U1501D (Figures F56, F57). From the seafloor through the upper portion of PP Unit 1 (~95 m), RGB values increase from 100 to 160, whereas they remain constant and vary between ~140 and 160 in the lower portion of PP Unit 1. A marked decrease in RGB from 170 to 100 was observed at the boundary between PP Units 1 and 2 (Figure F57). RGB values in PP Unit 2 remain relatively constant at ~100, followed by another increase from 70 to 150 in PP Unit 4.
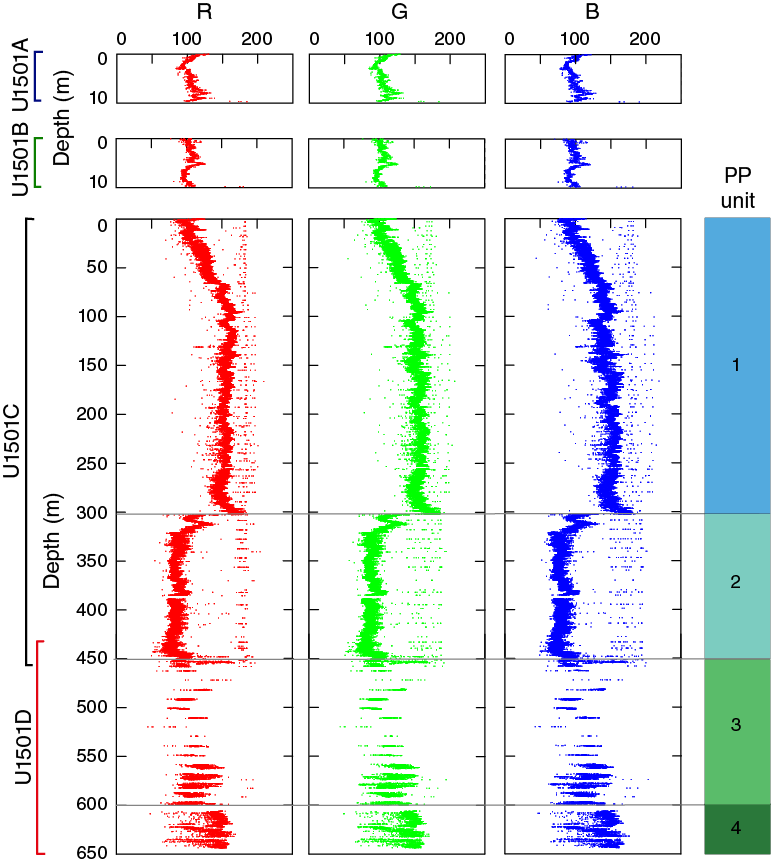
Figure F57. RGB values.
Discussion and summary
Sediments recovered from Site U1501 are generally composed of both biogenic (calcareous or siliceous ooze) and terrigenous material dominated by either quartz or clay. Changes in sediment physical properties not only reflect relative amounts of these components but also their compaction/lithification state and may also be related to depositional environments. Overall, we found a strong correlation between the sediment physical properties and the designated lithostratigraphic units (Figure F53; see Lithostratigraphy). The GRA and bulk densities increase with depth, reflecting the increasing compaction of sediments with depth. Porosity values are consistent with this trend and have an inverse relationship with density (Figure F55). The lowest porosities (about 5%) were encountered in sandstones from the lowermost section of Holes U1501C and U1501D and are related to diagenetic processes (i.e., lithification and cementation).
Similarly, a general increase in P-wave velocity at Site U1501 from 1451 m/s at the seafloor to 1931 m/s at 302 m (Figure F53) reflects sediment compaction. This increase is followed by a sharp decrease in velocity at 302.9 m to 1796 m/s, marking a distinct lithologic transition from nannofossil ooze to a sand layer overlying clays (lithostratigraphic Units I to II; see Lithostratigraphy). Below this depth, P-wave velocities show a continuous trend of increasing values, with a second abrupt change from 1824 m/s at 446.7 m to 2453 m/s at 447.4 m that marks the change from an unconsolidated sand layer to a thin layer of sandstone (lithostratigraphic Subunits IIB to IIC). Rapid changes in velocities occur below this depth due to changes in lithology, with values ranging between 1760 and 5330 m/s. Below ~600 m, velocities lie in a narrower range and fluctuate between two sets of values, from as low as ~3491 m/s in a sand or silty sandstone layer to 4814 m/s in a grayish sandstone.
Thermal conductivity values show a general increase from ~0.88 W/(m·K) near the seafloor to ~3.60 W/(m·K) at ~662 m (Figure F53). The gradual increase in value at shallow depths is likely due to sediment compaction. A significant decrease in thermal conductivity between 294 and 304 m is associated with a major change from lithostratigraphic Subunits IE–IF to IIA.
Changes in NGR values are associated with the major lithologic boundaries, but there are also significant, well defined fluctuations at a much finer scale (Figure F53). NGR values are low in lithostratigraphic subunits with high calcium carbonate content such as Subunit IC, and values are high in subunits with low carbonate content such as Subunits IIA and IIB. NGR values show some of the strongest fluctuations of all of the physical properties measurements and reflect rapid changes in lithostratigraphic subunits below ~300 m.
Comparison between L* values and lithologic content (Figure F56; see Lithostratigraphy) indicates that low L* values (darker intervals) are well correlated with clay-rich strata, whereas high L* values (lighter intervals) match well with carbonate-rich layers. There is also a close match between NGR and L*; low L* values (dark intervals) correlate with high NGR values and vice-versa because they both reflect the amount of clay minerals.
In Hole U1501C, the highest magnetic susceptibility values are between 25 and 95 m (Figure F53), corresponding to lithostratigraphic Subunits IB and IC, which are dominated by calcite-rich minerals. We suspect that the weak trend representing changes in paramagnetic clay minerals, compared to diamagnetic calcite, is overprinted by the presence of ferromagnetic minerals. One of the prominent peaks in magnetic susceptibility correlates with the ash layer found in the uppermost section of Hole U1501A. In Hole U1501D, extremely high magnetic susceptibility values within lithostratigraphic Subunits IIIA and IIIB correspond to layers of sandstone or sandstone with gravels.
Downhole measurements
Logging operations
After recovering the last RCB core from 644.3 m in Hole U1501D, a wiper trip was made to condition the hole for logging operations and the RCB drill bit was released at the bottom of the hole. The bottom of the drill pipe was raised to logging depth at 2971.8 m drilling depth below rig floor (DRF [I give the scale whether it’s used again or not because some people will know the acronym better]), or 115.1 m below the seafloor (Figure F58). Rig-up for downhole logging started at 0400 h (local time; UTC − 8 h) on 24 April 2017. The modified triple combo tool string started downhole at 0705 h on 24 April. The upward pass of the triple combo run began at 0815 h and ended at 0905 h. Because a section of collapsed hole was identified during the triple combo run, the logging operation ended after completion of the run. Logging tools were rigged down at 1200 h. Heave conditions were less than ~0.2 m for the triple combo run; therefore, the active heave compensator was not used.
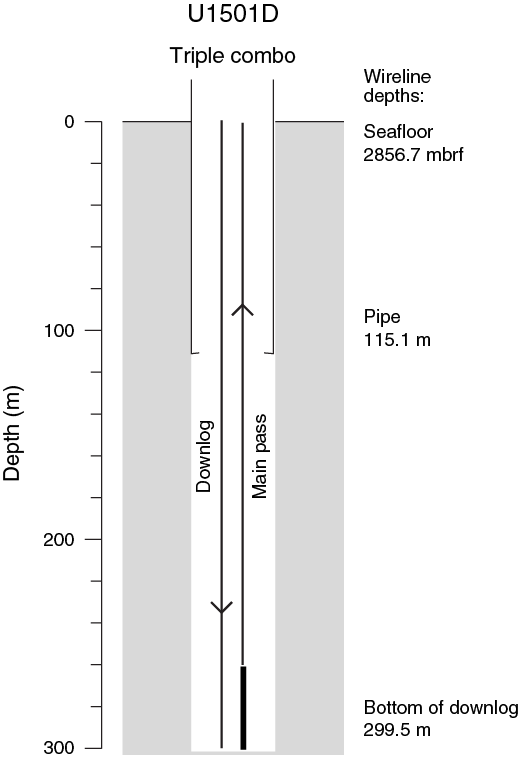
Figure F58. Logging operations summary.
The modified triple combo tool string included the HNGS, HLDS, HRLA, and MSS (Figure F59). The centralized tools were run in the lower part of the tool string so it would be easier to lower the tool string past ledges than with an eccentralized tool (see Downhole measurements in the Expedition 367/368 methods chapter [Sun et al., 2018a]). The tool string encountered difficulty going down at approximately 173.3 m DSF and was unable to pass below 299.3 m DSF. The uphole log pass indicated a collapsed hole at ~156.3 m DSF based on the caliper curve. For safety reasons, no further attempts to descend below that undergauge spot were made. Because the interval of the collapsed hole was located only ~40 m below the bottom of the pipe, the originally planned FMS-sonic tool string was not run.

Figure F59. Triple combo tool string.
Logging units
The triple combo run in Hole U1501D allowed us to define four logging units that are correlated with lithostratigraphic units (see Lithostratigraphy), lithology, and physical properties (see Physical properties ) (Figure F60).
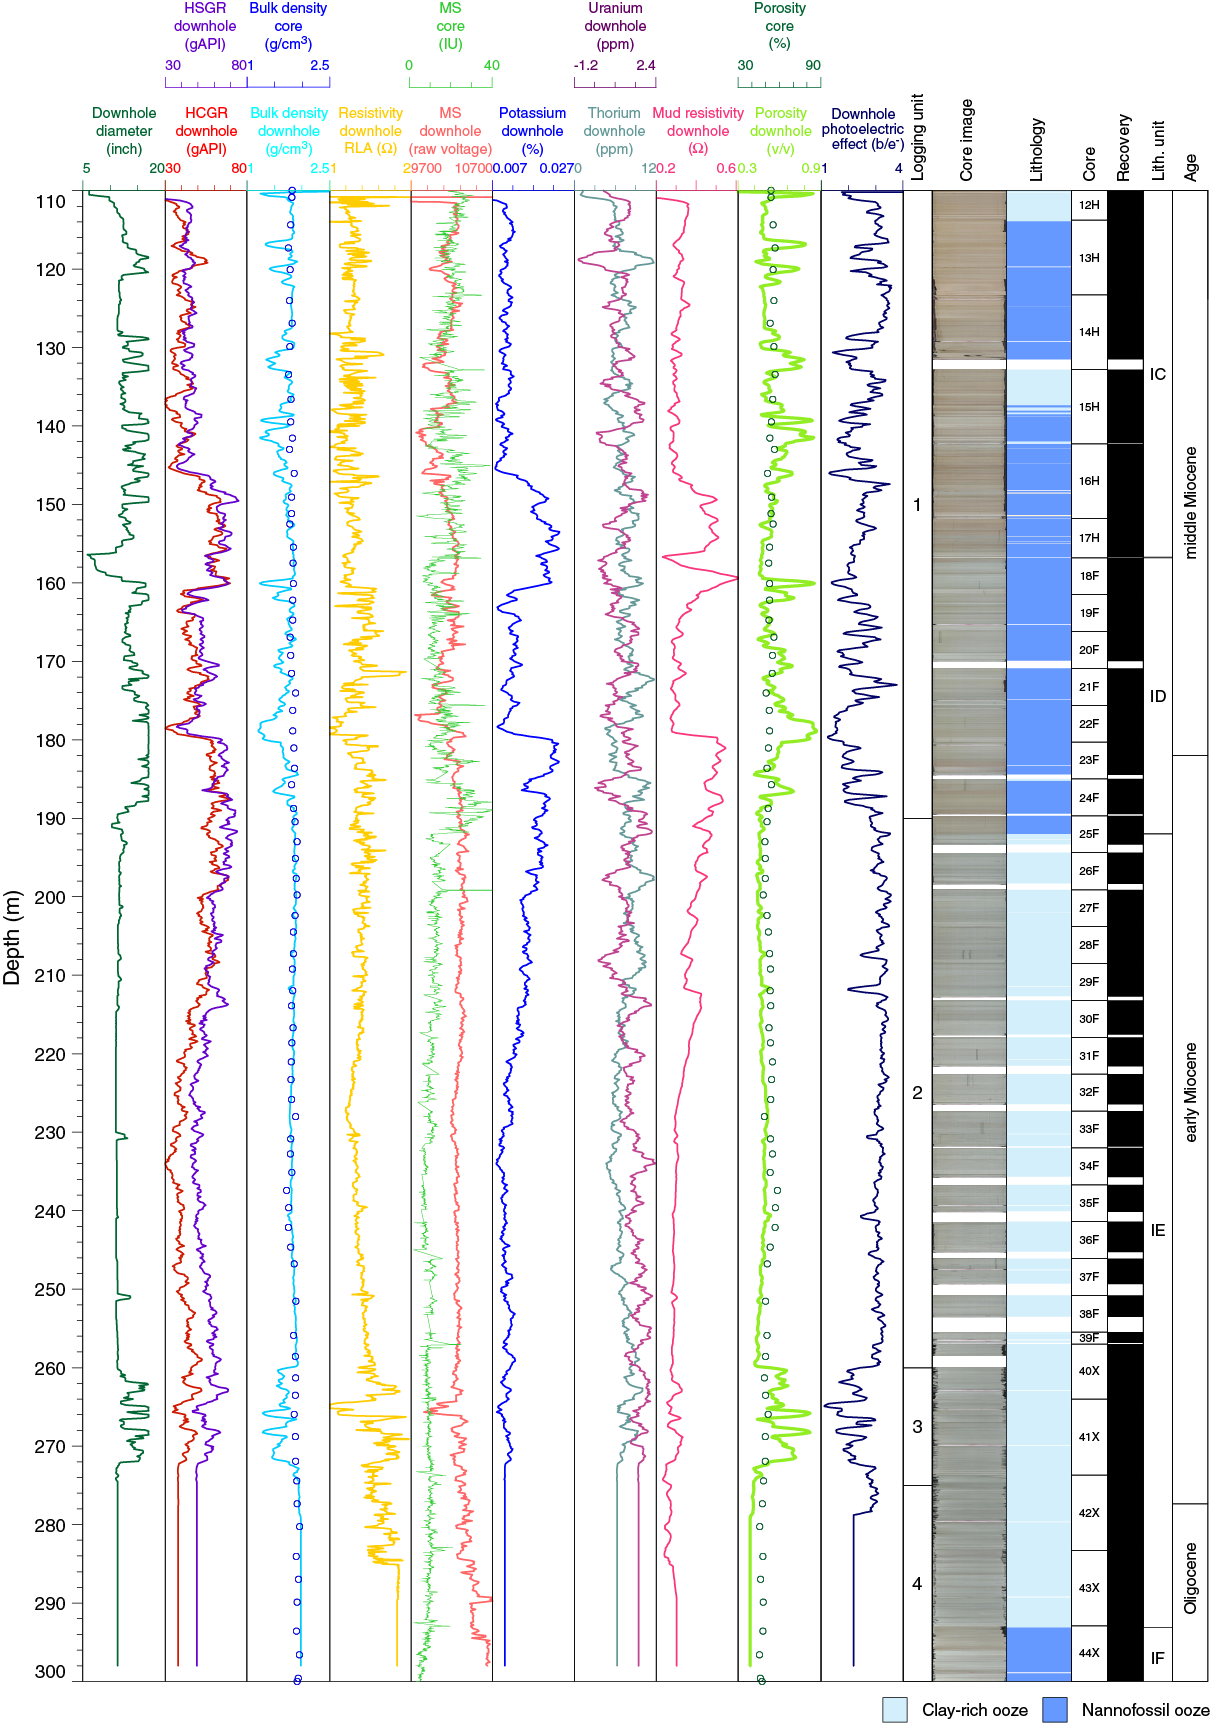
Figure F60. Downhole logs.
Logging Unit 1: base of drill pipe to 190 m WSF
Logging Unit 1 is characterized by relatively high variability in the logs. For example, NGR values vary from ~38 to 70 gAPI. Excursions to lower and higher values also punctuate the magnetic susceptibility log. This logging unit corresponds to lithostratigraphic Subunits IA–ID.
Logging Unit 2: 190–260 m WSF
Logging Unit 2 is characterized by relative homogeneity in the logs, without major excursions to higher or lower log values (e.g., magnetic susceptibility logs). It is also characterized by submeter-scale layering, which is particularly evident in the caliper and resistivity logs. This logging unit corresponds to the lowest part of lithostratigraphic Subunit ID and the upper part of Subunit IE.
Logging Unit 3: 260–275 m WSF
Logging Unit 3 shows relatively high variability in the logs similar to that in logging Unit 1. The NGR, density, and resistivity logs reveal higher amplitude variations than those in logging Unit 2. This logging unit corresponds to lithostratigraphic Subunit IE.
Logging Unit 4: 275–300 m WSF
The upper part of logging Unit 4 (275–285 m WSF) corresponds to a section in the lower part of lithostratigraphic Subunit IE. This logging unit does not exhibit any major excursions, similar to logging Unit 2. Although the bottom of the triple combo string reached 300 m WSF, the sensors did not reach the lower part of logging Unit 4 (285–300 m WSF), which corresponds to parts of lithostratigraphic Subunits IE and IF.
Log data quality and lithology
Log data quality was affected by the large borehole diameter, which exceeded the 17 inch limit of the HLDS caliper arm for about half of the logged interval (Figure F60). Some particularly large caving was inferred at 115–190 and 260–275 m WSF, leading to uncertainty in some of the log values in those intervals. A major thin-bridged (narrow diameter) interval occurred at ~156.3 m WSF.
The downhole logs reflect the lithology at Site U1501. The clay-dominated sediments have high NGR readings because of high concentrations of K and Th in clay minerals, whereas the calcareous sediments have lower NGR and magnetic susceptibility because of a relative lack of radioactive and magnetic minerals. The same NGR and magnetic susceptibility signatures are also seen in the physical property measurements made on cores from Hole U1501C, which enables the downhole logs from Hole U1501D to be correlated to the core data from Hole U1501C.
Contrasts in NGR and magnetic susceptibility can be seen in the logs as a whole. In particular, the calcareous beds can be readily identified in the downhole logs with low NGR. Sand-rich beds can be difficult to identify because they tend to be only partially recovered in the cores and because they become easily washed out in the borehole, resulting in anomalous log data values. In fact, the best indication of sand layers in the logs may be the diameter of the borehole. Such washouts also have very low NGR values.
Downhole temperature and heat flow
Four downhole temperature measurements were conducted in Hole U1501C using the advanced piston corer temperature tool (APCT-3). Temperatures range from 5.5°C at 47.3 m DSF to 12.4°C at 132.8 m DSF, giving a geothermal gradient of 81.4°C/km (Figure F61A). These measurements, together with the seafloor temperature of 1.2°C, indicate that temperatures increase linearly with depth.
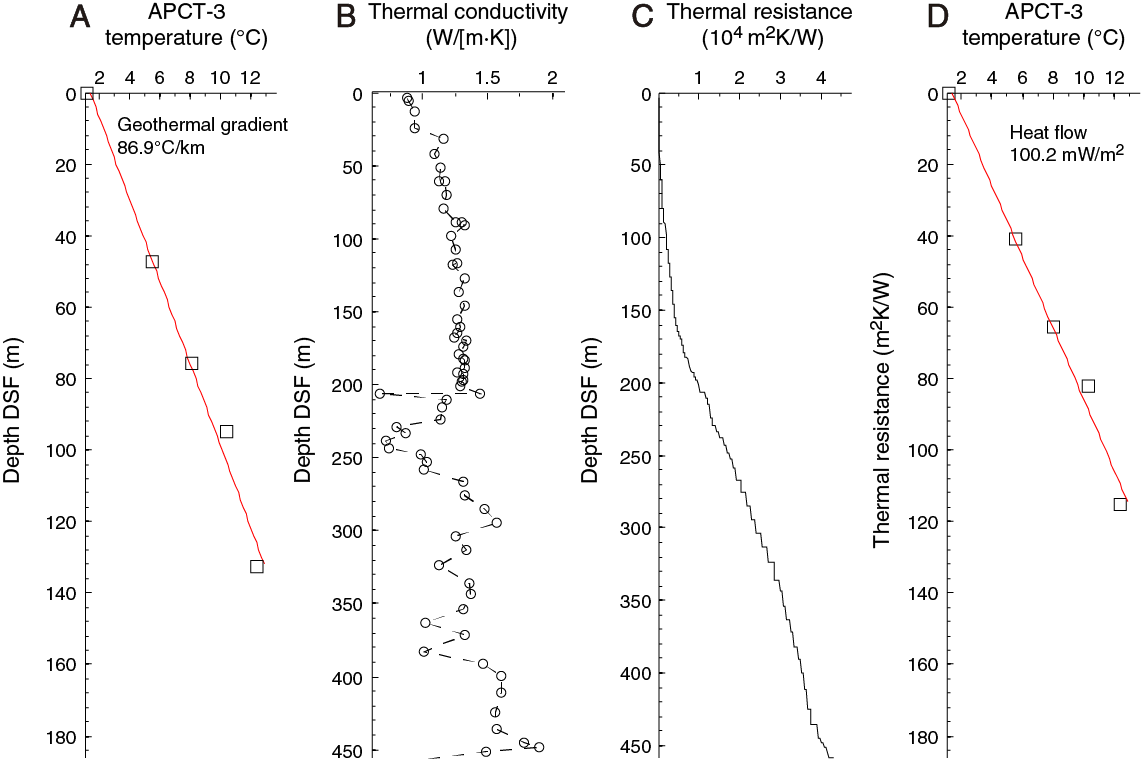
Figure F61. Heat flow calculations.
Thermal conductivity under in situ conditions was estimated from laboratory-determined thermal conductivity from Hole U1501C using the method in Hyndman et al. (1974) (see Physical properties in the Expedition 367/368 methods chapter [Sun et al., 2018a]). Thermal resistance (Figure F61C) was then calculated by integrating the inverse of the in situ thermal conductivity over depth (Figure F61B). A heat flow of 100.1 mW/m2 was obtained from the linear fit between temperature and thermal resistance (Figure F61D) (Pribnow et al., 2000). The geothermal gradient and heat flow at Site U1501 are comparable to the relatively high values observed in some ODP, Integrated Ocean Drilling Program, and IODP sites in this part of the SCS, including Sites U1432 (100.1 mW/m2) and U1499 (114 mW/m2). Together, these sites show that parts of the northern SCS margin have relatively high heat flow values (Li et al., 2010).
Correlation to seismic data
We conducted two sets of analyses to correlate core measurements to the time-based seismic data at Site U1501. First, we analyzed core data and made a direct comparison with the seismic reflection profile. Second, we constructed synthetic seismograms using the Site U1501 core data and compared the results with the traces in seismic profiles. Preliminary calculations were done during the expedition using a combination of Matlab scripts and Petrel software.
Velocity and density data and comparison with seismic reflectors
Whole-round core measurements, including P-wave velocity (PWL) and GRA density, were conducted from 0 to 457.7 m in Hole U1501C and from 433.5 to 643.5 m in Hole U1501D (Figure F62). P-wave velocity was also measured along the x-axis with the PWC system on working-half sections. MAD measurements were performed on discrete samples, one every other section. In addition, HLDS density measurements were obtained from downhole logging in Hole U1501D from 115 to 300 m (see Physical properties and Downhole measurements). After outliers were cleaned, the whole-round PWL data are in good agreement with the PWC velocities of core samples. The HLDS density values from downhole logging are also in good agreement with MAD data for intervals away from borehole enlargements (Figure F60).
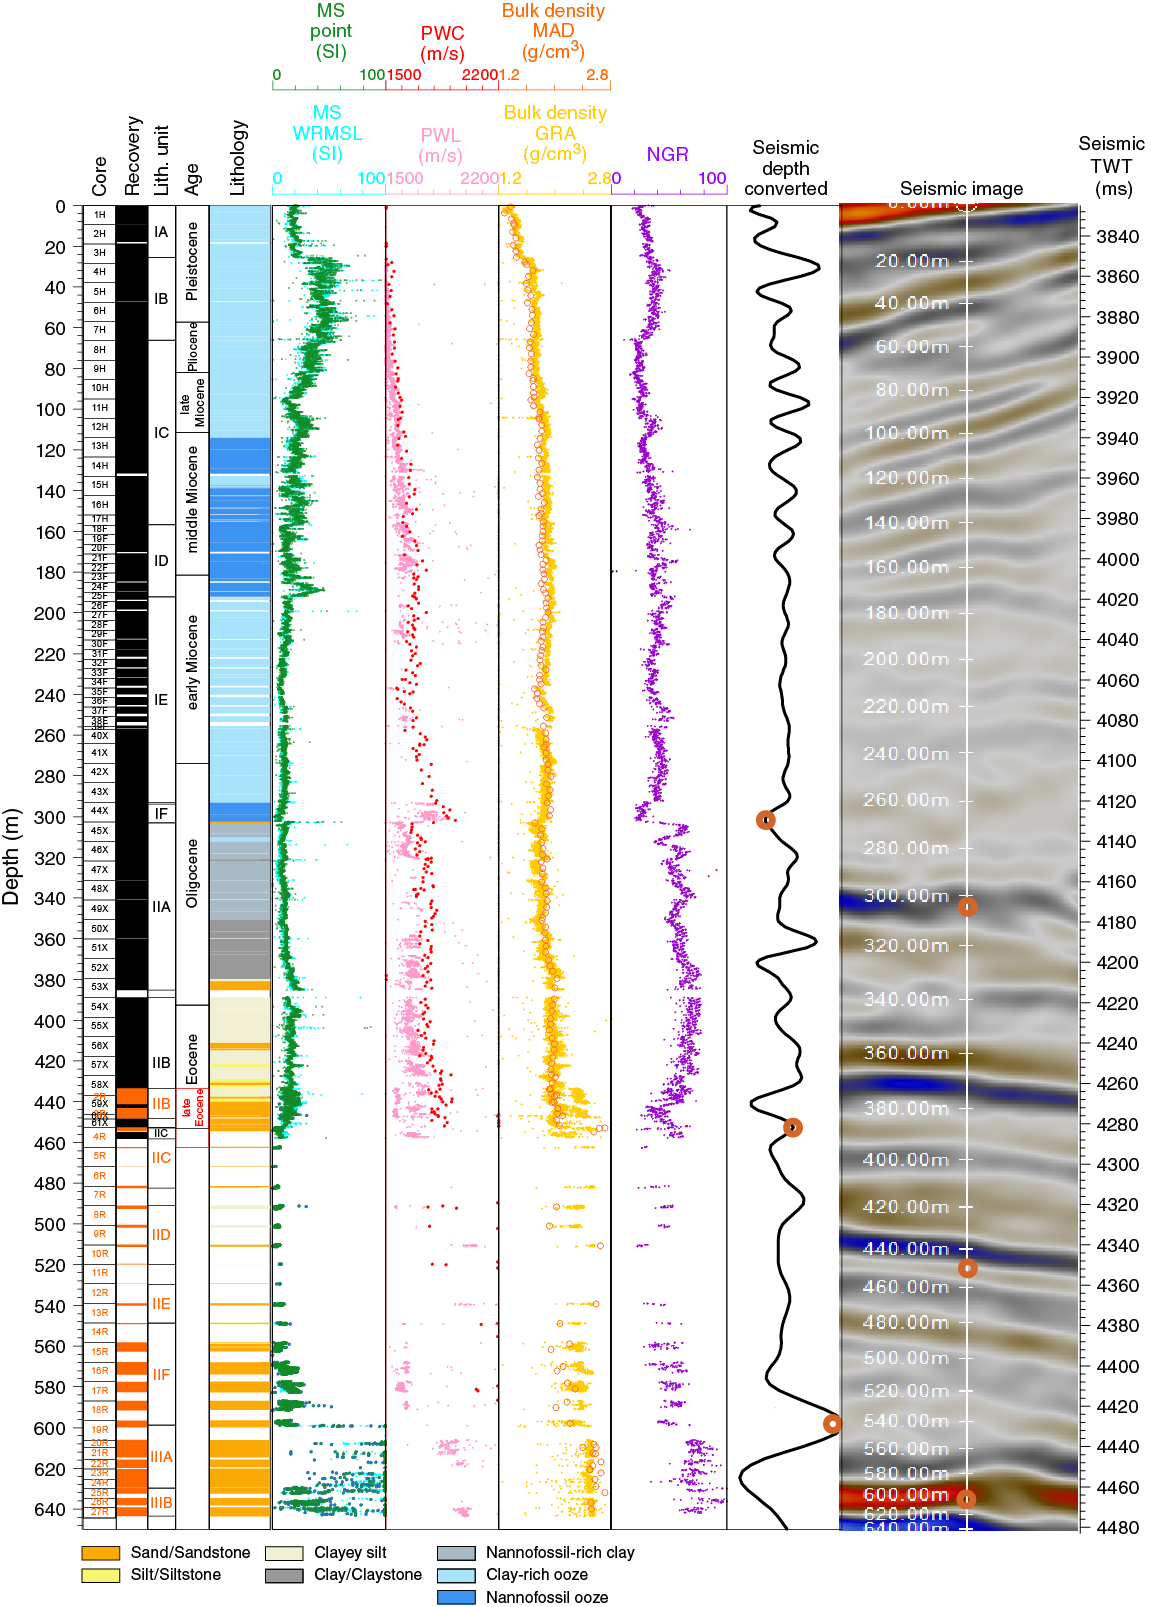
Figure F62. Physical properties compared with seismic waveform.
Seismic velocity and density show significant variations in quality with depth, affecting calculations of TWT and synthetic seismograms. From 0 to ~450 m, PWC velocity is of excellent quality. From ~450 to ~608 m, PWC velocity is highly scattered. From ~608 to ~643.5 m, the number of PWC measurements is very limited, whereas the PWL data provide some constraints. For the density data, both the whole-round and discrete sample measurements provide excellent constraints in the 0–450 and 608–643.5 m intervals, respectively. However, data recovery is poor at 450–608 m (Figure F62).
Site U1501 core measurements show distinct changes in physical properties and lithology in a number of depth intervals (see Physical properties). In general, these intervals correlate well with the depth intervals of strong amplitudes in the seismic reflection profile (Figure F62). Intervals with increasing velocity and density with depth often correlate with strong positive amplitudes in the seismic reflection profile, whereas decreases correspond to negative amplitudes. Such correlations are especially clear between the velocity and density profiles and the depth-converted seismic trace at Site U1501.
Time-depth relationship
The PWC velocity measurements from Holes U1501C and U1501D were used to calculate the time-depth relationship (TDR) model of seismic waves. We first calculated a preliminary model of TDR that best fits the observed PWC velocity data, called “U1501_Preliminary_Model” (Figure F63). This model was calculated using data for the 0–450 m interval only, where PWC data are available. For the 450–608 m interval, the highly scattered PWC data do not provide reliable constraints on the TDR models.

Figure F63. TDR curves.
At least three depth intervals at Site U1501 are associated with major changes in velocity and/or density and are assigned as reference points for correlation with the seismic reflection profile. The three depth intervals of the most prominent changes are at ~303 m (RP1), ~450 m (RP2), and ~600 m (RP3). RP1 and RP3 also correlate with the seismic sequence T60 boundary and with the seismic Tg reflector, respectively. These reference points are readily recognized in the drill core, lending further support to our models. With the additional constraints from these reference points and fitting the TDR using a polynomial function with depth, we constructed a new TDR model for Site U1501 called “U1501_modified_model” (Figure F63). The modified TDR model with constraints of the three reference points is, in general, in line with the preliminary TDR model.
We also compared our TDR models of Site U1501 with those of Sites 1148 (Shipboard Scientific Party, 2000), U1431 (Li et al., 2015b), U1499, and U1500 (see the Site U1499 and Site U1500 chapters [Sun et al., 2018b; Stock et al., 2018]). Our calculated TDR models for Site U1501 show substantial agreement with the TDR models of most of these drill sites, especially with the model of Site 1148 (Figure F64).

Figure F64. Modeled TDR curves.
Using the best-fitting TDR model (U1501_modified_model), we were able to convert depth scale to timescale for all core measurements. Such conversion enabled us to display the core measurements directly on top of the time-based seismic sections, facilitating identification of correlated features, as illustrated in the example in Figure F65.

Figure F65. Seismic section and synthetic seismogram.
Synthetic seismograms
To further illustrate the relationship between the core measurements at Site U1501 and the seismic reflection profile, the Seismic interpretation module in Petrel was used to compute synthetic seismograms based on the relevant core measurements. Synthetic traces were generated by convolving the reflectivity from the density of core samples and the smoothed velocities from the PWC together with the source wavelet that best fits the seismic data (Ricker 2_30 Hz; Figure F66).
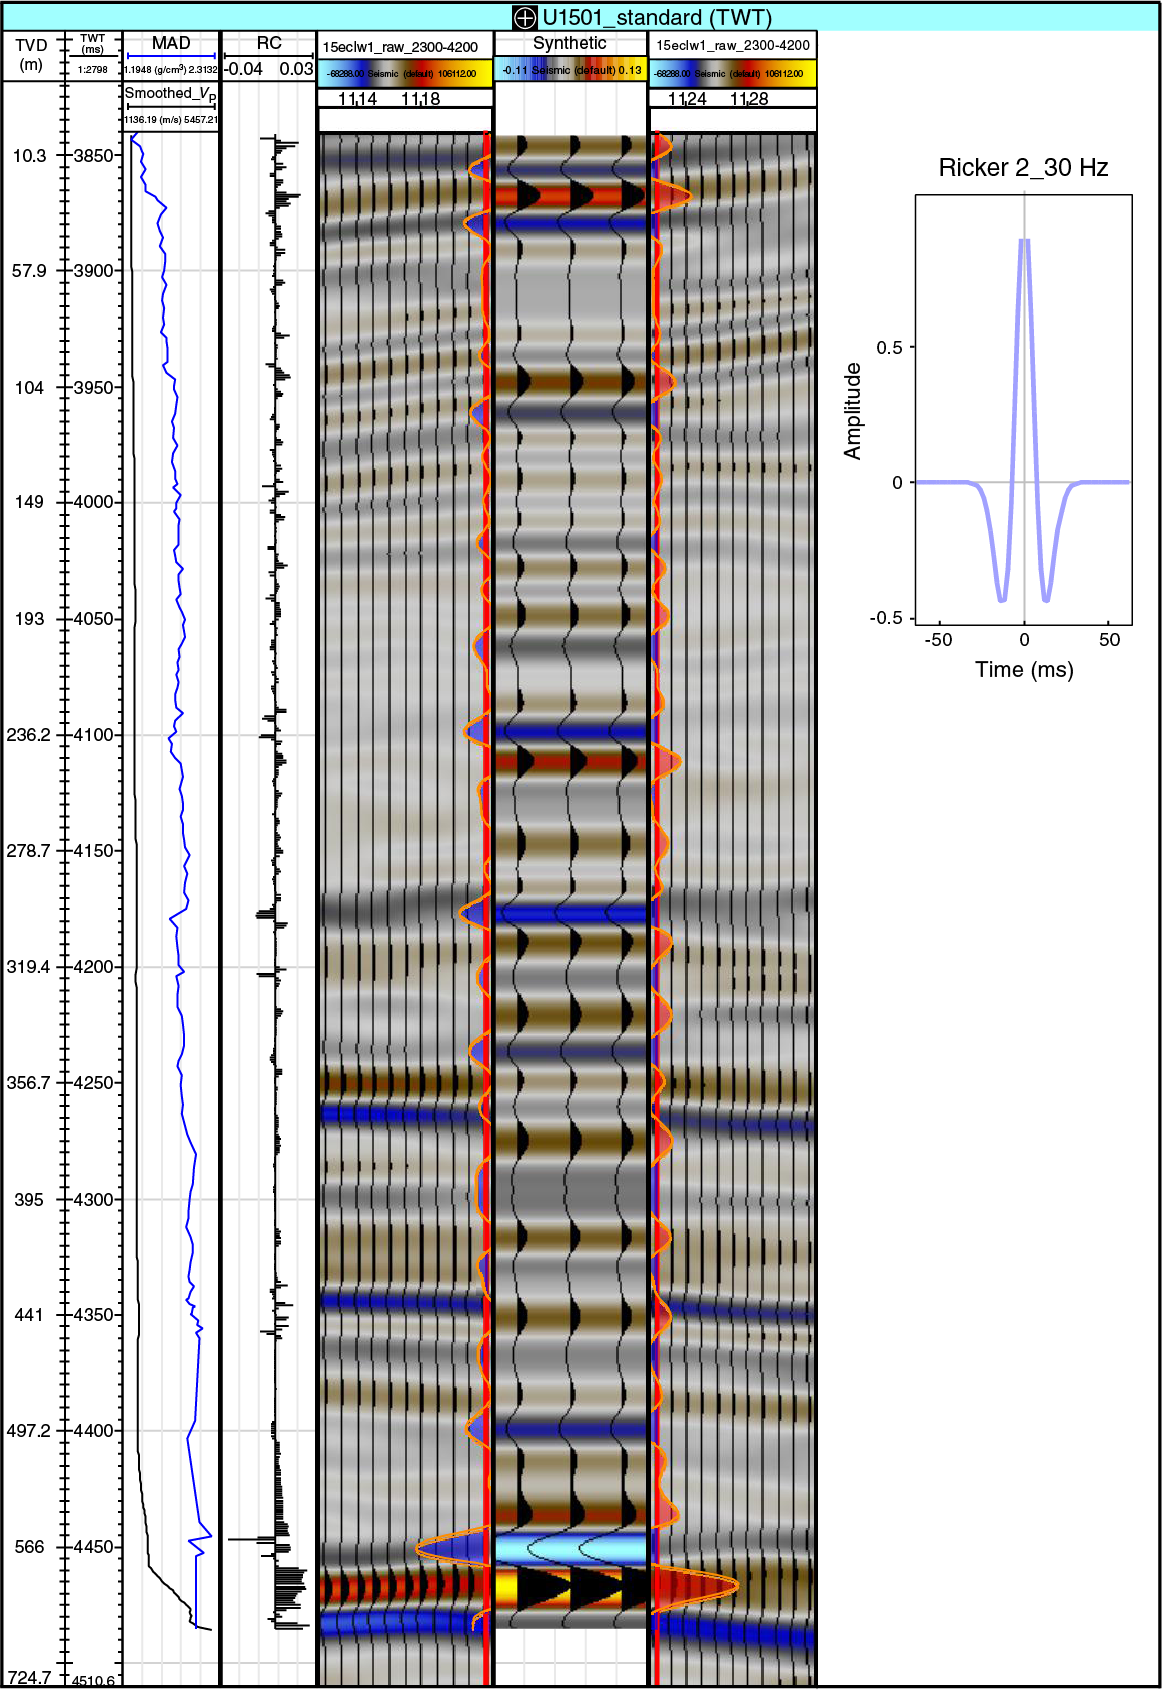
Figure F66. Synthetic seismogram.
Seismic impedance (SI) of a rock layer is the product of its average seismic velocity (VP) and density (ρ) (i.e., SI = VP × ρ). The seismic reflection coefficient (RC), in turns, measures the change in the seismic impedance between two adjacent rock layers. Thus, we can expect greater amplitudes in the modeled seismogram for rock layers with larger RC values. The resulting synthetic seismogram shows strong reflectors at several depth intervals, including ~303 and 600 m, that are consistent with the observed seismic unconformities. The transition between lithostratigraphic Units II and III at 600 m, for instance, is marked by a sharp increase in density and velocity; the net result is a strong positive increase in impedance (Figure F66).
References
Alabi, O.O., Edilbi, A.N.F., Brolly, C., Muirhead, D., Parnell, J., Stacey, R., and Bowden, S.A., 2015. Asphaltene detection using surface enhanced Raman scattering (SERS). Chemical Communications, 51(33):7152–7155. http://pubs.rsc.org/en/content/articlehtml/2015/cc/c5cc00676g
Barnes, R.O., and Goldberg, E.D., 1976. Methane production and consumption in anoxic marine sediments. Geology, 4(5):297–300. https://doi.org/10.1130/0091-7613(1976)4<297:MPACIA>2.0.CO;2
Berner, R.A., and Raiswell, R., 1984. C/S method for distinguishing freshwater from marine sedimentary rocks. Geology, 12(6):365–368. https://doi.org/10.1130/0091-7613(1984)12<365:CMFDFF>2.0.CO;2
Briais, A., Patriat, P., and Tapponnier, P., 1993. Updated interpretation of magnetic anomalies and seafloor spreading stages in the South China Sea: implications for the Tertiary tectonics of Southeast Asia. Journal of Geophysical Research: Solid Earth, 98(B4):6299–6328. https://doi.org/10.1029/92JB02280
Clift, P.D., Wan, S., and Blusztajn, J., 2014. Reconstructing chemical weathering, physical erosion and monsoon intensity since 25 Ma in the northern South China Sea: a review of competing proxies. Earth-Science Reviews, 130:86–102. https://doi.org/10.1016/j.earscirev.2014.01.002
Dai, Y., Yu, Q., Li, H., Wang, Z., Bai, J., and Peng, H., 2015. Threshold conditions and reservoir-controlling characteristics of source kitchen in Zhu I depression, Pearl River Mouth Basin. Acta Petrolei Sinica, 36(S2):145–155. (in Chinese with English abstract) https://doi.org/10.7623/syxb2015S2013
De Vleeschouwer, D., Dunlea, A.G., Auer, G., Anderson, C.H., Brumsack, H., de Loach, A., Gurnis, M., et al., 2017. Quantifying K, U, and Th contents of marine sediments using shipboard natural gamma radiation spectra measured on DV JOIDES Resolution. Geochemistry, Geophysics, Geosystems, 18(3):1053–1064. https://doi.org/10.1002/2016GC006715
Demaison, G.J., and Moore, G.T., 1980. Anoxic environments and oil source bed genesis. AAPG Bulletin, 64:1179–1209.
Drzewiecki, P.A., and Simó, J.A., 2002. Depositional processes, triggering mechanisms and sediment composition of carbonate gravity flow deposits: examples from the Late Cretaceous of the south-central Pyrenees, Spain. Sedimentary Geology, 146(1–2):155–189. https://doi.org/10.1016/S0037-0738(01)00171-3
Exon, N.F., Kennett, J.P., Malone, M.J., Brinkhuis, H., Chaproniere, G., Ennyo, A., Fothergill, P., et al., 2002. Drilling reveals climatic consequences of Tasmanian Gateway opening. Eos, Transactions of the American Geophysical Union, 83(23):253–259. https://doi.org/10.1029/2002EO000176
Hanai, T., 1957. Studies on the Ostracoda from Japan: 3. Subfamilies Cytherurinae G.W. Müller (emend. G.O. Sars, 1925) and Cytheropterinae n. subfam. Journal of the Faculty of Science, University of Tokyo, Section 2, 11:11–36.
Harris, L.C., and Whiting, B.M., 2000. Sequence-stratigraphic significance of Miocene to Pliocene glauconite-rich layers, on- and offshore of the US Mid-Atlantic margin. Sedimentary Geology, 134(1–2):129–147. https://doi.org/10.1016/S0037-0738(00)00017-8
Hedges, J.I., Clark, W.A., and Come, G.L., 1988. Organic matter sources to the water column and surficial sediments of a marine bay. Limnology and Oceanography, 33(5):1116–1136. https://doi.org/10.4319/lo.1988.33.5.1116
Horng, C.-S., Torii, M., Shea, K.-S., and Kao, S.-J., 1998. Inconsistent magnetic polarities between greigite- and pyrrhotite/magnetite-bearing marine sediments from the Tsailiao-chi section, southwestern Taiwan. Earth and Planetary Science Letters, 164(3–4):467–481. https://doi.org/10.1016/S0012-821X(98)00239-8
Hyndman, R.D., Erickson, A.J., and Von Herzen, R.P., 1974. Geothermal measurements on DSDP Leg 26. In Davies, T.A., Luyendyk, B.P., et al., Initial Reports of the Deep Sea Drilling Project, 26: Washington, DC (U.S. Govt. Printing Office), 451–463. https://doi.org/10.2973/dsdp.proc.26.113.1974
Kirschvink, J.L., 1980. The least-squares line and plane and the analysis of palaeomagnetic data. Geophysical Journal of the Royal Astronomical Society, 62(3):699–718. https://doi.org/10.1111/j.1365-246X.1980.tb02601.x
Krs, M., Novák, F., Krsová, M., Pruner, P., Kouklíková, L., and Jansa, J., 1992. Magnetic properties and metastability of greigite-smythite mineralization in brown-coal basins of the Krušné hory Piedmont, Bohemia. Physics of the Earth and Planetary Interiors, 70(3–4):273–287. https://doi.org/10.1016/0031-9201(92)90194-Z
Li, C.-F., Li, J., Ding, W., Franke, D., Yao, Y., Shi, H., Pang, X., et al., 2015a. Seismic stratigraphy of the central South China Sea basin and implications for neotectonics. Journal of Geophysical Research: Solid Earth, 120(3):1377–1399. https://doi.org/10.1002/2014JB011686
Li, C.-F., Lin, J., Kulhanek, D.K., Williams, T., Bao, R., Briais, A., Brown, E.A., Chen, Y., Clift, P.D., Colwell, F.S., Dadd, K.A., Ding, W., Hernández-Almeida, I., Huang, X.-L., Hyun, S., Jiang, T., Koppers, A.A.P., Li, Q., Liu, C., Liu, Q., Liu, Z., Nagai, R.H., Peleo-Alampay, A., Su, X., Sun, Z., Tejada, M.L.G., Trinh, H.S., Yeh, Y.-C., Zhang, C., Zhang, F., Zhang, G.-L., and Zhao, X., 2015b. Site U1431. In Li, C.-F., Lin, J., Kulhanek, D.K., and the Expedition 349 Scientists, South China Sea Tectonics. Proceedings of the International Ocean Discovery Program, 349: College Station, TX (International Ocean Discovery Program). http://dx.doi.org/10.14379/iodp.proc.349.103.2015
Li, C.-F., Shi, X., Zhou, Z., Li, J., Geng, J., and Chen, B., 2010. Depths to the magnetic layer bottom in the South China Sea area and their tectonic implications. Geophysical Journal International, 182(3):1229–1247. https://doi.org/10.1111/j.1365-246X.2010.04702.x
Li, C.-F., Zhou, Z., Li, J., Chen, B., and Geng, J., 2008. Magnetic zoning and seismic structure of the South China Sea ocean basin. Marine Geophysical Research, 29(4):223–238. https://doi.org/10.1007/s11001-008-9059-4
Li, Q., Zheng, H., Zhong, G., and Wang, P., 2005. Tectonic events indicated by late Oligocene slumped deposits from the South China Sea. Earth Science-Journal of China University of Geosciences, 30:19–24. http://en.cnki.com.cn/Article_en/CJFDTOTAL-DQKX200501001.html
Li, Y.-P., and Jiang, S.Y., 2010. Boron concentration and isotopic constraints on processes affecting the chemistry of interstitial water in normal- and over-pressured basins, Gulf of Mexico. Marine Geology, 275(1–4):230–243. https://doi.org/10.1016/j.margeo.2010.06.004
Liu, J., Shi, X., Liu, Q., Ge, S., Liu, Y., Yao, Z., Zhao, Q., et al., 2014. Magnetostratigraphy of a greigite-bearing core from the South Yellow Sea: implications for remagnetization and sedimentation. Journal of Geophysical Research: Solid Earth, 119(10):7425–7441. https://doi.org/10.1002/2014JB011206
Lurcock, P.C., and Wilson, G.S., 2012. PuffinPlot: a versatile, user-friendly program for paleomagnetic analysis. Geochemistry, Geophysics, Geosystems, 13(6):Q06Z45. https://doi.org/10.1029/2012GC004098
Margielewski, W., Jankowski, L., Krapiec, M., Garecka, M., Hałas, S., and Urban, J., 2017. Analysis of reworked sediments as a basis of the Palaeogene-Neogene palaeogeography reinterpretation: case study of the Roztocze region (SE Poland). Sedimentary Geology, 352:14–29. https://doi.org/10.1016/j.sedgeo.2017.02.009
McRae, S.G., 1972. Glauconite. Earth-Science Reviews, 8(4):397–440. https://doi.org/10.1016/0012-8252(72)90063-3
Nanni, U., Pubellier, M., Sang Chan, L., and Sewell, R.J., 2017. Rifting and reactivation of a Cretaceous structural belt at the northern margin of the South China Sea. Journal of Asian Earth Sciences, 136:110–123. https://doi.org/10.1016/j.jseaes.2017.01.008
Ogg, J.G., Ogg, G., and Gradstein, F.M., 2016. A Concise Geologic Time Scale 2016: Boston (Elsevier).
Pang, X., Chen, C.M., Peng, D.J., Zhu, M., Shu, Y., He, M., Shen, J., and Liu, B., 2007. Sequence stratigraphy of deep-water fan system of Pearl River, South China Sea. Earth Science Frontiers, 14(1):220–229. (in Chinese with English abstract) https://doi.org/10.1016/S1872-5791(07)60010-4
Pasteris, J.D., and Wopenka, B., 2003. Necessary, but not sufficient: Raman identification of disordered carbon as a signature of ancient life. Astrobiology, 3(4):727–738. https://www.ncbi.nlm.nih.gov/pubmed/14987478
Pribnow, D., Kinoshita, M., and Stein, C., 2000. Thermal Data Collection and Heat Flow Recalculations for Ocean Drilling Program Legs 101–180: Hanover, Germany (Institute for Joint Geoscientific Research, Institut für Geowissenschaftliche Gemeinschaftsaufgaben [GGA]). http://www-odp.tamu.edu/publications/heatflow/ODPReprt.pdf
Roberts, A.P., 1995. Magnetic properties of sedimentary greigite (Fe3S4). Earth and Planetary Science Letters, 134(3–4):227–236. https://doi.org/10.1016/0012-821X(95)00131-U
Roberts, A.P., Chang, L., Rowan, C.J., Horng, C.-S., and Florindo, F., 2011. Magnetic properties of sedimentary greigite (Fe3S4): an update. Reviews of Geophysics, 49(1):RG1002. https://doi.org/10.1029/2010RG000336
Russell, W.L., 1944. The total gamma ray activity of sedimentary rocks as indicated by Geiger counter determinations. Geophysics, 9(2):180–216. https://doi.org/10.1190/1.1445076
Shao, L., Cao, L., Pang, X., Jiang, T., Qiao, P., and Zhao, M., 2016. Detrital zircon provenance of the Paleogene syn-rift sediments in the northern South China Sea. Geochemistry, Geophysics, Geosystems, 17(2):255–269. https://doi.org/10.1002/2015GC006113
Shi, H., He, M., and Zhang, L., 2014. Hydrocarbon geology, accumulation pattern and the next exploration strategy in the eastern Pearl River Mouth basin. China Offshore Oil and Gas, 26(3):11–22. (in Chinese with English abstracts)
Shipboard Scientific Party, 2000. Site 1148. In Wang, P., Prell, W.L., Blum, P., et al., Proceedings of the Ocean Drilling Program, Initial Reports, 184: College Station, TX (Ocean Drilling Program), 1–122. https://doi.org/10.2973/odp.proc.ir.184.109.2000
Snowball, I.F., 1991. Magnetic hysteresis properties of greigite (Fe3S4) and a new occurrence in Holocene sediments from Swedish Lappland. Physics of the Earth and Planetary Interiors, 68(1–2):32–40. https://doi.org/10.1016/0031-9201(91)90004-2
Stock, J.M., Sun, Z., Klaus, A., Larsen, H.C., Jian, Z., Alvarez Zarikian, C.A., Boaga, J., Bowden, S.A., Briais, A., Chen, Y., Cukur, D., Dadd, K.A., Ding, W., Dorais, M.J., Ferré, E.C., Ferreira, F., Furusawa, A., Gewecke, A.J., Hinojosa, J.L., Höfig, T.W., Hsiung, K.-H., Huang, B., Huang, E., Huang, X.-L., Jiang, S., Jin, H., Johnson, B.G., Kurzawski, R.M., Lei, C., Li, B., Li, L., Li, Y., Lin, J., Liu, C., Liu, Z., Luna, A., Lupi, C., McCarthy, A.J., Mohn, G., Ningthoujam, L.S., Nirrengarten, M., Osono, N., Peate, D.W., Persaud, P., Qui, N., Robinson, C.M., Satolli, S., Sauermilch, I., Schindlbeck, J.C., Skinner, S.M., Straub, S.M., Su, X., Tian, L., van der Zwan, F.M., Wan, S., Wu, H., Xiang, R., Yadav, R., Yi, L., Zhang, C., Zhang, J., Zhang, Y., Zhao, N., Zhong, G., and Zhong, L., 2018. Site U1500. In Sun, Z., Jian, Z. Stock, J.M., Larsen, H.C., Klaus, A., Alvarez Zarikian, C.A., and the Expedition 367/368 Scientists, 2018. South China Sea Rifted Margin. Proceedings of the International Ocean Discovery Program, 367/368: College Station, TX (International Ocean Discovery Program). https://doi.org/10.14379/iodp.proc.367368.104.2018
Sun, Z., Jian, Z., Stock, J.M., Larsen, H.C., Klaus, A., Alvarez Zarikian, C.A., Boaga, J., Bowden, S.A., Briais, A., Chen, Y., Cukur, D., Dadd, K.A., Ding, W., Dorais, M.J., Ferré, E.C., Ferreira, F., Furusawa, A., Gewecke, A.J., Hinojosa, J.L., Höfig, T.W., Hsiung, K.-H., Huang, B., Huang, E., Huang, X.-L., Jiang, S., Jin, H., Johnson, B.G., Kurzawski, R.M., Lei, C., Li, B., Li, L., Li, Y., Lin, J., Liu, C., Liu, C., Liu, Z., Luna, A., Lupi, C., McCarthy, A.J., Mohn, G., Ningthoujam, L.S., Nirrengarten, M., Osono, N., Peate, D.W., Persaud, P., Qui, N., Robinson, C.M., Satolli, S., Sauermilch, I., Schindlbeck, J.C., Skinner, S.M., Straub, S.M., Su, X., Tian, L., van der Zwan, F.M., Wan, S., Wu, H., Xiang, R., Yadav, R., Yi, L., Zhang, C., Zhang, J., Zhang, Y., Zhao, N., Zhong, G., and Zhong, L., 2018a. Expedition 367/368 methods. In Sun, Z., Jian, Z., Stock, J.M., Larsen, H.C., Klaus, A., Alvarez Zarikian, C.A., and the Expedition 367/368 Scientists, South China Sea Rifted Margin. Proceedings of the International Ocean Discovery Program, 367/368: College Station, TX (International Ocean Discovery Program). https://doi.org/10.14379/iodp.proc.367368.102.2018
Sun, Z., Stock, J.M., Klaus, A., Larsen, H.C., Jian, Z., Alvarez Zarikian, C.A., Boaga, J., Bowden, S.A., Briais, A., Chen, Y., Cukur, D., Dadd, K.A., Ding, W., Dorais, M.J., Ferré, E.C., Ferreira, F., Furusawa, A., Gewecke, A.J., Hinojosa, J.L., Höfig, T.W., Hsiung, K.-H., Huang, B., Huang, E., Huang, X.-L., Jiang, S., Jin, H., Johnson, B.G., Kurzawski, R.M., Lei, C., Li, B., Li, L., Li, Y., Lin, J., Liu, C., Liu, C., Liu, Z., Luna, A., Lupi, C., McCarthy, A.J., Mohn, G., Ningthoujam, L.S., Nirrengarten, M., Osono, N., Peate, D.W., Persaud, P., Qui, N., Robinson, C.M., Satolli, S., Sauermilch, I., Schindlbeck, J.C., Skinner, S.M., Straub, S.M., Su, X., Tian, L., van der Zwan, F.M., Wan, S., Wu, H., Xiang, R., Yadav, R., Yi, L., Zhang, C., Zhang, J., Zhang, Y., Zhao, N., Zhong, G., and Zhong, L., 2018b. Site U1499. In Sun, Z., Jian, Z., Stock, J.M., Larsen, H.C., Klaus, A., Alvarez Zarikian, C.A., and the Expedition 367/368 Scientists, South China Sea Rifted Margin. Proceedings of the International Ocean Discovery Program, 367/368: College Station, TX (International Ocean Discovery Program). https://doi.org/10.14379/iodp.proc.367368.103.2018
Suttill, H.L., 2009. Sedimentological evolution of the Emine and Kamchia Basins, eastern Bulgaria [Ph.D. thesis]. University of Edinburgh. https://www.era.lib.ed.ac.uk/handle/1842/4919
Suttner, L.J., Basu, A., and Mack, G.H., 1981. Climate and the origin of quartz arenites. Journal of Sedimentary Research, 51(4):1235–1246. https://doi.org/10.1306/212F7E73-2B24-11D7-8648000102C1865D
Tauxe, L., 2010. Essentials of Paleomagnetism: Berkeley, California (University of California Press).
Torres, M.E., Brumsack, H.-J., Bohrmann, G., and Emeis, K.C., 1996. Barite fronts in continental margin sediments: a new look at barium remobilization in the zone of sulfate reduction and formation of heavy barites in diagenetic fronts. Chemical Geology, 127(1–3):125–139. https://doi.org/10.1016/0009-2541(95)00090-9
Wigley, R., and Compton, J.S., 2007. Oligocene to Holocene glauconite–phosphorite grains from the head of the Cape Canyon on the western margin of South Africa. Deep-Sea Research Part II: Topical Studies in Oceanography, 54(11–13):1375–1395. https://doi.org/10.1016/j.dsr2.2007.04.004
Wilson, R., Monaghan, P., Bowden, S.A., Parnell, P., and Cooper, J.M., 2007. Surface-enhanced Raman signatures of pigmentation of cyanobacteria from within geological samples in a spectroscopic-microfluidic flow cell. Analytical Chemistry, 79(18):7036–7041. https://doi.org/10.1021/ac070994c
Yan, P., Zhou, D., and Liu, Z., 2001. A crustal structure profile across the northern continental margin of the South China Sea. Tectonophysics, 338(1):1–21. https://doi.org/10.1016/S0040-1951(01)00062-2
Yao, B., Zeng, W., Chen, Y., and Zhang, X., 1994. The crustal structure in the eastern part of the northern margin of the South China Sea. Acta Geophysica Sinica, 37:27–35.
Zhou, D., Ru, K., and Chen, H., 1995. Kinematics of Cenozoic extension on the South China Sea continental margin and its implications for the tectonic evolution of the region. Tectonophysics, 251(1–4):161–177. https://doi.org/10.1016/0040-1951(95)00018-6
Zhou, D., Wang, W., Wang, J., Pang, X., Cai, D., and Sun, Z., 2006. Mesozoic subduction-accretion zone in northeastern South China Sea inferred from geophysical interpretations. Science in China, Series D: Earth Sciences, 49(5):471–482. https://doi.org/10.1007/s11430-006-0471-9
Zijderveld, J.D.A., 1967. AC demagnetization of rocks: analysis of results. In Collinson, D.W., Creer, K.M., and Runcorn, S.K. (Eds.), Developments in Solid Earth Geophysics (Volume 3): Methods in Palaeomagnetism: Amsterdam (Elsevier), 254–286. https://doi.org/10.1016/B978-1-4832-2894-5.50049-5
1 Larsen, H.C., Jian, Z., Alvarez Zarikian, C.A., Sun, Z., Stock, J.M., Klaus, A., Boaga, J., Bowden, S.A., Briais, A., Chen, Y., Cukur, D., Dadd, K.A., Ding, W., Dorais, M.J., Ferré, E.C., Ferreira, F., Furusawa, A., Gewecke, A.J., Hinojosa, J.L., Höfig, T.W., Hsiung, K.-H., Huang, B., Huang, E., Huang, X.-L., Jiang, S., Jin, H., Johnson, B.G., Kurzawski, R.M., Lei, C., Li, B., Li, L., Li, Y., Lin, J., Liu, C., Liu, C., Liu, Z., Luna, A., Lupi, C., McCarthy, A.J., Mohn, G., Ningthoujam, L.S., Nirrengarten, M., Osono, N., Peate, D.W., Persaud, P., Qui, N., Robinson, C.M., Satolli, S., Sauermilch, I., Schindlbeck, J.C., Skinner, S.M., Straub, S.M., Su, X., Tian, L., van der Zwan, F.M., Wan, S., Wu, H., Xiang, R., Yadav, R., Yi, L., Zhang, C., Zhang, J., Zhang, Y., Zhao, N., Zhong, G., and Zhong, L., 2018. Site U1501. In Sun, Z., Jian, Z., Stock, J.M., Larsen, H.C., Klaus, A., Alvarez Zarikian, C.A., and the Expedition 367/368 Scientists, South China Sea Rifted Margin. Proceedings of the International Ocean Discovery Program, 367/368: College Station, TX (International Ocean Discovery Program). https://doi.org/10.14379/iodp.proc.367368.105.2018
2 Expedition 367/368 Scientists’ addresses.
This work is distributed under the Creative Commons Attribution 4.0 International (CC BY 4.0) license. 
- F1. Seismic data coverage.
- F2. Seismic reflection data without and with interpretation.
- F3. Two-way traveltimes to Tg and T60 unconformities.
- F4. Bathymetry with seismic lines.
- F5. Seismic dip Line 15ecLW1.
- F6. Seismic strike Line 15ecLW8.
- F7. Lithostratigraphic summary.
- F8. Bulk mineralogy and carbonate content.
- F9. Simplified lithology and unit description overview, Unit I.
- F10. Diverse burrows.
- F11. Ash layer.
- F12. Core composite image.
- F13. Clay-rich nannofossil ooze.
- F14. Contact between Units I and II.
- F15. Simplified lithology and unit description overview, Unit II.
- F16. Special features in Subunits IIA and IIB.
- F17. Glauconite sand.
- F18. Calcite-rich sandstone with calcite-filled veins.
- F19. Thin layers of organic matter within a clayey silt.
- F20. Glauconite-rich coarse sandstone.
- F21. Lithologic change from sand to sandstone.
- F22. Simplified lithology and unit description overview, Unit III.
- F23. Diverse lithologies of pebble- to cobble-sized clasts.
- F24. Overview of Unit III sandstone.
- F25. Preliminary model for deposition and sedimentary environments.
- F26. Deformation structures, Unit I.
- F27. Deformation structures, Subunits IIA and IIB.
- F28. Distinct vein shapes and structures.
- F29. Deformation structures, Unit III.
- F30. Age-depth model.
- F31. Benthic foraminifers.
- F32. Percentage of NRM loss.
- F33. SEM image of greigite cube.
- F34. Variation of percentage of NRM left above 575°C.
- F35. Magnetization normalized to NRM as a function of AF demagnetization.
- F36. Demagnetization plots.
- F37. Magnetic measurements, Holes U1501A and U1501B.
- F38. Magnetic measurements, Hole U1501C.
- F39. Magnetic measurements, Hole U1501D.
- F40. Correlation to magnetostratigraphy, Cores 1H through 17H.
- F41. Correlation to magnetostratigraphy, Cores 18F through 40X.
- F42. Gas chromatograms.
- F43. Carbon, sulfur, and TOC/TN.
- F44. Organic geochemical parameters.
- F45. Raman spectra of carbonaceous materials.
- F46. Surface-enhanced Raman spectra.
- F47. Interstitial water concentration profiles.
- F48. ICP-AES concentration profiles.
- F49. Major element oxide abundances.
- F50. Geochemical parameters correlated with sedimentological processes.
- F51. Variations in diagenetic history.
- F52. Physical properties, Holes U1501A and U1501B.
- F53. Physical properties, Holes U1501C and U1501D.
- F54. NGR measurements.
- F55. Density and porosity.
- F56. Sediment color reflectance.
- F57. RGB values.
- F58. Logging operations summary.
- F59. Triple combo tool string.
- F60. Downhole logs.
- F61. Heat flow calculations.
- F62. Physical properties compared with seismic waveform.
- F63. TDR curves.
- F64. Modeled TDR curves.
- F65. Seismic section and synthetic seismogram.
- F66. Synthetic seismogram.
- T1. Site U1501 core summary.
- T2. Mineral percentages.
- T3. Major element oxides and minor elements.
- T4. Distribution of diatoms species.
- T5. Calcareous nannofossil events.
- T6. Planktonic foraminifer events.
- T7. Nannofossil abundance.
- T8. Planktonic foraminifers.
- T9. Diatom events.
- T10. Ostracods.
- T11. Rock magnetic properties.
- T12. Paleomagnetic age datums.
- T13. Interpreted possible magnetic polarity sequence.
- T14. Carbon, nitrogen, and sulfur.
- T15. Interstitial water analyses.
- T16. Interstitial water minor elements.
- T17. Major element oxide and minor elements.