Sun, Z., Jian, Z., Stock, J.M., Larsen, H.C., Klaus, A., Alvarez Zarikian, C.A., and the Expedition 367/368 Scientists
Proceedings of the International Ocean Discovery Program Volume 367/368
publications.iodp.org
https://doi.org/10.14379/iodp.proc.367368.108.2018

Site U15041
Hans Christian Larsen, Zhimin Jian, Carlos A. Alvarez Zarikian, Zhen Sun, Joann M. Stock, Adam Klaus, Jacopo Boaga, Stephen A. Bowden, Anne Briais, Yifeng Chen, Deniz Cukur, Kelsie A. Dadd, Weiwei Ding, Michael J. Dorais, Eric C. Ferré, Fabricio Ferreira, Akira Furusawa, Aaron J. Gewecke, Jessica L. Hinojosa, Tobias W. Höfig, Kan-Hsi Hsiung, Baoqi Huang, Enqing Huang, Xiao-Long Huang, Shijun Jiang, Haiyan Jin, Benjamin G. Johnson, Robert M. Kurzawski, Chao Lei, Baohua Li, Li Li, Yanping Li, Jian Lin, Chang Liu, Chuanlian Liu, Zhifei Liu, Antonio Luna, Claudia Lupi, Anders J. McCarthy, Geoffroy Mohn, Lachit Singh Ningthoujam, Michael Nirrengarten, Nobuaki Osono, David W. Peate, Patricia Persaud, Ning Qiu, Caroline M. Robinson, Sara Satolli, Isabel Sauermilch, Julie C. Schindlbeck, Steven M. Skinner, Susanne M. Straub, Xiang Su, Liyan Tian, Froukje M. van der Zwan, Shiming Wan, Huaichun Wu, Rong Xiang, Rajeev Yadav, Liang Yi, Cuimei Zhang, Jinchang Zhang, Yang Zhang, Ning Zhao, Guangfa Zhong, and Lifeng Zhong2
Keywords: International Ocean Discovery Program, IODP, JOIDES Resolution, Expedition 367, Expedition 368, Site U1504, northern South China Sea, continent–ocean transition zone, hyperextension, continental breakup, thinning, rifting, greenschist, rifting, Eocene, larger benthic foraminifers, coral reef, rapid subsidence
MS 367368-108: Published 28 September 2018
Site summary
Background and objectives
Site U1504 (alternate Site SCSII-27A) was proposed during International Ocean Discovery Program (IODP) Expedition 367 and approved by the Environmental Protection and Safety Panel during Expedition 368 as an alternate site should there be time left following completion of the high-priority sites included in the Scientific Prospectus (Sun et al., 2016). Expedition 368 occupied Site U1504 because of the inability to continue drilling below the 990 m deep, cased Hole U1503A. Most of our remaining approved sites were in water deeper than 3400 m and/or required deep penetration. One exception was Site U1504, which is located at 2823 m below sea level (mbsl) ~45 km east of Site U1501 on the outer margin high (OMH) and has a shallow coring target (Figures F1, F2).
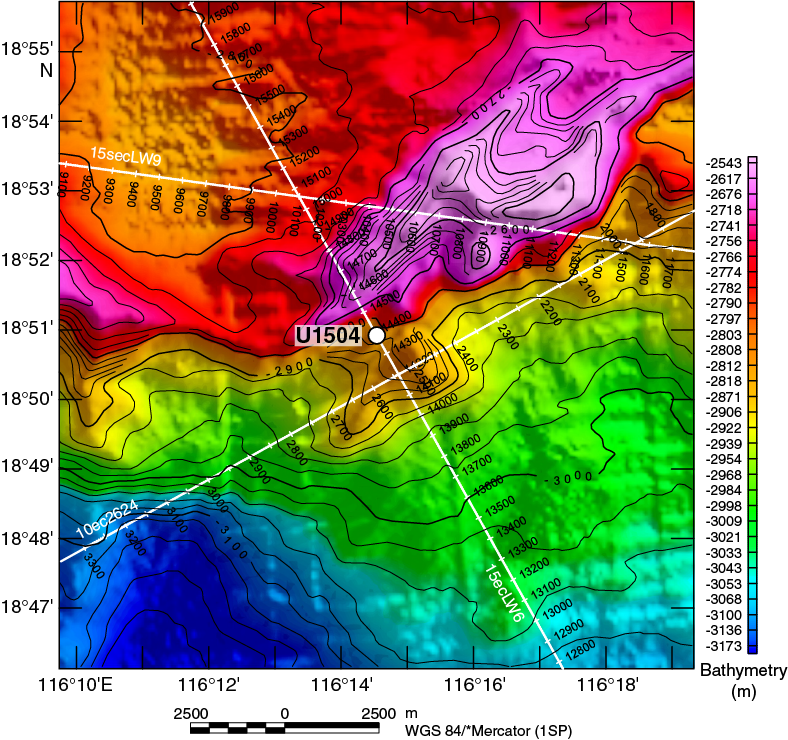
Figure F1. Bathymetry and seismic lines.
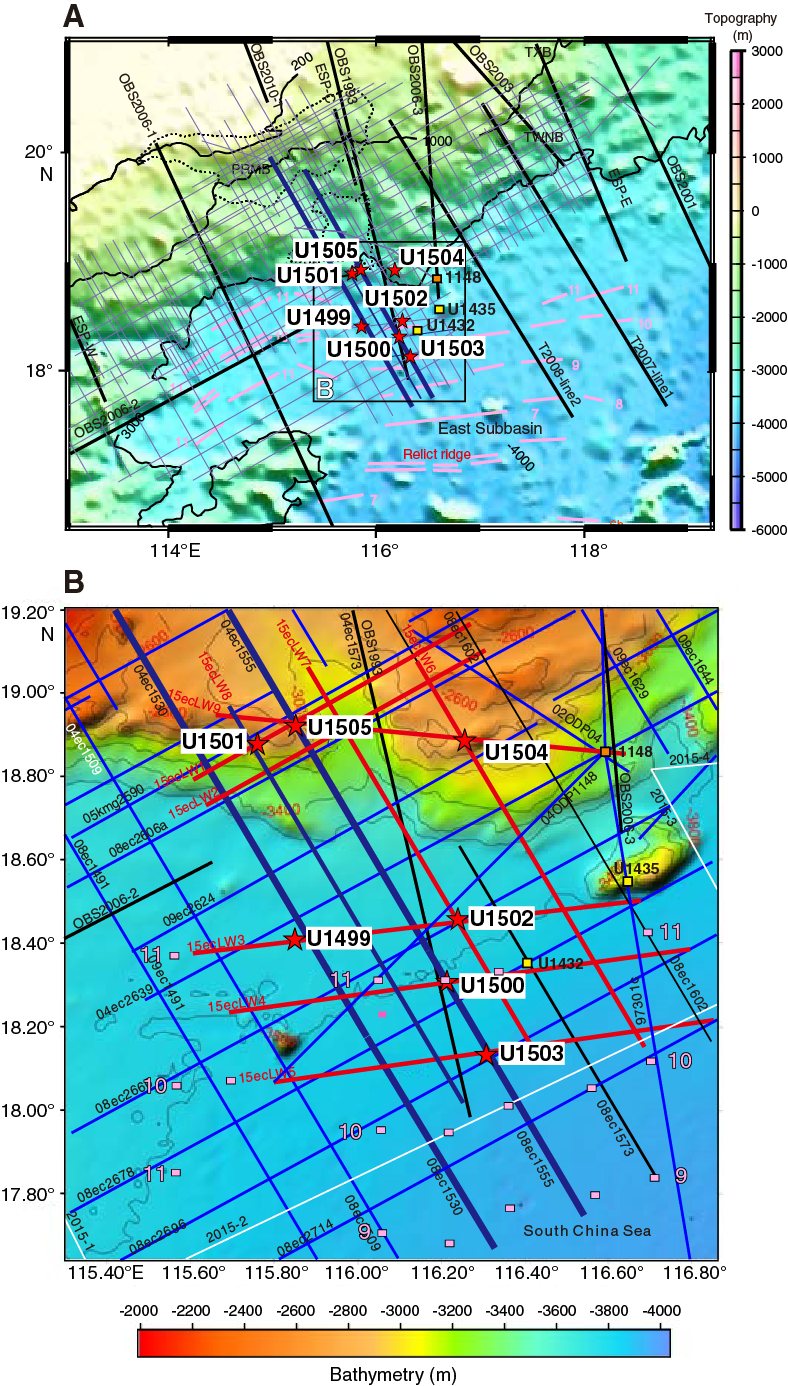
Figure F2. Northern SCS margin with seismic coverage.
Operations
Two holes were drilled at Site U1504. In Hole U1504A (18°50.9199′N, 116°14.5397′E; 2816.6 mbsl), we cored with the rotary core barrel (RCB) system from the seafloor to metamorphic basement at 134.8 m and then into basement to 165.5 m, recovering 52.77 m (32%). In Hole U1504B (~200 m southeast of Hole U1504A; 18°50.8213′N, 116°14.5978′E; 2843.0 mbsl), we drilled without recovery to 88.2 m, cored with the RCB system to metamorphic basement at 107.9 m, and then cored into basement to 200 m, recovering 21.48 m (19%).
Lithostratigraphy
The succession recovered at Site U1504 includes two sedimentary units (I and II) underlain by a metamorphic unit (III). Lithostratigraphic Unit I (early Miocene–Pleistocene) is dominated by nannofossil and foraminiferal ooze and minor nannofossil-rich clay and is divided into four subunits (IA–ID). Subunit IA (Hole U1504A = 17.50−46.59 m) is composed of nannofossil-rich clay, nannofossil ooze, nannofossil ooze with biogenic silica, and clay-rich nannofossil ooze. The color of the ooze gradually changes downhole from dark greenish gray to greenish gray and gray. Distinct intervals contain more silt. Thin silt laminations are often disrupted by bioturbation. Layering is contorted at the base of the subunit. Subunit IB (Hole U1504A = 46.59–59.73 m) is composed of light brown foraminifer-rich nannofossil ooze and pale brown nannofossil ooze with foraminifers. Subunit IC (Hole U1504A = 65.80–104.99 m) is composed of light greenish gray, greenish gray, light brownish gray, pale brown, and light gray nannofossil ooze with clay and greenish gray clay-rich nannofossil ooze intercalated with light gray nannofossil-rich foraminiferal ooze with clay, light brownish gray foraminifer-rich nannofossil ooze, and foraminifer-rich nannofossil ooze with clay. Subunit ID (Hole U1504A = 104.99–112.66 m; Hole U1504B =88.20–92.31 m) is composed of light brown to yellowish brown nannofossil ooze with foraminifers intercalated with pink or brownish yellow foraminifer-rich nannofossil ooze. Unit II (Hole U1504A = 114.72–134.80 m; Hole U1504B = 97.90–107.91 m) is clast-supported, bioclast-rich limestone with larger benthic foraminifers (as large as 15 mm). Unit III (Hole U1504A = 136.40–163.70 m; Hole U1504B = 117.40–196.28 m) is composed of fine- to coarse-grained epidote-chlorite schist (Subunit IIIA) and calc-silicate schist (Subunit IIIB) with granofels clasts.
Metamorphic petrology
We recovered 27 m (Hole U1504A) and 79 m (Hole U1504B) of a variety of mylonitic epidote-chlorite to calc-silicate schists containing granofels clasts. Recovery was <20% in metamorphic lithologic Unit 1. Lithologic changes with depth and between the two holes were observed, and Unit 1 is divided based on a change in the predominant metamorphic lithology (Figure F3). Metamorphic lithologic Subunit 1a was recovered in both Holes U1504A and U1504B and consists of greenish gray, microcrystalline to coarse-grained epidote-chlorite schist with dark greenish gray granofels clasts (<10 cm) and epidote-chlorite breccia. The schists show a strong mylonitic foliation, whereas the clasts have generally isotropic textures showing local weakly developed foliation. Both the schist and the granofels clasts show, in general, a comparable mineral assemblage consisting of epidote, chlorite, feldspar, and quartz ± other phyllosilicates and accessory minerals and locally isolated subhedral dark minerals (pyroxene?). The granofels clasts are often crosscut by a network of quartz veins. Subunit 1b contains an alternation of calc-silicate schist and epidote-chlorite schist with granofels clasts, epidote and/or chlorite granofels, chlorite schist with epidote, epidote-chlorite gneiss, and minor marble. The lithologies are fine grained to coarse grained with mostly an inequigranular texture and some bimodal or equigranular textures, and the schistose sections show a strong mylonitic foliation. Several of the schists show reddish brown alteration, and late calcite veins crosscut the foliation of the deepest schists recovered (e.g., in Core 368-U1504A-20R). Minerals observed are epidote, quartz, chlorite, calcite, and feldspar. Subunit 1b contains numerous clasts with variable lithologies: cryptocrystalline granofels either with or without quartz and/or calcite veins, porphyritic rocks with tabular phenocrysts (possibly altered plagioclase), brecciated (epidote, calcite, and/or quartz) veins, and foliated granofels.
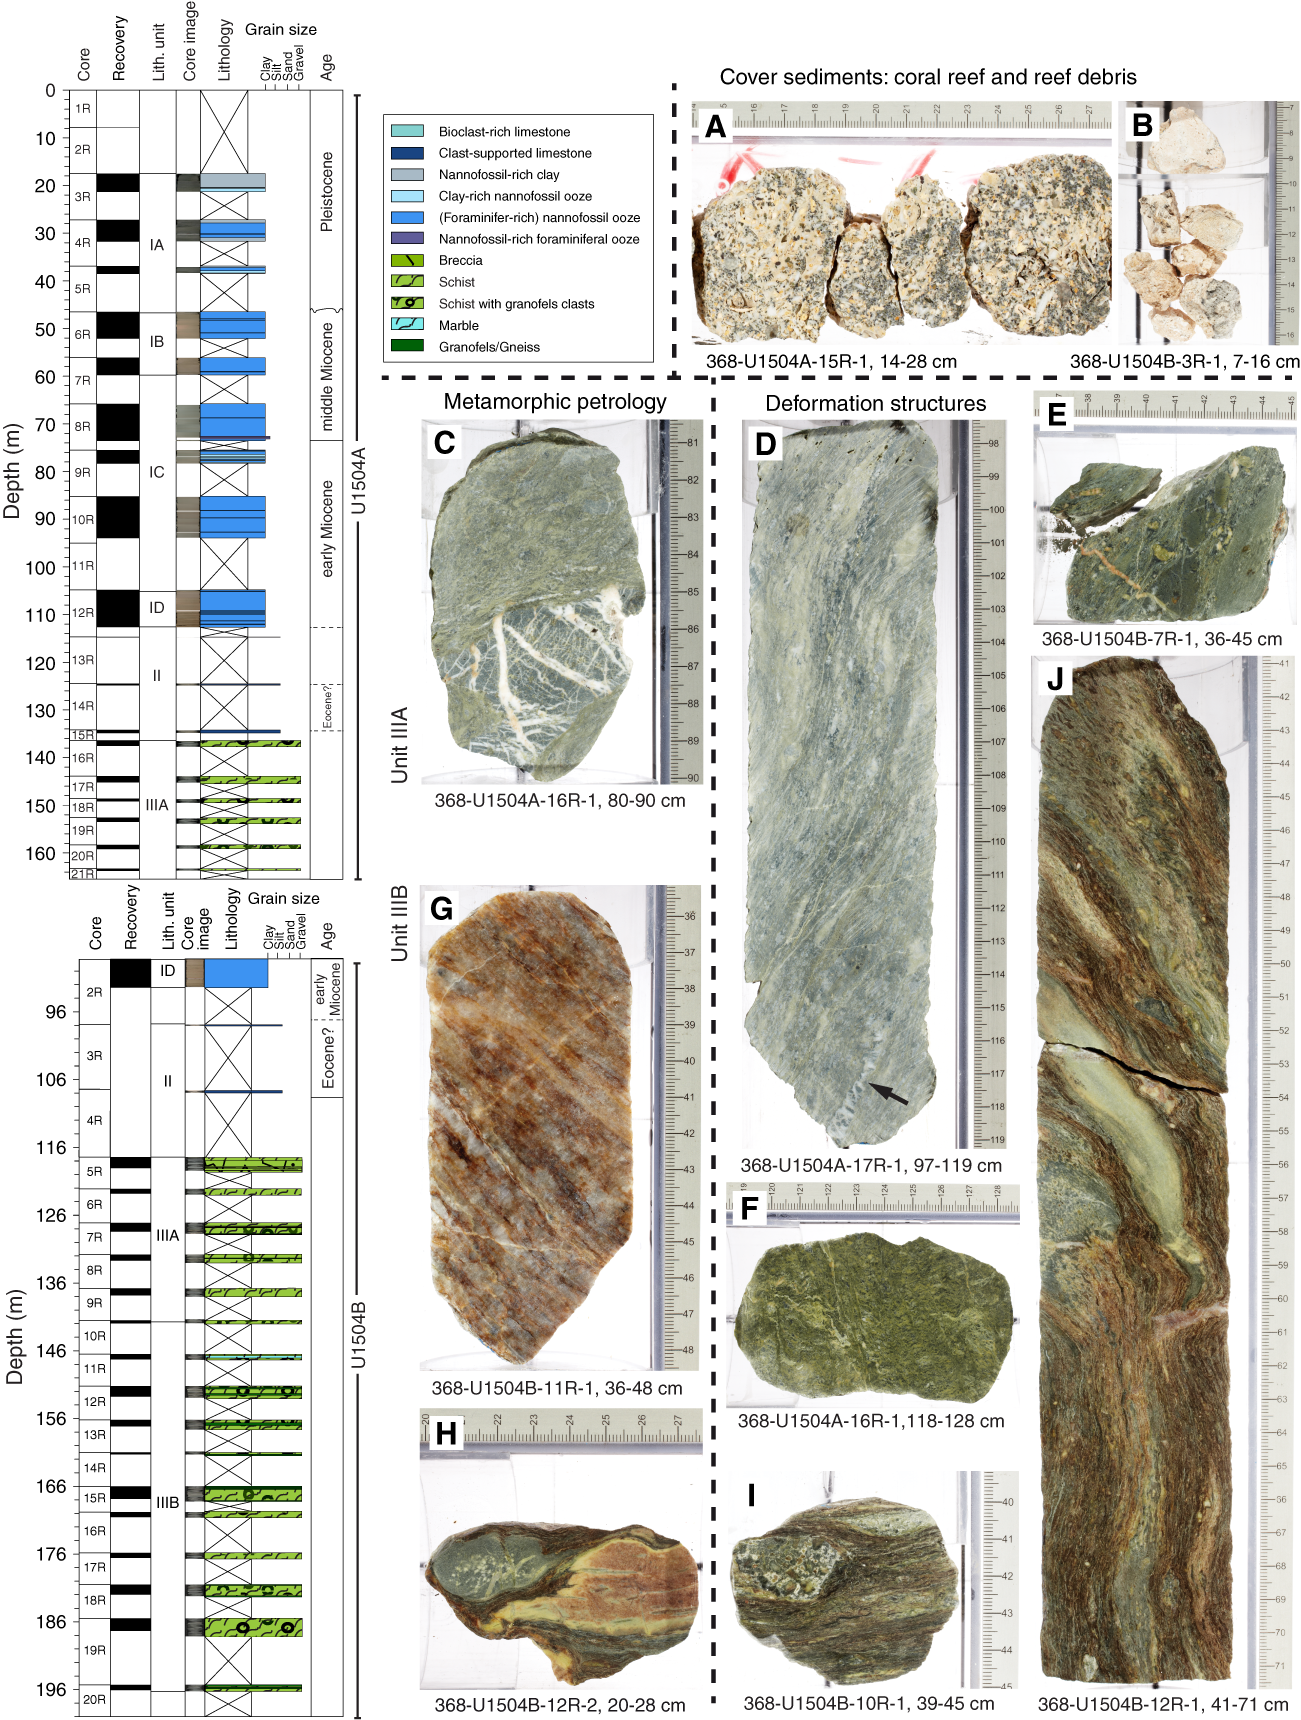
Figure F3. Lithostratigraphic observations.
Handheld portable X-ray fluorescence (pXRF) analyses show an average mafic igneous composition for both the schist and the clasts but with a spread toward ultramafic (in Hole U1504B Subunit 1a) and more felsic compositions (in Subunit 1b). A clear change in sulfur contents occurs between Subunits 1a and 1b, the latter of which is below the detection limit. High Nb contents compared to mid-ocean-ridge basalt (MORB) indicate a potentially enriched source for the protolith.
Lithostratigraphic Unit III (metamorphic lithologic Unit 1) consists of mylonitic greenschist facies metamorphic rocks, as indicated by the presence of epidote and chlorite. We infer that the protolith most likely was breccia based on the different clast sizes and types and styles of deformation. The protolith likely had a mafic igneous composition. It is, however, unclear if this breccia with mafic clasts has a sedimentary origin (e.g., volcaniclastic) or represents a potentially hydrothermally altered form of basalt, gabbro, or ultramafic protolith. At present, the metamorphic evolution of this unit and its possible connection with the opening of the South China Sea (SCS) is unknown.
Structural geology
Lithostratigraphic Unit I shows subhorizontal bedding and locally some minor possible slump folds, as observed in Section 368-U1504A-5R-1. Unit II is devoid of any deformation structures. The metamorphic basement at Site U1504 is formed by greenschist facies mylonitic epidote-chlorite schists and calc-silicate schists (Unit III). The rocks preserve distinct deformation structures resulting from changes in the mode of deformation (brittle/ductile); the modal amount of quartz + feldspar governing the (local) rheological behavior; the amount of accumulated strain; the occurrence of variably sized (up to decimeter scale), prekinematic, heterolithic clasts that mostly form rigid (i.e., internally undeformed) bodies within the ductile foliation; and/or superimposed multiple deformation phases. The steeply dipping (up to 75°) mylonitic foliation is characterized by distinct morphologies: (1) a widely spaced anastomosing foliation associated with leucocratic bands; (2) a tight, closely spaced, and often crenulated foliation associated with more melanocratic schist variations; and (3) a tight anastomosing foliation associated with calc-silicate schists enclosing angular to rounded heterolithic granofels clasts. Locally, the sense of shear is indicated by shear bands and sigma clasts. In metamorphic lithologic Subunit 1a (Figure F3), granofels clasts are consistently microcrystalline (chlorite + epidote) and dismembered by a network of mostly parallel and perpendicular quartz veins cutting each other. They often form apparently stretched, elongated bodies oriented parallel to the foliation. Subunit 1b shows a wide range of prekinematic (mostly mafic) clasts enclosed by the foliation. Encountered varieties encompass highly phyric to aphyric rocks, as well as fragmented former (epidote/calcite/quartz) vein fillings. In some cases, such clasts show ductile internal deformation. Clast boundaries can be either distinctly sharp or diffuse, the latter indicating mechanical and/or chemical interactions with the surrounding foliation. Deformation in Subunit 1b is presumably strongly controlled by an inherited (protolithic) brecciated structure.
Biostratigraphy
All core catcher samples at Site U1504 were analyzed for calcareous nannofossils, foraminifers, and diatoms. Additional samples were taken from intervals within the working-half core sections when necessary to refine the ages. Preservation of calcareous microfossils is good to very good in Cores 368-U1504A-2R through 12R, and 368-U1504B-2R and is poorly preserved (recrystallization) in the reefal limestone below Core 368-U1504A-12R. Planktonic foraminifers and calcareous nannofossils are abundant in Cores 368-U1504A-2R through 12R and 368-U1504B-2R and barren in Cores 368-U1504A-13R through 15R. Diatoms are present but poorly preserved in Cores 368-U1504A-2R through 5R and absent in rest of the samples. Twenty biostratigraphic datums were identified in a succession from the late Pleistocene to the early Miocene.
A possible hiatus between the early Pleistocene and late Miocene was determined within Core 368-U1504A-6R by abrupt planktonic foraminifer and nannofossil assemblage changes. Sedimentation rates at this site varied from ~6 mm/ky in the early middle Miocene to ~22 mm/ky during the Pleistocene.
Cores 368-U1504A-13R through 15R are mainly composed of reefal and larger benthic foraminiferal limestone. Thin section examination of these carbonate rocks indicates the presence of abundant Nummulites, suggesting an Eocene age. The abundant larger benthic foraminifers indicate deposition in a warm shallow-marine environment. In contrast, the abundant planktonic foraminifers and calcareous nannofossils in the carbonate ooze in the overlying sedimentary section (Cores 2R through 12R) indicate a deepwater environment since the early Miocene.
Paleomagnetism
Most of the discrete sediment samples analyzed show an initial soft magnetic behavior attributed to titanomagnetite followed by a gyroremanent magnetization (GRM) greater than 70 mT attributed to greigite, a mineral already identified in Hole U1501C. Consistently steep normal inclinations (~60°) across all sedimentary units indicate a significant drilling overprint that is removed by alternating field (AF) demagnetization up to 15 mT. A succession of nine normal and eight reversed polarities are defined, particularly in the upper part of the cores (Figure F29).
Discrete samples show low κ values, a moderate degree of magnetic anisotropy, and strongly oblate symmetry, probably of depositional origin. This subhorizontal planar fabric indicates deposition in a calm, pelagic environment with moderate traction.
Natural remanent magnetization (NRM) intensities of metamorphic rocks, measured on the superconducting rock magnetometer (SRM) and on four discrete cubes, are relatively weak and indicate a complex magnetic assemblage composed of magnetite and hematite. The anisotropy of magnetic susceptibility (AMS) fabrics consistently dip steeply and show a moderate to high degree of magnetic anisotropy, oblate symmetries, and oblique magnetic lineations, possibly indicating an oblique motion within this high-strain shear zone.
Geochemistry
Hydrocarbon gases were not detected above background levels at Site U1504, and total organic carbon (TOC), total nitrogen (TN), and total sulfur (TS) contents were low (<0.5 wt%). Instances of high carbonate content were associated with bioclast-rich and clast-supported limestone. The upper part of the sediment was not cored. Interstitial water data from the cored sediments are broadly comparable to other sites.
Physical properties
Four petrophysical (PP) units are identified at Site U1504 according to variations in the core physical properties. Core material in PP Units 1 and 2 consists of soft sediments. In general, with respect to Unit 2, Unit 1 has a higher average natural gamma radiation (NGR) count (~30 versus 20 counts/s), a weaker color reflectance (mean L* of ~40 versus 50), and a lower average RGB value (100 versus 150). These changes in physical properties between Units 1 and 2 correspond to a switch in sediment composition from nannofossil-rich clay to nannofossil ooze. A general increase in bulk (from ~1.4 to 1.8 g/cm3) and dry (from ~0.7 to 1.2 g/cm3) densities and a downhole decrease in porosity (from 75% to 56%) in Units 1 and 2 mainly indicate sediment compaction with time. The boundary between Units 1 and 2 is marked by a relatively rapid increase in P-wave velocity and bulk density and a rapid decrease in porosity compared with the general trends mentioned above. This physical property boundary corresponds to an unconformity in the seismic profile and to a hiatus confirmed by the biostratigraphic data.
P-wave velocity and bulk density increase from ~3800 to 5000 m/s and from ~2.4 to 2.9 g/cm3, respectively, within Unit 3, which corresponds to a transition in lithology from coral-rich limestone to clast-supported limestone. Coral-rich limestone in the upper portion of Unit 3 is also associated with a moderately high porosity of ~23%. Unit 4 is characterized by uniformly high velocity of ~5500 m/s, high bulk density of ~2.9 g/cm3, and low porosity of ~3%, which correspond to the epidote-chlorite schist. A large increase in both velocity and density at the Unit 2/3 and Unit 3/4 boundaries corresponds to strong reflectors in the seismic data. The gradual downhole increase in thermal conductivity values at shallow depths is likely due to progressive compaction of the sediments.
Background and objectives
Site U1504 was proposed together with other relatively shallow penetration sites during Expedition 367. These sites were approved by the Environmental Protection and Safety Panel and IODP as alternate sites for Expedition 368 should there be time left following completion of the high-priority sites included in the Scientific Prospectus. Expedition 368 occupied Site U1504 because of the inability to continue drilling below the 990 m deep, cased Hole U1503A (see Operations in the Site U1503 chapter [Larsen et al., 2018b]). The depth limit of 3400 m (water depth plus penetration) imposed by the flawed drawworks left very few drilling options for continuation of Expedition 368 operations because almost all proposed sites are in water depths greater than 3400 m and/or require deep penetration. One exception was Site U1504, which is located in ~2830 m water depth and has a shallow coring target (Figure F2).
Site U1504 is located near the top of a structural high (Figures F1, F2, F4) that can be interpreted as an easterly extension of the OMH. The OMH was drilled at Sites U1501 and U1505 (Figure F5). At Site U1501, acoustic basement at ~600 m consists of highly lithified sandstones and conglomerate likely of pre-Cenozoic age (see the Site U1501 chapter [Larsen et al., 2018a]). Site U1504 is ~50 km east of Site U1501 (Figure F2), and the OMH at Site U1504 is much narrower and bounded to the north (landward) by a major normal fault. The OMH appears faulted (complex) to the south (seaward) and lacks the small rift basins that formed an important coring target at Sites U1501 and U1505 (Figure F5). These basins may, however, be present south (seaward) of Site U1504, where the top of the basement rapidly deepens in parallel with basinward crustal thinning. Site U1504 may be located within a transition zone into another (eastern) margin segment with a different rifting structure (Figure F1).

Figure F4. Seismic profile hole locations.
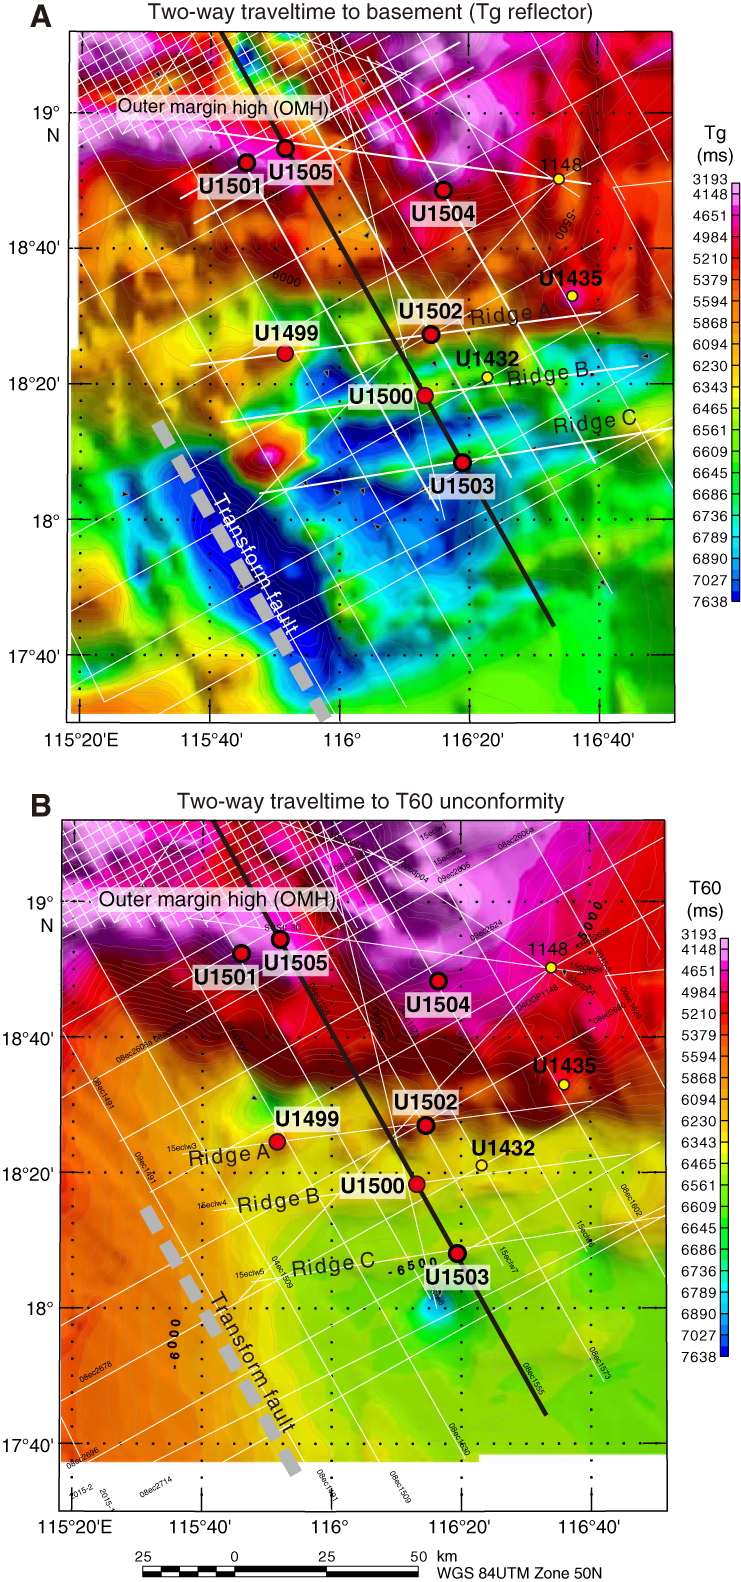
Figure F5. Two-way traveltime to Tg and T60 unconformities.
Site U1504 was designed to sample the basement below the thin (~120 m) layers of sediments covering this basement high (Figure F4). The specific goal was to find out how deeply tectonic exhumation during breakup might have reached into the lithosphere, or alternatively, whether the basement would be of igneous origin and related to breakup, similar to Site U1502. There was no predrilling interpretation of the seismic stratigraphy. The site is located in a place with a strong basement reflector with a reasonable horizontal extension. Basement appears to be heavily faulted both north and south of the drill site.
Operations
We drilled two holes at Site U1504 (Table T1). Hole U1504A is located at 18°50.9199 ′N, 116°14.5397 ′E, in a water depth of 2816.6 m. In this hole, we cored with the RCB system from the seafloor to 165.5 m, recovering 52.77 m (32%) of sedimentary and metamorphic rocks. Hole U1504B is located ~200 southeast of Hole U1504A at 18°50.8213′N, 116°14.5978′E, in a water depth of 2843.0 m. In this hole, we drilled without recovery to 88.2 m and then cored with the RCB system over a 111.8 m interval, recovering 21.48 m (19%) of mostly metamorphic rock.
Table T1. Site U1504 core summary. View table in PDF format. Download table in CSV format.
Transit to Site U1504
The R/V JOIDES Resolution began the transit from Site U1503 to Site U1504 at 0948 h on 26 May 2017 and arrived on site at 1400 h the same day. The thrusters were lowered, and the vessel was switched to dynamic positioning mode at 1432 h, beginning operations at Site U1504. An RCB bottom-hole assembly (BHA) was made up and deployed to 1720 mbsl before failure of the pipe spinner on the iron roughneck. The spinner was replaced, and the crew continued to lower the pipe to 2776 mbsl. The subsea camera was deployed, and the bit was placed at 2813 mbsl for a short seafloor survey to verify that no seafloor cables were in the area. The seafloor was tagged after the survey, determining a water depth of 2816.6 m. The camera was retrieved, and the top drive was picked up in preparation for starting Hole U1504A.
Hole U1504A
Coring in Hole U1504A started at 0215 h, and the bit reached the sediment/basement contact at 136.4 m (at 1455 h on 27 May 2017). Coring continued to 165.5 m, at which depth erratic torque and overpull caused termination of coring operations at 1100 h on 28 May. The bit was recovered to the surface, clearing the seafloor at 1220 h and the rotary table at 1740 h. The rig floor was secured for the 22 nmi transit to Site U1505 by 1825 h on 28 May, temporarily ending operations at Site U1504.
Total time spent in Hole U1504A was 50.5 h (2.1 days). A total of 21 RCB cores were taken over a 165.5 m interval of loosely to well-consolidated sedimentary rock and metamorphic rocks with 52.77 m of recovery (32%).
Return to Site U1504
We returned to Site U1504 after completing operations at Site U1505. The 22.2 nmi transit from Site U1505 to Site U1504 was completed at 0048 h on 03 June 2017. The thrusters were lowered, and the heading was controlled at 0357 h, beginning operations at Site U1504.
Hole U1504B
An RCB BHA was made up, and core barrels were spaced out. A center bit was installed, and the drill string was lowered to 2776 m. The subsea camera was deployed to the bit, and the drill string was hung off the elevator stool. The low clutch was then dismantled, and the diaphragm was replaced for the fifth time. The diaphragm failed during operations at Site U1505 but was not replaced there because it was not necessary for operations at that site and the rig crew recommended installing the new diaphragm at the seafloor in Hole U1504B in case it was necessary during operations there. The replacement took 7.75 h. Once completed, the top drive was picked up and the bit was lowered to the seafloor.
Seafloor was tagged at 2843.0 mbsl. The subsea camera was recovered to the moonpool, and Hole U1504B was spudded at 2250 h on 4 June 2017. The hole was advanced without coring to 88.2 m.
The center bit was recovered, and an RCB core barrel was dropped to begin coring. Sediments were recovered in Core 2R. The following two cores, 3R and 4R, contained limestone fragments. Basement rubble was recovered from Core 4R downhole. RCB coring continued through Core 20R at 200 m. Torque was erratic throughout coring operations in basement, and half cores were cut for all basement cores except Core 19R.
Coring was terminated due to time limitations after Core 20R, and the bit was recovered to the surface, clearing the seafloor at 0455 h and the rotary table at 1040 h on 7 June. Total time spent in Hole U1504B was 80 h (3.3 days). A total of 19 RCB cores were taken over a 111.8 m interval with 21.48 m of recovery (19%).
The rig floor was secured and made ready for the 946 nmi transit to Shanghai, China, by 1130 h on 7 June. The vessel was underway at 1200 h, ending Hole U1504B and Site U1504. After a 4 day transit, the JOIDES Resolution arrived in Shanghai, China, and Expedition 368 concluded with the first line ashore at Lingang Terminal at 1212 h on 11 June.
Lithostratigraphy
We examined the lithostratigraphy of Holes U1504A and U1504B (Figure F6), which are approximately 200 m apart. Three lithostratigraphic units are defined; two sedimentary and one metamorphic. Lithostratigraphic Unit I is further divided into four subunits based on visual core description, smear slide and thin section inspection, and X-ray diffraction (XRD) analysis (see Lithostratigraphy in the Expedition 367/368 methods chapter [Sun et al., 2018]).
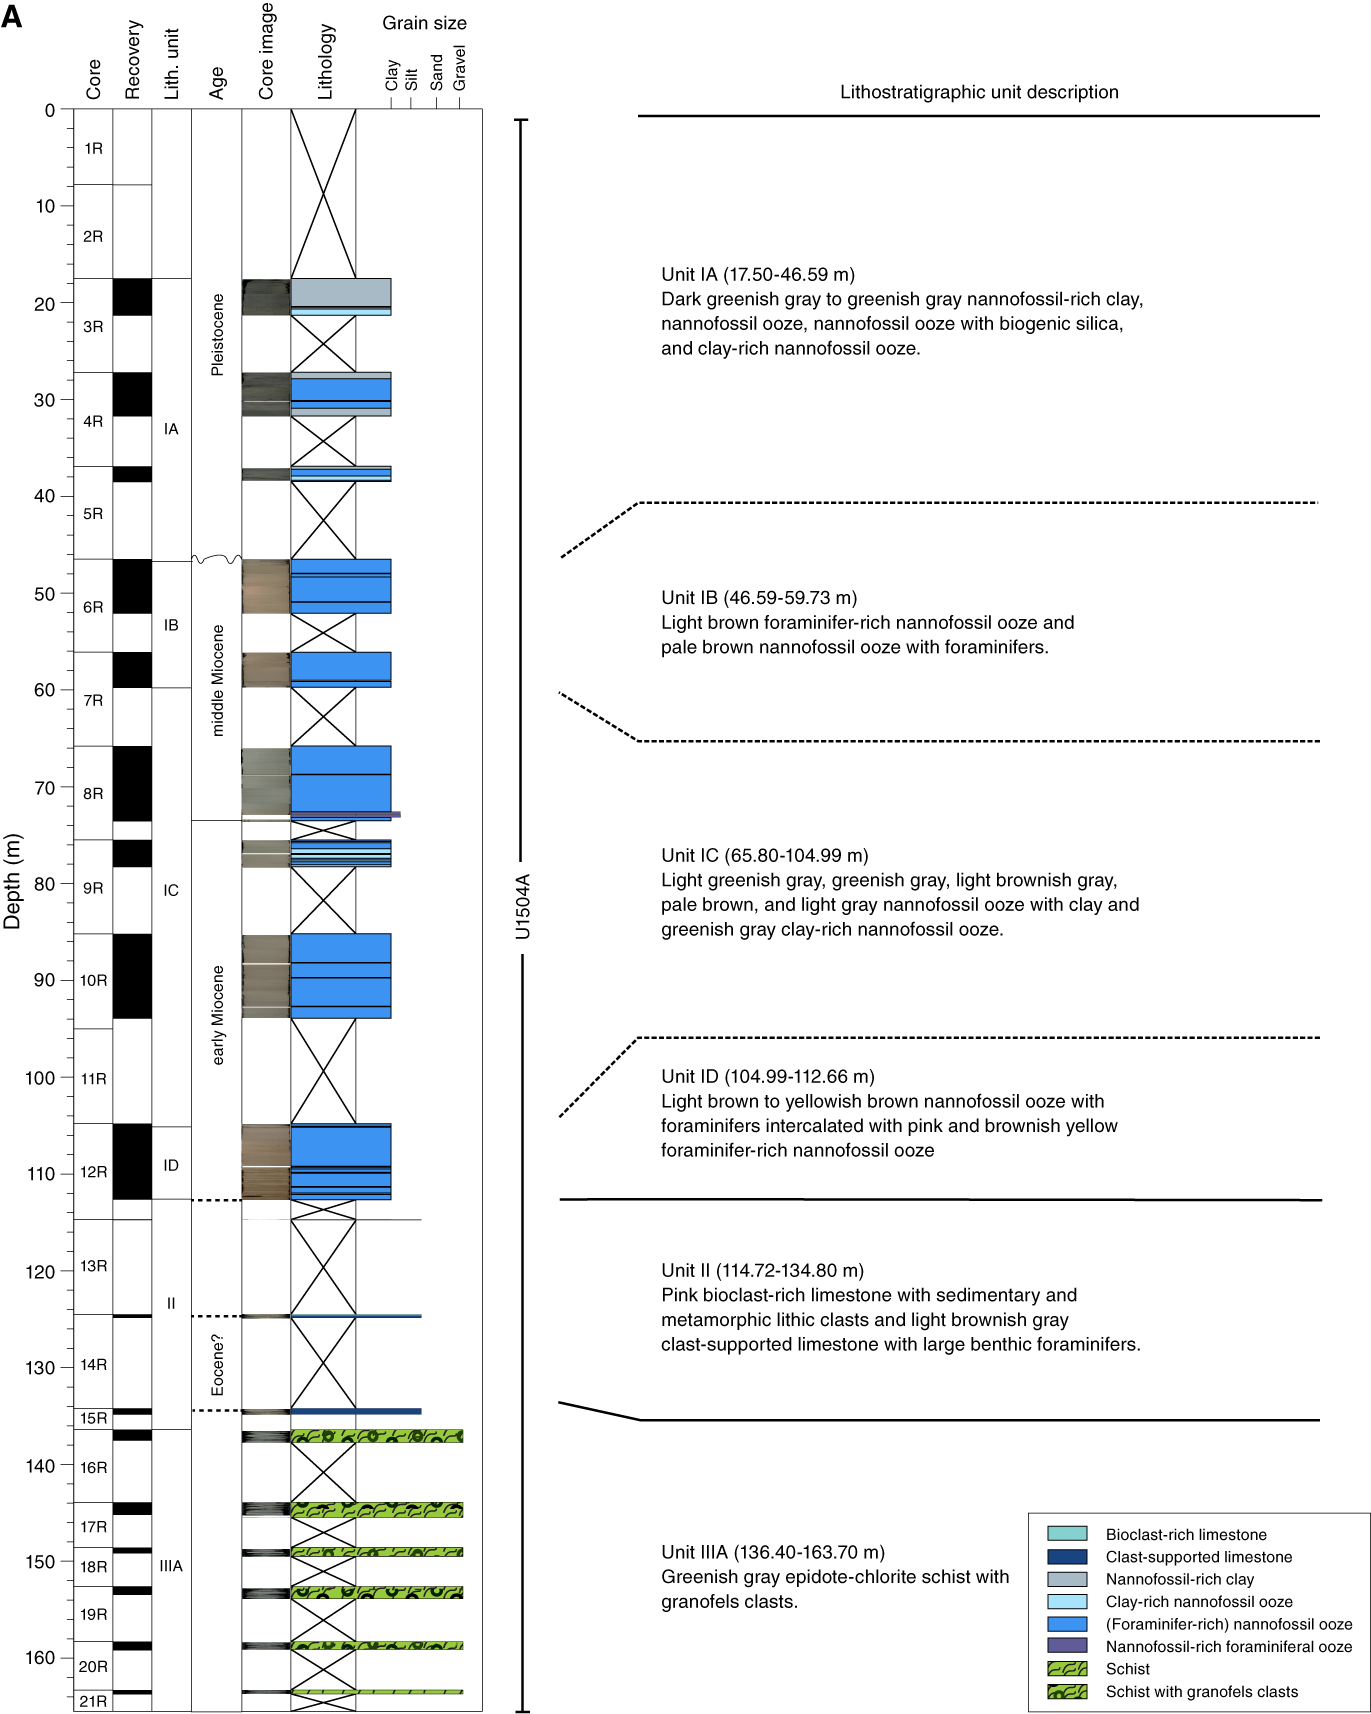

Figure F6. Lithostratigraphic summary.
The recovered sediment succession extends from 17.50 to 134.80 m in Hole U1504A (Sections 3R-1 through 15R-1) and from 88.20 to 107.91 m in Hole U1504B (Sections 2R through 4R) and overlies greenish gray metamorphic rocks. The uppermost cores in Hole U1504A (Cores 1R and 2R) had no recovery.
Unit I is dominated by nannofossil and foraminiferal ooze with minor nannofossil-rich clay. Unit II is defined by a change from clay and ooze to bioclast-rich and clast-supported limestone with large benthic foraminifers. The contact between Units I and II was not recovered. Unit III is composed of fine- to medium-grained epidote-chlorite schist, calc-silicate schist, epidote-chlorite breccia, and marble.
Unit description
Unit I
- Intervals: 368-U1504A-3R-1, 0 cm, to 12R-CC, 18 cm; 368-U1504B-2R-1, 0 cm, to 2R-CC, 17 cm
- Depths: Hole U1504A = 17.50–112.66 m; Hole U1504B = 88.20–92.31 m
- Age: Pleistocene to early Miocene
Lithology and sedimentary structures
Unit I is dominated by nannofossil and foraminifer ooze with minor nannofossil-rich clay intervals at the top of the unit. The unit is divided into four subunits, IA–ID, based on changes in the biogenic component of the sediment and on color changes that coincide with subtle changes in the sediment components (Figure F7).
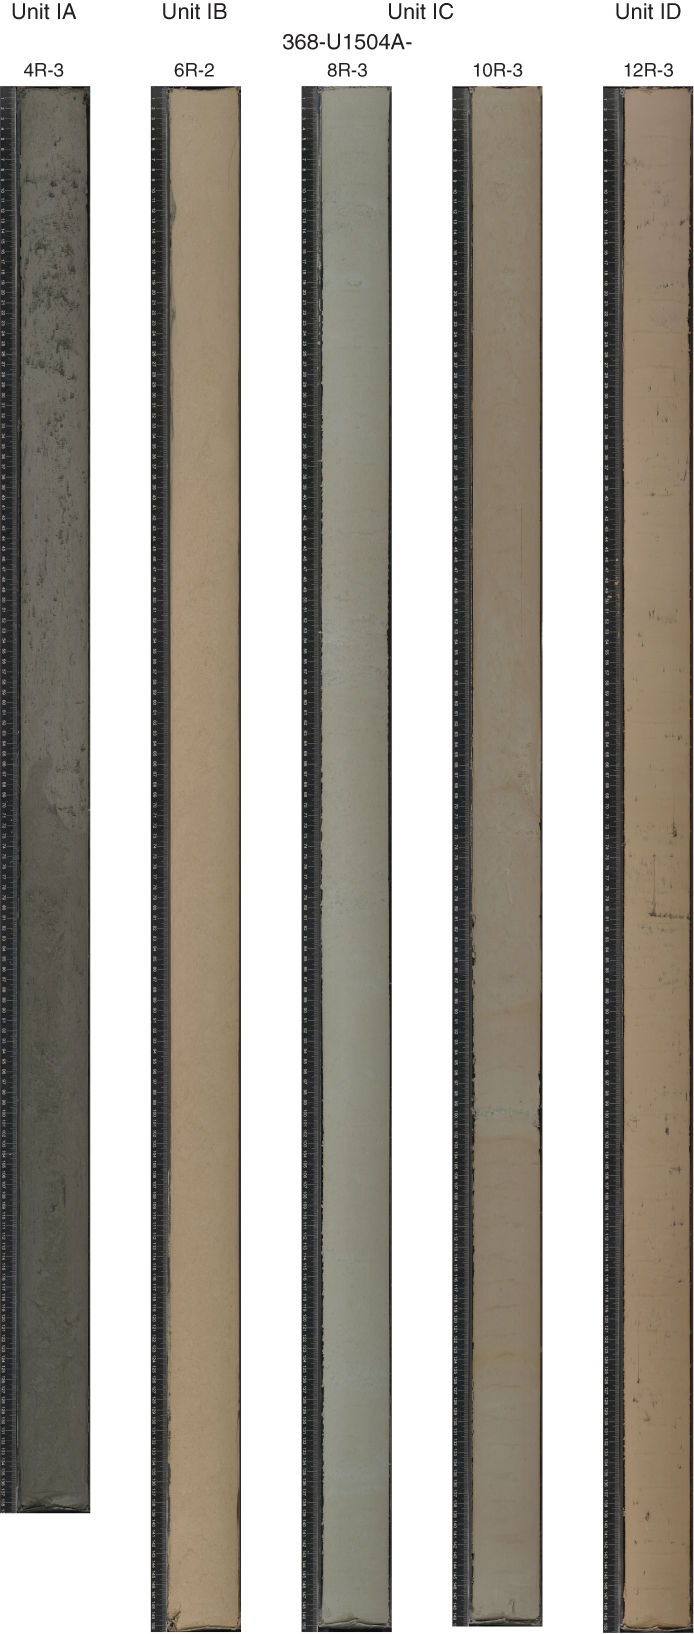
Figure F7. Representative core section images.
The boundary between Units I and II is marked by a change in lithology from ooze-dominated sediments to bioclast-rich and clast-supported limestone.
Bulk mineralogy
The bulk mineralogy results of XRD analyses are listed in Table T2 and shown in Figure F8. Unit I sediments are mainly composed of calcite, quartz, plagioclase, K-feldspar, halite, pyrite, and clay minerals (including smectite, illite, kaolinite, and chlorite). Calcite is present throughout Unit I (mostly in the form of nannofossils and foraminifers) and becomes more abundant in Subunits IB–ID. Pyrite has a downhole trend similar to that of calcite. In contrast, the percentages of terrigenous minerals (quartz, plagioclase, and chlorite) and authigenic halite have much lower contents in Subunits IB–ID than in Subunit IA. These general characteristics are consistent with the observed lithologic change from nannofossil-rich clay to foraminifer-rich nannofossil ooze.
Table T2. Mineral percentages. View table in PDF format. Download table in CSV format.
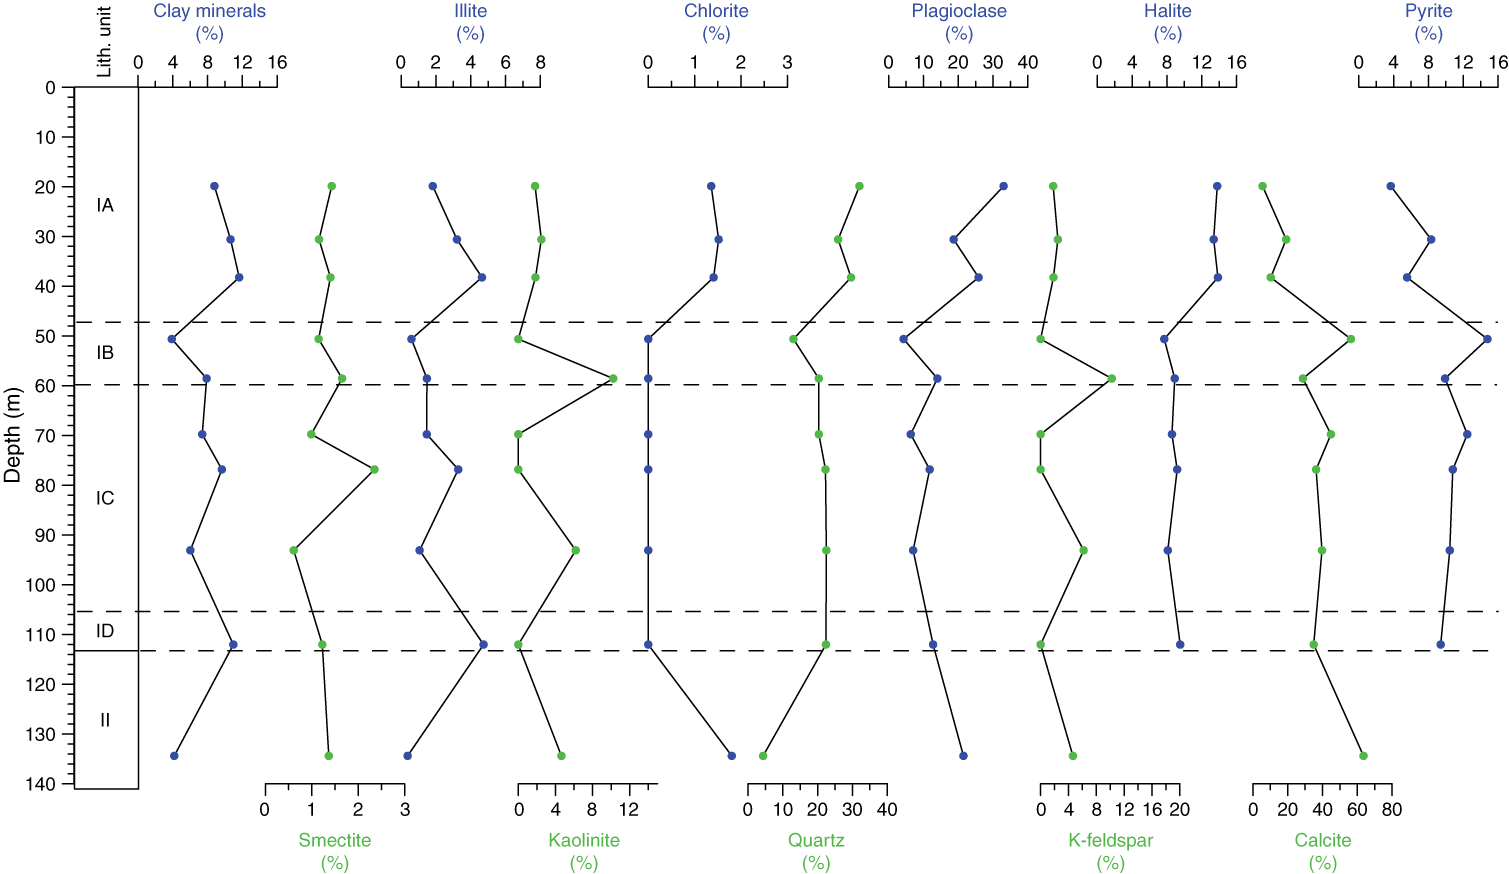
Figure F8. Bulk mineralogy.
Subunit IA
Subunit IA spans the recovered uppermost 20.09 m of Unit I and is dominated by nannofossil-rich clay, nannofossil ooze, nannofossil ooze with biogenic silica, and clay-rich nannofossil ooze (Figures F7, F9). The color of the ooze gradually changes from dark greenish gray to greenish gray and gray. The ooze comprises calcareous nannofossils and foraminifers; siliceous diatoms; sponge spicules; radiolarians; and terrigenous grains, including clay minerals, rare quartz, and feldspar (Figure F9). The sediment is well sorted and unlithified. The average grain size is clay, and silt is the maximum grain size.
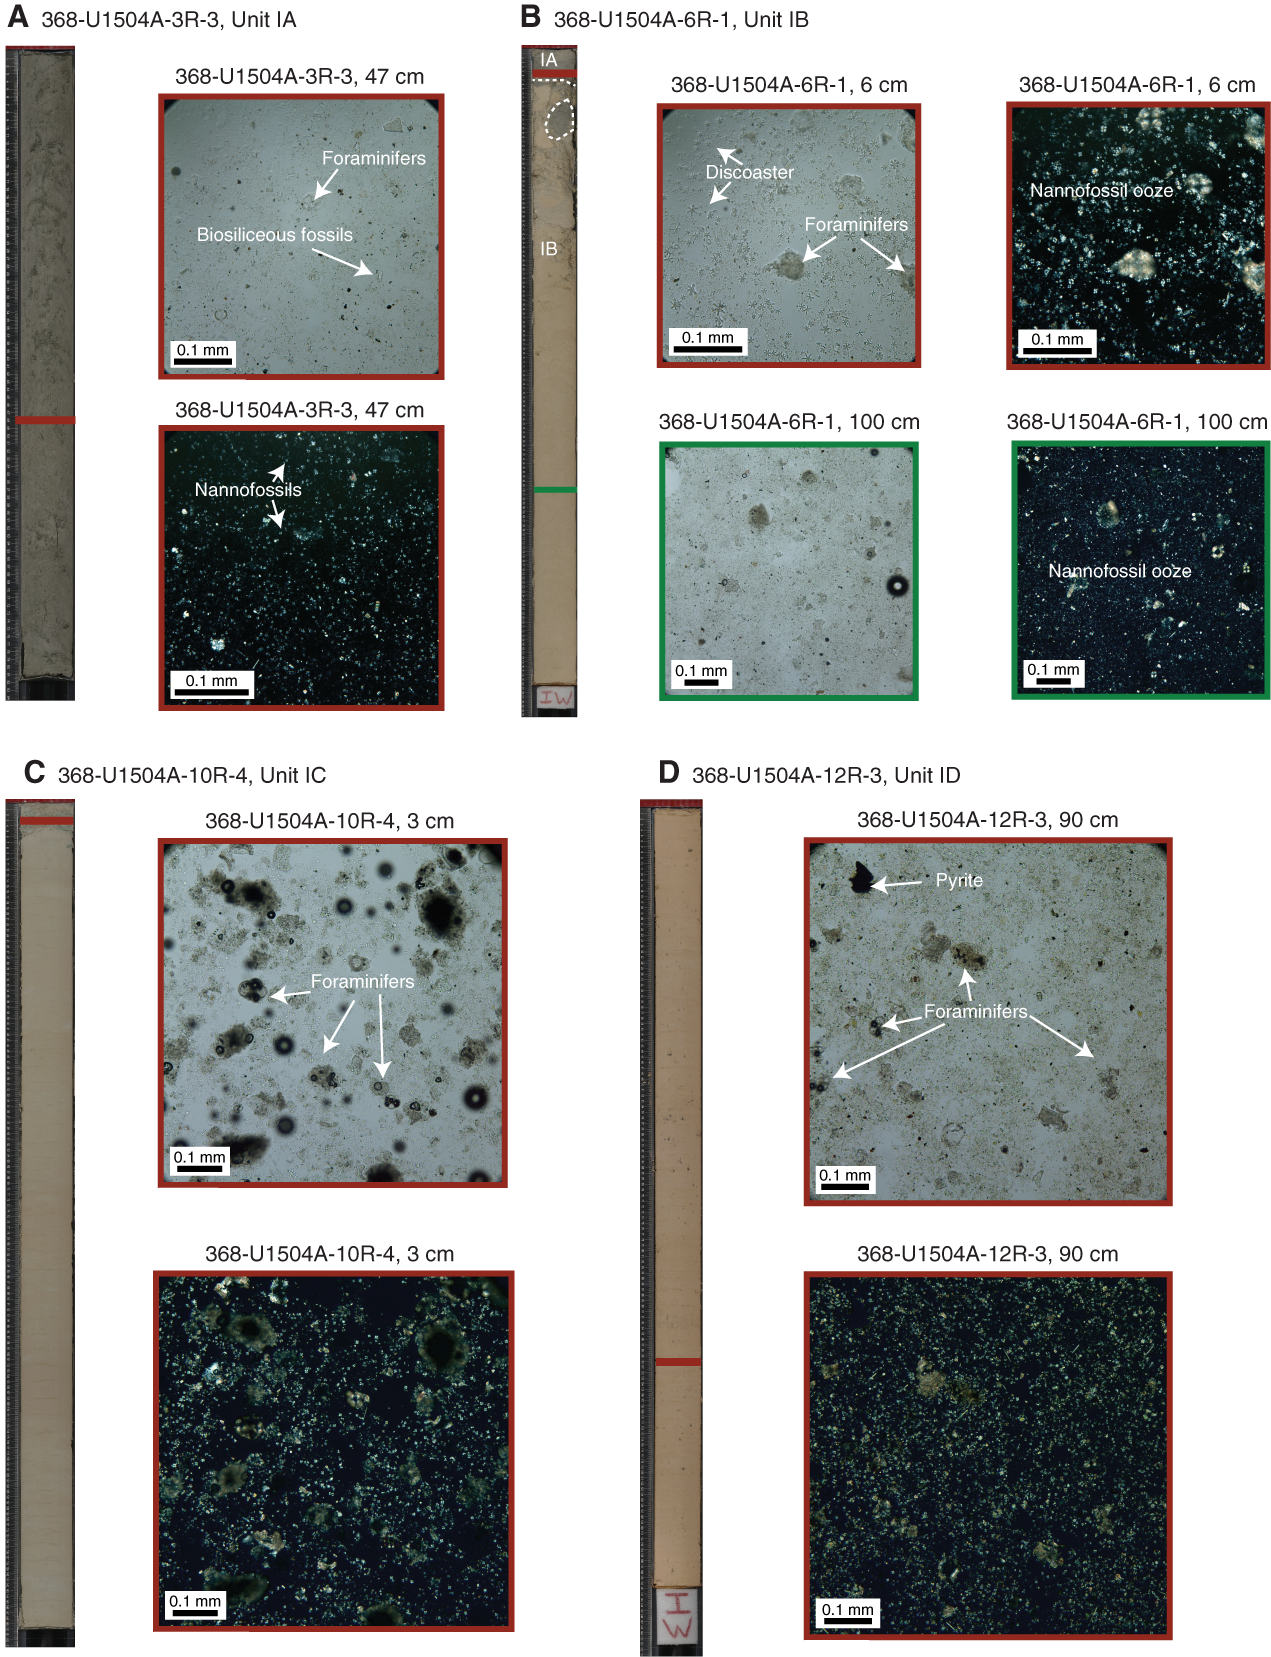
Figure F9. Dark greenish gray nannofossil-rich ooze.
Bioturbation is moderate to heavy. Individual burrows are difficult to distinguish but are mostly horizontal with recognizable Planolites, Thalassinoides, and Cylindrichnus concentricus. Distinct intervals (368-U1504A-3H-3, 0–34 cm, and 3H-4, 107–122 cm) contain more silt, and thin silt laminations are often disrupted by bioturbation (interval 3H-3, 69–56 cm). Layering is contorted at the base of the subunit.
The base of Subunit IA is marked by both a color change from greenish gray to pale brown and light brown sediment in Subunit IB and by a lithologic change that reflects an increase in the percentage of foraminifers. This increase is also seen in the progressive increase in measured carbonate content from an average of ~20 wt% in Subunit IA to an average of ~50 wt% in Subunit IB (Figure F32). Starting from approximately 1 m above this boundary, there is an uphole increase in biogenic silica, including diatoms, sponge spicules, and radiolarians. Below this boundary, Subunit IA is barren of siliceous microfossils.
Subunit IB
Subunit IB is 13.14 m thick and composed of light brown foraminifer-rich nannofossil ooze and pale brown nannofossil ooze with foraminifers (Figures F7, F9). The sediment is well sorted and unlithified. The average grain size is clay, and silt is the maximum grain size. Boundaries are horizontal or irregular. A contorted layer was observed in Section 368-U1504A-6R-4, 65–105 cm, possibly indicating intraformational slumping. Bioturbation is moderate to heavy.
The boundary between Subunits IB and IC is defined by a change from brownish foraminifer-rich nannofossil ooze (Subunit IB) to greenish nannofossil ooze with clay (Subunit IC).
Subunit IC
Subunit IC is 39.19 m thick and composed of light greenish gray, greenish gray, light brownish gray, pale brown, and light gray nannofossil ooze with clay and greenish gray clay-rich nannofossil ooze (Figures F7, F9). These lithologies are intercalated with light gray nannofossil-rich foraminiferal ooze with clay, light brownish gray foraminifer-rich nannofossil ooze, and foraminifer-rich nannofossil ooze with clay. The sediment color is more brownish downhole in the subunit. The sediment is well sorted and slightly consolidated. The average grain size is clay, and very fine sand is the maximum grain size.
Contacts between layers are normally planar and subhorizontal. The bioturbation in Subunit IC sediment is heavy. There are foraminifer-filled burrows, especially in the middle to upper portion of the subunit.
The boundary between Subunits IC and ID is characterized by a change in color from grayish to more brownish in Subunit ID (Figure F7).
Subunit ID
- Intervals: 368-U1504A-12R-1, 19 cm, to 12R-CC, 18 cm; 368-U1504B-2R-1, 0 cm, to 2R-CC, 17 cm
- Depths: Hole U1504A = 104.99–112.66 m; Hole U1504B = 88.20–92.31 m
- Age: early Miocene
Subunit ID is composed of light brown to yellowish brown nannofossil ooze with foraminifers intercalated with pink, pinkish gray, or brownish yellow foraminifer-rich nannofossil ooze (Figures F7, F9, F10). The nannofossil ooze is moderately consolidated and well sorted, with silt as the maximum grain size. Contacts are horizontal and planar. Millimeter-sized pyrite patches (burrows?) are developed on the core surface (Figure F10). There are two large (1–4 cm) pyrite nodules in Section 368-U1504A-12R-5. Pyritized burrows are found in Section 368-U1504B-2R-1.
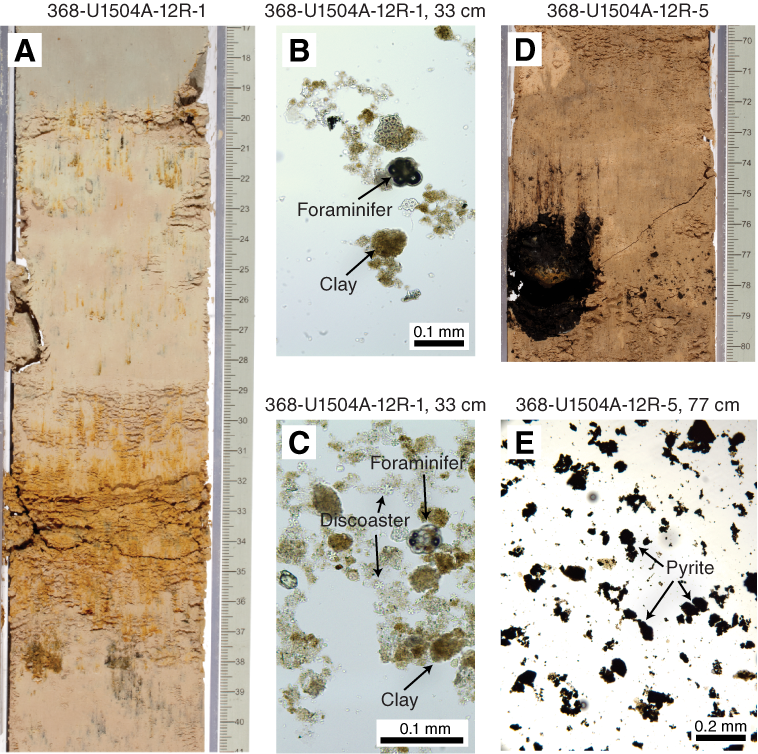
Figure F10. Brownish yellow layer with foraminifer-rich nannofossil ooze.
Bioturbation is high throughout the subunit. The large circular to oval patches 1–4 cm in diameter in the lower portion of Subunit ID are identified as burrows.
The Subunit ID lithology is different from the that of the underlying Unit II. The contact with Unit II was not cored due to low core recovery across this boundary.
Unit II
- Intervals: 368-U1504A-13R-CC, 0 cm, to 15R-1, 64 cm; 368-U1504B-3R-1, 0 cm, to 4R-1, 31 cm
- Depths: Hole U1504A = 114.72–134.80 m; Hole U1504B = 97.90–107.91 m
- Age: Eocene?
Lithology and sedimentary structures
In Hole U1504A, Unit II is 20.08 m thick, but only 1.04 m of sediment was recovered. The upper part of Unit II in Hole U1504A is composed of pink bioclast-rich limestone with clasts of sedimentary and metamorphic origin (interval 368-U1504A-13R-CC, 0 cm, to 14R-1, 12 cm). The lower part is light brownish gray clast-supported limestone with large benthic foraminifers and common epidote grains (Figures F11, F12). The clast-supported limestone is overall poorly sorted and dominated by coarse sand but also contains pebble-sized sedimentary and metamorphic clasts. Shell fragments (bivalves) and large benthic foraminifers (as large as 15 mm) are the main biogenic components. The benthic foraminifers were identified as predominantly Nummulites and Assilina species that give a possible Eocene or slightly younger age for this unit. Some clasts have Fe-Mn coatings (Figure F11).
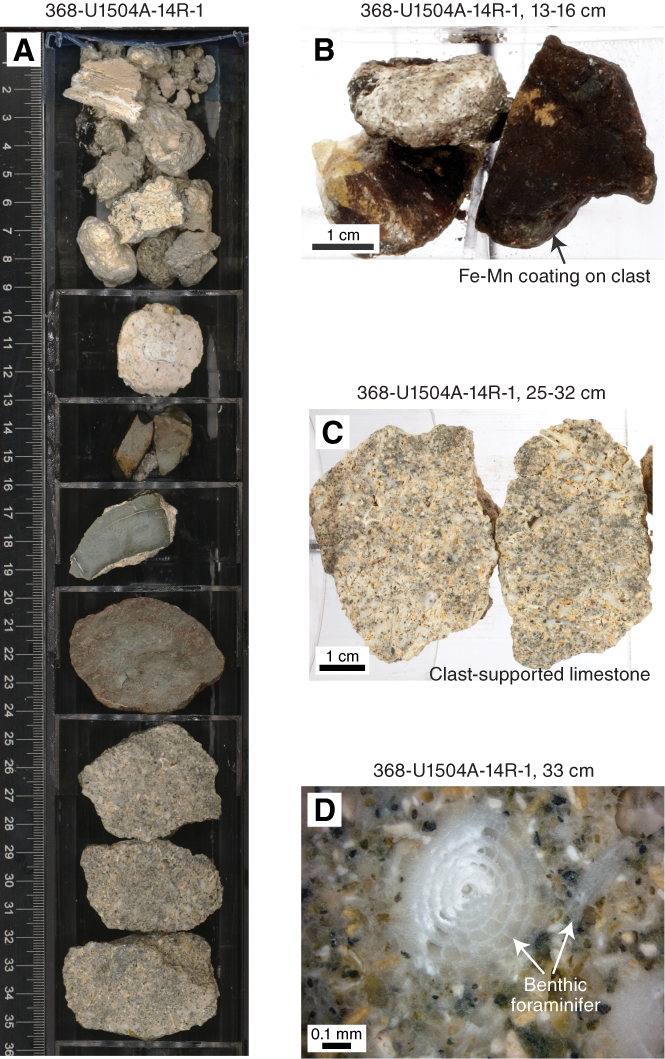
Figure F11. Bioclast-rich and clast-supported limestone.
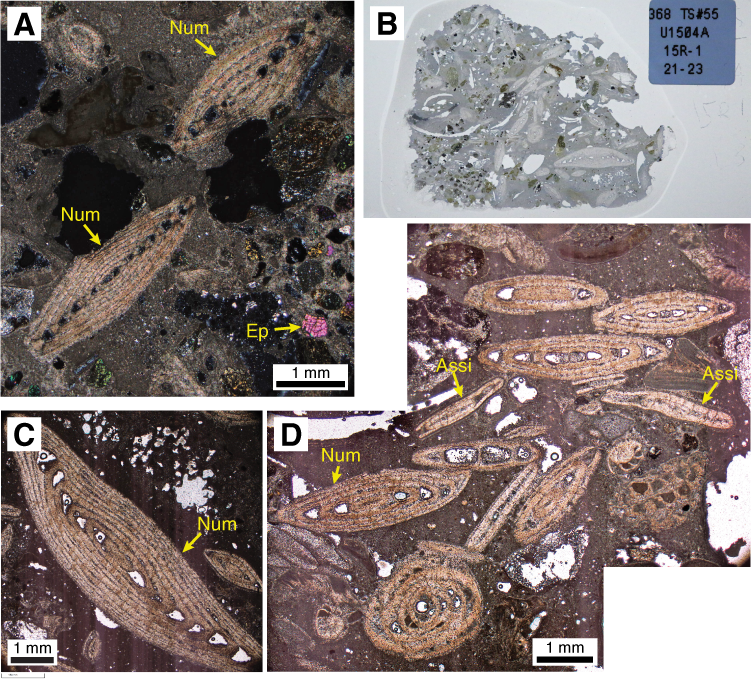
Figure F12. Limestone.
In Hole U1504B, only 47 cm of white and pink limestone was recovered. The limestone is mainly composed of coral fragments, shell fragments, and coated grains. The rock has high porosity and little matrix.
The contact between Units II and III was not recovered.
Bulk mineralogy and chemistry
Compositional analyses of Unit II carbonates were made directly on the archive half of the core using the handheld pXRF (see Igneous and metamorphic petrology in the Expedition 367/368 methods chapter [Sun et al., 2018]) (Table T3). Four representative samples from Unit II and one black-coated clast were analyzed. The limestone has high CaO contents (38–48 wt%), SiO2 contents of 6–19 wt%, and minor Fe2O3 (up to 7 wt%) and MgO (up to 4 wt%) abundances. Sr abundance varies between 183 and 402 ppm, and S abundance varies broadly from 148 to 11632 ppm. The analyses of the black-coated clast support the interpretation of an Fe-Mn coating with high Fe2O3 (~15 wt%) and MnO (~18 wt%) contents. The coating is enriched in trace elements like Ni (1604 ppm), V (1009 ppm), Cu (757 ppm), Sr (1111 ppm), Mo (491 ppm), and Pb (1103 ppm).
Table T3. Major element oxides and minor elements. View table in PDF format. Download table in CSV format.
The bulk mineralogy results of XRD analyses are listed in Table T2. One XRD sample from Unit II indicates that the bulk mineralogy of the limestone is calcite (64%) and plagioclase (22%), with minor amounts of quartz, K-feldspar, and chlorite (Figure F8).
Unit III
- Intervals: 368-U1504A-16R-1, 0 cm, to 21R-1, 40 cm; 368-U1504B-5R-1, 0 cm, to 20R-1, 98 cm
- Depths: Hole U1504A = 136.40–163.70 m; Hole U1504B = 117.40–196.28 m
- Age: unknown (older than Eocene?)
Unit III is 27.30 m thick in Hole U1504A and 78.69 m thick in Hole U1504B. The unit is divided into two subunits, IIIA and IIIB. Subunit IIIA is composed of greenish gray epidote-chlorite schist (with granofels clasts) and epidote-chlorite breccia, and Subunit IIIB is composed of calc-silicate schist (with granofels clasts), epidote-chlorite schist (with granofels clasts), and marble (see Igneous and metamorphic petrology). The schist contains angular, heavily veined granofels clasts. Brittle and ductile deformation structures were observed.
The fine- to coarse-grained rocks are fragmented due to drilling disturbance.
A more detailed macroscopic and microscopic description and interpretation of this unit is provided in Igneous and metamorphic petrology.
Discussion
Depositional environment of Unit I
Lithostratigraphic Unit I at Site U1504 was deposited in a deep-marine environment. The dominant lithology is nannofossil ooze with variable amounts of clay and foraminifers and minor foraminiferal ooze. The top subunit, IA, contains siliceous microfossils, including diatoms, radiolarians, and sponge spicules, except in the lowermost meter below a prominent, steeply inclined silty interval (368-U1504A-5R-1, 100 cm). Lithologic changes between subunits likely reflect variations in the amount of terrigenous input into a relatively open ocean setting, as well as changes in climate and oceanographic conditions. The terrigenous input may be delivered as buoyant plumes from shallower shelf environments. There is little change in the composition of the terrigenous grains, suggesting a common source area throughout Unit I. Thin laminae of silt are found rarely throughout Subunit IA. Some are graded, and all have sharp bases; however, many are disrupted by bioturbation and interpreted as distal turbidites.
Soft-sediment deformation in Subunits IA and IB, including inclined bedding and irregular sediment color boundaries, indicates slumping downslope of parts of the sequence. Bedding below this interval is consistently horizontal, indicating the deformation was synsedimentary.
Depositional environment of Unit II
The dominant lithologies in Unit II are bioclast-rich limestone and clast-supported limestone with large benthic foraminifers. The major skeletal clasts include coarse sand- to pebble-sized corals, large benthic foraminifers (e.g., Nummulites and Assilina), bivalves, and epidote (Figure F11). Nummulites are tropical, shallow-water foraminifers (Beavington-Penney and Racey, 2004). The combination of poorly sorted, subangular, sand- to pebble-sized bioclasts, metamorphic and sedimentary rocks, coral fragments, and large benthic foraminifers suggests deposition in a shallow marine environment. The lithic clasts were most likely derived from adjacent parts of the basement high. The Fe-Mn coating on some of the metamorphic and sedimentary clasts suggests there was a hiatus or reduction in the depositional rate following accumulation of the Unit II sediment. Manganese nodules were also recovered in the Miocene sequence of nearby IODP Site U1435 (Li et al., 2015). Manganese deposits form in sediment-starved settings (Cronan, 1980), which is consistent with the very low sedimentation rates (~0.5 cm/ky) at both Sites U1504 (see Biostratigraphy) and U1435.
Preliminary correlation between Unit I subunits, Sites U1501 and U1504
Sites U1501 and U1504 are located 50.28 km apart on the OMH. Today’s water depths are very similar at Sites U1501 and U1504 (2857 and 2816 m, respectively). The recovered Pleistocene to early Miocene/Oligocene sediment successions can be correlated based on their major lithologies and the age of deposition. We suggest a correlation between Pleistocene Subunit IA (Site U1504) and Pleistocene to Pliocene Subunits IA and IB (Site U1501), which are both dominated by dark greenish gray nannofossil-rich clay and clay-rich nannofossil ooze with siliceous microfossils. At Site U1504, a hiatus is apparent below Subunit IA (see Biostratigraphy). Middle Miocene Subunit IB (Site U1504) correlates well with late to middle Miocene Subunit IC (Site U1501). These subunits are both composed of greenish gray and light brownish gray nannofossil ooze with clay-rich and foraminifer-rich intervals. Middle Miocene Subunit IC (Site U1504) can be correlated to middle Miocene to Oligocene Subunits ID and IE (Site U1501). These subunits are characterized by greenish gray and gray nannofossil ooze with clay.
Igneous and metamorphic petrology
Metamorphic lithologic Unit 1
- Intervals: 368-U1504A-16R-1, 0 cm, to 21R-1, 45 cm; 368-U1504B-5R-1, 0 cm, to 20R-1, 98 cm
- Depths: Hole U1504A = 136.40–163.75 m; Hole U1504B = 117.40–196.28 m
- Thickness: Hole U1504A = 27.35 m; Hole U1504B = 78.88 m
- Lithology: epidote-chlorite schist with granofels clasts, epidote-chlorite breccia, calc-silicate schist with granofels clasts, chlorite granofels, epidote granofels, epidote-chlorite granofels, chlorite schist with epidote, epidote-chlorite gneiss clasts, and marble
- Recovery: Hole U1504A = 19%; Hole U1504B = 21%
- Age: unknown, older than late Eocene
Metamorphic lithologic Unit 1 (lithostratigraphic Unit III) (Figure F13) consists of a variety of metamorphic schistose rocks and granofels clasts. The clasts have variable lithologies but are generally termed granofels due to the lack of foliation. Weak foliation was observed locally in some clasts, but for the sake of simplicity and to mark the contrast with the schist, they were grouped with the unfoliated rocks and we applied the term granofels to those rocks as well. Lithologic changes were encountered with depth and also between the two holes (U1504A and U1504B). Recovery of Unit 1 was poor in both holes (averaging 18.5% and 21%, respectively), with only a limited number of coherent cores. Many of the recovered pieces are small and rounded and do not preserve their original orientation. Metamorphic lithologic Unit 1 is divided into two subunits based on a change in the metamorphic lithology. Subunit 1a was recovered in both Holes U1504A and U1504B and consists of epidote-chlorite schist with granofels clasts and epidote-chlorite breccia. Subunit 1b is defined from interval 368-U1504B-10R-1, 22 cm, through Core 20R and consists of an alternation of calc-silicate schist and epidote-chlorite schist with granofels clasts, epidote and/or chlorite granofels, chlorite schist with epidote, epidote-chlorite gneiss, and minor marble.
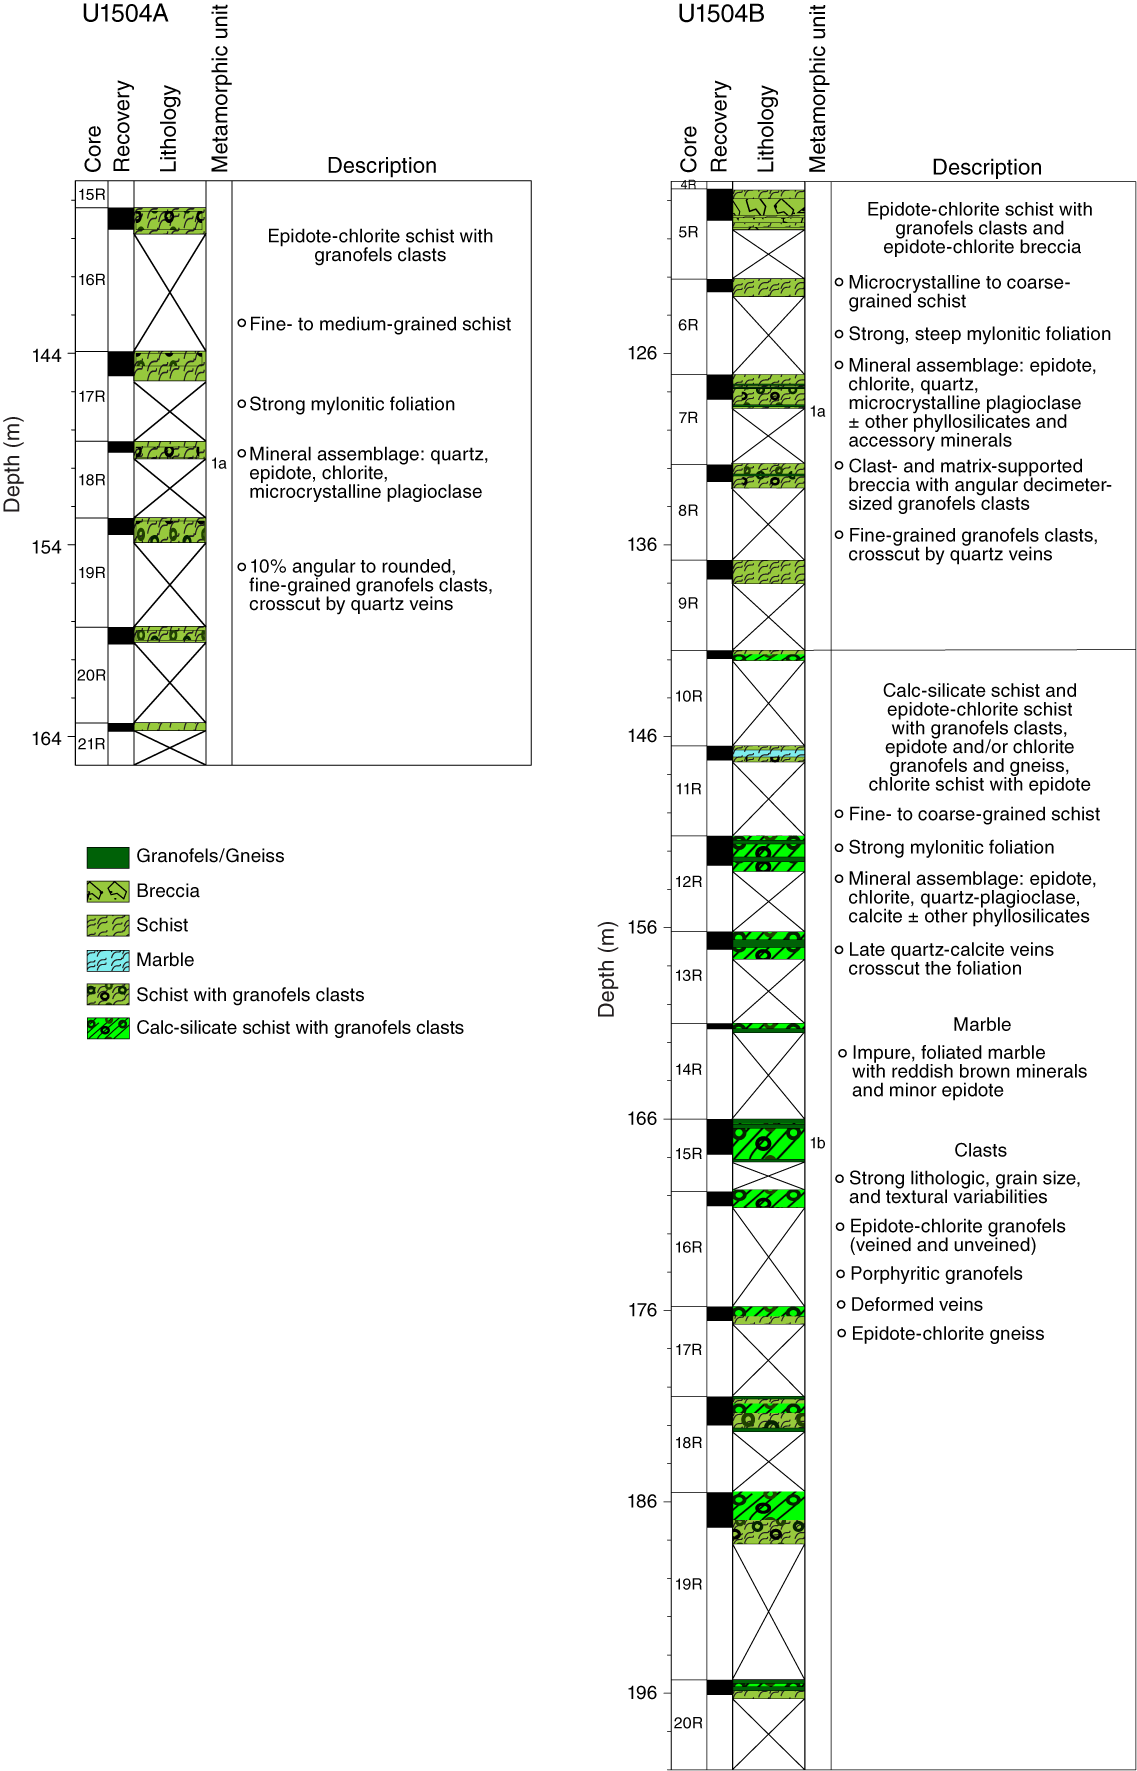
Figure F13. Unit 1 lithostratigraphic summary.
Metamorphic lithologic Subunit 1a
- Intervals: 368-U1504A-16R-1, 0 cm, to 21R-1, 45 cm; 368-U1504B-5R-1, 0 cm, to 10R-1, 22 cm
- Depths: Hole U1504A = 136.40–163.75 m; Hole U1504B = 117.40–141.72 m
- Lithology: epidote-chlorite schist with granofels clasts and epidote-chlorite breccia
Hole U1504A
Subunit 1a in Hole U1504A is composed of strongly deformed greenish gray, fine- to medium-grained epidote-chlorite schist with granofels clasts (Figure F14A). This unit is generally characterized by a mylonitic foliation with a wide geometrical and textural spectrum that is further described in Structural geology. Throughout Cores 16R–21R, the macroscopic mineral assemblage is made up of quartz, epidote, chlorite, and microcrystalline plagioclase (albite?).
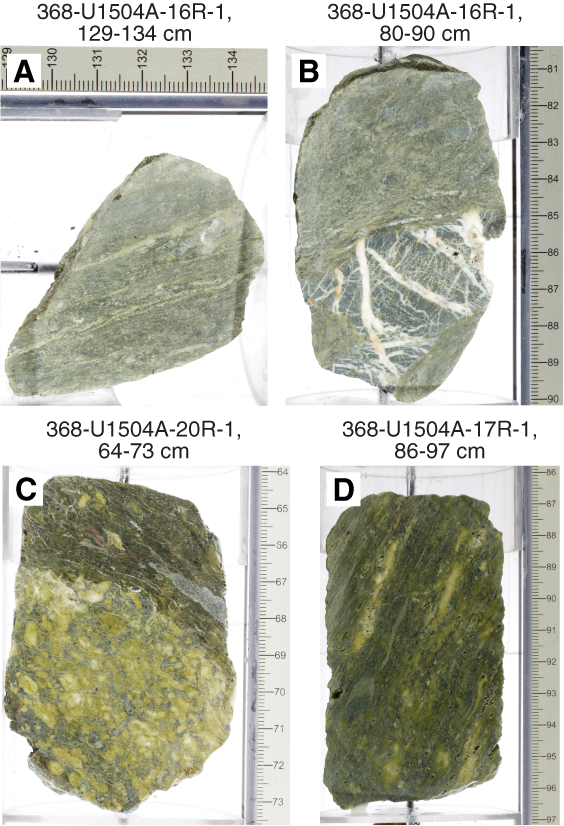
Figure F14. Textural diversity in epidote-chlorite schists.
The schist contains about 10% angular to rounded granofels clasts as large as 6 cm. These clasts are composed of dark greenish gray fine-grained minerals crosscut by abundant quartz veins that show reddish alteration in a few cases (Figure F14B). Minor horizons possibly representing clasts and/or veins have a coarse-grained (0.5–1 cm), patchy texture of epidote, quartz, and most likely chlorite (Figure F14C). Several intervals in Core 17R have small cavities likely resulting from dissolution (Figure F14D).
Hole U1504B
Subunit 1a lithologies in Hole U1504B are generally similar to those in Hole U1504A and characterized by a greenish gray, microcrystalline to coarse-grained epidote-chlorite schist that contains dark greenish gray microcrystalline granofels clasts. The schist and granofels clasts have a comparable mineral assemblage that consists of epidote, chlorite, quartz, and potentially plagioclase ± other phyllosilicates and accessory minerals. Quartz does not usually form part of the original metamorphic assemblage of the granofels clasts but cuts them as veins. The steep (>50°) mylonitic foliation recorded in Hole U1504A was also observed in Hole U1504B, and the intensity of the deformation varies from moderate to strong (see Structural geology). However, Hole U1504B differs from Hole U1504A in several aspects. Isolated subhedral dark minerals can be observed locally within the epidote-chlorite schist (e.g., interval 5R-1, 117–124 cm; Figure F15B). Core 5R recovered epidote-chlorite breccia (Figure F15A) that is clast- to matrix-supported with angular, decimeter-sized clasts made of mainly quartz-veined granofels, although other lithologic varieties were also observed. The granofels clasts in the epidote-chlorite schist seem heterolithic. Notably, granofels clasts are more abundant in Hole U1504B; this finding is emphasized by the recovery of pieces (usually <10 cm) completely made up of such epidote-chlorite granofels clasts. These clasts have generally isotropic textures with only a weakly developed foliation and are either strongly veined as in Hole U1504A or devoid of macroscopic veining. Downhole, some clasts reveal more quartz or calcite veins and/or reddish alteration features (Cores 7R–9R).

Figure F15. Subunit 1a and 1b lithologies.
Microscopic observations
In thin sections, discontinuous, elongated, fine-grained (<100 µm), leucocratic aggregates and bands alternate with very fine grained assemblages of chlorite, epidote, phyllosilicates, and other finer grained minerals, together defining the foliation (Figure F16A, F16B). In detail, the leucocratic bands contain feldspar (plagioclase) and quartz with sparse, very fine grained epidote and other fine-grained minerals such as chlorite. The thickness of the leucocratic and chlorite bands is highly variable in individual samples, resulting in either a more felsic or a mafic overall appearance. Within these bands, coarser grained euhedral epidote as large as 0.3 mm is also abundant, recrystallizing locally into fine-grained mineral aggregates (Figure F16B).
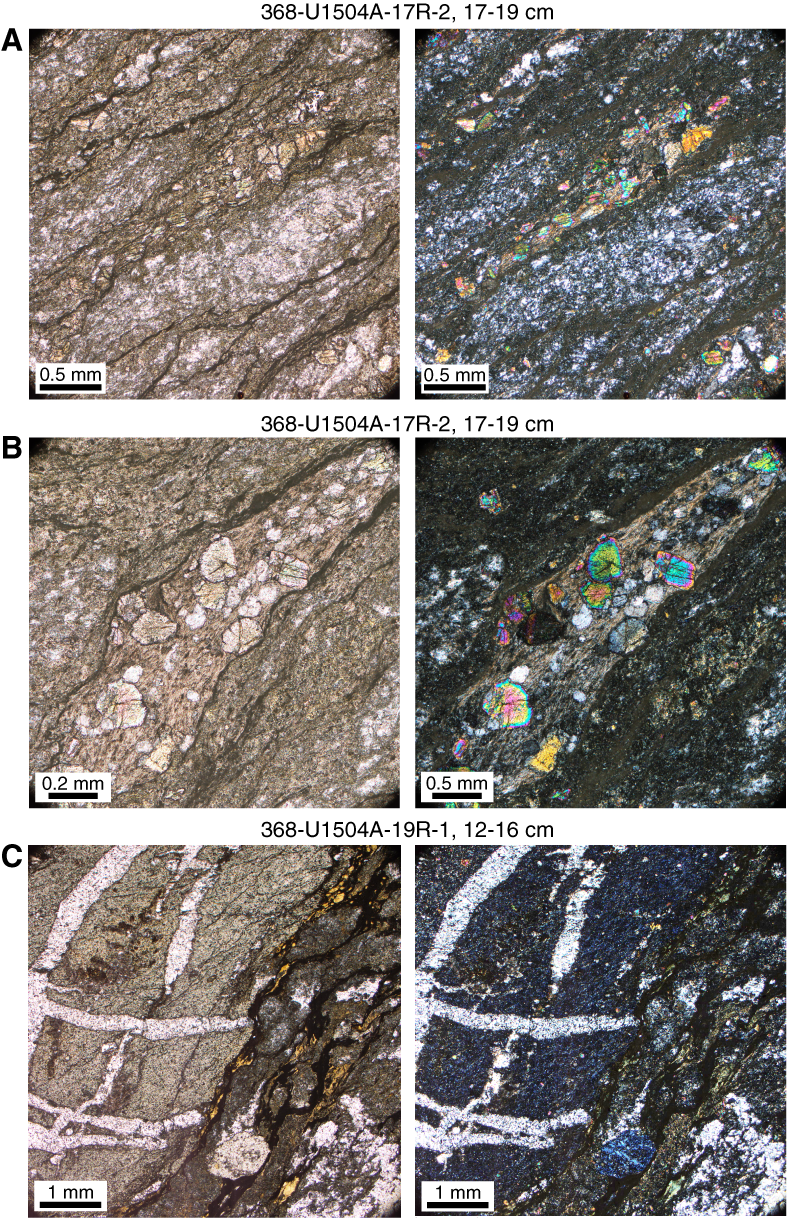
Figure F16. Greenschist facies mineral assemblage, Hole U1504A.
The fine-grained veined clasts within the schist consist of microcrystalline chlorite and epidote with no relics or indicators of a protolithic mineral assemblage and are accordingly termed chlorite-epidote granofels (Figure F16C). Dynamically recrystallized quartz veins crosscut the granofels clasts (see Structural geology for detailed microstructural observations).
In Sections 368-U1504B-5R-1 and 5R-2, dark euhedral–subhedral minerals have characteristics that are consistent with clino- and possibly orthopyroxenes (Figure F17). Clinopyroxenes may be replaced by chlorite (possibly mixed with serpentine) or crosscut by calcite veins.
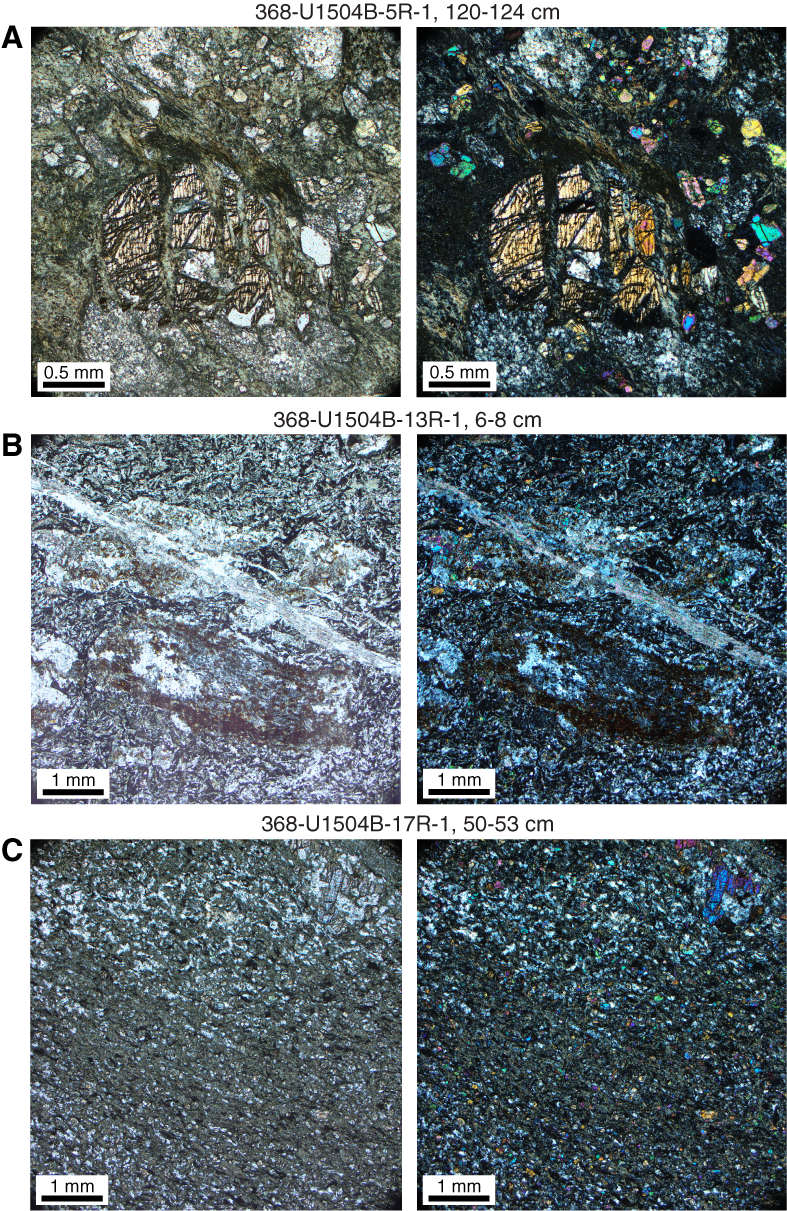
Figure F17. Greenschist facies mineral assemblage, Hole U1504B.
Metamorphic Subunit 1b
- Interval: 368-U1504B-10R-1, 22 cm, to 20R-1, 98 cm
- Depth: 141.72–196.28 m
- Lithology: calc-silicate schist and epidote-chlorite schist with granofels clasts, epidote and/or chlorite granofels, epidote-chlorite gneiss, chlorite schist with epidote, marble
Subunit 1b is only found in Hole U1504B and is marked at interval 10R-1, 22 cm, by the appearance of calc-silicate schists with granofels clasts (Figure F15D) that alternate with the lithologies found in Subunit 1a. Two distinctive intervals were observed: (1) in interval 11R-1, 22–58 cm, an impure foliated marble with reddish brown minerals and minor epidote was identified within the schists (Figure F15C), and (2) in interval 17R-1, 38–92 cm, a locally foliated chlorite schist with epidote was recovered, but it is unclear whether this interval represents a clast (Figure F15E).
The calc-silicate and epidote-chlorite schists are fine to coarse grained with a mostly inequigranular texture. The schistose sections reveal strong mylonitic foliation (see Structural geology). The calc-silicate schists are characterized by the assemblage of epidote, quartz, chlorite, carbonate (e.g., calcite), and plagioclase (possibly albite). Several of the schists show reddish-brown alteration. Late quartz-calcite veins crosscut the foliation of some schists (e.g., in Core 20R).
Subunit 1b is characterized by strong lithologic, grain size, and textural diversity of the clasts embedded in the schist. The clasts are (1) microcrystalline to medium-grained epidote-chlorite granofels like those found in Subunit 1a, either with or without quartz and/or calcite veins (e.g., Figures F14B, F18); (2) porphyritic “granofels” with unknown tabular euhedral to subhedral phenocrysts (possibly altered plagioclase) and in some cases probable vesicles; (3) deformed (epidote, calcite and/or quartz) veins; and (4) epidote-chlorite gneiss. Most of these clasts are locally deformed and foliated according to the mylonitic deformation observed in the surrounding schist and show diffuse boundaries between the clasts and the surrounding schists.
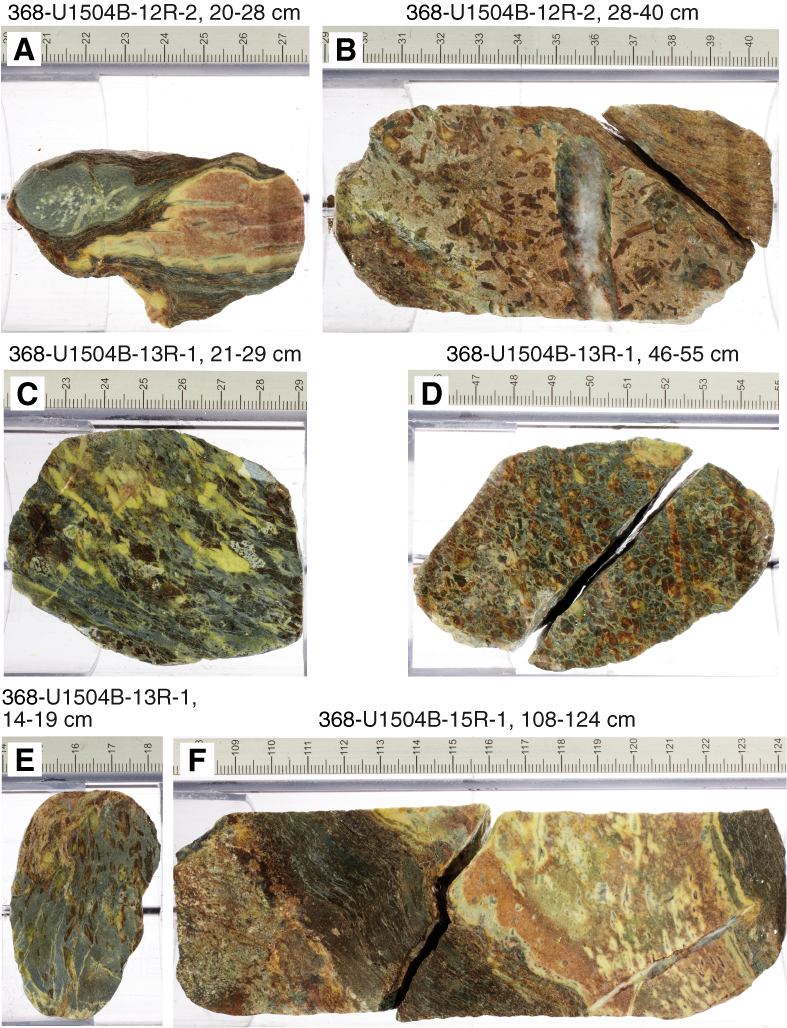
Figure F18. Granofels clasts enclosed in schists.
Microscopic observations
Subunit 1b thin sections reveal the same metamorphic mineralogy as those of Subunit 1a and are dominated by feldspar-quartz, epidote, chlorite, calcite and phyllosilicate, and minor zeolites, oxides, and hydroxides (Figure F17). Based on three thin sections from Cores 368-U1504B-13R, 17R, and 19R, the amount of calcite is variable and may decrease downhole. Bands of phyllosilicate that alternate with commonly elongated and occasionally deformed lens-like aggregates and quartz-rich bands principally define the foliation. The aggregates can also consist of chlorite and some epidote (“epidosite”). Chlorite also occurs in bands and can have an intense brownish-yellow color. In some instances, chlorite (together with zeolite) has completely replaced mafic minerals. The origin of the aggregates or clasts is uncertain, although they seem to be heterolithic and may include various types of mafic igneous rock fragments (phyric or aphyric basalts? dike fragments?) and individual phenocrysts (potentially plagioclase). Epidote is disseminated throughout the matrix and often concentrated in veins, including those that dissect and disaggregate the leucocratic accumulations. The fine-grained chlorite schist with epidote in Core 19R has the same mineralogy and differs principally by its microcrystalline, largely homogeneous texture and the weaker foliation due to the sparseness of phyllosilicate bands, lending a leucocratic appearance.
Bulk mineralogy
XRD analyses of four metamorphic samples from different lithologies within metamorphic lithologic Unit 1 indicate that the bulk mineralogy is predominantly characterized by plagioclase (albite?) ± epidote ± chlorite ± quartz (Table T4). A Subunit 1a chlorite-epidote schist sample (368-U1504A-17R-2, 17–19 cm) contains plagioclase and chlorite. A Subunit 1b brown calc-silicate schist sample (368-U1504B-12R-2, 50–51 cm) contains plagioclase + calcite + epidote with trace amounts of chlorite and a clay mineral (illite-montmorillonite, smectite?). A gray granofels clast sample (368-U1504A-20R-1, 8–11 cm) contains plagioclase + epidote + dolomite with trace amounts of chlorite. A crystal-rich granofels clast sample (368-U1504B-13R-1, 6–7 cm) contains plagioclase + chlorite with trace amounts of epidote, a clay mineral (illite-montmorillonite?), and mica.
Table T4. Mineral percentages. View table in PDF format. Download table in CSV format.
Chemical composition
The handheld pXRF was used to determine the compositional characteristics of the diverse clast and schist lithologies seen in the metamorphic rocks of Unit 1 in Holes U1504A and U1504B. Analyses were made directly on the archive half of the core (see Igneous and metamorphic petrology in the Expedition 367/368 methods chapter [Sun et al., 2018]). A total of 149 representative samples from metamorphic lithologic Unit 1 and two metamorphic clasts from lithostratigraphic Unit II were analyzed (Figure F19; Table T5). The average pXRF sample spacing was ~20 cm within the recovered core material. Unit 1 rocks have a broadly mafic composition with the following contents: SiO2 = 50 ± 3 wt%, MgO = 7 ± 3 wt%, Fe2O3 = 11 ± 4 wt%, Al2O3 = 16 ± 3 wt%, TiO2 = 1.9 ± 0.7 wt%, and CaO = 9 ± 3 wt%. In detail, the Subunit 1a rocks in Hole U1504B tend to have lower Al2O3 and higher MgO, MnO, and Fe2O3 contents compared to those in Hole U1504A (Figure F19A). Furthermore, the schist matrix of Subunit 1a rocks in Hole U1504B, in general, has high S contents (mean = 0.6 wt%; range from below detection limit to almost 3 wt%) compared to the Subunit 1a schists in Hole U1504A (S = <0.25 wt%). In contrast, S is at or below the detection limit (<0.02 wt%) in all Subunit 1b samples.
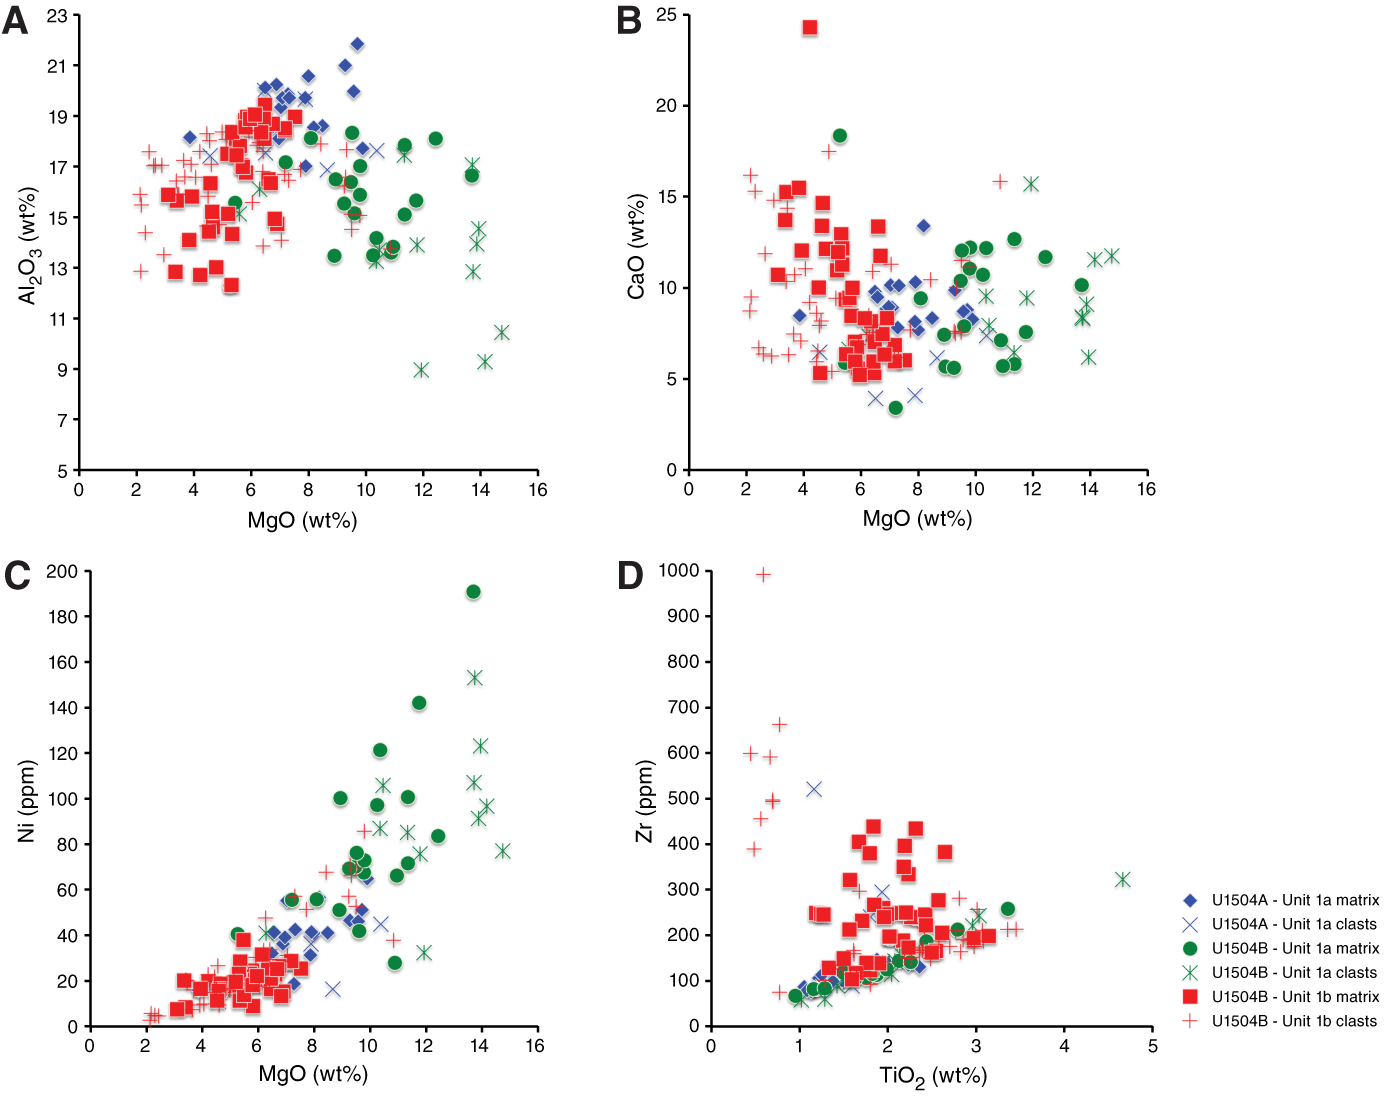
Figure F19. pXRF compositional data.
Table T5. Major element oxides and minor elements in rocks. View table in PDF format. Download table in CSV format.
Within Hole U1504B, the schist matrix of the Subunit 1b rocks has lower MgO (5.5 ± 1.1 wt%) and Ni (20 ± 6 ppm) compared to the schist matrix of the overlying Subunit 1a rocks (MgO = 9.7 ± 2.1 wt%; Ni = 78 ± 40 ppm) (Figure F19C). In detail, Subunit 1b schists show a negative correlation between MgO and CaO (Figure F19B), with the brown foliated calc-silicate schists generally having higher CaO and lower MgO. Subunit 1b rocks are also typically more enriched in Zr relative to Ti (Figure F19D), which is seen in their lower Ti/Zr ratios (56 ± 22) compared to Subunit 1a rocks (85 ± 10).
The textural and mineralogical diversity of clasts within the schist is reflected in their chemical compositions (Figure F19). One lithologically distinctive group of clasts is the coarse-grained brown, dark-green, and yellow green clasts seen, for example, in intervals 368-U1504B-12R-2, 24–28 cm, and 15R-1, 116–122 cm (Figure F18A, F18F). These clasts are also compositionally distinct and have high Zr (390–1000 ppm), low TiO2 (0.4–0.8 wt%), and low MgO (2–3 wt%) (Figure F19). Fine-grained gray granofels clasts ± white veins are common throughout Unit 1 (Figures F14B, F15A, F15D) and in general have compositional features similar to the surrounding schist material (Figure F19). In detail, there are some compositional differences between the granofels clasts in the different subunits and holes. The granofels clasts in Subunit 1a rocks in Hole U1504B have higher MgO and lower Al2O3 contents compared to those in Subunit 1a and 1b rocks in Holes U1504A and U1504B (Figure F19A). The Subunit 1b clasts in Hole U1504B have similar MgO concentrations to the Subunit 1a clasts in Hole U1504A, but they typically show higher MnO contents. A few of the Subunit 1a veined clasts in Hole U1504A have elevated Zr concentrations (as high as 500 ppm) relative to TiO2 (Figure F19D).
Interpretation
Metamorphic lithologic Unit 1 consists of mylonitic, greenschist facies metamorphic rocks, as indicated by the presence of epidote and chlorite. The present mineral assemblage consists of epidote + chlorite + feldspar (plagioclase) ± quartz ± carbonate. The exact protolith of these rocks cannot be determined from the macroscopic and microscopic observations because of the strong and pervasive metamorphic overprint of the samples. We can infer that the protolith most likely was a breccia based on the different clast sizes and observed deformation styles. The pXRF and XRD data indicate a mafic igneous composition for both clasts and schists but reveal a spread from ultramafic (Subunit 1a in Hole U1504B) to more felsic (in Subunit 1b) compositions that are variable within sections and between holes at this site. However, it is unclear if this breccia with mafic clasts has a sedimentary origin (e.g., volcaniclastic) or represents an altered (potentially hydrothermally) form of a basalt, gabbro, or ultramafic protolith. Determination of the exact nature and origin of the clasts will require more detailed postexpedition research. The presence of marble layers is often used as an argument for a metasedimentary origin of a metamorphic sequence. However, the very localized occurrence of marble observed here, as well as its impure character, could also be explained by hydrothermal modification of the protolith. In this context, the calc-silicate schists, which have variable amounts of calcite, could also be consistent with a preexisting hydrothermal breccia matrix cemented by interaction with CO2-rich fluids.
The timing of the metamorphism and its relation to the rifting of the SCS is uncertain. A key observation is that the observed mylonitic foliation is overlain by undeformed Eocene sediments from lithostratigraphic Unit II, which implies that the metamorphism is Eocene or older. Unit 1 could therefore represent an earlier metamorphosed part of the OMH and be a part of the prerift (continental) crust. Metamorphic basement rocks (schists and quartzites) have been recovered in industry wells in the western part of the offshore Pearl River Mouth Basin (Zhou and Yao, 2009) about 200 km west-northwest of Site U1504, where they are inferred to represent the offshore continuation of the early Paleozoic Caledonian fold belt in South China (Li et al., 1989). Metamorphic rocks are also found on the conjugate margin in the northern part of Palawan Island in the Philippines (e.g., Suggate et al., 2014). The Northern Palawan Continental Terrane contains upper Paleozoic to lower Mesozoic metasedimentary rocks (including schists; Sales et al., 1997) that experienced medium-grade regional metamorphism (Suzuki et al., 2000). Alternatively, the metamorphic event might have been related to the SCS rifting. Therefore, metamorphic lithologic Unit 1 might represent either metamorphosed continental crust (sedimentary) or metamorphosed basalts (see Structural geology). Detailed petrological and geochemical examination and accurate dating of the samples will be needed to address the metamorphic history of these rocks.
Structural geology
Site U1504 is located on a basement high ~45 km north of Site U1502 and 50 km east of Site U1501 in a water depth of 2827 m. This basement high may be interpreted as a continuation of the OMH cored at Sites U1501 and U1505.
Lithostratigraphic Unit I structures
Lithostratigraphic Unit I shows evidence for variable bedding dips, locally dipping steeply, associated with possible folds such as those observed in Section 368-U1504A-5R-1 (Figure F20). Such patterns are related to mass movements of unlithified sediments (i.e., slump folding).

Figure F20. Convolutely bedded sequence.
Lithostratigraphic Unit II structures
No deformation structures were observed within lithostratigraphic Unit II.
Lithostratigraphic Unit III structures
Macroscopic description
The mylonitic epidote-chlorite schists and calc-silicate schists that form the metamorphic basement at Site U1504 (see Igneous and metamorphic petrology) consist of epidote + chlorite + quartz + microcrystalline (plagioclase) feldspar ± calcite ± accessory minerals. The rocks preserve distinct deformation structures resulting from changes in the mode of deformation (brittle/ductile); the modal amount of quartz + feldspar governing the (local) rheological behavior; the amount of accumulated strain; the occurrence of variably sized (up to decimeter scale), prekinematic, heterolithic clasts that mostly form rigid (i.e., internally weakly to undeformed) bodies within the ductile foliation; and/or superimposed multiple deformation phases.
In Hole U1504A, measurements of the epidote-chlorite schist mylonitic foliation were often hampered by strong drilling disturbance and poor recovery. Therefore, measurements were only possible in the few continuous pieces recovered in Cores 368-U1504A-16R through 21R. These pieces show evidence for a steeply dipping foliation (as steep as 75°) (Figure F21). This mylonitic foliation is characterized by distinct morphologies: (1) a widely spaced anastomosing foliation associated with leucocratic bands (Figure F22A) and (2) a tight, closely spaced foliation associated with more melanocratic variations. Locally, a crenulation cleavage was observed (i.e., interval 368-U1504A-16R-1, 118–129 cm) (Figure F22B). Because of the combined effects of drilling disturbance and steeply inclined foliation, stretching or intersection lineations were only observed in a few rare cases.
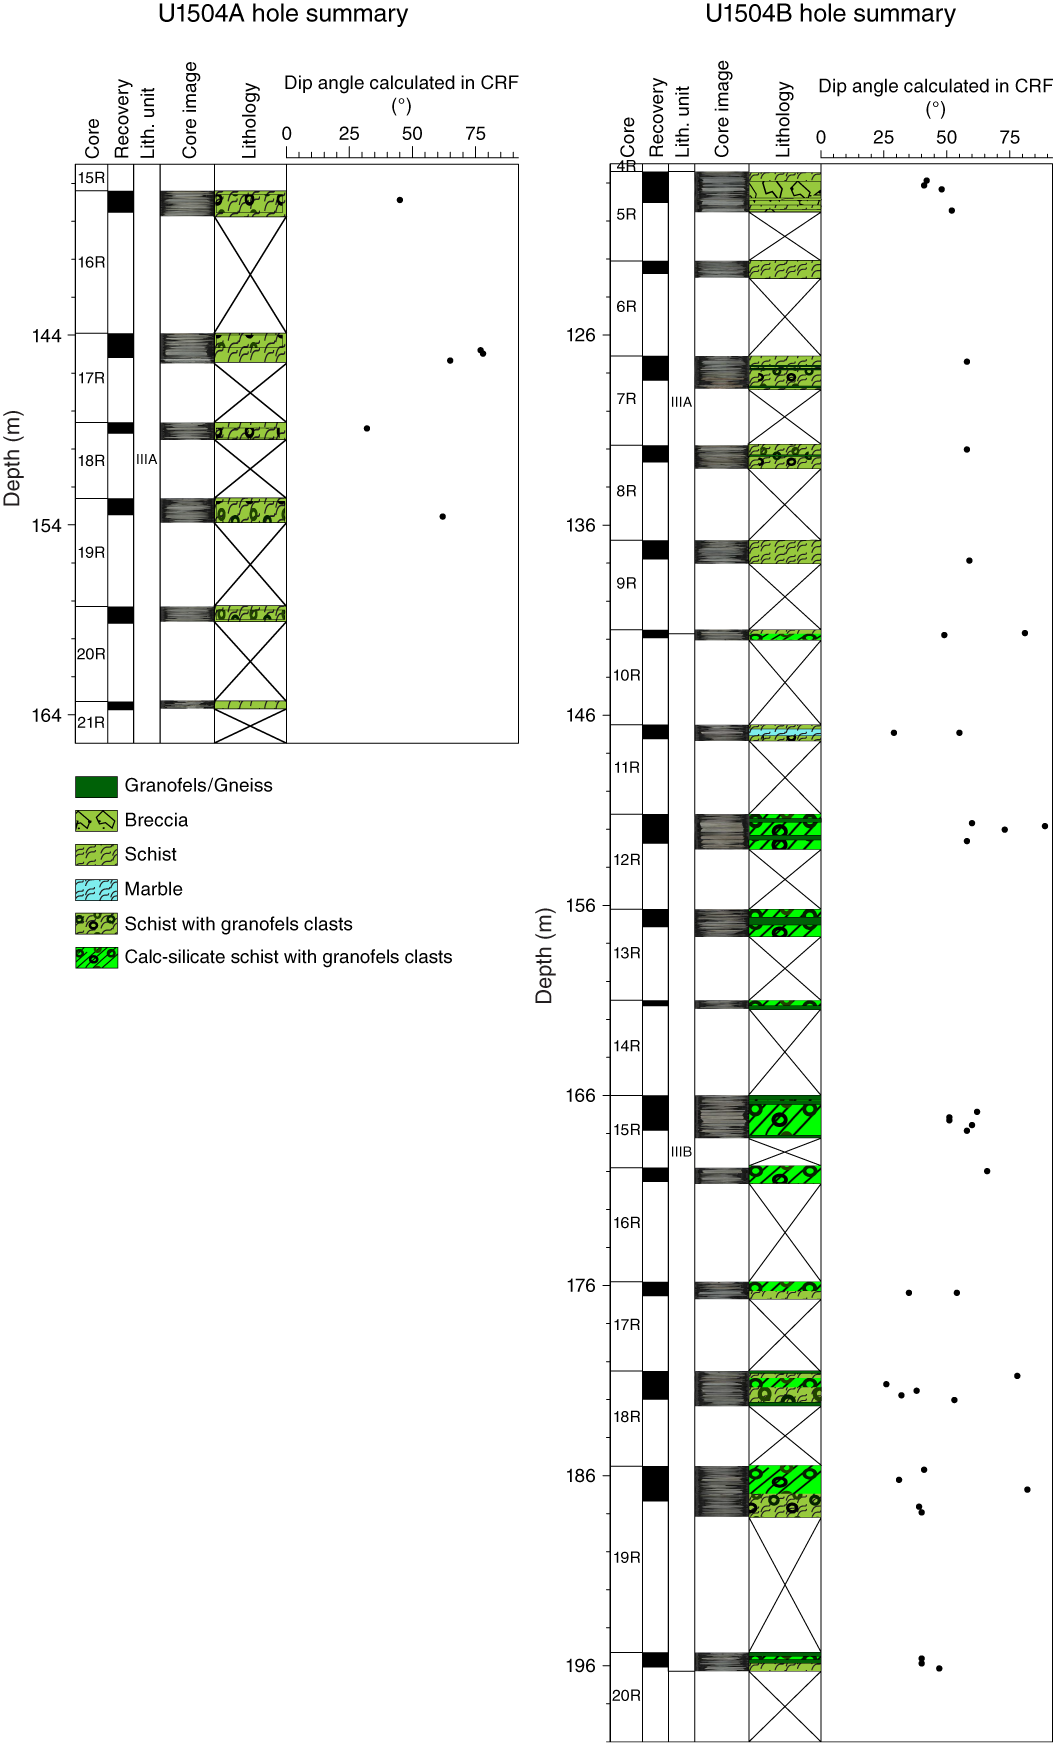
Figure F21. Corrected true dip angles.
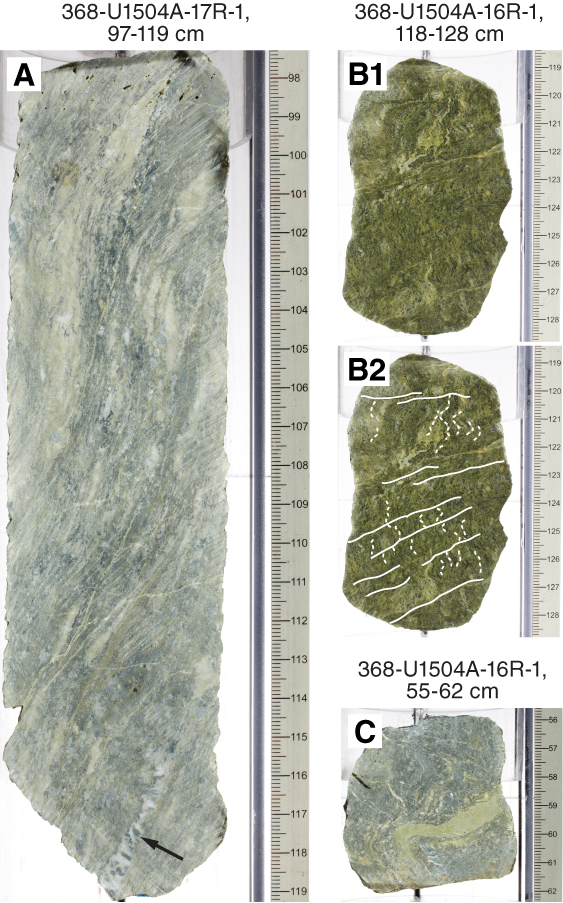
Figure F22. Ductile deformation structures.
Along this unit, angular to rounded chlorite-epidote granofels clasts (see Igneous and metamorphic petrology) are recognized and form rigid bodies within the ductile foliation (Figures F20, F22). Such clasts are consistently dismembered by a network of mostly parallel and perpendicular quartz veins cutting each other. They often form apparently stretched, elongated bodies oriented parallel to the foliation (Figure F22A). This veining is limited to the clasts and is absent from the epidote-chlorite schist. A folded epidote vein was observed within the epidote-chlorite schist in Section 368-U1504A-16R-1 (Figure F22C).
In Hole U1504B, more coherent pieces were recovered, allowing for a more representative record of foliation dips (Figure F21). Throughout Cores 5R through 16R, the mylonitic foliation shows predominantly steep dips >50°, and it tends to be shallower in Cores 17R through 20R, with dips clustering around ~30°–40°. In places, subvertical inclinations were encountered.
Deformation structures in Cores 5R through 9R, which represent lithostratigraphic Subunit IIIA (see Igneous and metamorphic petrology), are generally comparable to those encountered in Hole U1504A, which represent the same subunit. The prominent crenulation cleavage, especially, is a reoccurring feature (Figure F23B). Locally, epidote-chlorite schist split parallel to the xy-plane of finite strain shows sigma clasts and a shear band cutting across a granofels clast, both indicating a normal sense of shear synkinematic with the mylonitic foliation (Figure F23A).
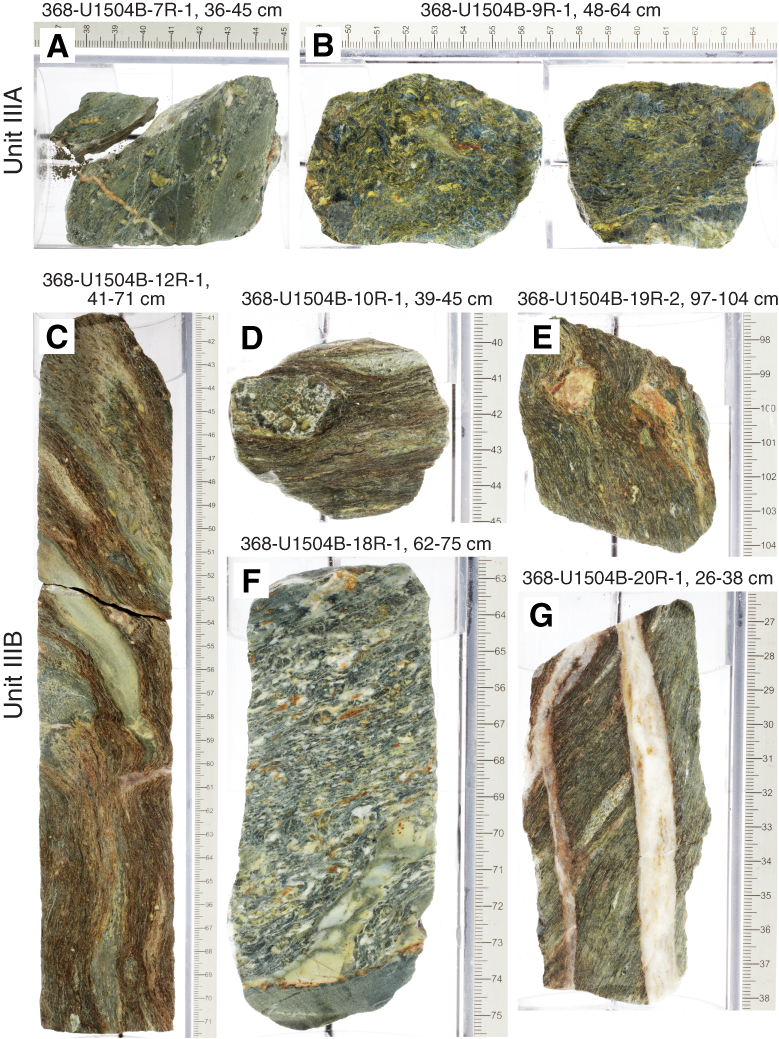
Figure F23. Deformation structures.
Deformation in Subunit IIIB (Cores 368-U1504A-10R through 20R; see Igneous and metamorphic petrology) is presumably strongly controlled by an inherited (protolithic) brecciated structure. The characteristic feature of these mylonites is a tight microcrystalline to medium-grained foliation, locally folded, enclosing heterolithic clasts of various sizes up to the decimeter scale. The clasts most often form rigid, internally weakly to undeformed bodies showing isotropic textures with sharp boundaries with the enclosing foliation (Figure F23D, F23E). However, in some cases and especially at greater depths, the clasts tend to be ductily deformed and elongated within the mylonitic foliation (Figure F23C). These clasts often show diffuse clast boundaries, indicating mechanical and/or chemical clast-matrix interactions.
Another characteristic feature of Subunit IIIB is a general increase of various quartz, calcite, ± epidote veins that can be clearly distinguished between prekinematic (mostly epidote/quartz) veins that are ductily deformed together with the foliation (Figure F23C, F23F) and late to postkinematic slightly deformed to undeformed (calcite) veins cutting the mylonitic foliation (Figure F23G).
Microscopic observations
In thin sections, the mylonitic fabric is defined by alternating bands dominated by fine-grained leucocratic (quartz ± cryptoplagioclase) and mostly chloritic aggregates. The leucocratic bands/aggregates form locally stretched sigma clasts and ductile boudins, whereas fine-grained quartz shows evidence for dynamic recrystallization through both bulging and subgrain rotation recrystallization (Figure F24B). In quartz- to feldspar-rich levels, an anastomosing foliation was locally observed. Some bands are recognized as highly deformed and extensively stretched former chlorite-epidote granofels clasts that partially preserve the original veining (Figure F24A). Chlorite is very fine grained and most probably accommodates a large amount of strain. Within the fine-grained chlorite-dominated bands, coarse-grained subhedral epidote with grain sizes as large as ~0.3 mm is commonly wrapped by the foliation and affected by brittle boudinage and brittle deformation, suggesting a prekinematic to early synkinematic crystallization with respect to the mylonitic foliation (Figure F24C). These boudinaged grains show a prismatic habitus and are aligned within the foliation, whereas other grains are strongly fractured. Locally, the coarse-grained subhedral epidote seems to partially recrystallize into fine-grained minerals and possibly into a second generation of epidote parallel to the foliation (Figure F24D). In more phyllosilicate rich levels, a seemingly pervasive crenulation cleavage is recognized (Figure F24A) that was also macroscopically visible in interval 368-U1504A-16R-1, 118–128 cm (Figure F22B).
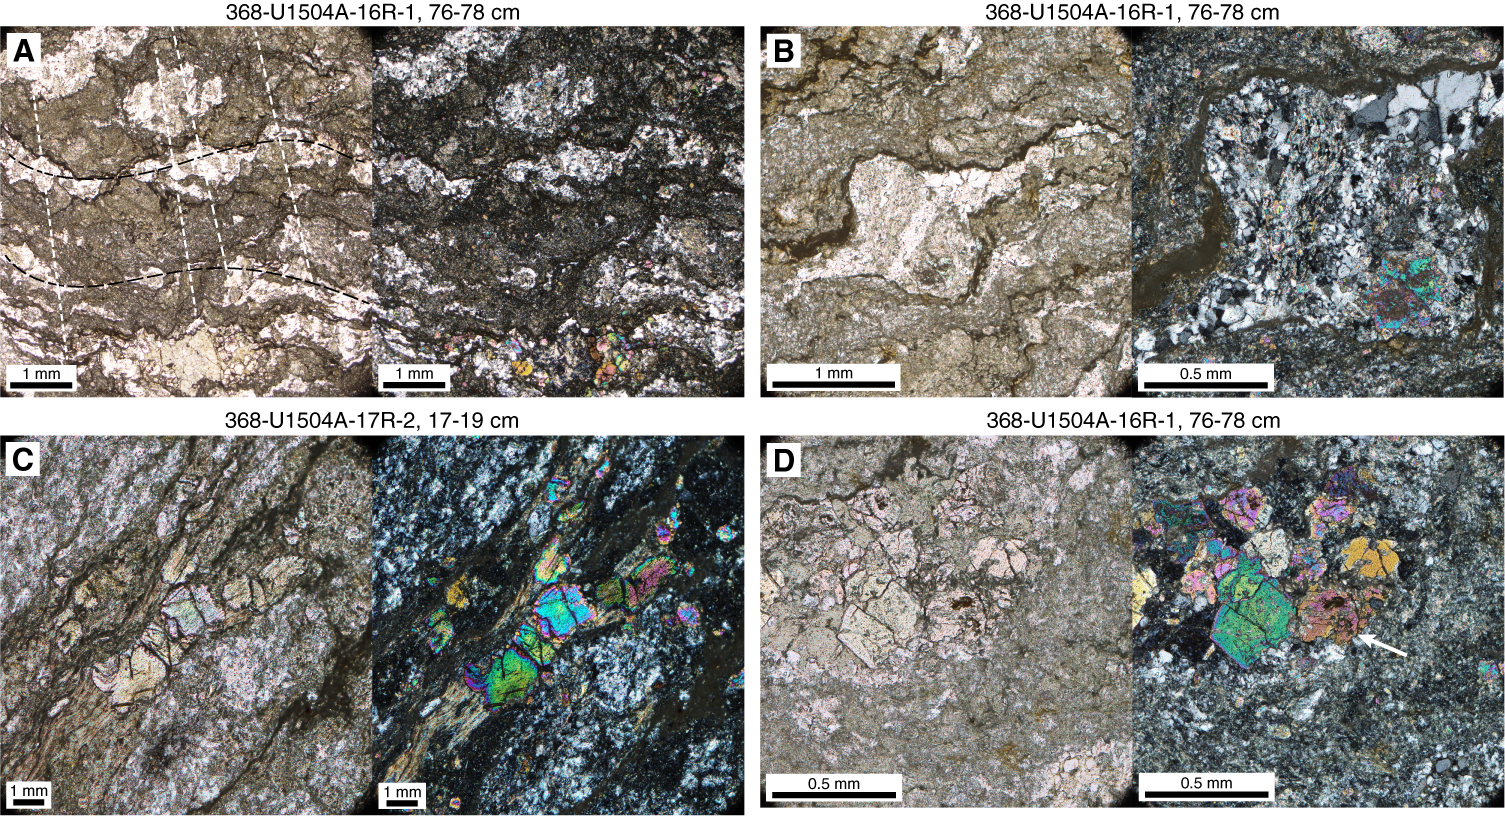
Figure F24. Metamorphic basement.
Interpretation
The Cenozoic sediments encountered at Site U1504 are essentially devoid of deformation structures apart from Cores 368-U1504A-4R and 5R, which are characterized by a convoluted bedding sequence. The formation of this soft-sediment deformation structure most probably involved mass movements related to gravitational instabilities on a slope in close vicinity of the top of this basement-high.
The metamorphic basement recovered at Site U1504 (lithostratigraphic Unit III) underwent a complex history of polyphase metamorphism and deformation. Formation of these rocks may have involved significant fluid-rock interactions that influenced both their chemical composition and rheological behavior.
The observed mylonitic fabric formed at greenschist facies conditions. The occurrence of a seemingly pervasive crenulation cleavage in macro- and microscopic observations on chlorite-rich samples may indicate either a reorientation of the local paleostress field during ongoing deformation or, alternatively, a polyphase structural evolution. A first brittle deformation phase is documented by the presence of strongly veined clasts, indicating possibly an early cataclastic and/or hydrothermal deformation episode, although the clasts themselves might also form part of a coarse (meta-) sedimentary protolith (e.g., a metamorphosed, volcaniclastic conglomerate/breccia). The veining episode apparently postdates a first metamorphic event because associated quartz veins clearly cut the chlorite-epidote granofels without any visible chemical interaction.
The origin of the encountered greenschist facies mylonites and their attribution to either SCS rifting or to Mesozoic or older tectonic events such as the Yenshanian orogeny (Hsieh, 1936) remains unknown at the moment, posing a challenging scientific question for postexpedition research (see Igneous and metamorphic petrology). Solving this question requires a determination of (1) the protolith of the rock, (2) its pressure-temperature (P-T) deformation history, and (3) accurate geochronological constraints. The present-day orientation of the mylonites with foliation dips as steep as 75°, however, seems too steep to represent a synrift, top-basement, low-angle detachment fault that may have exhumed deep crustal levels.
Biostratigraphy
All core catcher samples from Site U1504 were analyzed for calcareous nannofossils, foraminifers, and diatoms. Additional samples were taken from intervals within the working-half core sections when necessary to refine the ages. Preservation of calcareous microfossils is good to very good in Cores 368-U1504A-2R through 12R and Core 368-U1504B-2R and poorly preserved (recrystallization) deeper than Core 368-U1504A-12R, where reefal limestone was sampled. Diatoms were present but poorly preserved in Cores 368-U1504A-2R through 5R and absent from the rest of the samples (Table T6).
Table T6. Distribution of diatoms. View table in PDF format. Download table in CSV format.
Planktonic foraminifers and calcareous nannofossils are abundant in Cores 368-U1504A-2R through 12R and Core 368-U1504B-2R and barren in Cores 368-U1504A-13R through 15R. Twenty biostratigraphic datums were identified in a succession from the late Pleistocene to the early Miocene (Tables T7, T8; Figure F25).
Table T7. Calcareous nannofossil events. Download table in CSV format.
Table T8. Planktonic foraminifer events. Download table in CSV format.
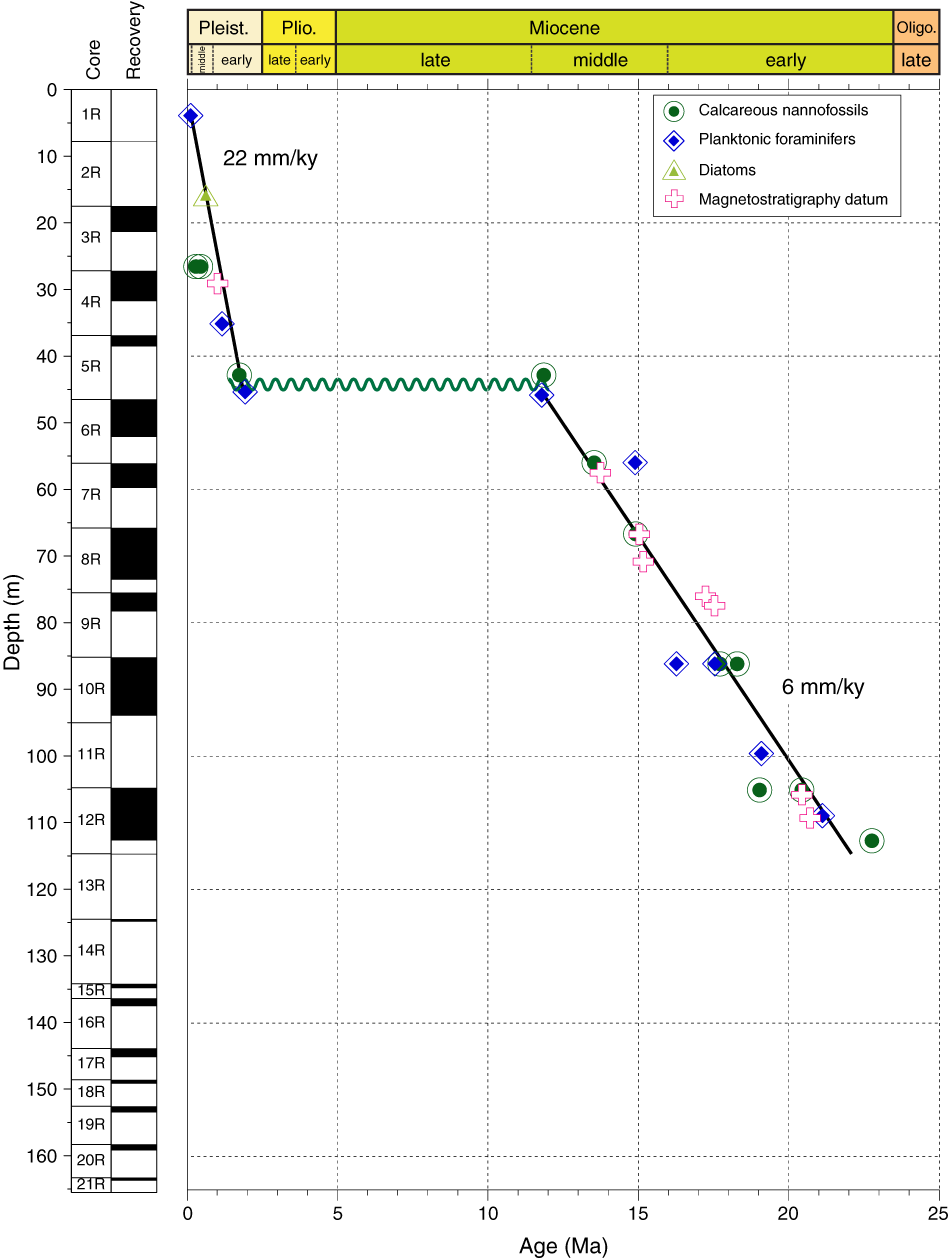
Figure F25. Age-depth model.
A possible hiatus between the early Pleistocene and late Miocene was determined within Core 368-U1504A-6R by abrupt changes in the planktonic foraminiferal and nannofossil assemblages. Based on the site’s biostratigraphy, sedimentation rates are estimated to vary from ~6 mm/ky in the early middle Miocene to ~22 mm/ky during the Pleistocene.
Cores 368-U1504A-13R through 15R are mainly composed of reefal and larger benthic foraminiferal limestone that indicates a warm shallow-marine environment. In contrast, the abundant planktonic foraminifers and calcareous nannofossils in Cores 2R through 12R suggest a deep-sea environment overlying the reefal rocks since the early Miocene.
Calcareous nannofossils
The calcareous nannofossil biostratigraphy for Site U1504 is based mainly on the analysis of all core catcher samples from Hole U1504A (Table T9). To better constrain biostratigraphic events, a number of samples from intervals within cores were analyzed.
Table T9. Calcareous nannofossils. View table in PDF format. Download table in CSV format.
Calcareous nannofossils are very abundant and well preserved in the upper part of the succession (Cores 2R through 12R; 7.85–112.66 m) and become barren from Sample 13R-CC (114.8 m) to the bottom of Hole U1504A. Reworking is common in samples from the Pleistocene, and overgrowth is common in those from early Miocene.
Eleven nannofossil biostratigraphic datums were recognized in the early Miocene through Pleistocene sediment sequence at Site U1504 (Table T7). The Pliocene and late Miocene nannofossil Zones NN18 through NN7 are missing in Hole U1504A, but some specimens of those periods, such as Discoaster brouweri, Discoaster pentaradiatus, Discoaster quinqueramus, Discoaster berggrenii, Reticulofenestra pseudoumbilicus, and Sphenolithus spp., were observed in the Pleistocene samples. The oldest nannofossil event identified at Site U1504 is the occurrence of Sphenolithus disbelemnos (its first occurrence datum [FAD] dates to 22.76 Ma), which was observed in the lowermost nannofossil-bearing sample at 112.66 m, indicating an early Miocene age of <22.76 Ma.
Pleistocene
The top of Hole U1504A (Samples 2R-CC to 5R-CC; 7.85–38.53 m) is dated as late Pleistocene based on the presence of Emiliania huxleyi (marker species for Zone NN21). The last occurrence datum (LAD) of Pseudoemiliania lacunosa in Sample 4R-CC (31.75 m) defines the top of Zone NN19. Zone NN19 is further divided by the FAD of medium Gephyrocapsa spp. (>4 µm) in Sample 5R-CC (38.53 m).
Middle to early Miocene
Three events were observed in the middle Miocene strata of Hole U1504A. The top of Zone NN6 is marked by the LAD of Cyclicargolithus floridanus (11.85 Ma) in Sample 6R-1, 60–61 cm (47.1 m). The top of Zone NN5 is defined by the LAD of Sphenolithus heteromorphus (13.53 Ma) in Sample 7R-CC (59.78 m). The top of Zone NN4 is defined by the LAD of Helicosphaera ampliaperta (14.91 Ma) in Sample 8R-CC (73.56 m). The middle/early Miocene boundary is assigned between Samples 8R-CC (73.56 m) and 9R-CC (78.31 m).
Three events were observed in the early Miocene strata of Hole U1504A. The top of Zone NN2 is marked by the LAD of Triquetrorhabdulus carinatus (18.28 Ma) in Sample 10R-CC (93.96 m). The FADs of Sphenolithus belemnos (19.03 Ma) and H. ampliaperta (20.43 Ma) apparently co-occur in Sample 12R-1, 3–5 cm (104.85 m). The occurrence of S. disbelemnos (its FAD dated to 22.76 Ma) was observed in Sample 12R-CC (112.66 m), which lies immediately above the nannofossil-barren interval that extends down to the bottom of this hole, indicating an age younger than 22.76 Ma at this depth.
The sole sediment core catcher sample above a coral reef limestone in Hole U1504B (2R-CC; 92.37 m) yielded a nannofossil assemblage similar to that of Sample 368-U1504A-12R-CC. An age of 20.43–22.76 Ma was assigned to this depth based on the occurrence of S. disbelemnos and the absence of H. ampliaperta.
Planktonic foraminifers
All core catcher samples and two additional samples from the working-half cores from Holes U1504A and U1504B were processed for planktonic foraminiferal analyses (Table T10). Planktonic foraminifers are well preserved and abundant in samples from Cores 368-U1504A-2R through 12R and Core 368-U1504B-2R and barren in Cores 368-U1504A-13R through 15R.
Table T10. Planktonic foraminifers. View table in PDF format. Download table in CSV format.
Nine planktonic foraminiferal datums were recognized in Hole U1504A, spanning from the early Miocene (>21.12 Ma) to the late Pleistocene (Table T8). The planktonic foraminiferal biostratigraphy for Hole U1504A was established based on these events and the planktonic foraminiferal assemblages at successive depth intervals.
The Pleistocene planktonic foraminifers are composed of Globigerinoides ruber, Globigerinoides sacculifer, Globigerinoides conglobatus, Globorotalia menardii, Pulleniatina obliquiloculata, Neogloboquadrina dutertrei, and Orbulina universa. The LAD of pink G. ruber (0.12 Ma) and the FAD of pink G. ruber (1.16 Ma) are placed within Sample 2R-CC and between Samples 4R-CC and 5R-CC, respectively. The FAD of Globigerinoides truncatulinoides (1.93 Ma) is located between Samples 5R-CC and 6R-CC. However, no Pliocene or late Miocene planktonic foraminiferal datum was recognized due to the distinct faunal changes between Samples 5R-CC and 6R-CC from the middle Miocene assemblage to the Pleistocene assemblage. The middle Miocene foraminiferal assemblages are dominated by Dentoglobigerina altispira, Globoquadrina dehiscens, Globoquadrina venezuelana, Globoquadrina baroemoenensis, and Praeorbulina circularis/glomerosa. The LAD of Fohsella fohsi (11.79 Ma) is located between Samples 5R-CC and 6R-CC. The LAD of P. circularis (14.89 Ma) is located between Samples 6R-CC and 7R-CC and marks the boundary of Zones N8 and N7. Both the FAD of P. glomerosa (16.27 Ma) and the LAD of Catapsydrax dissimilis occur between Samples 9R-CC and 10R-CC, suggesting the middle/early Miocene boundary within Core 10R.
The early Miocene planktonic foraminifers are characterized by G. dehiscens, G. venezuelana, and Paragloborotalia mayeri. The LAD of C. dissimilis (17.54 Ma) is located between Samples 9R-CC and 10R-CC and indicates the boundary of Zones N7 and N6. The LAD of Globoquadrina binaiensis (19.09 Ma) is located between Samples 12R-1, 3–5 cm, and 12R-1, 40–42 cm. The LAD of Paragloborotalia kugleri (21.12 Ma) is located between Samples 12R-1, 40–42 cm, and 12R-CC and indicates the boundary of Zones N5 and N4.
In Hole U1504B, only one soft-sediment core was obtained above the coral reef limestone. The occurrence of P. kugleri and G. dehiscens in Sample 368-U1504B-2R-CC constrains the age between 21.12 and 22.44 Ma, which corresponds to the age of Sample 368-U1504A-12R-CC (Table T8).
Benthic foraminifers
Larger benthic foraminifers were observed in samples from Core 368-U1504A-14R (Figure F26) and Sample 15R-1, 21–23 cm (Figures F12, F27; see Lithostratigraphy), including Nummulites and other genera that indicate an Eocene or slightly younger age and a warm, shallow-marine environment.
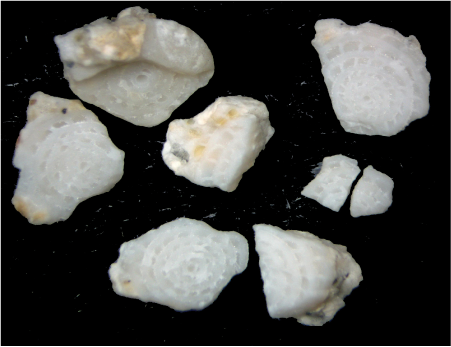
Figure F26. Benthic foraminiferal fragments.
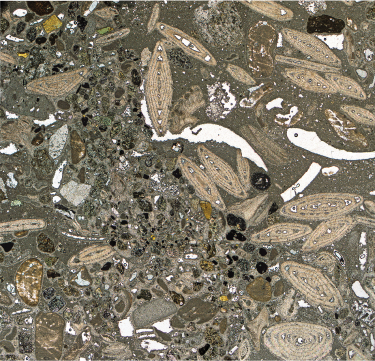
Figure F27. Abundant benthic foraminifers.
Diatoms
All of the core catcher samples from Hole U1504A and one from U1504B were processed into smear and strewn slides for diatom analysis. Three additional toothpick samples were taken from selected intervals of the working-half cores for better resolution. Samples 368-U1504A-2R-CC, 3R-CC, and 4R-CC are composed of between 10% and 90% diatoms with poor preservation. The rest of the core catcher samples from Cores 5R through 12R were barren of diatoms (Table T6). Samples 2R-CC, 3R-CC, and 4R-CC contain a typical late Pleistocene (Table T11) tropical-subtropical diatom assemblage such as Fragilariopsis doliolus and Nitzschia interruptestriata. Fragilariopsis reinholdii (LAD = 0.62 Ma) was not observed in Sample 4R-CC, suggesting an age younger than 0.62 Ma.
Table T11. Diatom biostratigraphic event. Download table in CSV format.
Paleomagnetism
Shipboard measurements
Shipboard paleomagnetic investigations combined two complementary approaches (see Paleomagnetism in the Expedition 367/368 methods chapter [Sun et al., 2018]): (1) measurement and in-line AF demagnetization of archive-half sections on the pass-through 2G Enterprises SRM at 2.5 cm spacing and (2) measurement and AF demagnetization of oriented discrete samples on the spinner magnetometer (AGICO JR-6A). Thirteen representative discrete samples from sedimentary units and four from basement were collected for AF demagnetization.
We used scalar data from discrete samples from AF demagnetization up to 120 mT to assess the nature of the magnetic assemblage. We used the directional and intensity data of archive-half sections, measured after in-line AF demagnetization (up to 15 mT), to determine magnetic polarity along the core. Directional data were analyzed using Zijderveld diagrams (Zijderveld, 1967), and characteristic remanent magnetization (ChRM) direction(s) were calculated by principal component analysis (PCA) (Kirschvink, 1980) using PuffinPlot (version 1.03, April 23, 2015) (Lurcock and Wilson, 2012).
Demagnetization behavior and implications for magnetic assemblages
Sediment
- Units: I and II
- Depths: Hole U1504A = 17.50–134.80 m; Hole U1504B = 88.20–107.91 m
- Sections 368-U1504A-3R-1 through 15R-1 and Cores 368-U1504B-2R through 4R
Most of the 13 discrete samples investigated show soft magnetic behavior characterized by loss of >50% of NRM below 20 mT (Figure F28). This low coercivity (soft behavior) justifies the steps chosen for in-line stepwise demagnetization (0, 5, 10, and 15 mT) on the SRM. Most discrete samples also display a gain in magnetization above 70 mT, up to 30% of the NRM, which is interpreted as resulting from GRM. Both greigite and pyrrhotite are known to display this behavior in marine sediments (e.g., Thompson, 1990; Roberts et al., 2011); however, greigite is more likely in shallow-marine sediments and has already been identified in lithostratigraphic Unit I in nearby Hole U1501C (see Paleomagnetism in the Site U1501 chapter [Larsen et al., 2018a]). Steep normal inclinations (≈60°) across all units suggest magnetic drilling overprint (Figure F29) that is easily removed by demagnetization to 10 mT (Figure F28). This behavior is consistent with the presence of a low-coercivity phase, such as relatively coarse grained titanomagnetite, in the sediments.
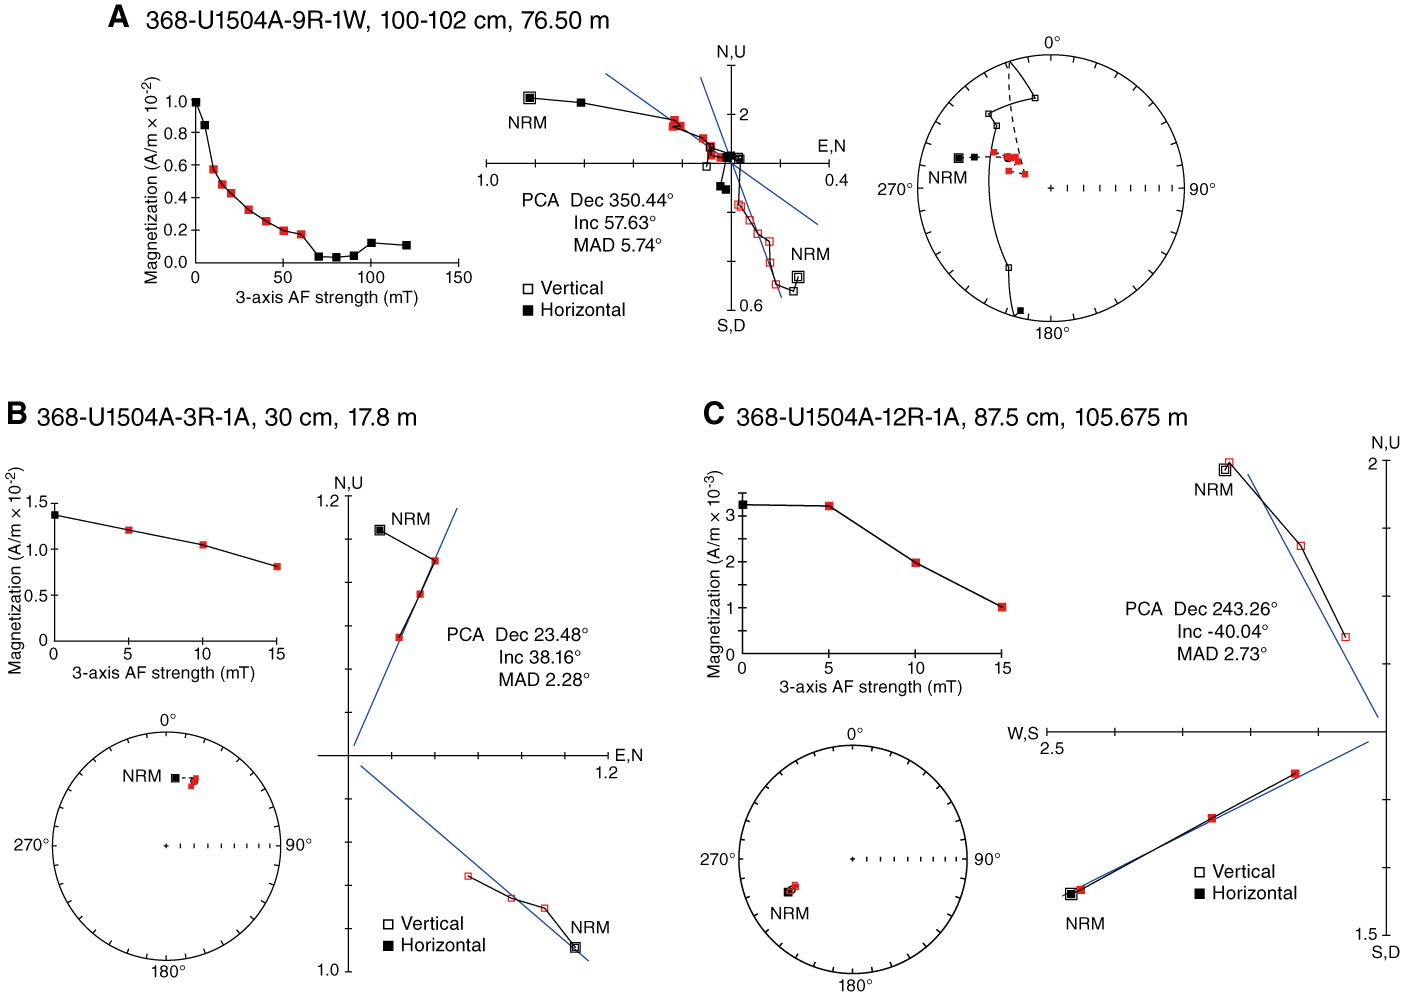
Figure F28. AF demagnetization.
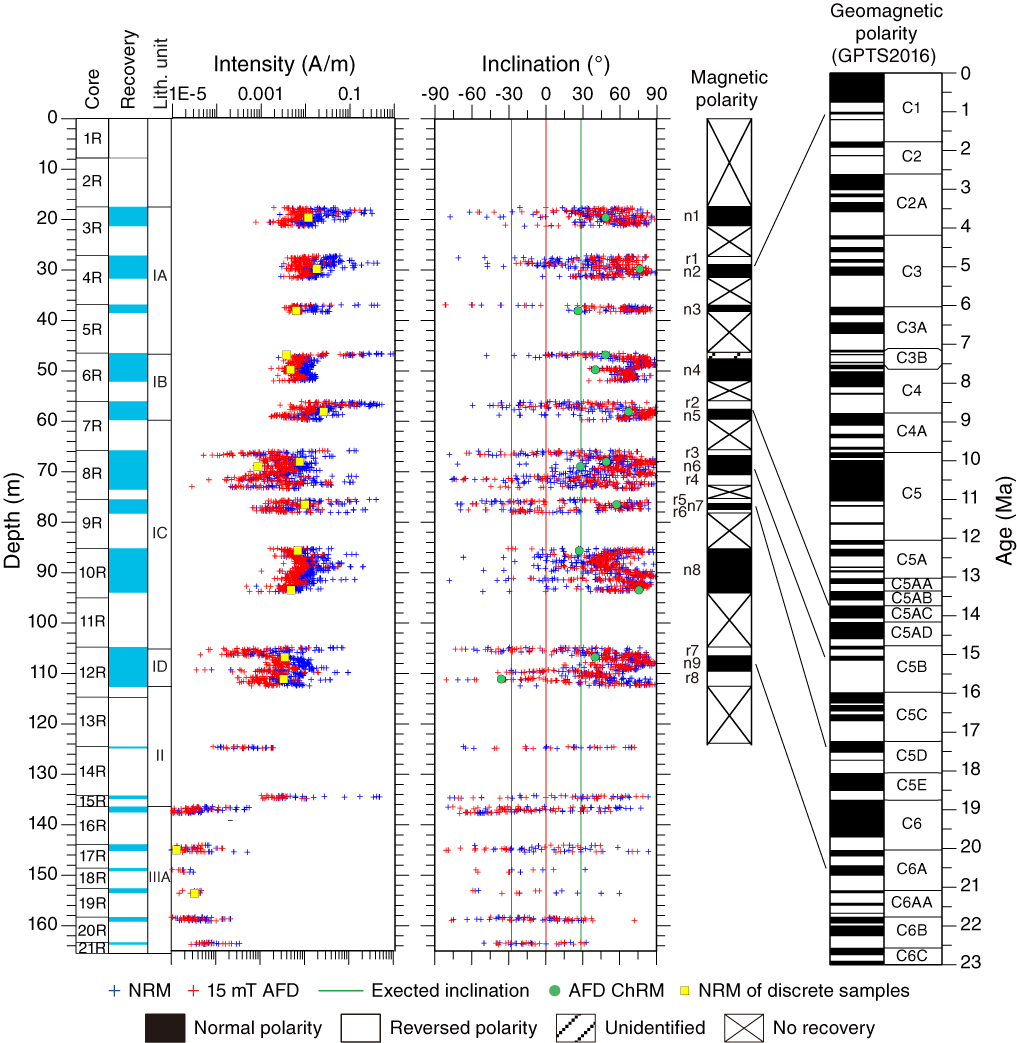
Figure F29. Paleomagnetic measurements.
The core sections measured by in-line AF demagnetization on the SRM confirm the relatively soft demagnetization behavior observed on the discrete samples. Stepwise demagnetization up to 15 mT effectively removed the drilling overprint and allowed delineation of several reversals (Figure F29).
Basement rocks
- Unit: III
- Depths: Hole U1504A = 136.40–163.70 m; Hole U1504B = 117.40–196.28 m
- Cores 368-U1504A-16R through 21R and 368-U1504B-5R through 20R
NRM intensities of basement rocks were measured on the SRM (archive-half Cores 368-U1504A-16R through 21R) and on the JR-6A spinner magnetometer (four discrete cubes, 8 cm3 each). The intensities of magnetization are low (average = 78 × 10−6 A/m). Some of the discrete samples were not demagnetized because of their low NRM intensity (Figure F29), which requires measurements in a shielded laboratory.
Magnetostratigraphy
Inclination, declination, and intensity in Hole U1504A are reported in Figure F29. We constructed the magnetostratigraphy based on the polarity assigned to the archive-half cores, which was corroborated by directions obtained from oriented discrete samples. A succession of nine normal and eight reversed intervals was recognized. We tentatively correlated the magnetostratigraphic data in Hole U1504A to the standard timescale (Ogg et al., 2016) according to initial biostratigraphy age constraints reported in Table T12 and Figure F25.
Table T12. Paleomagnetic age datums. Download table in CSV format.
Anisotropy of magnetic susceptibility
Sediment
The 13 discrete samples have magnetic susceptibilities (κ) ranging from ≈60 × 10−6 to 405 × 10−6 SI. These low κ values combined with the low NRM suggest that the magnetic susceptibility is controlled by both paramagnetic silicates (e.g., clays and chlorite) and ferromagnetic phases (e.g., greigite and magnetite). The degree of magnetic anisotropy (P ′) is moderate (~1.025), whereas the AMS fabric is strongly oblate as shown by shape parameter (T), most likely of depositional origin. The Fisher distribution of AMS principal axes also suggests an oblate fabric (Figure F30) with a nearly horizontal planar fabric. These sedimentary fabrics are consistent with deposition in a calm, pelagic environment with very limited traction on sedimentary particles.
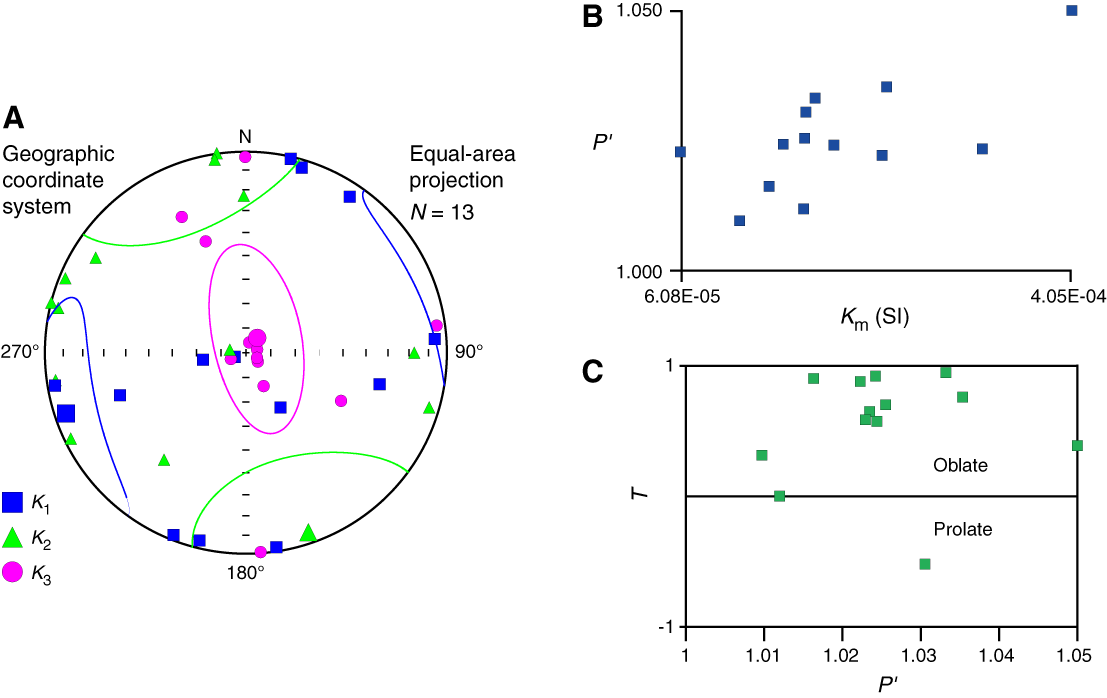
Figure F30. Sediment AMS data.
Basement rocks
- Unit: III
- Depths: Hole U1504A = 136.40–163.70 m; Hole U1504B = 117.40–196.28 m
- Cores 368-U1504A-16R through 21R and 368-U1504B-5R through 20R
The four discrete basement samples show consistent AMS fabrics even though the core is azimuthally unoriented (Figure F31). These cubes show moderate to high degrees of magnetic anisotropy (P' ≈ 1.05–1.09), oblate (i.e., flattened) fabric symmetries (T ≈ 0.2–0.6), magnetic foliations with moderate to steep dip angles (44°–81°), and variably plunging magnetic lineations. Based on these four samples, the direction of slip along the shear zone is most likely an oblique slip motion (with a normal or reversed component to be determined).
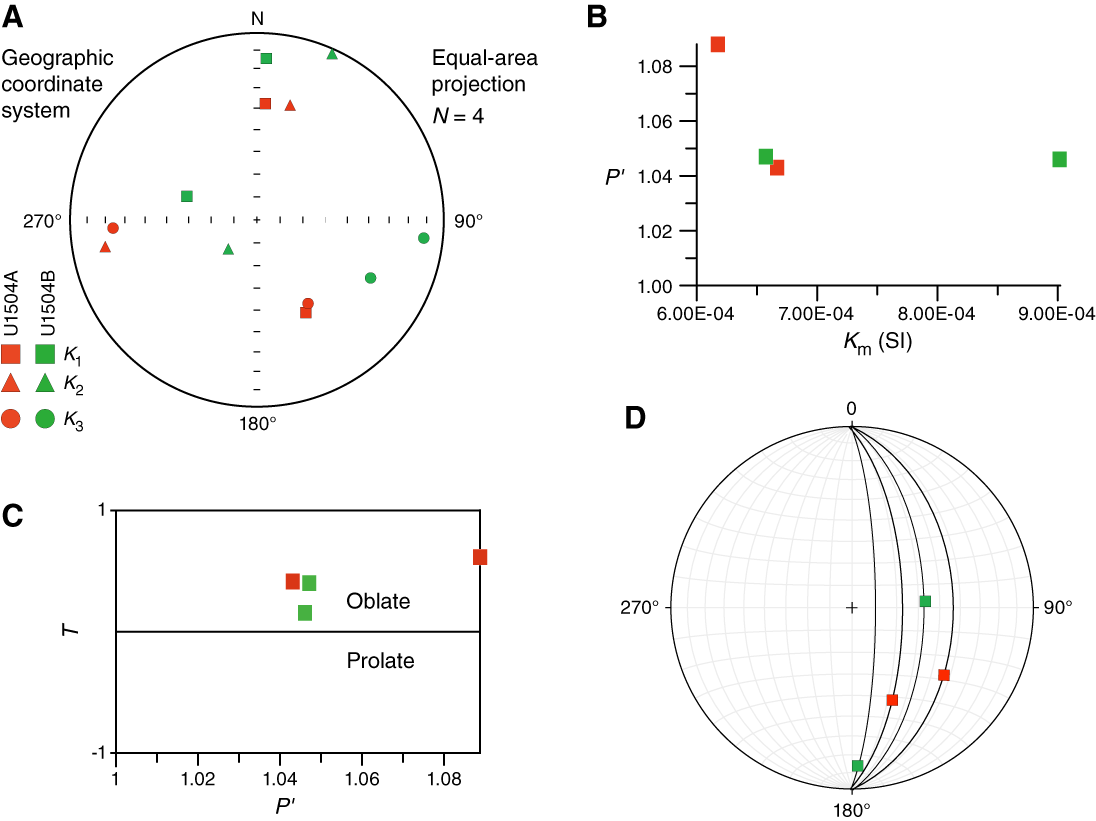
Figure F31. Basement AMS data.
Geochemistry
Hydrocarbon gases were not detected above background levels at Site U1504, and TOC, TN, and TS contents were low, likely reflecting poor preservation of organic matter. Instances of high carbonate content were associated with carbonate lithology. The upper part of the sediment was not cored. Interstitial water major cations and anions from the cored sediments are broadly comparable to other sites. Inductively coupled plasma–atomic emission spectroscopy analysis was not performed on samples collected at Site U1504.
Headspace gas
Headspace gas samples were taken at a frequency of one sample per core or per 10 m of drilling advance for routine safety monitoring to Section 368-U1504A-18R-1 (149.18 m). After this depth, because of the absence of methane in previous samples and the nature of the metamorphic lithologies encountered (low porosity and organic carbon content), an operational decision was made to no longer make headspace gas measurements.
Bulk sediment organic geochemistry
Lithostratigraphic Unit I
TOC, TN, and TS levels are low in all samples collected from Unit I (TOC < 1 wt%, TN < 0.1 wt%, and TS is frequently below detection limit) (Table T13; Figure F32). Subunit IA has TOC values >0.5 wt%, notable sulfur contents, and low carbonate contents. Other lithostratigraphic subunits within Unit I had higher carbonate contents and lower sulfur contents.
Table T13. Carbon, nitrogen, and sulfur. View table in PDF format. Download table in CSV format.
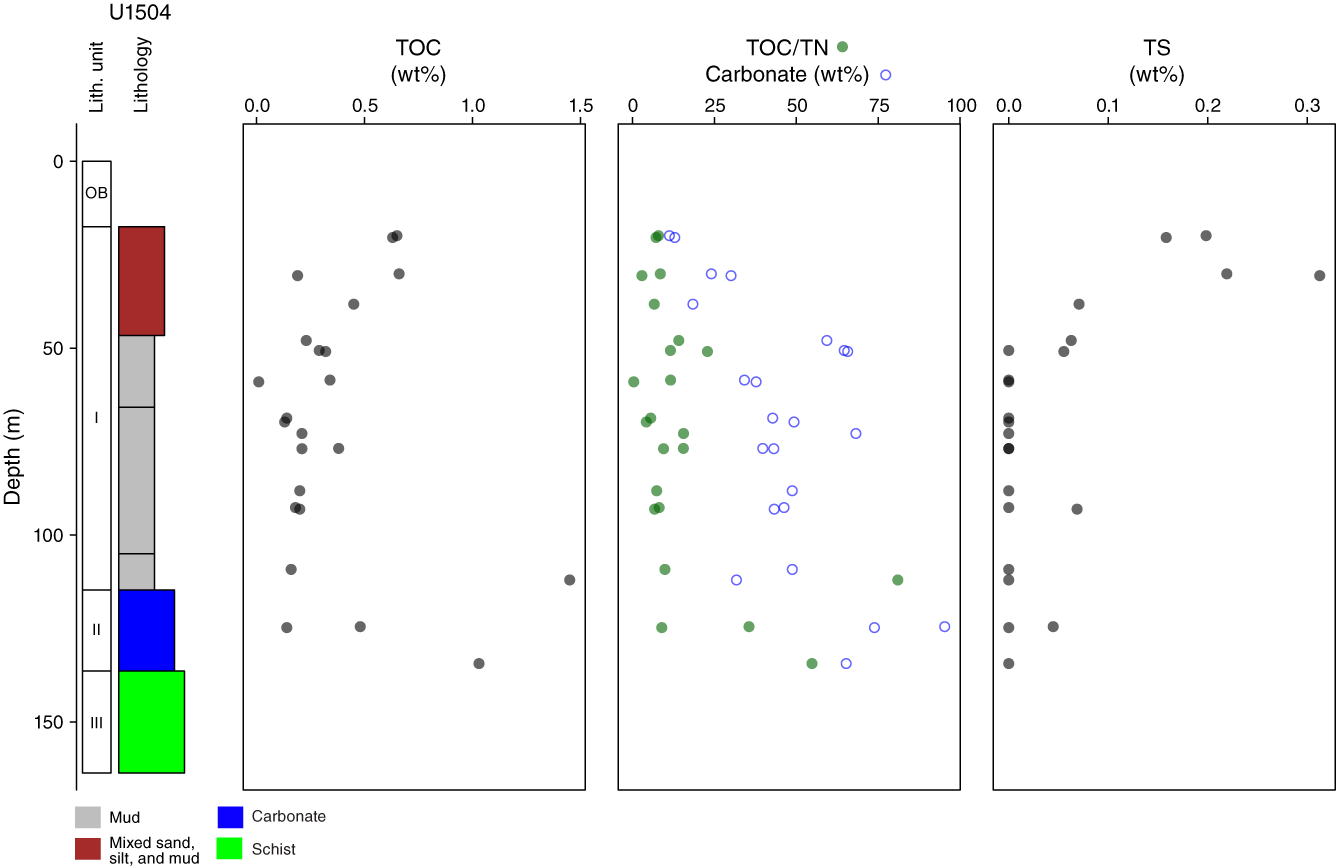
Figure F32. Carbon, nitrogen, and sulfur.
Lithostratigraphic Unit II
Lithostratigraphic Unit II has a high carbonate content, and based on the results of the standard testing procedure used by IODP to determine TOC content by difference between total and inorganic carbon, it also has a TOC content as high as 1 wt%. Therefore, the higher TOC content could result from a carbon phase unamenable to acid digestion using a weak acid (in such a situation the proportion of inorganic carbon is underestimated and the proportion of organic carbon is overestimated). The TOC/TN ratio for the interval is high, indicating a nitrogen-poor material, which generally is interpreted as representing a terrestrial-derived source of organic matter (Hedges et al., 1988). It could, however, also result from organic matter being exposed and reworked in shallow water (e.g., a lagoon) or caused by overestimation of TOC.
Summary
Overall, the organic matter at Site U1504 falls into two categories (Figure F33). Subunit IA has relatively high TOC and TS, indicating reducing conditions during early diagenesis (Berner and Raiswell, 1984), and, based on its low TOC/TN ratio (high nitrogen content), it is likely derived from aquatic organic matter (Hedges et al., 1988). The rest of the samples have higher carbonate content and higher TOC/TN ratios due to biological inputs of calcite and reworked or land/plant-derived organic matter.
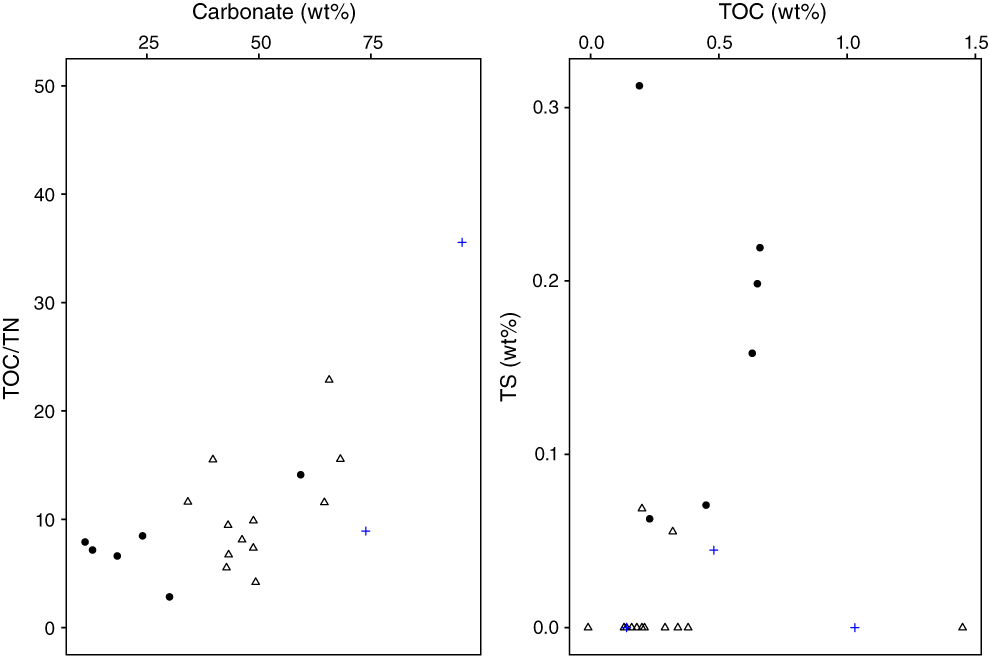
Figure F33. Bulk sediment geochemical parameters.
Raman and surface enhanced Raman spectroscopy
Because of resource constraints, Raman measurements were not performed at this site.
Interstitial water chemistry
Shipboard analyses were performed on interstitial waters squeezed from 5–10 cm long whole-round sediment samples from Hole U1504A. About 30 mL of interstitial water was squeezed per sample. Interstitial water geochemical parameters are listed in Table T14 and presented in Figure F34.
Table T14. Interstitial water analyses. View table in PDF format. Download table in CSV format.
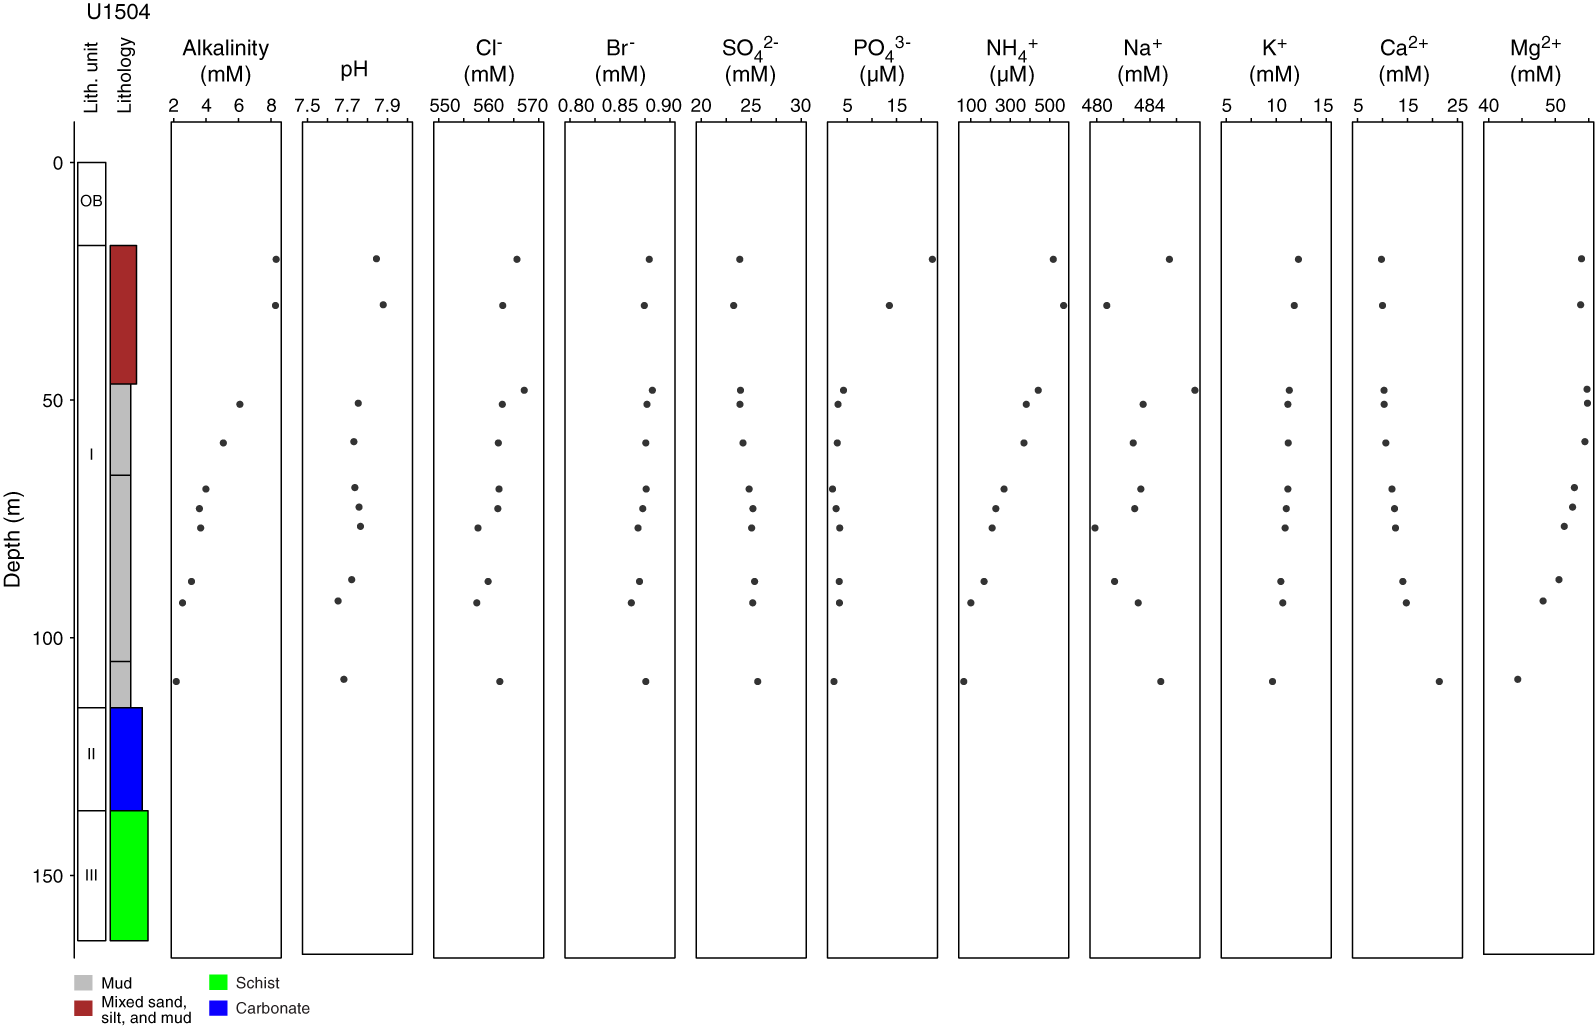
Figure F34. Interstitial water alkalinity, major cations, and anions.
A maxima for alkalinity is observed in the uppermost sample (Section 368-U1504A-3R-2), and thereafter alkalinity decreases with increasing depth to the bottom of the hole. The phosphate and ammonium profiles are similar: both decease with depth, likely due to degradation of organic matter. Typically, these changes occur rapidly at shallow depths (uppermost few meters), and it is notable that both substrates still appear to be actively consumed. Sulfate concentrations vary from 22.5 to 24.7 mM throughout the cored sediment; these are low values compared to the seawater value (28.9 mM), indicating sulfate reduction likely linked to organic matter degradation. The range of pH values observed is from 7.7 to ~7.9, slightly lower than modern seawater; the variations of pH values show a similar trend to those of alkalinity.
Calcium concentrations increase with depth to a maximum at the bottom of the hole, whereas magnesium concentrations decrease with depth, likely because of carbonate dissolution and recrystallization of new carbonate phases. Potassium concentrations decrease linearly with depth from 12.2 to 9.6 mM, which could be interpreted as the consequence of vertical diffusion. Sodium concentrations range between 480 and 487 mM throughout the core. Only small variations in Cl and Br content were observed, and their concentrations are similar to those of modern seawater: 559–567 mM for chloride and 0.86–0.88 mM for bromide.
Discussion
Surface samples were not collected, which prevented evaluation of early stage diagenetic processes related to the breakdown of organic carbon. Hence, it cannot easily be verified if the site currently possess a sulfate–methane transition. However, it is notable that shallow sediments have high TS contents (solid-phase sulfur) that correspond to pyrite within the samples. This topmost-cored interval has low sulfate; thus, it is reasonable to assume that sulfate is converting to sulfide at some point and that this sulfide is now likely preserved in the sediments as pyrite. Methane may have been lost via oxidation to carbonate formation, diffusion, or other mass transfer processes. Relative to other Expedition 368 sites, the site has low organic carbon preservation with far more carbon sequestered as carbonate.
Physical properties
Physical property measurements were performed on cores from Hole U1504A (17.50–165.5 m) and Hole U1504B (88.2–195.2 m). NGR, magnetic susceptibility, gamma ray attenuation (GRA) bulk density, and P-wave velocity were measured on the whole-round cores. Point magnetic susceptibility, red green blue (RGB), and color reflectance were measured on archive-half sections. All analyses were conducted at a sampling resolution of 2 cm. P-wave velocity was also measured using the P-wave caliper (PWC) system on split cores in liner and on individual pieces from working-half sections without liner. Thermal conductivity measurements were performed on Section 3 of each core. Moisture and density (MAD) measurements in Hole U1504A were performed on discrete samples, generally taken at a resolution of 1 sample every other section. MAD samples were not taken from Hole U1504B to preserve material for postcruise research.
Physical property measurements from Holes U1504A and U1504B are consistent between the two holes and compare well to the lithostratigraphic units (see also Lithostratigraphy). At Site U1504, four PP units were distinguished according to variations in physical properties: PP Unit 1 (17.50–45 m in Hole U1504A) is characterized by very low density (average of ~1.5 g/cm3), porosity (~75%), and P-wave velocity (~1500 m/s). PP Unit 2 (45–114 m in Hole U1504A and 88.2–93 m in Hole U1504B) has higher density (~1.7 g/cm3) and P-wave velocity (average = 1590 m/s) values than the overlying PP Unit 1. PP Unit 3 (114–135 m in Hole U1504A and 93–110 m in Hole U1504B) is marked by significant increases in P-wave velocity and bulk density. However, very few physical property results were obtained from this unit because of poor core recovery. PP Unit 4 (135–165.5 m in Hole U1504A and 110–195.2 m in Hole U1504B) has the highest P-wave velocity and bulk density and the lowest NGR values compared with the three overlying units. A more detailed description of physical properties of different units is given below.
Natural gamma radiation
NGR counts range between ~25 and 35 counts/s in PP Unit 1 and exhibit no noticeable trend with depth (Figure F35), which may be due to limited core recovery. PP Unit 2 is generally characterized by greater amplitude in NGR values (15–35 counts/s) than Unit 1. In PP Units 3 and 4, NGR values show a slightly increasing trend from ~5 to 20 counts/s with depth. NGR values are relatively high (~50 counts/s) at ~152 and ~168 m in Hole U1504B.
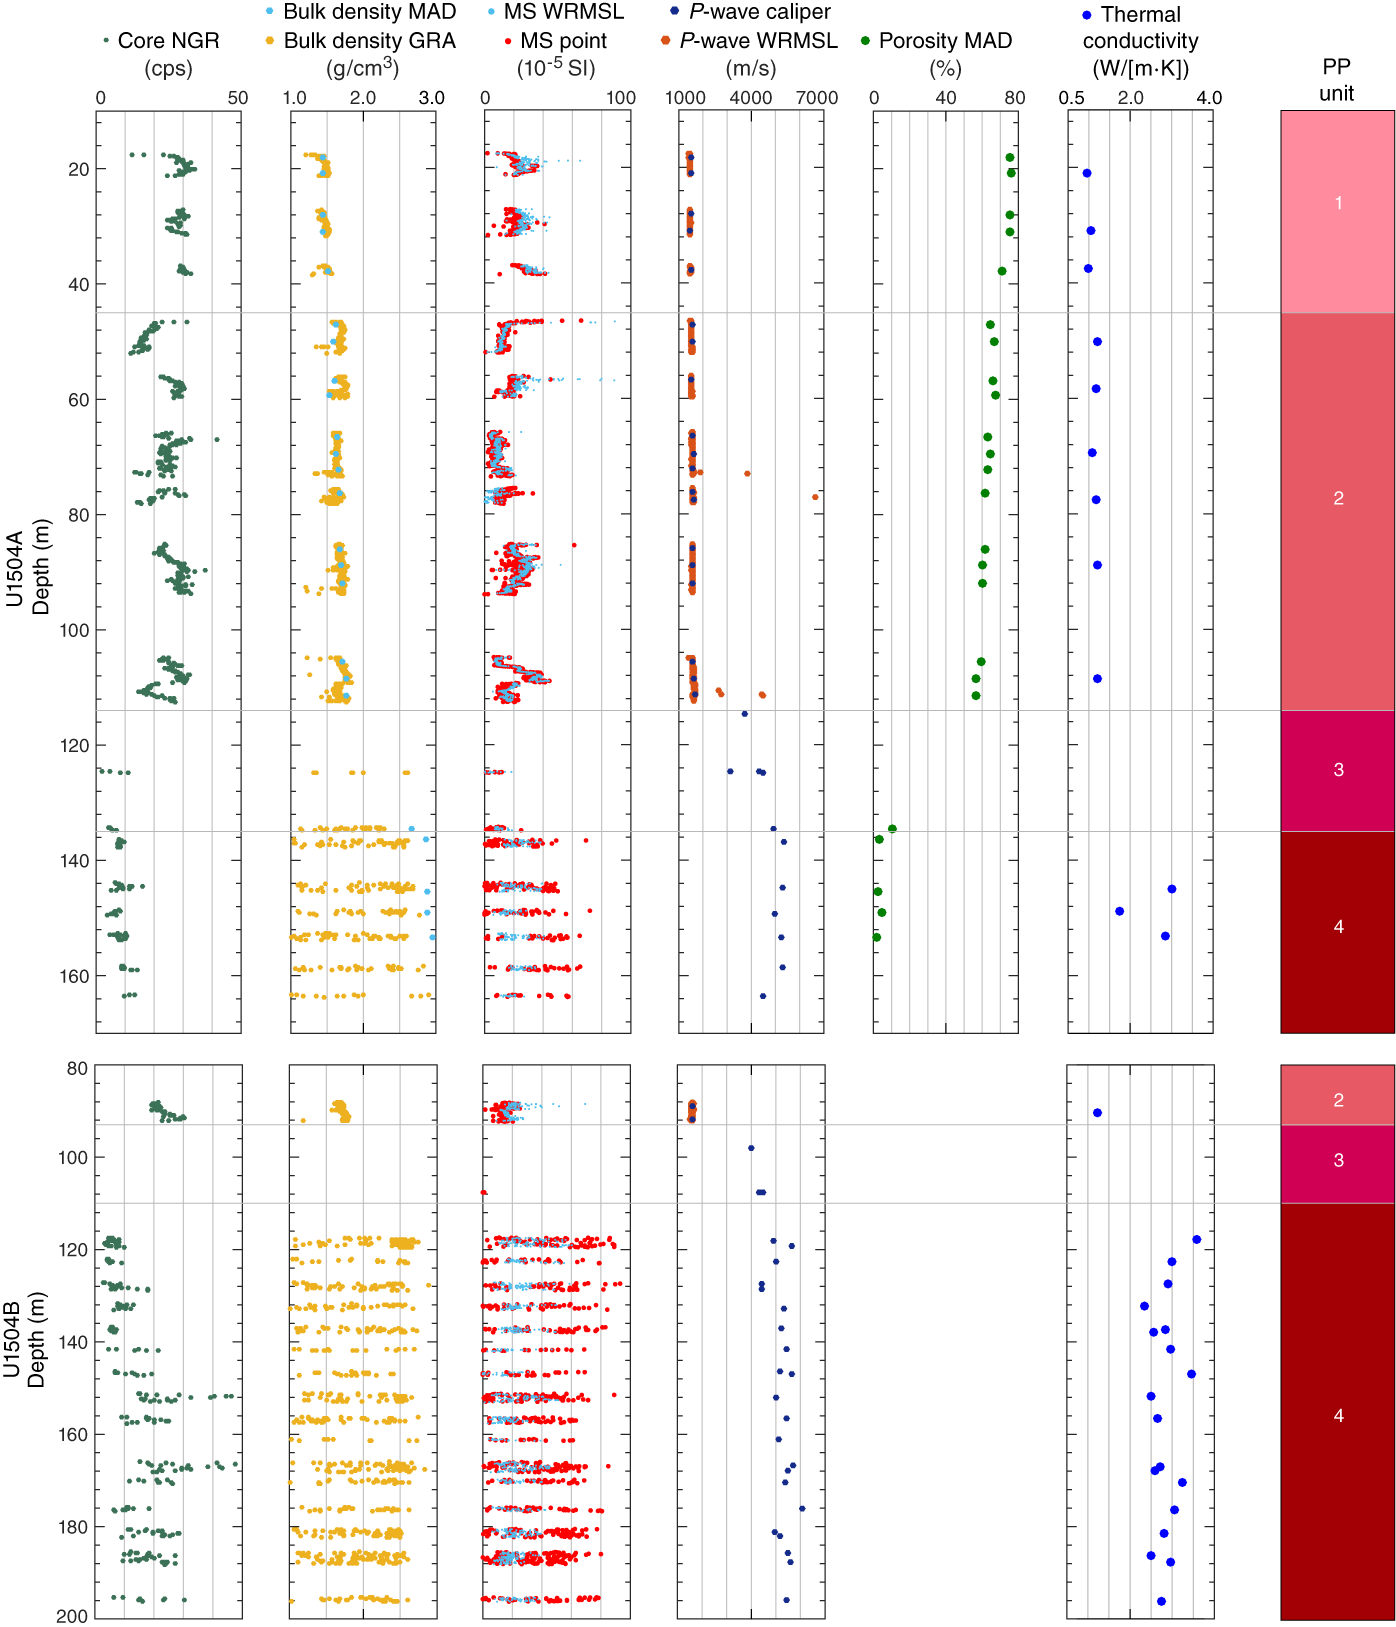
Figure F35. Physical properties.
P-wave velocity
In Holes U1504A and U1504B, P-wave velocity measurements are consistent between whole-round and split core sections (Figure F35). In PP Unit 1, P-wave velocity shows little variation with an average of 1500 m/s. PP Unit 2 is distinguished by a slight increase in velocity in the upper section to 1560 m/s and velocities that increase slowly with depth to ~1700 m/s. In contrast, PP Unit 3 is marked by an abrupt change to high P-wave velocities (~3000–5000 m/s). Similarly, the P-wave velocities of PP Unit 4 are high (~5000–6100 m/s) and represent the metamorphic rocks in lithostratigraphic Unit III (see Lithostratigraphy).
Thermal conductivity
Thermal conductivity measurements are well defined in the designated physical property units. In Hole U1504A, PP Unit 1 has lower thermal conductivity ranging from 0.970 to 1.047 W/(m·K) (Figure F35) followed by a higher thermal conductivity regime ranging from 1.089 to 1.204 W/(m·K) that corresponds to PP Unit 2. Because of the small size of core pieces recovered from PP Unit 3, no thermal conductivity measurements could be taken from this unit. Finally, PP Unit 4 shows values from 1.752 to 3.004 W/(m·K) that include the highest thermal conductivity measurements from the cores recovered at Site U1504.
Similarly, in Hole U1504B, PP Unit 2 has lower thermal conductivity values and no measurements could be taken in PP Unit 3. PP Unit 4 is characterized by a regime of higher thermal conductivity with values ranging from 2.353 to 3.475 W/(m·K).
Density and porosity
GRA densities generally match the trend of discrete bulk density values in PP Units 1 and 2 (Figure F35); however, the GRA density values are more scattered than the discrete measurements in PP Units 3 and 4 because whole-round measurements are affected by space between the core and the core liner. Hence, descriptions of variations in density are only based on discrete measurements of Hole U1504A (Figure F36).
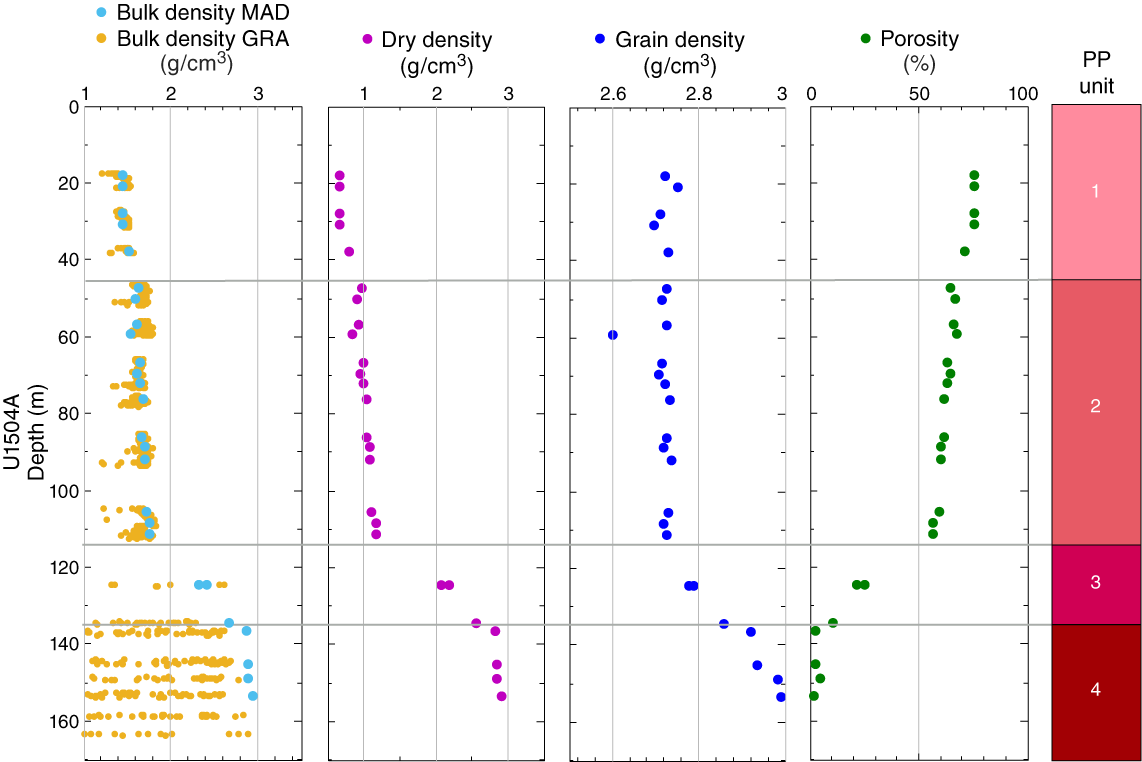
Figure F36. Density and porosity.
In PP Unit 1, bulk density increases slightly with depth and ranges from ~1.4 to 1.5 g/cm3. Dry densities in the upper portion of Unit 1 (18–30 m) remain relatively constant with an average of ~0.7 g/cm3 followed by an increase to ~0.8 g/cm3 at ~38 m. Porosity ranges from 70% to 75% and displays a negative correlation with bulk density, as expected. Grain density values are relatively uniform, averaging ~2.7 g/cm3.
In PP Unit 2, bulk density gradually increases with depth from ~1.6 g/cm3 at 47 m to ~1.8 g/cm3 at 110 m. Dry density similarly increases with depth, whereas porosity decreases downcore from 67% to 57%. Grain density is relatively constant at ~2.7 g/cm3.
Bulk density values in PP Unit 3 are higher than in the overlying Unit 2, ranging from ~2.3 to 2.7 g/cm3 followed by a sharp shift toward higher values (>2.8 g/cm3) at the boundary with PP Unit 4 (Figure F36). PP Unit 4 (135–165.5 m) represents the metamorphic basement and is characterized by very high bulk density (>2.9 g/cm3). PP Unit 4 grain density increases downcore from ~2.9 to 3.0 g/cm3, whereas porosity ranges from 2% to 5%.
Color reflectance spectrophotometry
In PP Unit 1, reflectance parameters L*, a*, and b* remain relatively constant with mean values of 42, 2, and –1, respectively (Figure F37). At the uppermost portion of PP Unit 2 in Hole U1504A, all parameters display a large increase to 63, 9, and 17, respectively. Over the rest of Unit 2 (48–114 m in Hole U1504A), L* values slightly decrease from ~60 to 50, whereas a* and b* show comparable larger variations between 65 and 114 m. In PP Units 3 and 4 in both holes, L*, a*, and b* values are relatively scattered. Unit 3 has a mean L* value of ~45 similar to Unit 4 but higher mean a* and b* values of ~5 compared with that of approximately −1 in Unit 4.
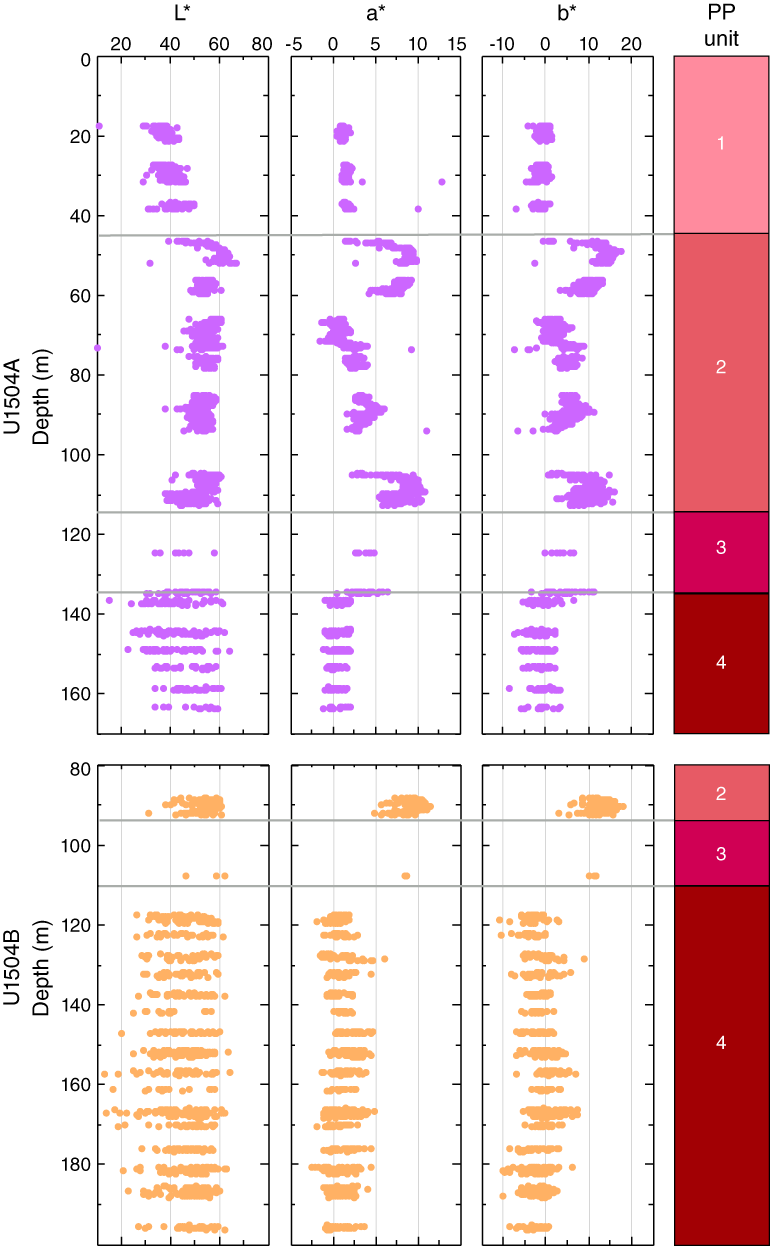
Figure F37. Core color reflectance.
Magnetic susceptibility
Magnetic susceptibility shows very limited changes between ~5 × 10⁻⁵ and 80 × 10−5 SI throughout all four petrophysical units (Figure F35). Nevertheless, magnetic susceptibility differences between different units are still recognizable. PP Unit 1 has a relatively high mean magnetic susceptibility of ~30 × 10−5 SI compared with that of ~20 × 10−5 SI for PP Unit 2. Unit 2 also contains two depth intervals (~46.5–47.0 and 56.5–57.0 m in Hole U1504A) showing magnetic susceptibility as high as 80 × 10−5 SI. The distribution of magnetic susceptibility within PP Units 3 and 4 is scattered, possibly due to the fragmented core materials and voids within the rock core samples. The mean magnetic susceptibility is as low as ~10 × 10−5 SI in Unit 3 but increases to ~35 × 10−5 SI in Unit 4.
RGB
In Hole U1504A, RGB values are generally constant with depth in PP Units 1, 3, and 4 with small variations (Figure F38), but Units 3 and 4 have higher values than Unit 1 because Unit 1 consists of dark gray nannofossil ooze (see Lithostratigraphy). PP Unit 2 is marked by strong RGB intensity that corresponds to carbonate-rich lithology. All the units in Hole U1504B have value ranges similar to those of the corresponding units in Hole U1504A.
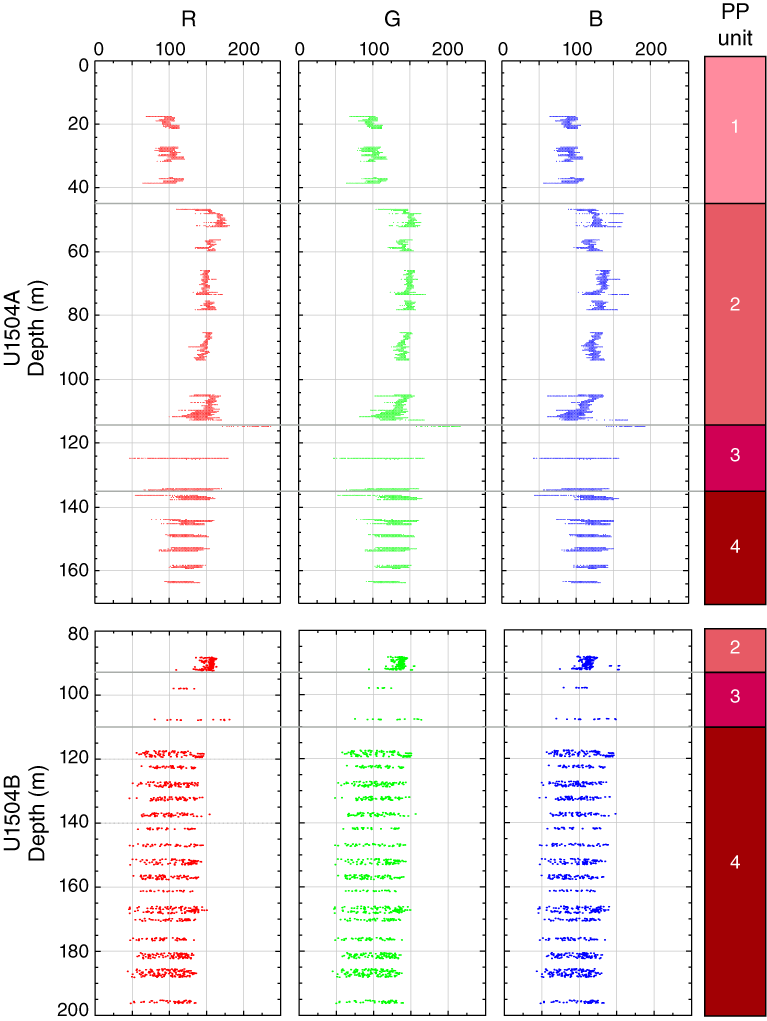
Figure F38. Core RGB values.
Discussion and summary
Core materials in PP Units 1 and 2 consist of soft sediments. In general, compared with Unit 2, Unit 1 has higher average NGR (~30 versus 20 counts/s), weaker color reflectance (mean L* of ~40 versus 50), and lower average RGB values (100 versus 150) (Figures F35, F37, F38). These changes in physical properties between Units 1 and 2 correspond to a change in sediment compositions from nannofossil-rich clay to nannofossil ooze (see Lithostratigraphy). General increases in bulk (from ~1.4 to 1.8 g/cm3) and dry (from ~0.7 to 1.2 g/cm3) densities and a downhole decrease in porosity (from 75% to 56%) in Units 1 and 2 mainly indicate sediment compaction with time. The boundary between Units 1 and 2 is marked by a relatively rapid increase in P-wave velocity and bulk density and a rapid decrease in porosity compared with the general trends mentioned above (Figures F35, F36). This physical property boundary corresponds to a clear unconformity in the seismic profile along this drilling site and to a large hiatus (see Biostratigraphy).
P-wave velocity and bulk density increase from ~3800 to 5000 m/s and from ~2.4 to 2.9 g/cm3, respectively, within PP Unit 3, corresponding to a transition in lithology from coral-rich limestone to clast-supported limestone (see Lithostratigraphy). Coral-enriched limestone in the upper portion of Unit 3 is also associated with a moderately high porosity of ~23% (Figures F35, F36). PP Unit 4 is characterized by a uniformly high velocity of ~5500 m/s, high bulk density of ~2.9 g/cm3, and low porosity of ~3%, all of which correspond to epidote-chlorite schist (see Lithostratigraphy). A large increase in both velocity and density at the boundaries between Units 2 and 3 and between Units 3 and 4 is also recorded by two strong positive seismic reflectors (Figure F36). The gradual downhole increase in thermal conductivity values at shallow depths is likely due to progressive compaction of the sediments. The higher RGB intensity in Unit 2 reflects the higher carbonate content.
Correlation to seismic data
We conducted two sets of analyses to correlate the core measurements (in meters below seafloor) to the time-based seismic data from Hole U1504A. First, we analyzed core data and investigated correlation to the seismic reflection profile. Second, we constructed synthetic seismograms using the core data of Site U1504 and compared the results with the traces in seismic profiles. Preliminary calculations were done during the expedition using a combination of Matlab scripts and Petrel software.
Velocity and density data and comparison with seismic reflectors
Whole-round core measurements were conducted in Hole U1504A from 17.5 to 163.5 m for GRA density and from 17.5 to 112.7 m for P-wave logger (PWL) measurements (Figure F39). P-wave velocity was also measured along the x-axis with the PWC system on working-half sections. MAD measurements were performed on discrete samples, one every other section. Wireline logging was not conducted at Site U1504. With the outliers filtered out, the whole-round PWL velocity and GRA density data show a good match with the PWC velocity and MAD density of core samples, respectively.
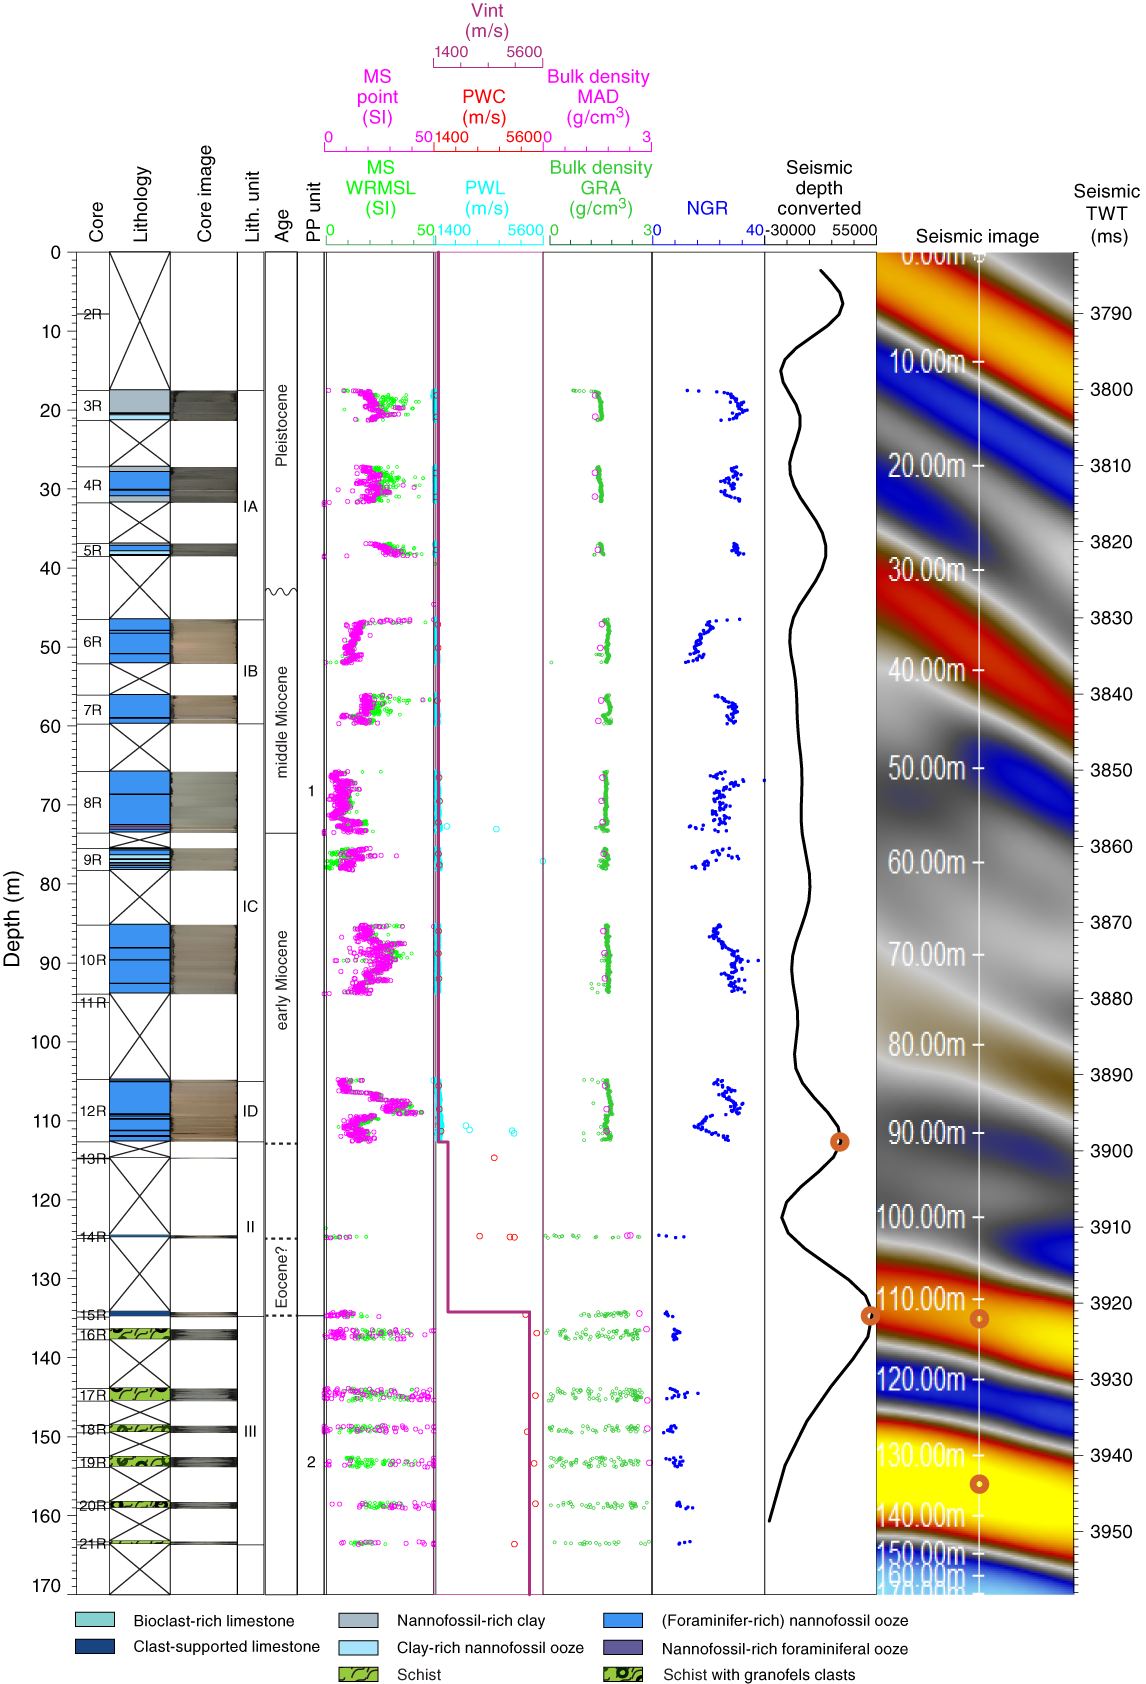
Figure F39. Physical properties compared with seismic waveform and image.
Although no downhole logging was conducted at Site U1504, two distinct changes in the physical property data from the cores helped in building a velocity model for the time-depth correlation on the seismic profiles from Hole U1504A. The first major change in VP and density was identified at ~112.7 m, coinciding with the lithologic change from sediment to limestone (Figure F39; see Lithostratigraphy). We hypothesized that a relatively strong reflector in the seismic traces at Site U1504 (two-way traveltime [TWT] = 3922 ms) might correspond to the noticeable changes in lithology and physical properties at 112.7 m we refer to as reference Point RP1. A second major change in VP and density, at ~134.2 m, is associated with a strong peak in the seismogram (TWT = 3944 ms) designated as reference Point RP2. Once the corresponding depths of the two reference points were assigned, the interval velocity at the 112.7–134.2 m depth range was calculated to be ~2 km/s. For the 134.2–163.5 m interval, an interval velocity of 5094 m/s was chosen, which corresponds to the average PWC values.
Time-depth relationship
Hole U1504A PWC data were used to calculate the time-depth relationship (TDR) model of seismic waves. We assigned the first strong reflector (TWT = 3922 ms; reference Point RP1) to be associated with the major changes in VP and density at ~112.7 m. Similarly, we assigned the second strong reflector (TWT = 3944 ms; reference Point RP2) to be associated with the major changes in VP and density at ~134.2 m. For the 134.2–163.5 interval, the TDR was calculated assuming an interval velocity of 5094 m/s, which is the average PWC for this interval (Figure F40).
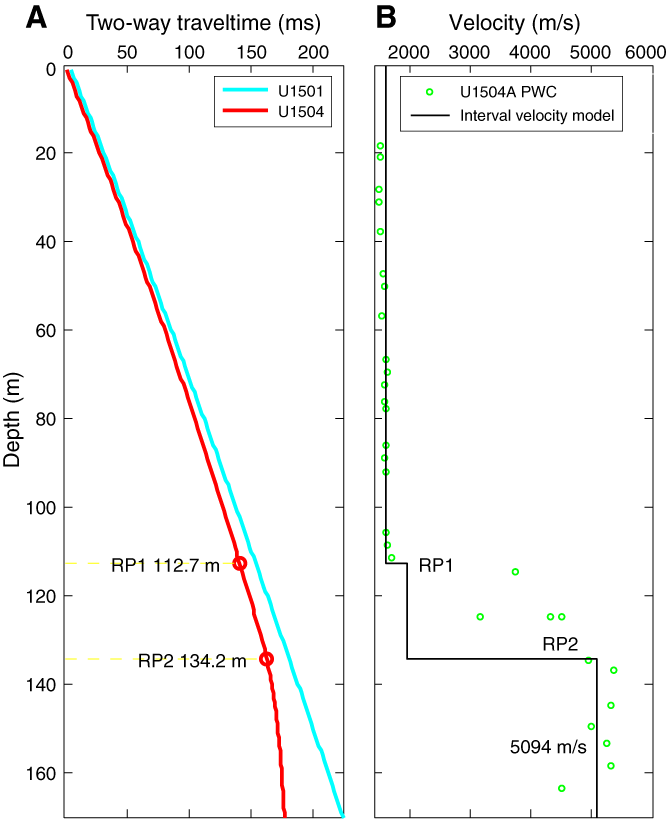
Figure F40. TDR curve comparison.
Synthetic seismograms
To further illustrate the relationship between the core measurements in Hole U1504A and the seismic reflection profile, the “Seismic interpretation” module in Petrel was used to compute synthetic seismograms based on the relevant core measurements (Figure F41). Synthetic traces were generated by convolving the reflectivity from the density of core samples, an interval velocity model, and with the source wavelet that best fit the seismic data (“Ricker 2;” Figure F41).
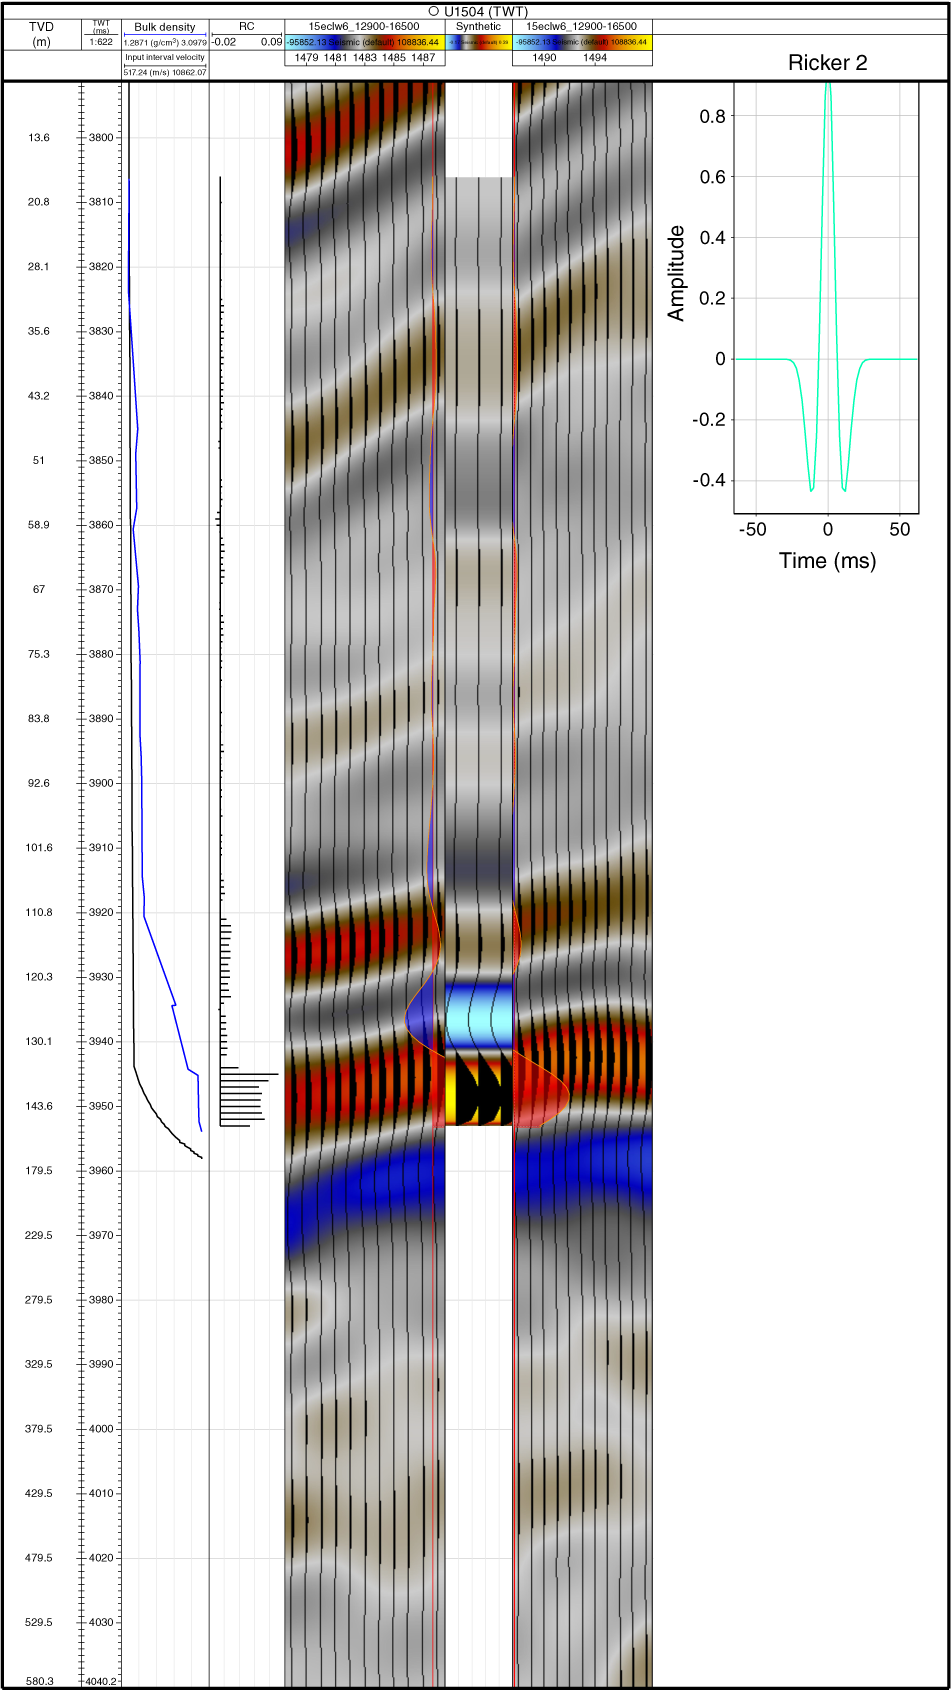
Figure F41. Synthetic seismogram.
Seismic impedance (SI) of a rock layer is the product of its average seismic velocity (VP) and density (ρ) (i.e., SI = VP × ρ). The seismic reflection coefficient, in turn, equals the change in the seismic impedance between two adjacent rock layers. Thus, we can expect greater amplitudes in the modeled seismogram for rock interfaces with larger values of reflection coefficient. The resulting synthetic seismogram shows two strong reflectors at ~110–142 m (Figure F41), consistent with the observed depth range of the two strong seismic reflectors.
Using the best-fitting TDR model for Hole U1504A (Figure F40), we were able to convert the depth scale to a timescale for all core measurements. This conversion enabled us to display the core measurements directly on top of the time-based seismic sections, facilitating identification of correlated features as illustrated in the example of Figure F42.
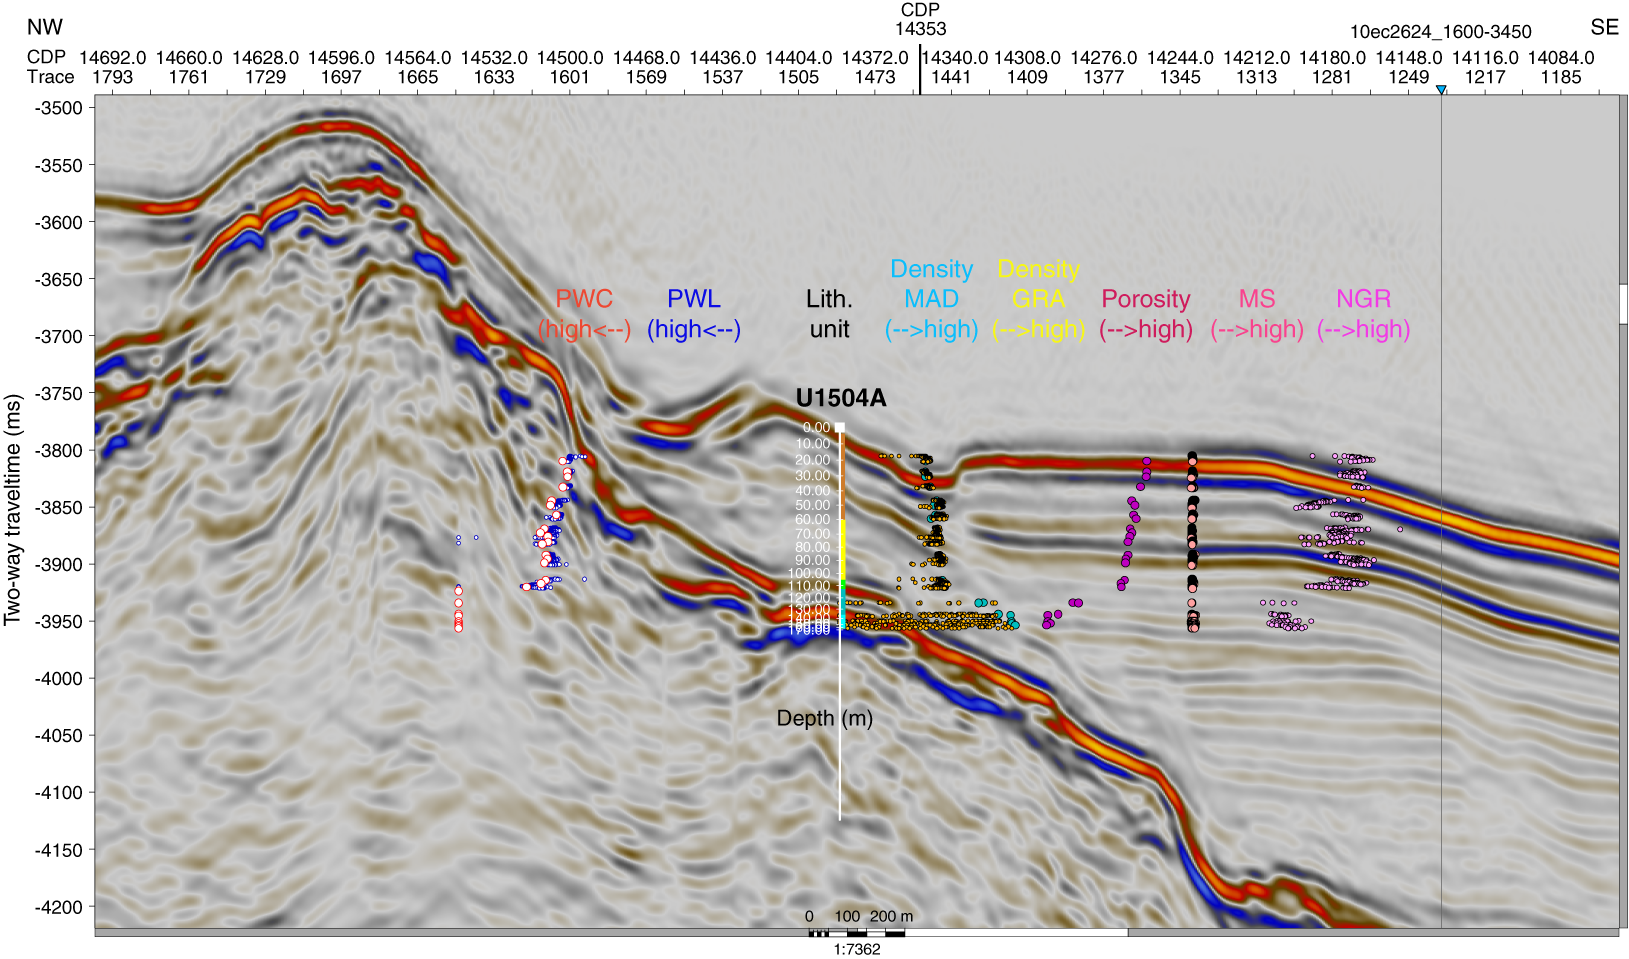
Figure F42. Seismic section with overlaid lithostratigraphic units.
References
Beavington-Penney, S.J. and Racey, A., 2004. Ecology of extant nummilitids and other larger benthic foraminifera: applications in paleoenvironmental analysis. Earth-Science Reviews, 67, 219-265. https://doi.org/10.1016/j.earscirev.2004.02.005
Berner, R.A., and Raiswell, R., 1984. C/S method for distinguishing freshwater from marine sedimentary rocks. Geology, 12(6):365–368. https://doi.org/10.1130/0091-7613(1984)12<365:CMFDFF>2.0.CO;2
Blow, W.H., 1969. Late middle Eocene to recent planktonic foraminiferal biostratigraphy. Proceedings of the International Conference on Planktonic Microfossils, 1:199–422.
Briais, A., Patriat, P., and Tapponnier, P., 1993. Updated interpretation of magnetic anomalies and seafloor spreading stages in the South China Sea: implications for the Tertiary tectonics of Southeast Asia. Journal of Geophysical Research: Solid Earth, 98(B4):6299–6328. https://doi.org/10.1029/92JB02280
Cronan, D.S., 1980. Underwater Minerals: London (Academic Press).
Hedges, J.I., Clark, W.A., and Come, G.L., 1988. Organic matter sources to the water column and surficial sediments of a marine bay. Limnology and Oceanography, 33(5):1116–1136. https://doi.org/10.4319/lo.1988.33.5.1116
Hsieh, C.Y., 1936. On the late Mesozoic-early Tertiary Orogenesis and vulkanism, and their relation to the formation of metallic deposits in China. Acta Geologica Sinica, 15(1):61–74. https://doi.org/10.1111/j.1755-6724.1936.mp15001005.x
Kirschvink, J.L., 1980. The least-squares line and plane and the analysis of palaeomagnetic data. Geophysical Journal of the Royal Astronomical Society, 62(3):699–718. https://doi.org/10.1111/j.1365-246X.1980.tb02601.x
Larsen, H.C., Jian, Z., Alvarez Zarikian, C.A., Sun, Z., Stock, J.M., Klaus, A., Boaga, J., Bowden, S.A., Briais, A., Chen, Y., Cukur, D., Dadd, K.A., Ding, W., Dorais, M.J., Ferré, E.C., Ferreira, F., Furusawa, A., Gewecke, A.J., Hinojosa, J.L., Höfig, T.W., Hsiung, K.-H., Huang, B., Huang, E., Huang, X.-L., Jiang, S., Jin, H., Johnson, B.G., Kurzawski, R.M., Lei, C., Li, B., Li, L., Li, Y., Lin, J., Liu, C., Liu, C., Liu, Z., Luna, A., Lupi, C., McCarthy, A.J., Mohn, G., Ningthoujam, L.S., Nirrengarten, M., Osono, N., Peate, D.W., Persaud, P., Qui, N., Robinson, C.M., Satolli, S., Sauermilch, I., Schindlbeck, J.C., Skinner, S.M., Straub, S.M., Zu, X., Tian, L., van der Zwan, F.M., Wan, S., Wu, H., Xiang, R., Yadav, R., Yi, L., Zhang, C., Zhang, J., Zhang, Y., Zhao, N., Zhong, G., and Zhong, L., 2018a. Site U1501. In Sun, Z., Jian, Z., Stock, J.M., Larsen, H.C., Klaus, A., Alvarez Zarikian, C.A., and the Expedition 367/368 Scientists, South China Sea Rifted Margin. Proceedings of the International Ocean Discovery Program, 367/368: College Station, TX (International Ocean Discovery Program). https://doi.org/10.14379/iodp.proc.367368.105.2018
Larsen, H.C., Jian, Z., Alvarez Zarikian, C.A., Sun, Z., Stock, J.M., Klaus, A., Boaga, J., Bowden, S.A., Briais, A., Chen, Y., Cukur, D., Dadd, K.A., Ding, W., Dorais, M.J., Ferré, E.C., Ferreira, F., Furusawa, A., Gewecke, A.J., Hinojosa, J.L., Höfig, T.W., Hsiung, K.-H., Huang, B., Huang, E., Huang, X.-L., Jiang, S., Jin, H., Johnson, B.G., Kurzawski, R.M., Lei, C., Li, B., Li, L., Li, Y., Lin, J., Liu, C., Liu, C., Liu, Z., Luna, A., Lupi, C., McCarthy, A.J., Mohn, G., Ningthoujam, L.S., Nirrengarten, M., Osono, N., Peate, D.W., Persaud, P., Qui, N., Robinson, C.M., Satolli, S., Sauermilch, I., Schindlbeck, J.C., Skinner, S.M., Straub, S.M., Zu, X., Tian, L., van der Zwan, F.M., Wan, S., Wu, H., Xiang, R., Yadav, R., Yi, L., Zhang, C., Zhang, J., Zhang, Y., Zhao, N., Zhong, G., and Zhong, L., 2018b. Site U1503. In Sun, Z., Jian, Z., Stock, J.M., Larsen, H.C., Klaus, A., Alvarez Zarikian, C.A., and the Expedition 367/368 Scientists, South China Sea Rifted Margin. Proceedings of the International Ocean Discovery Program, 367/368: College Station, TX (International Ocean Discovery Program). https://doi.org/10.14379/iodp.proc.367368.107.2018
Li, C.-F., Lin, J., Kulhanek, D.K., Williams, T., Bao, R., Briais, A., Brown, E.A., Chen, Y., Clift, P.D., Colwell, F.S., Dadd, K.A., Ding, W., Hernández-Almeida, I., Huang, X.-L., Hyun, S., Jiang, T., Koppers, A.A.P., Li, Q., Liu, C., Liu, Q., Liu, Z., Nagai, R.H., Peleo-Alampay, A., Su, X., Sun, Z., Tejada, M.L.G., Trinh, H.S., Yeh, Y.-C., Zhang, C., Zhang, F., Zhang, G.-L., and Zhao, X., 2015. Expedition 349 summary. In Li, C.-F., Lin, J., Kulhanek, D.K., and the Expedition 349 Scientists, South China Sea Tectonics. Proceedings of the International Ocean Discovery Program, 349: College Station, TX (International Ocean Discovery Program). https://doi.org/10.14379/iodp.proc.349.101.2015
Li, P.L., Wang, W.P., He, Y.C., et al., 1989. Tectonic structures and evolution of the Pearl River Mouth Basin. China Offshore Oil and Gas (Geology), 3(1): 11–18 (in Chinese with English abstract).
Lurcock, P.C., and Wilson, G.S., 2012. PuffinPlot: a versatile, user-friendly program for paleomagnetic analysis. Geochemistry, Geophysics, Geosystems, 13(6):Q06Z45. https://doi.org/10.1029/2012GC004098
Martini, E., 1971. Standard Tertiary and Quaternary calcareous nannoplankton zonation. In Farinacci, A. (Ed.), Proceedings of the Second Planktonic Conference, Roma 1970: Rome (Edizioni Tecnoscienza), 2:739–785.
Ogg, J.G., Ogg, G., and Gradstein, F.M., 2016. A Concise Geologic Time Scale 2016: Boston (Elsevier).
Roberts, A.P., Chang, L., Rowan, C.J., Horng, C.-S., and Florindo, F., 2011. Magnetic properties of sedimentary greigite (Fe3S4): an update. Reviews of Geophysics, 49(1):RG1002. https://doi.org/10.1029/2010RG000336
Sales, A.O., Jacobsen, E.C., Morado, A.A., Jr., Benavidez, J.J., Navarro, F.A., and Lim, A.E., 1997. The petroleum potential of deep-water northwest Palawan Block GSEC 66. Journal of Asian Earth Sciences, 15(2–3): 217–240. https://doi.org/10.1016/S0743-9547(97)00009-3
Scherer, R.P., Gladenkov, A.Y., and Barron, J.A., 2007. Methods and applications of Cenozoic marine diatom biostratigraphy. In Starratt, S.W. (Ed.), Pond Scum to Carbon Sink: Geological and Environmental Applications of the Diatoms. Paleontological Society Papers, 13:61–83.
Suggate, S.M., Cottam, M.A., Hall, R., Sevastjanova, I., Forster, M.A., White, L.T., Armstrong, R.A., Carter, A., and Mojares, E., 2014. South China continental margin signature for sandstones and granites from Palawan, Philippines. Gondwana Research, 26(2):699–718. https://doi.org/10.1016/j.gr.2013.07.006
Sun, Z., Jian, Z., Stock, J.M., Larsen, H.C., Klaus, A., Alvarez Zarikian, C.A., Boaga, J., Bowden, S.A., Briais, A., Chen, Y., Cukur, D., Dadd, K.A., Ding, W., Dorais, M.J., Ferré, E.C., Ferreira, F., Furusawa, A., Gewecke, A.J., Hinojosa, J.L., Höfig, T.W., Hsiung, K.-H., Huang, B., Huang, E., Huang, X.-L., Jiang, S., Jin, H., Johnson, B.G., Kurzawski, R.M., Lei, C., Li, B., Li, L., Li, Y., Lin, J., Liu, C., Liu, C., Liu, Z., Luna, A., Lupi, C., McCarthy, A.J., Mohn, G., Ningthoujam, L.S., Nirrengarten, M., Osono, N., Peate, D.W., Persaud, P., Qui, N., Robinson, C.M., Satolli, S., Sauermilch, I., Schindlbeck, J.C., Skinner, S.M., Straub, S.M., Zu, X., Tian, L., van der Zwan, F.M., Wan, S., Wu, H., Xiang, R., Yadav, R., Yi, L., Zhang, C., Zhang, J., Zhang, Y., Zhao, N., Zhong, G., and Zhong, L., 2018. Expedition 367/368 methods. In Sun, Z., Jian, Z., Stock, J.M., Larsen, H.C., Klaus, A., Alvarez Zarikian, C.A., and the Expedition 367/368 Scientists, South China Sea Rifted Margin. Proceedings of the International Ocean Discovery Program, 367/368: College Station, TX (International Ocean Discovery Program). https://doi.org/10.14379/iodp.proc.367368.102.2018
Sun, Z., Stock, J., Jian, Z., McIntosh, K., Alvarez Zarikian, C.A., and Klaus, A., 2016. Expedition 367/368 Scientific Prospectus: South China Sea Rifted Margin. International Ocean Discovery Program. https://doi.org/10.14379/iodp.sp.367368.2016
Suzuki, S., Takemura, S., Yumul, G.P., Jr., David, S.D., Jr., and Asiedu, D.K., 2000. Composition and provenance of the Upper Cretaceous to Eocene sandstones in Central Palawan, Philippines: constraints on the tectonic development of Palawan. Island Arc, 9(4):611–626. https://doi.org/10.1111/j.1440-1738.2000.00306.x
Thompson, G.F., 1990. The anomalous demagnetization of pyrrhotite. Geophysical Journal International, 103(2):425–430. https://doi.org/10.1111/j.1365-246X.1990.tb01781.x
Zhou, D., and Yao, B., 2009. Tectonics and sedimentary basins of the South China Sea: challenges and progresses. Journal of Earth Science, 20(1):1–12. https://doi.org/10.1007/s12583-009-0001-8
Zijderveld, J.D.A., 1967. AC demagnetization of rocks: analysis of results. In Collinson, D.W., Creer, K.M., and Runcorn, S.K. (Eds.), Developments in Solid Earth Geophysics (Volume 3): Methods in Palaeomagnetism: Amsterdam (Elsevier), 254–286. https://doi.org/10.1016/B978-1-4832-2894-5.50049-5
1 Larsen, H.C., Jian, Z., Alvarez Zarikian, C.A., Sun, Z., Stock, J.M., Klaus, A., Boaga, J., Bowden, S.A., Briais, A., Chen, Y., Cukur, D., Dadd, K.A., Ding, W., Dorais, M.J., Ferré, E.C., Ferreira, F., Furusawa, A., Gewecke, A.J., Hinojosa, J.L., Höfig, T.W., Hsiung, K.-H., Huang, B., Huang, E., Huang, X.-L., Jiang, S., Jin, H., Johnson, B.G., Kurzawski, R.M., Lei, C., Li, B., Li, L., Li, Y., Lin, J., Liu, C., Liu, C., Liu, Z., Luna, A., Lupi, C., McCarthy, A.J., Mohn, G., Ningthoujam, L.S., Nirrengarten, M., Osono, N., Peate, D.W., Persaud, P., Qui, N., Robinson, C.M., Satolli, S., Sauermilch, I., Schindlbeck, J.C., Skinner, S.M., Straub, S.M., Zu, X., Tian, L., van der Zwan, F.M., Wan, S., Wu, H., Xiang, R., Yadav, R., Yi, L., Zhang, C., Zhang, J., Zhang, Y., Zhao, N., Zhong, G., and Zhong, L., 2018. Site U1504. In Sun, Z., Jian, Z., Stock, J.M., Larsen, H.C., Klaus, A., Alvarez Zarikian, C.A., and the Expedition 367/368 Scientists, South China Sea Rifted Margin. Proceedings of the International Ocean Discovery Program, 367/368: College Station, TX (International Ocean Discovery Program). https://doi.org/10.14379/iodp.proc.367368.108.2018
2 Expedition 367/368 Scientists’ addresses.
This work is distributed under the Creative Commons Attribution 4.0 International (CC BY 4.0) license. 
- F1. Bathymetry and seismic lines.
- F2. Northern SCS margin with seismic coverage.
- F3. Lithostratigraphic observations.
- F4. Seismic profile hole locations.
- F5. Two-way traveltime to Tg and T60 unconformities.
- F6. Lithostratigraphic summary.
- F7. Representative core section images.
- F8. Bulk mineralogy.
- F9. Dark greenish gray nannofossil-rich ooze.
- F10. Brownish yellow layer with foraminifer-rich nannofossil ooze.
- F11. Bioclast-rich and clast-supported limestone.
- F12. Limestone.
- F13. Unit 1 lithostratigraphic summary.
- F14. Textural diversity in epidote-chlorite schists.
- F15. Subunit 1a and 1b lithologies.
- F16. Greenschist facies mineral assemblage, Hole U1504A.
- F17. Greenschist facies mineral assemblage, Hole U1504B.
- F18. Granofels clasts enclosed in schists.
- F19. pXRF compositional data.
- F20. Convolutely bedded sequence.
- F21. Corrected true dip angles.
- F22. Ductile deformation structures.
- F23. Deformation structures.
- F24. Metamorphic basement.
- F25. Age-depth model.
- F26. Benthic foraminiferal fragments.
- F27. Abundant benthic foraminifers.
- F28. AF demagnetization.
- F29. Paleomagnetic measurements.
- F30. Sediment AMS data.
- F31. Basement AMS data.
- F32. Carbon, nitrogen, and sulfur.
- F33. Bulk sediment geochemical parameters.
- F34. Interstitial water alkalinity, major cations, and anions.
- F35. Physical properties.
- F36. Density and porosity.
- F37. Core color reflectance.
- F38. Core RGB values.
- F39. Physical properties compared with seismic waveform and image.
- F40. TDR curve comparison.
- F41. Synthetic seismogram.
- F42. Seismic section with overlaid lithostratigraphic units.
- T1. Site U1504 core summary.
- T2. Mineral percentages.
- T3. Major element oxides and minor elements.
- T4. Mineral percentages.
- T5. Major element oxides and minor elements in rocks.
- T6. Distribution of diatoms.
- T7. Calcareous nannofossil events.
- T8. Planktonic foraminifer events.
- T9. Calcareous nannofossils.
- T10. Planktonic foraminifers.
- T11. Diatom biostratigraphic event.
- T12. Paleomagnetic age datums.
- T13. Carbon, nitrogen, and sulfur.
- T14. Interstitial water analyses.