Wallace, L.M., Saffer, D.M., Barnes, P.M., Pecher, I.A., Petronotis, K.E., LeVay, L.J., and the Expedition 372/375 Scientists
Proceedings of the International Ocean Discovery Program Volume 372B/375
publications.iodp.org

https://doi.org/10.14379/iodp.proc.372B375.206.2021
Data report: clay mineral assemblages within trench-floor and accreted trench-floor deposits, IODP Expedition 372B/375 Sites U1518 and U1520, offshore New Zealand1
Michael B. Underwood2
Keywords: International Ocean Discovery Program, IODP, JOIDES Resolution, Expedition 372, Expedition 375, Hikurangi Subduction Margin Coring, Logging, and Observatories, clay mineral assemblages, X-ray diffraction, trench-floor deposits, accretionary prism, hemipelagic mud
MS 372B375-206: Received 24 August 2020 · Accepted 26 October 2020 · Published 24 March 2021
Abstract
The frontal accretionary prism of the Hikurangi subduction margin is composed mostly of interbeds of hemipelagic mud and silty turbidites that were deposited on the floor of Hikurangi Trough during the Pleistocene. Expedition 375 of the International Ocean Discovery Program included coring those deposits at Sites U1518 and U1520, which are located on the frontal accretionary prism and the trench wedge, respectively. This report provides the results of 208 X-ray diffraction analyses of the clay-sized fraction (<2 mm spherical settling equivalent). Sampling focused on the background lithology of hemipelagic mud. Normalized weight percent values for common clay-sized minerals (where smectite + illite + undifferentiated [chlorite + kaolinite] + quartz = 100%) exhibit unusual amounts of scatter in all of the lithostratigraphic units. Furthermore, the results reveal neither depth-dependent trends nor excursions at unit boundaries, and compositional differences among sites, lithologic units, and subunits are insignificant. At Site U1520, the mean (µ) and standard deviation (σ) values for Units I–III are smectite = 31.4 wt% (σ = 11.1), illite = 41.5 wt% (σ = 6.9), chlorite + kaolinite = 11.6 wt% (σ = 3.6), and quartz = 15.5 wt% (σ = 6.1). At Site U1518, the mean and standard deviation values for Units I–III are smectite = 38.4 wt% (σ = 9.8), illite = 41.5 wt% (σ = 6.9), chlorite + kaolinite = 11.8 wt% (σ = 4.1), and quartz = 8.3 wt% (σ = 2.3). Indicators of clay diagenesis are relatively monotonous throughout the cored intervals. The average value of the illite crystallinity index is 0.485Δ°2θ (σ = 0.036) at Site U1520 and 0.517Δ°2θ (σ = 0.020) at Site U1518. Smectite expandability averages 70.4% (σ = 7.2) at Site U1520 and 75.2% (σ = 6.0) at Site U1518. At Site U1520, the average proportion of illite in illite/smectite mixed-layer clay is 12.6% (σ = 6.5); the comparable values at Site U1518 are µ = 10.3% and σ = 5.0.
Introduction
The International Ocean Discovery Program (IODP) implemented Expeditions 372 and 375 to study the dynamics of slow-slip events along the Hikurangi subduction margin. The transect, with a total of five sites, was positioned offshore the Hawke's Bay region of North Island, New Zealand (Figure F1A, F1B). The Hikurangi margin formed along the boundary between the overriding Australian plate and the subducting Pacific plate. The coring programs at Sites U1518 and U1520 (Figure F1B, F1C) were designed to groundtruth seismic reflection interpretations of the frontal accretionary prism, the Hikurangi trench wedge, and subducting pelagic and volcaniclastic sediments that were deposited on the Hikurangi Plateau (Davy et al., 2008; Saffer et al., 2017; Saffer et al., 2019a). The primary goal for sampling the subduction inputs at Site U1520 (Figure F2A) was to characterize the lithologies, structure, stratification, and initial frictional, geotechnical, and hydrogeological conditions in materials that are subsequently transported downdip along the subduction interface into the source area for slow-slip events (Barnes et al., 2020). Most of the terrigenous deposits in the upper part of that inputs section (Figure F2A) are subsequently accreted to the overriding plate through a series of imbricate thrust faults that characterize the frontal prism (Figure F2B). The main goal for coring at Site U1518 (Figure F2B) was to document deformation styles across one of those imbricate thrust faults, known as the Pāpaku thrust (Fagereng et al., 2019).
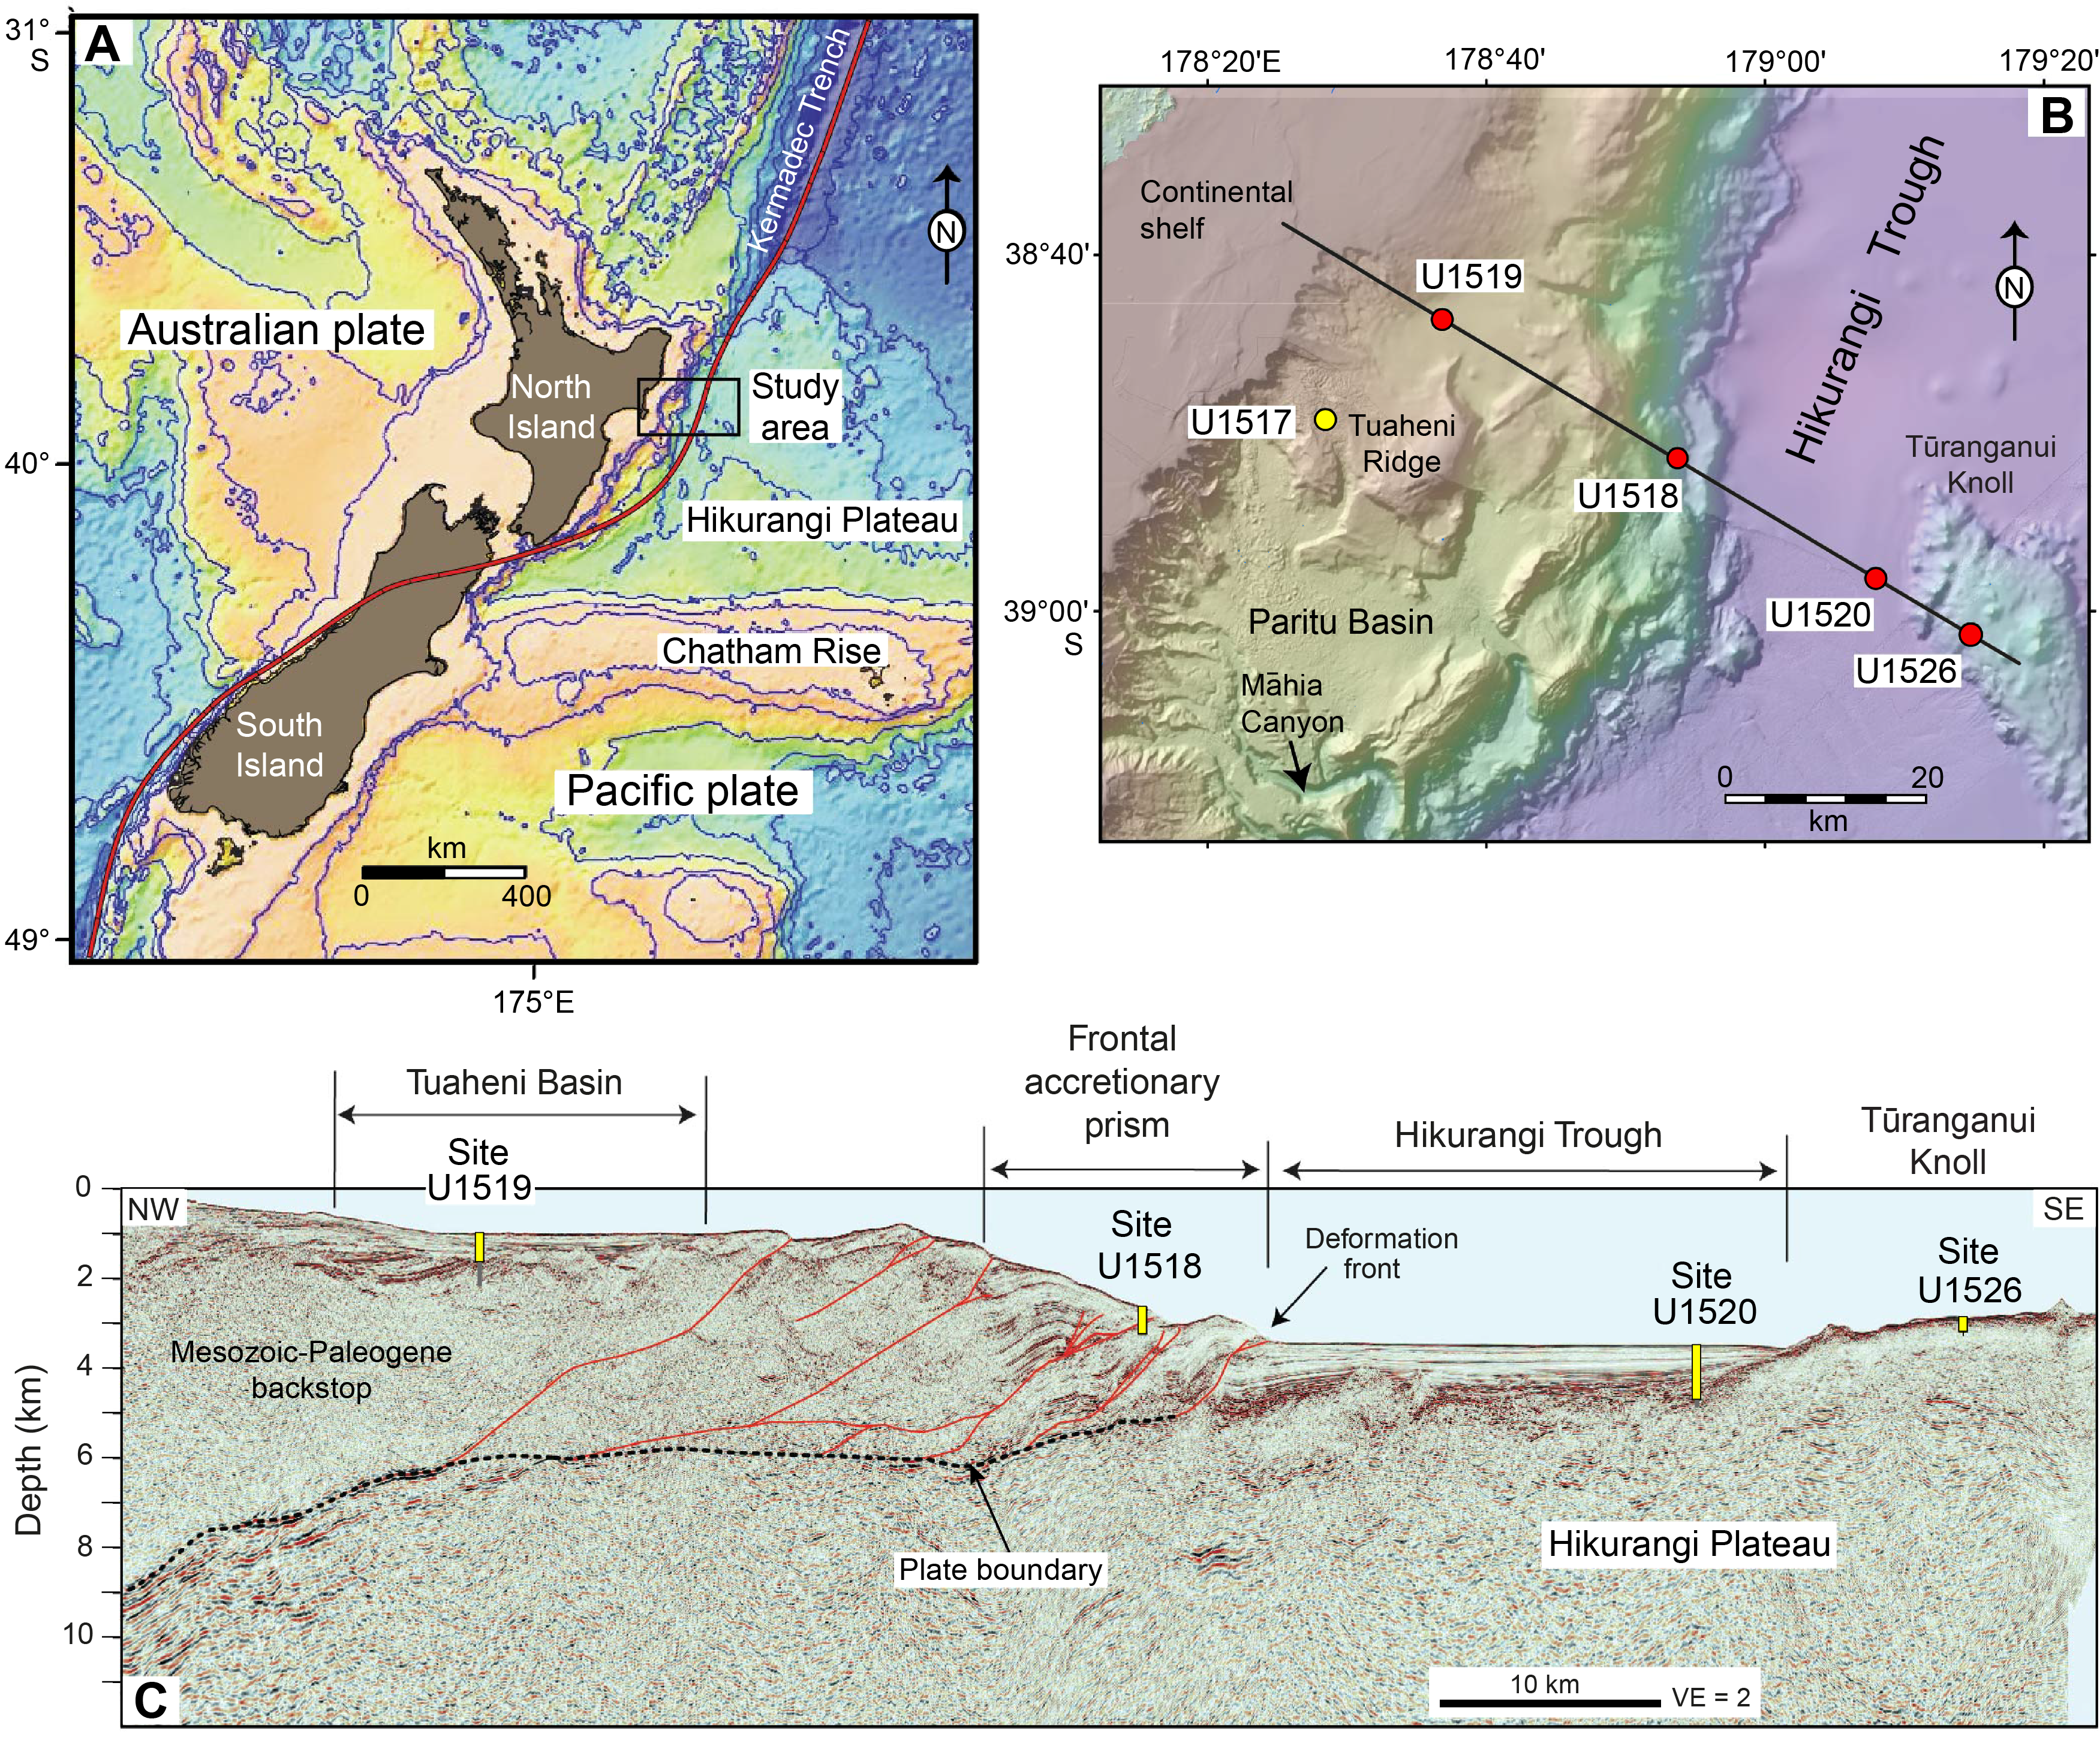
Figure F1. Study area and seismic reflection profile.
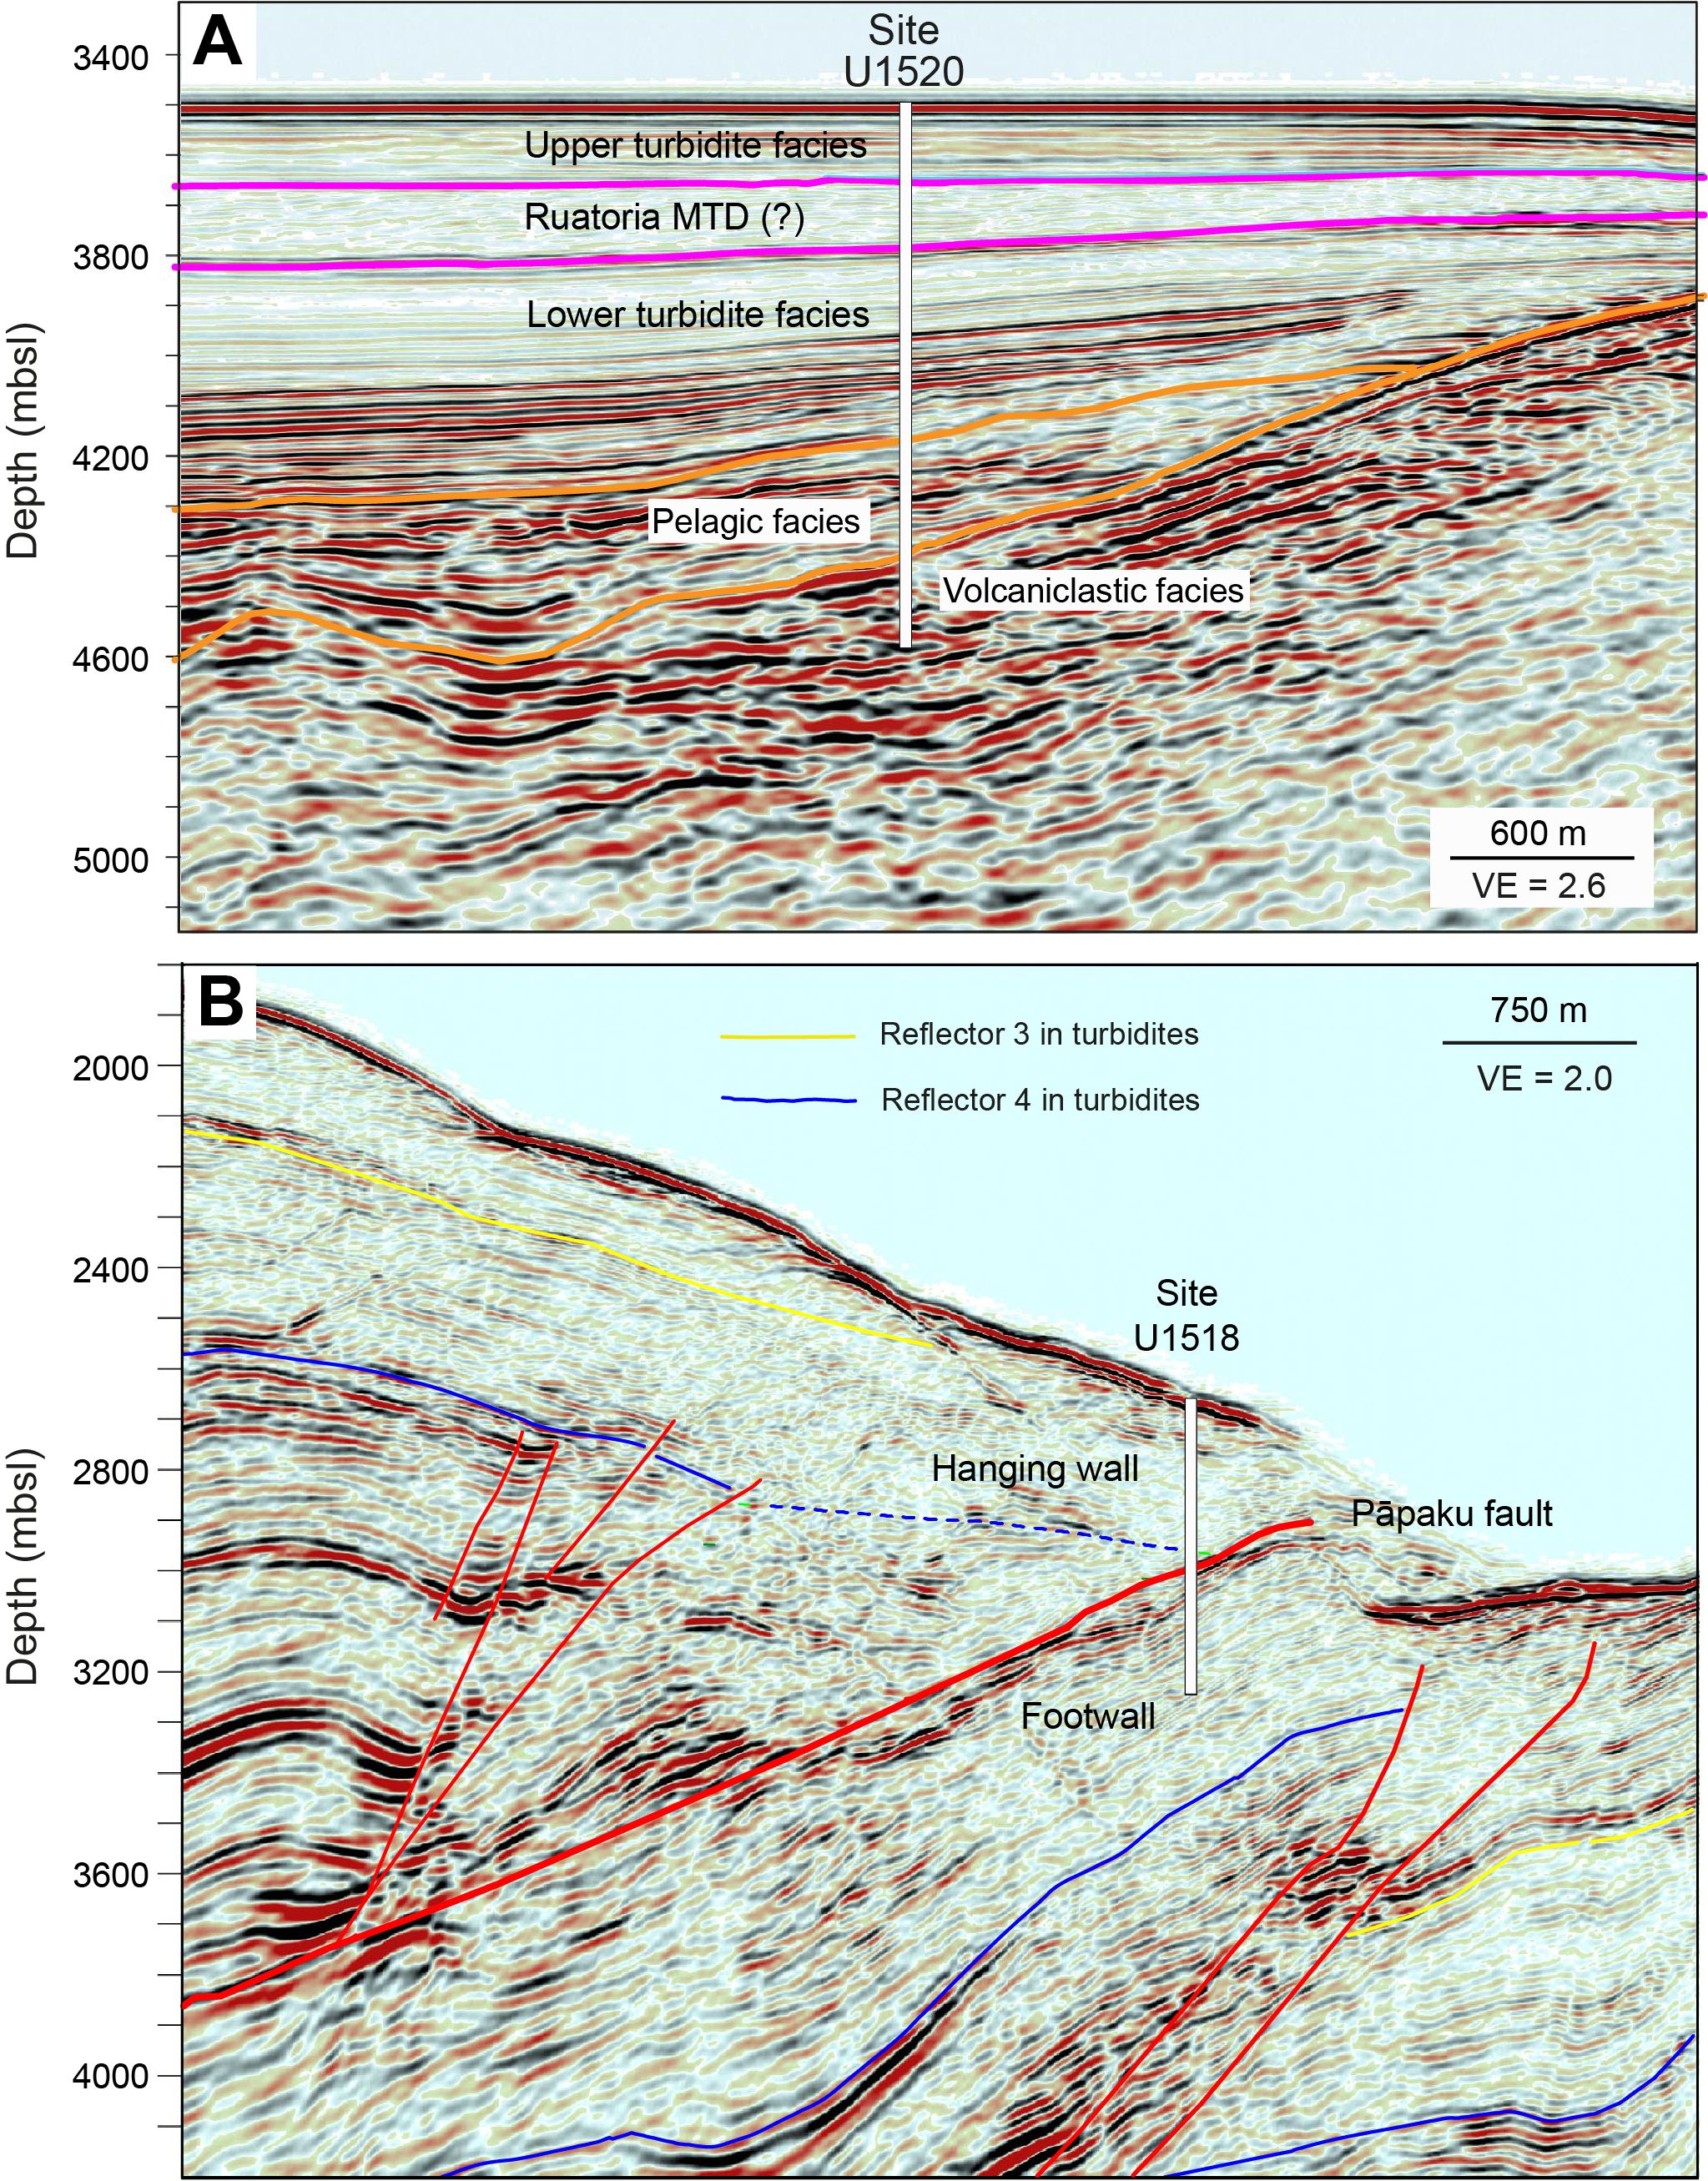
Figure F2. Interpreted seismic reflection profiles.
This data report summarizes the results of X-ray diffraction (XRD) analyses of clay mineral assemblages in the trench-turbidite sequences that were cored at Sites U1518 and U1520. The study's principal objective is to demonstrate whether or not stratigraphic variations in sediment composition, especially the clay mineral assemblages, might have contributed to the dynamics of fault slip and/or the development of structural architecture within the frontal accretionary prism. Of particular interest are potential contrasts or excursions in clay composition within or across the active Pāpaku thrust (Fagereng et al., 2019).
A secondary objective of this study is to provide constraints on interpretations of detrital provenance, weathering, erosion, and patterns of sediment dispersal. The data reported here, with a focus on Pleistocene trench-floor sedimentation, will expand upon regional- scale documentation of clay composition and help extend reconstructions of sediment dispersal to older periods of geologic time (e.g., Underwood, 2020; Underwood, submitted; Underwood and Dugan, submitted). Such compositional data are widely used as proxies for regional-scale reconstructions of paleoclimate, paleoceanography, and paleogeography (e.g., Petschick et al., 1996; Thiry, 2000; Gingele et al., 2001; Phillips et al., 2014). This objective, however, is particularly challenging in the case of the Hikurangi depositional system. In addition to sand and silt entering the trench by way of sediment gravity flows, transport of finer grained suspended sediment is affected by a southwest-directed surface current (the East Cape Current), a counterclockwise gyre (the Wairarapa Eddy), and a branch of the Deep Western Boundary Current, which circumvents Chatham Rise (Figure F1A) to flow toward the northeast near the study area (Carter and Wilkin, 1999; Carter et al., 2002, 2004; Chiswell et al., 2015). Bottom currents on the trench floor are evidently strong enough to remobilize turbidites that overtopped and escaped Hikurangi Channel (e.g., Lewis and Pantin, 2002), and that process has created what Bailey et al. (2021) refer to as a hybrid contourite drift. Thus, the potential exists at Sites U1518 and U1520 for both homogenization and interfingering of distinct clay mineral assemblages that were derived from multiple source areas; compositional signatures, moreover, may reflect the cumulative effects of multidirectional dispersal routes and repetitive resuspension.
Summary of lithostratigraphy
Site U1520
During Expedition 375, shipboard sedimentologists defined three lithostratigraphic units in the trench-floor deposits at Site U1520 (Figure F3), combining information from visual description of the split cores, smear slide analysis, digital color, magnetic susceptibility logs, logging-while-drilling results, and core measurements by structural geologists (Barnes et al., 2019). Decisions regarding units and unit boundaries were also influenced by regional-scale studies of seismic stratigraphy (Saffer et al., 2017). Overall, the common lithologies include fine sand to silt turbidites, volcanic ash, and hemipelagic mud (i.e., silty clay to clayey silt with modest amounts of biogenic carbonate). The depositional ages, based on calcareous nannofossils, planktonic foraminifers, and benthic foraminifers, range from Holocene at the seafloor to early Pleistocene (1.62 Ma) at ~503 meters below seafloor (mbsf) (Barnes et al., 2019).
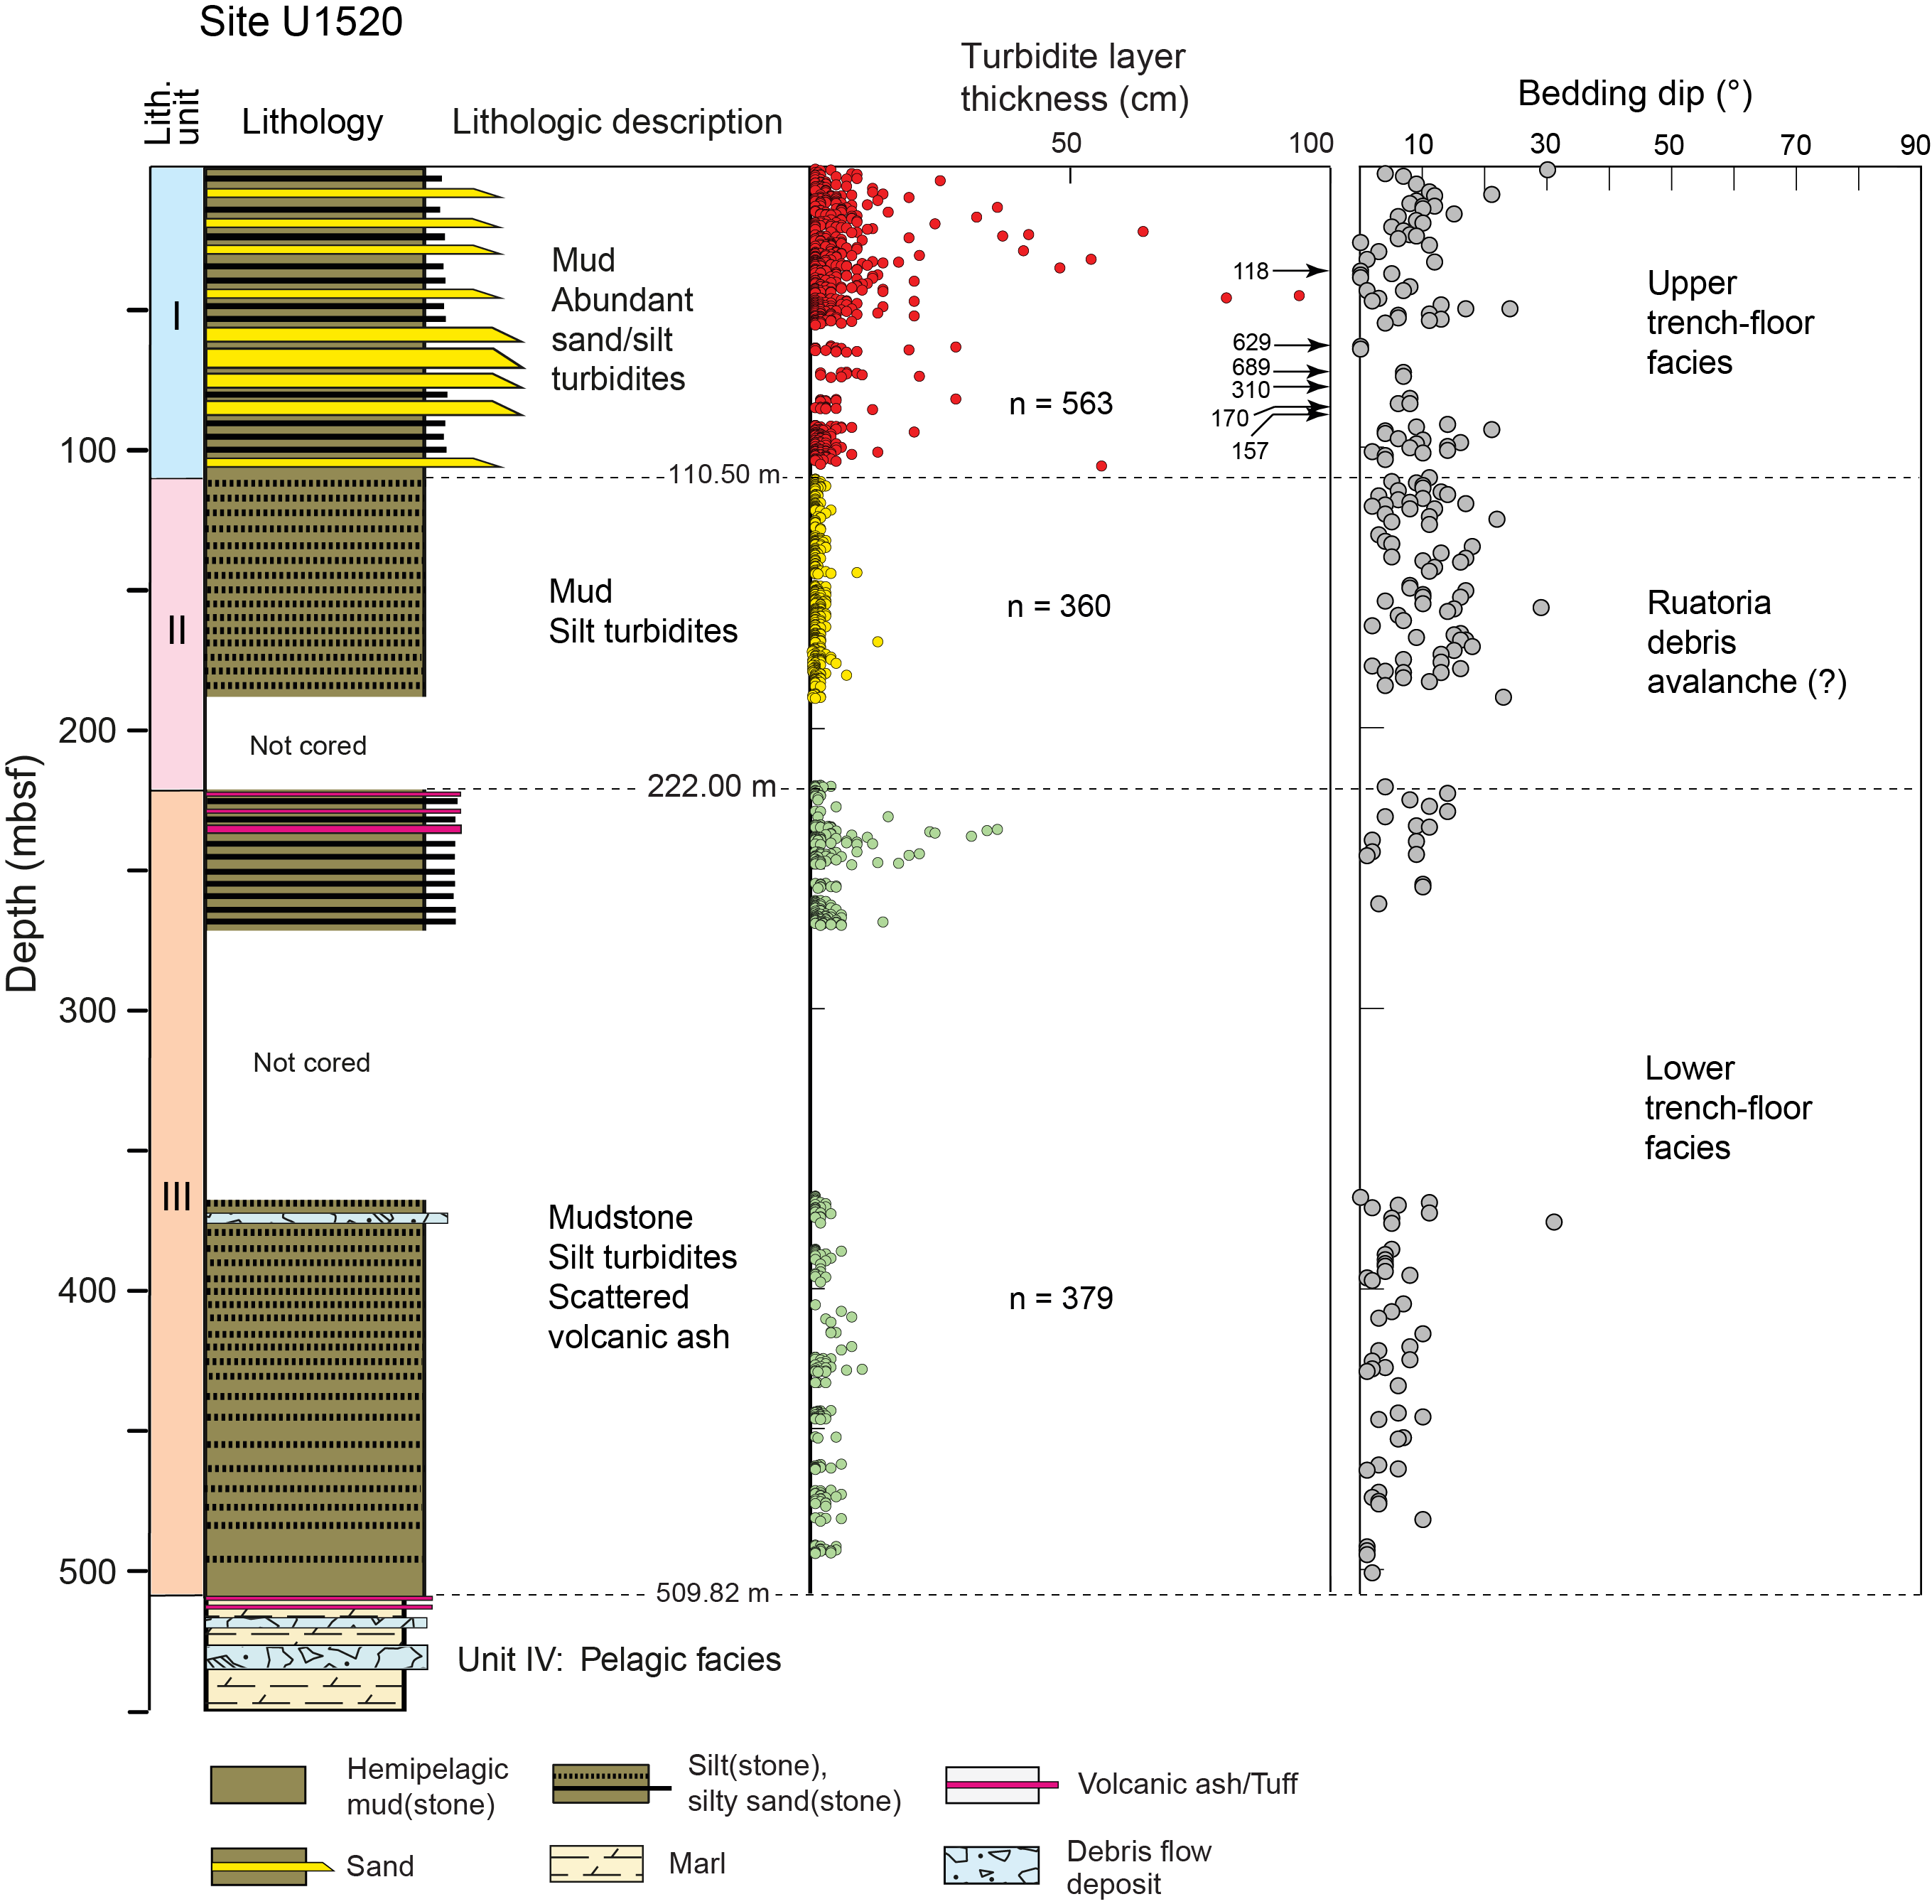
Figure F3. Trench-wedge deposits.
Unit I (0–110.50 mbsf) is composed of hemipelagic mud with abundant interbeds of silty and sandy turbidites, plus scattered layers of volcanic ash (Figure F3). The age of Unit I ranges from Holocene to late Pleistocene (0.29 Ma) (Barnes et al., 2019). No attempt was made to discriminate between pristine turbidites and layers of sand and silt that may have been modified after deposition by bottom currents. Shipboard scientists recorded a total of 563 turbidites in Unit I; most such beds are less than 10 cm thick, and the maximum thickness is 6.89 m (Figure F3). One likely pathway for such frequent coarse-grained turbidity currents is the leveed Hikurangi Channel (Lewis, 1994; Lewis et al., 1998; Lewis and Pantin, 2002), which follows the gradient of the northeast-trending trench axis before turning sharply east-southeast near the mouth of Māhia Canyon (previously known as Poverty Canyon) (Figure F1B). Regardless of that sharp turn, momentum has probably allowed overbank flows to continue toward the northeast into the transect area (Figure F1B). Two additional routes are feasible for turbidites in Unit I: transverse flows emanating from Māhia Canyon (Figure F1B) and, farther northeast, funneling through Ruatoria Channel along the southwest edge of the Ruatoria debris avalanche (Pouderoux et al., 2012).
Unit II (110.50–220.00 mbsf) was interpreted prior to coring (i.e., on the basis of its largely transparent seismic reflection character) to be a mass transport deposit (MTD) associated with the distal limits of the Ruatoria debris avalanche (Saffer et al., 2017). Previous studies of the Ruatoria MTD by Lewis et al. (1998) and Collot et al. (2001) speculated that synchronous deformation may have extended updip along the trench axis as far as the transect area. Unfortunately, the anticipated base of Unit II, where concentrated core-scale deformation might have been evident, was not cored; the interpreted depth of the unit's base, therefore, was estimated largely from correlations with logging-while-drilling results (Barnes et al., 2019). Interpretations of Unit II as a 110 m thick MTD remain controversial for several reasons. First, the cores do not display core-scale features that are conventionally regarded as criteria for identification of MTDs (e.g., truncated and/or rotated laminae, irregular and steep bedding dips, fragmentation of cohesive mud into intraformational clasts, clast-in-matrix fabric, flow banding). Second, bedding dips in Unit II are no different than those in the overlying and underlying units (Figure F3). Third, the lithologies in Unit II fail to match those recovered from proximal portions of the Ruatoria MTD. Collot et al. (2001) documented those Ruatoria lithologies as mostly calcareous mudstone and limestone, a significant departure from the lithologic character of Unit II, where hemipelagic mudstone is interbedded with a total of 360 recovered silty turbidites (Figure F3). Fourth, the ages of samples reported by Collot et al. (2001) are considerably older (Miocene–Pliocene) than the late Pleistocene age of Unit II (0.29–0.44 Ma) (Barnes et al., 2019). Given those facts, if Unit II truly represents the distal extension of the Ruatoria debris avalanche, then poorly lithified trench turbidites must have been pushed without rotation toward the southwest as an intact block measuring more than 110 m thick and the distance of displacement along the floor of Hikurangi Trough must have been trivial. Another plausible interpretation is that the Ruatoria MTD never reached as far as Site U1520.
Unit III (220.00–509.82 mbsf) likewise consists of moderately indurated and undeformed hemipelagic mudstone with thin interbeds of silty turbidites (Barnes et al., 2019). The maximum absolute age of Unit III remains uncertain, but the trench deposits appear to be no older than middle Pleistocene judging from the oldest nannofossil datum (1.62 Ma); that datum coincides with a midpoint depth of ~503 mbsf (Barnes et al., 2019). Shipboard scientists recorded a total of 379 turbidites in the cored interval (Figure F3); however, a substantial coring gap between 270 and 366 mbsf precludes accurate statistical analysis for the entire unit. Bedding dips in Unit III are similar to those in Unit II, and smear slide observations indicate that the fine-grained turbidites probably originated from sources similar to those that supplied sediments to Units I and II (Barnes et al., 2019). The downward facies transition from lowermost terrigenous turbidites to the top of pelagic carbonates (calcareous mud to muddy nannofossil ooze) was not recovered, but the Unit III/IV contact is presumed to be conformable (Barnes et al., 2019). XRD results for the carbonates, as well as the underlying volcaniclastic sediments, appear in a separate data report (Underwood, submitted).
Site U1518
At Site U1518, shipboard sedimentologists during Expedition 375 recognized three lithostratigraphic units in the accreted trench-turbidite facies on either side of the Pāpaku thrust (Figure F4). Their subdivisions of the stratigraphy incorporated information from visual description of the split cores, smear slide analysis, digital color, magnetic susceptibility logs, logging-while-drilling results, and measurements of deformation features by structural geologists (Saffer et al., 2019b). Units I and III were each divided into two subunits, but differences among the units and subunits are subtle. Overall, the common lithologies include fine sand and silt turbidites, intraformational MTDs, volcanic ash, and hemipelagic mud. The depositional ages, based on calcareous nannofossils and planktonic foraminifers, range from Holocene to middle Pleistocene (Saffer et al., 2019b). Correlations among acoustic responses on seismic reflection profiles (Saffer et al., 2017) indicate that the entire cored interval at Site U1518 (i.e., hanging wall, fault zone, and footwall) matches lithologic Unit III at Site U1520 (Figure F2). In other words, those accreted strata probably were deposited in the Hikurangi Trough prior to the Ruatoria mass transport event.
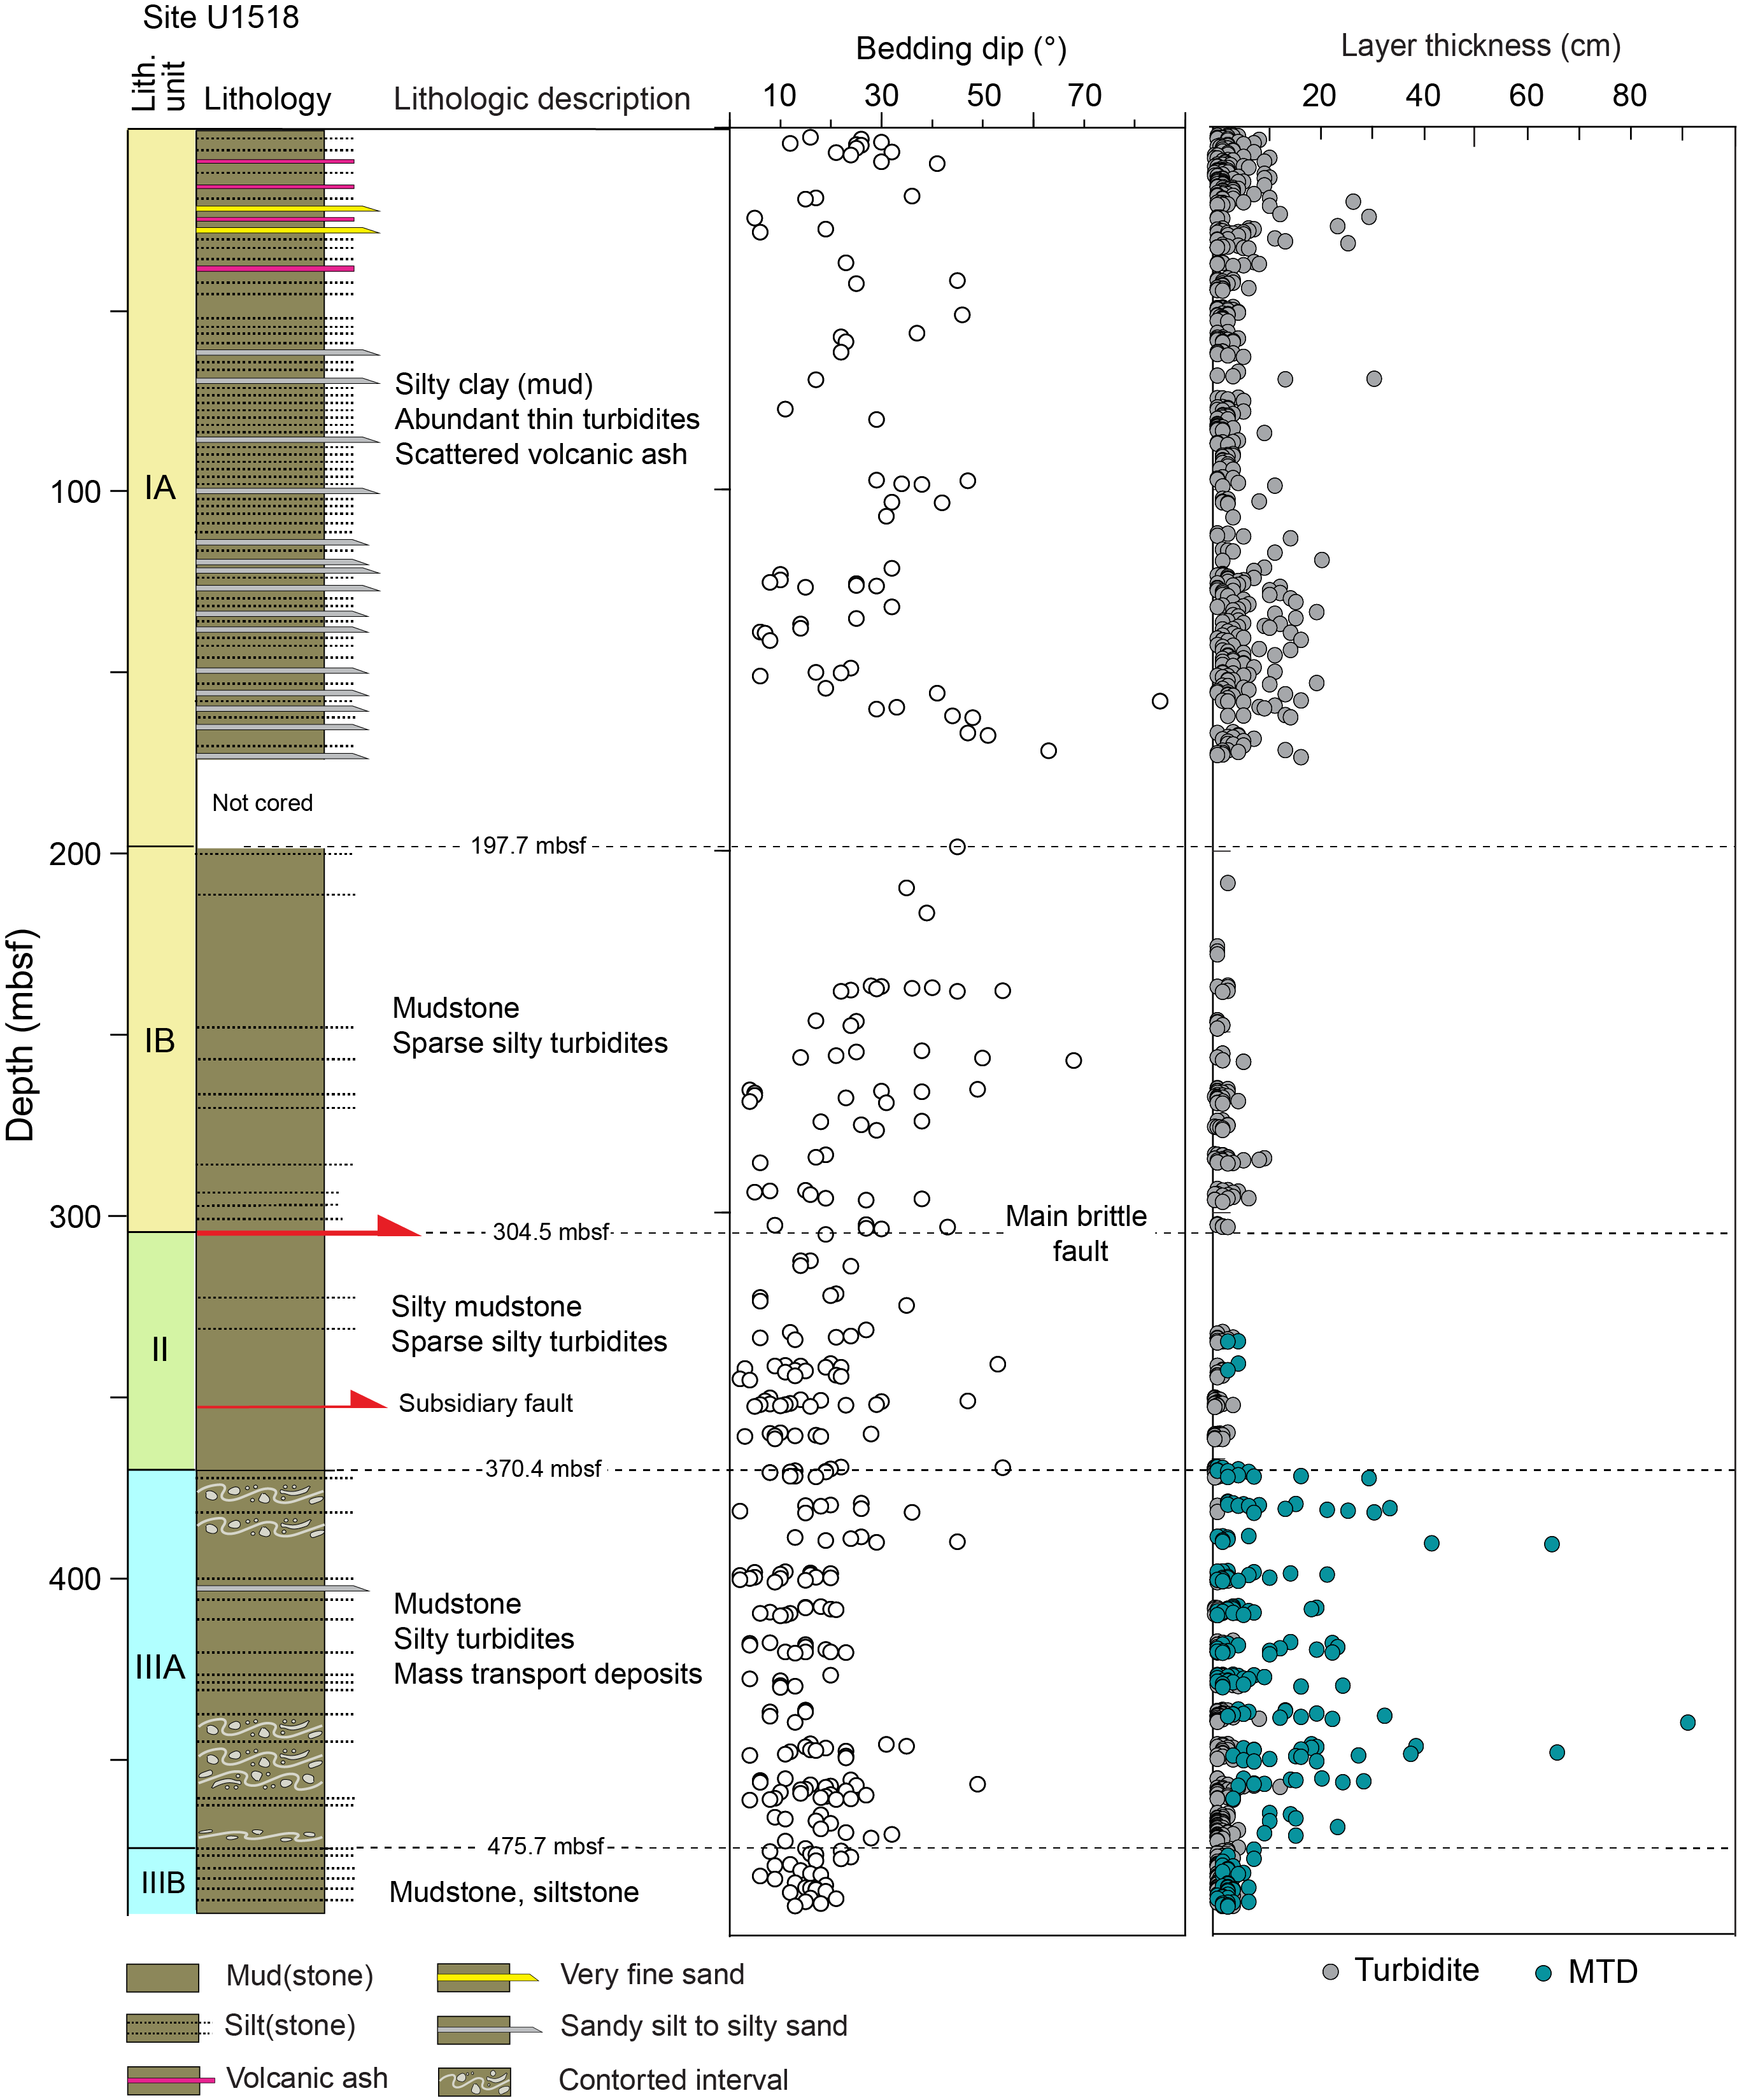
Figure F4. Accreted trench-wedge deposits.
Unit I (0–304.53 mbsf) includes a 2.2 m thick blanket of Holocene mud. The remainder of Unit I is older than 0.53 Ma and consists of hemipelagic mud with numerous thin interbeds of silty sand, sandy silt, and silt. The distinction between Subunits IA and IB (Figure F4) is based on the character of silty interbeds, which are more repetitive and thicker in Subunit IA. A total of 468 turbidites were identified in Subunit IA (Figure F4). The top of Unit II (304.53–370.40 mbsf) coincides with the main brittle fault in the Pāpaku thrust (Figure F2B). The dominant lithology within the fault zone is hemipelagic mudstone along with sparse interbeds of siltstone. Ages in the fault zone are younger than 0.53 Ma (Saffer et al., 2019b). Unit III (370.40–492.26 mbsf) likewise contains interbeds of hemipelagic mudstone and sandy siltstone (Figure F4). Cores from Subunit IIIA display intervals with contorted stratification and intraformational mud clasts, which shipboard scientists interpreted to be products of mass transport (Saffer et al., 2019b). In contrast, MTDs are absent in Subunit IIIB (Figure F4).
Methods
Samples
A total of 208 specimens for XRD analyses were obtained from the working halves of split cores, covering all six of the trench-related lithologic units. The primary intent was to focus on the background lithology of silty clay to clayey silt (hemipelagic mud), but some of the sampling may have inadvertently captured the muddy tops of turbidites and/or contourites. Most samples were collocated in "clusters" immediately adjacent to whole-round specimens. Some of those whole-round specimens were analyzed shipboard for interstitial water geochemistry (Barnes et al., 2019; Saffer et al., 2019b), and others were collected for shore-based tests of hydrogeological, frictional, and geotechnical properties (e.g., Jeppson and Kitajima, 2019). The clusters also included collocated specimens for shipboard measurements of moisture and density, carbon-carbonate, and bulk powder XRD (see Wallace et al., 2019, for XRD methods). A smaller set of samples intentionally targeted the muddy tops of turbidites in collaboration with studies of sand provenance (e.g., Marsaglia et al., 2019). Those samples do not have collocated bulk powder XRD results.
Sample preparation
Several steps are required to isolate the clay-sized fraction (<2 mm) for XRD analyses. The first is to place a split of air-dried sediment in a 600 mL beaker with 2% hydrogen peroxide to initiate disaggregation and remove organic matter. Next, the disaggregated sediment is suspended in ~250 mL of Na hexametaphosphate solution (concentration of 4 g/1000 mL distilled H2O). Beakers with suspended sediment are inserted into an ultrasonic bath for several minutes to promote dispersion and retard flocculation of the clays. Next, suspensions are washed of solutes by two passes through a centrifuge (8000 revolutions per minute [rpm] for 20 min; ~6000 × g) with resuspension in distilled deionized water after each pass. After that step, the suspensions are transferred to 125 mL plastic bottles and dispersed by vigorous shaking plus insertion of an ultrasonic cell probe for ~2.5 min. Clay-sized splits (<2 μm equivalent spherical settling diameter) are separated from the silt and sand by centrifugation (1000 rpm for 3.6 min; ~320 × g). Oriented clay aggregates are prepared following the filter-peel method (Moore and Reynolds, 1989b) using 0.45 μm filter membranes and glass discs. This approach is desirable because better preferred orientation enhances the intensity of basal reflections. To saturate the clay aggregates with ethylene glycol, clay-covered discs are placed in a closed vapor chamber at room temperature for ~48 h. This last step expands the interlayer of smectite to ~17Å, which minimizes overlap between the peaks associated with smectite (001) and chlorite (001) reflections (Figure F5).
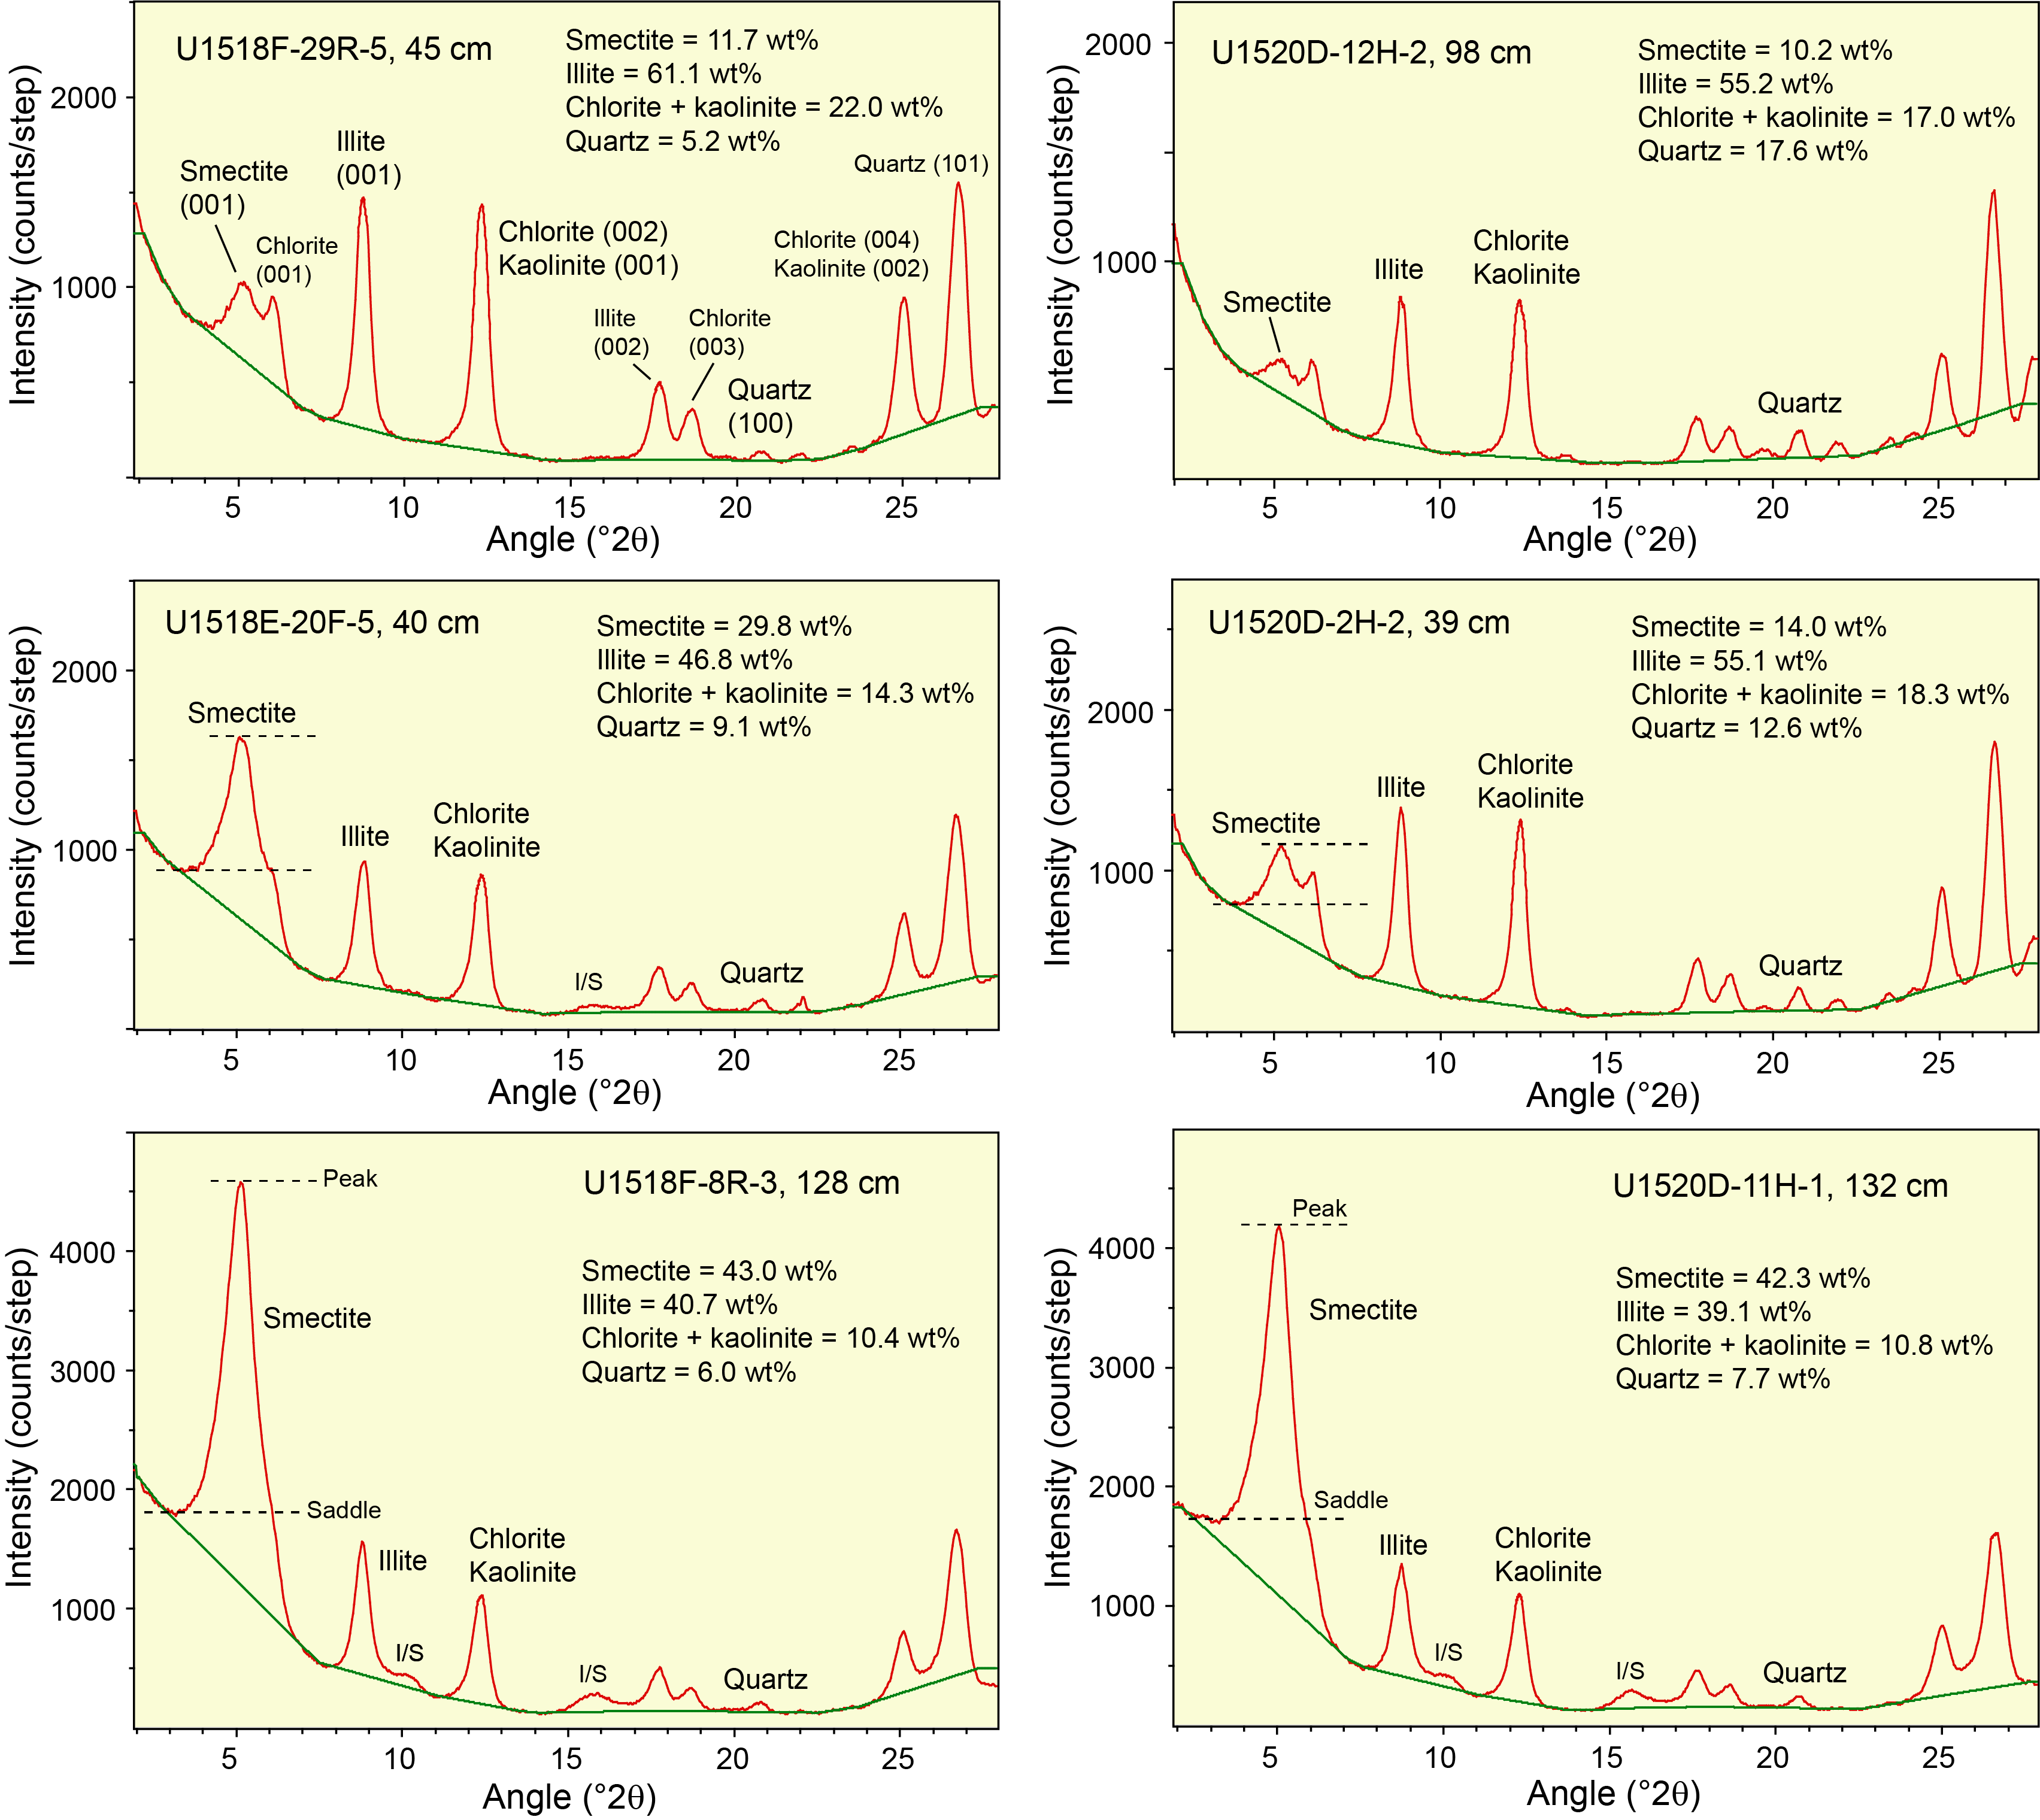
Figure F5. X-ray diffractograms of oriented clay-sized specimens.
X-ray diffractometer settings
The oriented aggregates were analyzed at the New Mexico Bureau of Geology and Mineral Resources using a Panalytical X'Pert Pro diffractometer under the following parameters: generator settings = 45 kV and 40 mA, angular range = 2°–28.0°2θ, scan step time = 1.6 s, step size = 0.01°2θ, sample holder = stationary, slits fixed at 0.5 mm (divergence) and 0.1 mm (receiving), and specimen length = 10 mm. Raw data files were processed using MacDiff software (version 4.2.5) to establish a baseline of intensity, smooth counts, correct peak positions offset by slight misalignments of the detector and sample holder (using the quartz 100 peak at 20.95°2θ), and record peak intensities (counts/step) and to compute integrated peak areas (total counts). Six representative diffractograms are shown in Figure F5, three from each site, and diagnostic peaks for smectite, illite, undifferentiated (chlorite + kaolinite), and quartz are identified.
Computations of mineral abundance
Computations of relative abundances for each of the common clay-sized minerals are based on values of integrated peak area from the smectite (001), illite (001), chlorite (002) + kaolinite (001), and quartz (100) reflections (Figure F5). As scrutinized in more detail by Underwood et al. (2020), three computational approaches were tested during this study: (1) Biscaye (1965) peak-area weighting factors, which are equal to 1× smectite, 4× illite, and 2× undifferentiated (chlorite + kaolinite); (2) a set of regression equations that relate peak area to weight percent, where smectite + illite + undifferentiated (chlorite + kaolinite) + quartz = 100%; and (3) a matrix of singular value decomposition (SVD) normalization factors (see Fisher and Underwood [1995] and Underwood et al. [2003] for a full description of the SVD approach), also where smectite + illite + undifferentiated (chlorite + kaolinite) + quartz = 100% (Table T1). The method of Guo and Underwood (2011) was used to compute proportions of chlorite to kaolinite within that two-component mixture. When using either SVD factors or regression equations, the sum of the four main relative abundance values is sometimes less than 100%, and that outcome (i.e., suppression of peak intensity) is usually caused by filter-peel transfers that are too thin (i.e., less than "infinite" thickness). Another contributing factor, however, might be inclusion of additional minerals or amorphous solids within the clay-sized fraction (e.g., feldspar, volcanic glass shards, biogenic calcite). To overcome those technical artifacts, the four relative abundance values were normalized to 100%.
As documented thoroughly by Underwood et al. (2020), errors of accuracy, as determined by XRD data from standard mineral mixtures, are largest (as high as ±18.6%) when computations utilize the Biscaye (1965) weighting factors. The average absolute errors of accuracy are smallest when regression equations are used for computations: illite = 3.0 wt%, undifferentiated (chlorite + kaolinite) = 5.1 wt%, and smectite = 3.9 wt%. Errors using SVD factors are slightly larger (Underwood et al., 2020). Accordingly, the graphical plots and statistical comparisons in this report use data computed from the regression equations. Compositional differences among individual specimens and lithologic units are not considered to be geologically significant unless those differences are greater than the errors shown above.
The Biscaye-based computations systematically overestimate the proportion of undifferentiated (chlorite + kaolinite) and systematically underestimate the proportion of illite (Underwood et al., 2020). The same systematic shifts are also clear in the computed results for Sites U1518 and U1520 (Figure F6). Furthermore, Biscaye-computed estimates for %smectite tend to be systematically lower than regression-computed values at lower concentrations (<25 wt%) and systematically higher than regression-computed values at higher concentrations (>35 wt%). Regardless of those shortcomings, the Biscaye-computed values are tabulated in this report to permit direct comparisons with legacy data from previous XRD studies in the Hikurangi region (e.g., Winkler and Dullo, 2002). Another weakness of the Biscaye (1965) approach, however, is that it does not account for clay-sized quartz, a common detrital component that might influence geotechnical and frictional properties. To permit valid comparisons among the three sets of computational results, the relative weight percent values from SVD and regression equations were recalculated to a normalized three-component clay-only assemblage, where smectite + illite + undifferentiated (chlorite + kaolinite) = 100%. That clay-only assemblage is probably the most relevant data set for studies of detrital provenance and sediment dispersal.
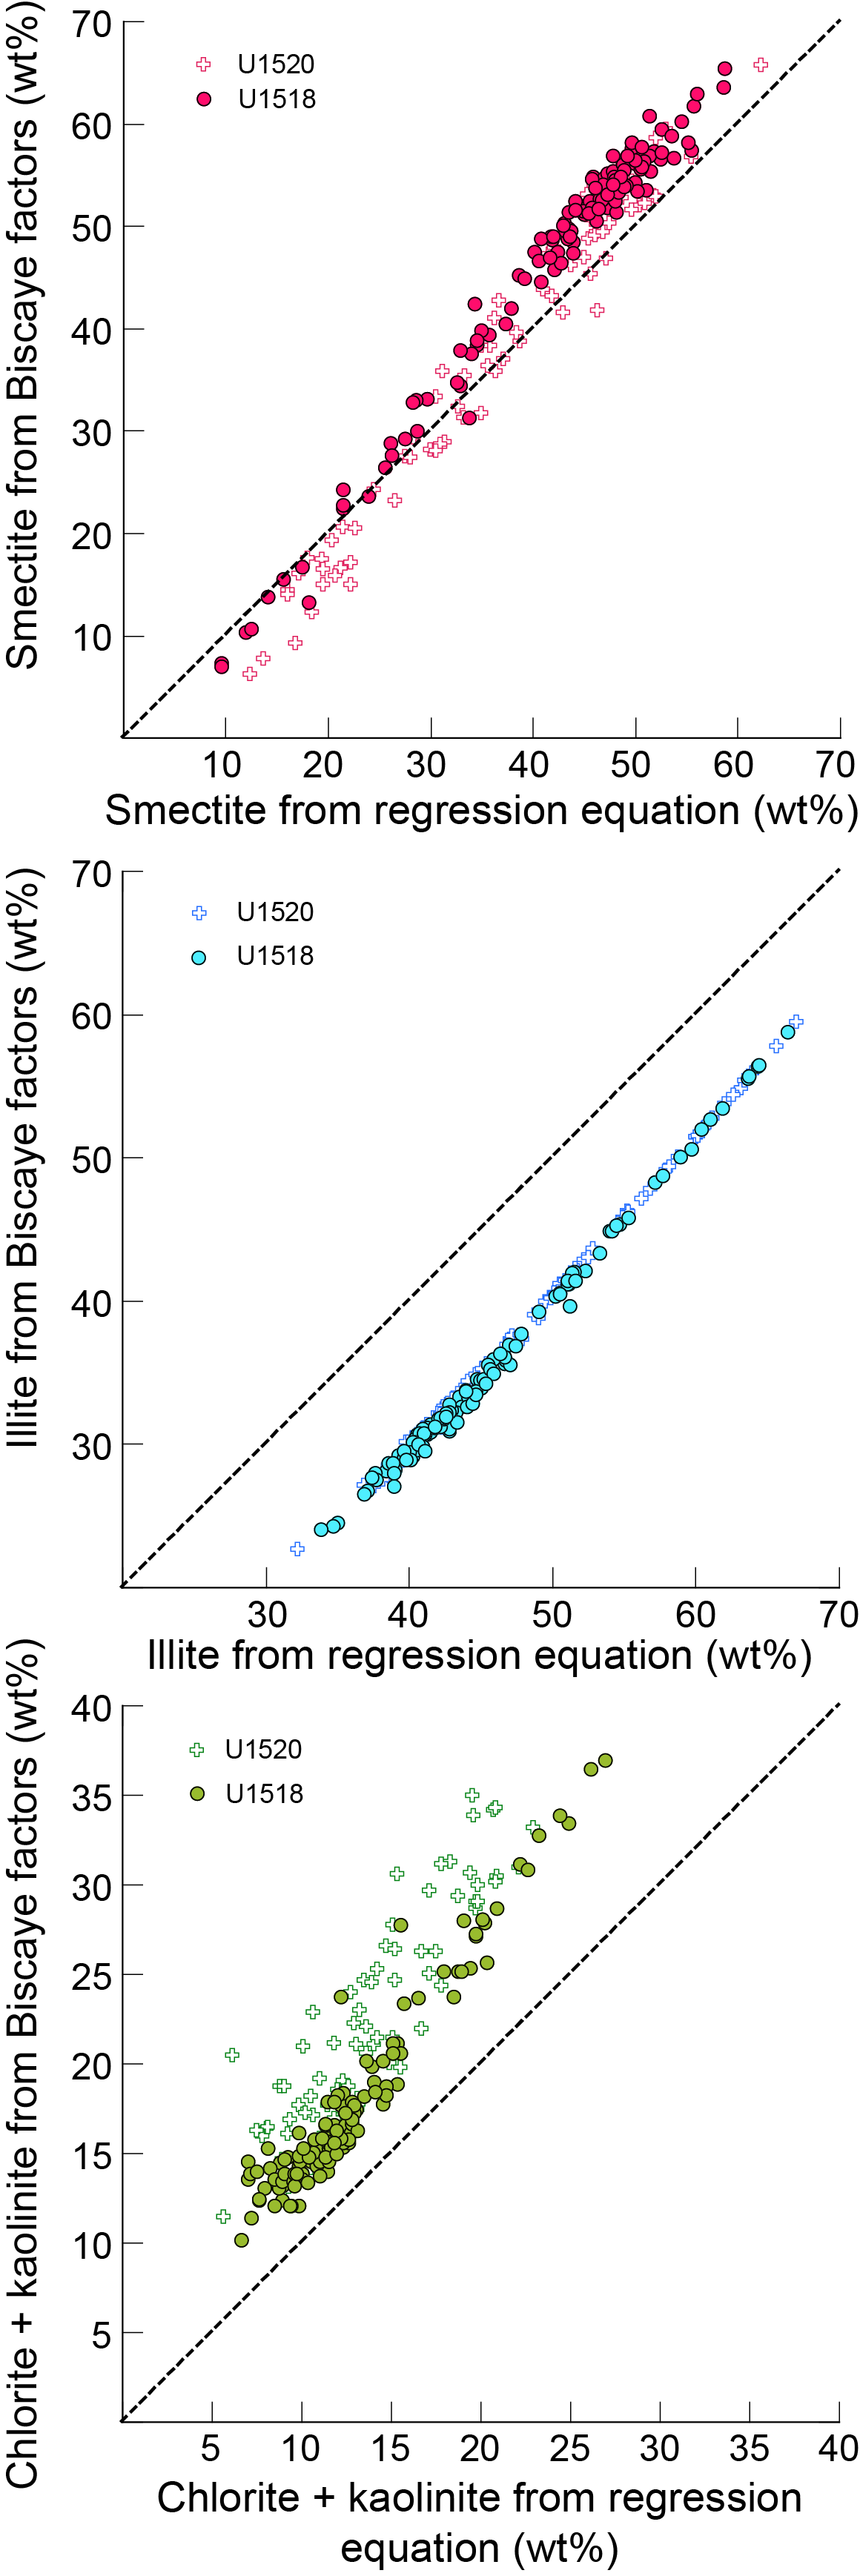
Figure F6. Computed common clay mineral weight percent values.
To compute the normalized percentage of each individual clay mineral (e.g., smectite) in the bulk sediment, the normalized relative abundance of total clay minerals, as obtained from shipboard bulk powder XRD (Barnes et al., 2019), was multiplied by the computed weight percent value for that specific clay mineral (e.g., smectite) in the normalized clay-only assemblage. For example, if total clay minerals equal 43 wt% and the normalized proportion of smectite among the clay minerals equals 52 wt%, then the estimated amount of smectite in the bulk sediment equals 21.8 wt%. A key assumption here is that all of the clay minerals reside in the clay-sized fraction, as defined by spherical equivalent settling behavior. The bulk sediment weight percent values are included in this report to assist with assessments of postexpedition laboratory experiments that quantify frictional and geotechnical properties (e.g., Brown et al., 2003; Kopf and Brown, 2003; Ikari et al., 2018).
Given the relatively shallow burial depths of all samples analyzed (<510 mbsf), together with the projected in situ temperatures of ~18°–21°C at the bottom of the two cored intervals (Barnes et al., 2019; Saffer et al., 2019b), the common XRD criteria for evaluating clay diagenesis should be viewed as indicators of geologic conditions within detrital source areas. Three such criteria were evaluated. First, the peak width at half maximum for the illite (001) peak is a widely used measure of illite crystallinity (units = Δ°2θ), otherwise known as the Kübler index (e.g., Kisch, 1991; Ferreiro Mählmann and Frey, 2012; Warr and Ferreiro Mählmann, 2015). Those peaks narrow as the assemblage of illite plus illitic white mica becomes more crystalline. Second, the saddle:peak intensity ratio (Figure F5) can be used to compute the "expandability" of smectite plus illite/smectite (I/S) mixed-layer clay in the assemblage (Rettke, 1981). This method is sensitive to the proportions of discrete illite versus I/S mixed-layer clay, so the curve for a 1:1 mixture of illite and smectite + I/S was chosen. The third method is computation of the percentage of illite layers in the I/S mixed-layer clay, which requires a visual pick of the angular position (°2θ) of the composite I(002)/S(003) peak (Figure F5). With progressive illitization, that peak shifts systematically to higher angles (Moore and Reynolds, 1989a). A reliable determination of %illite is possible only when the intensity of the I/S peak is high enough to resolve a clear apex above background noise.
Results
Clay mineral assemblages at Site U1520
The results of 82 XRD measurements are tabulated in Table T2, and the computed values of relative and normalized weight percent, using the three computational approaches, are listed in Table T3. Overall, the trench-wedge section at Site U1520 (Units I–III) displays considerable scatter in clay-sized mineral assemblages (Figure F7). Proportions of smectite range from 11.4 to 51.9 wt% with a mean value (µ) of 31.4 wt% and a standard deviation (σ) of 11.1. Illite values range from 26.8 to 56.1 wt% (µ = 41.5; σ = 6.9), and the proportion of undifferentiated (chlorite + kaolinite) ranges from 4.3 to 20.6 wt% (µ = 11.6; σ = 3.6). These standard deviations for the clay minerals are roughly 2× greater than comparable statistics for Site U1517 on the upper trench slope (Underwood and Dugan, submitted). Careful examination of the overlapping chlorite (004) and kaolinite (002) peaks (following Guo and Underwood, 2011) indicates that kaolinite occurs in trace amounts and has an average of only 0.8 wt%. The content of clay-sized quartz also shows significant variability, ranging from 5.1 to 30.3 wt% (µ = 15.5; σ = 6.1). Higher quartz content in the clay-sized fraction is typically an effect of more very fine silt in the muddy tops of turbidites.
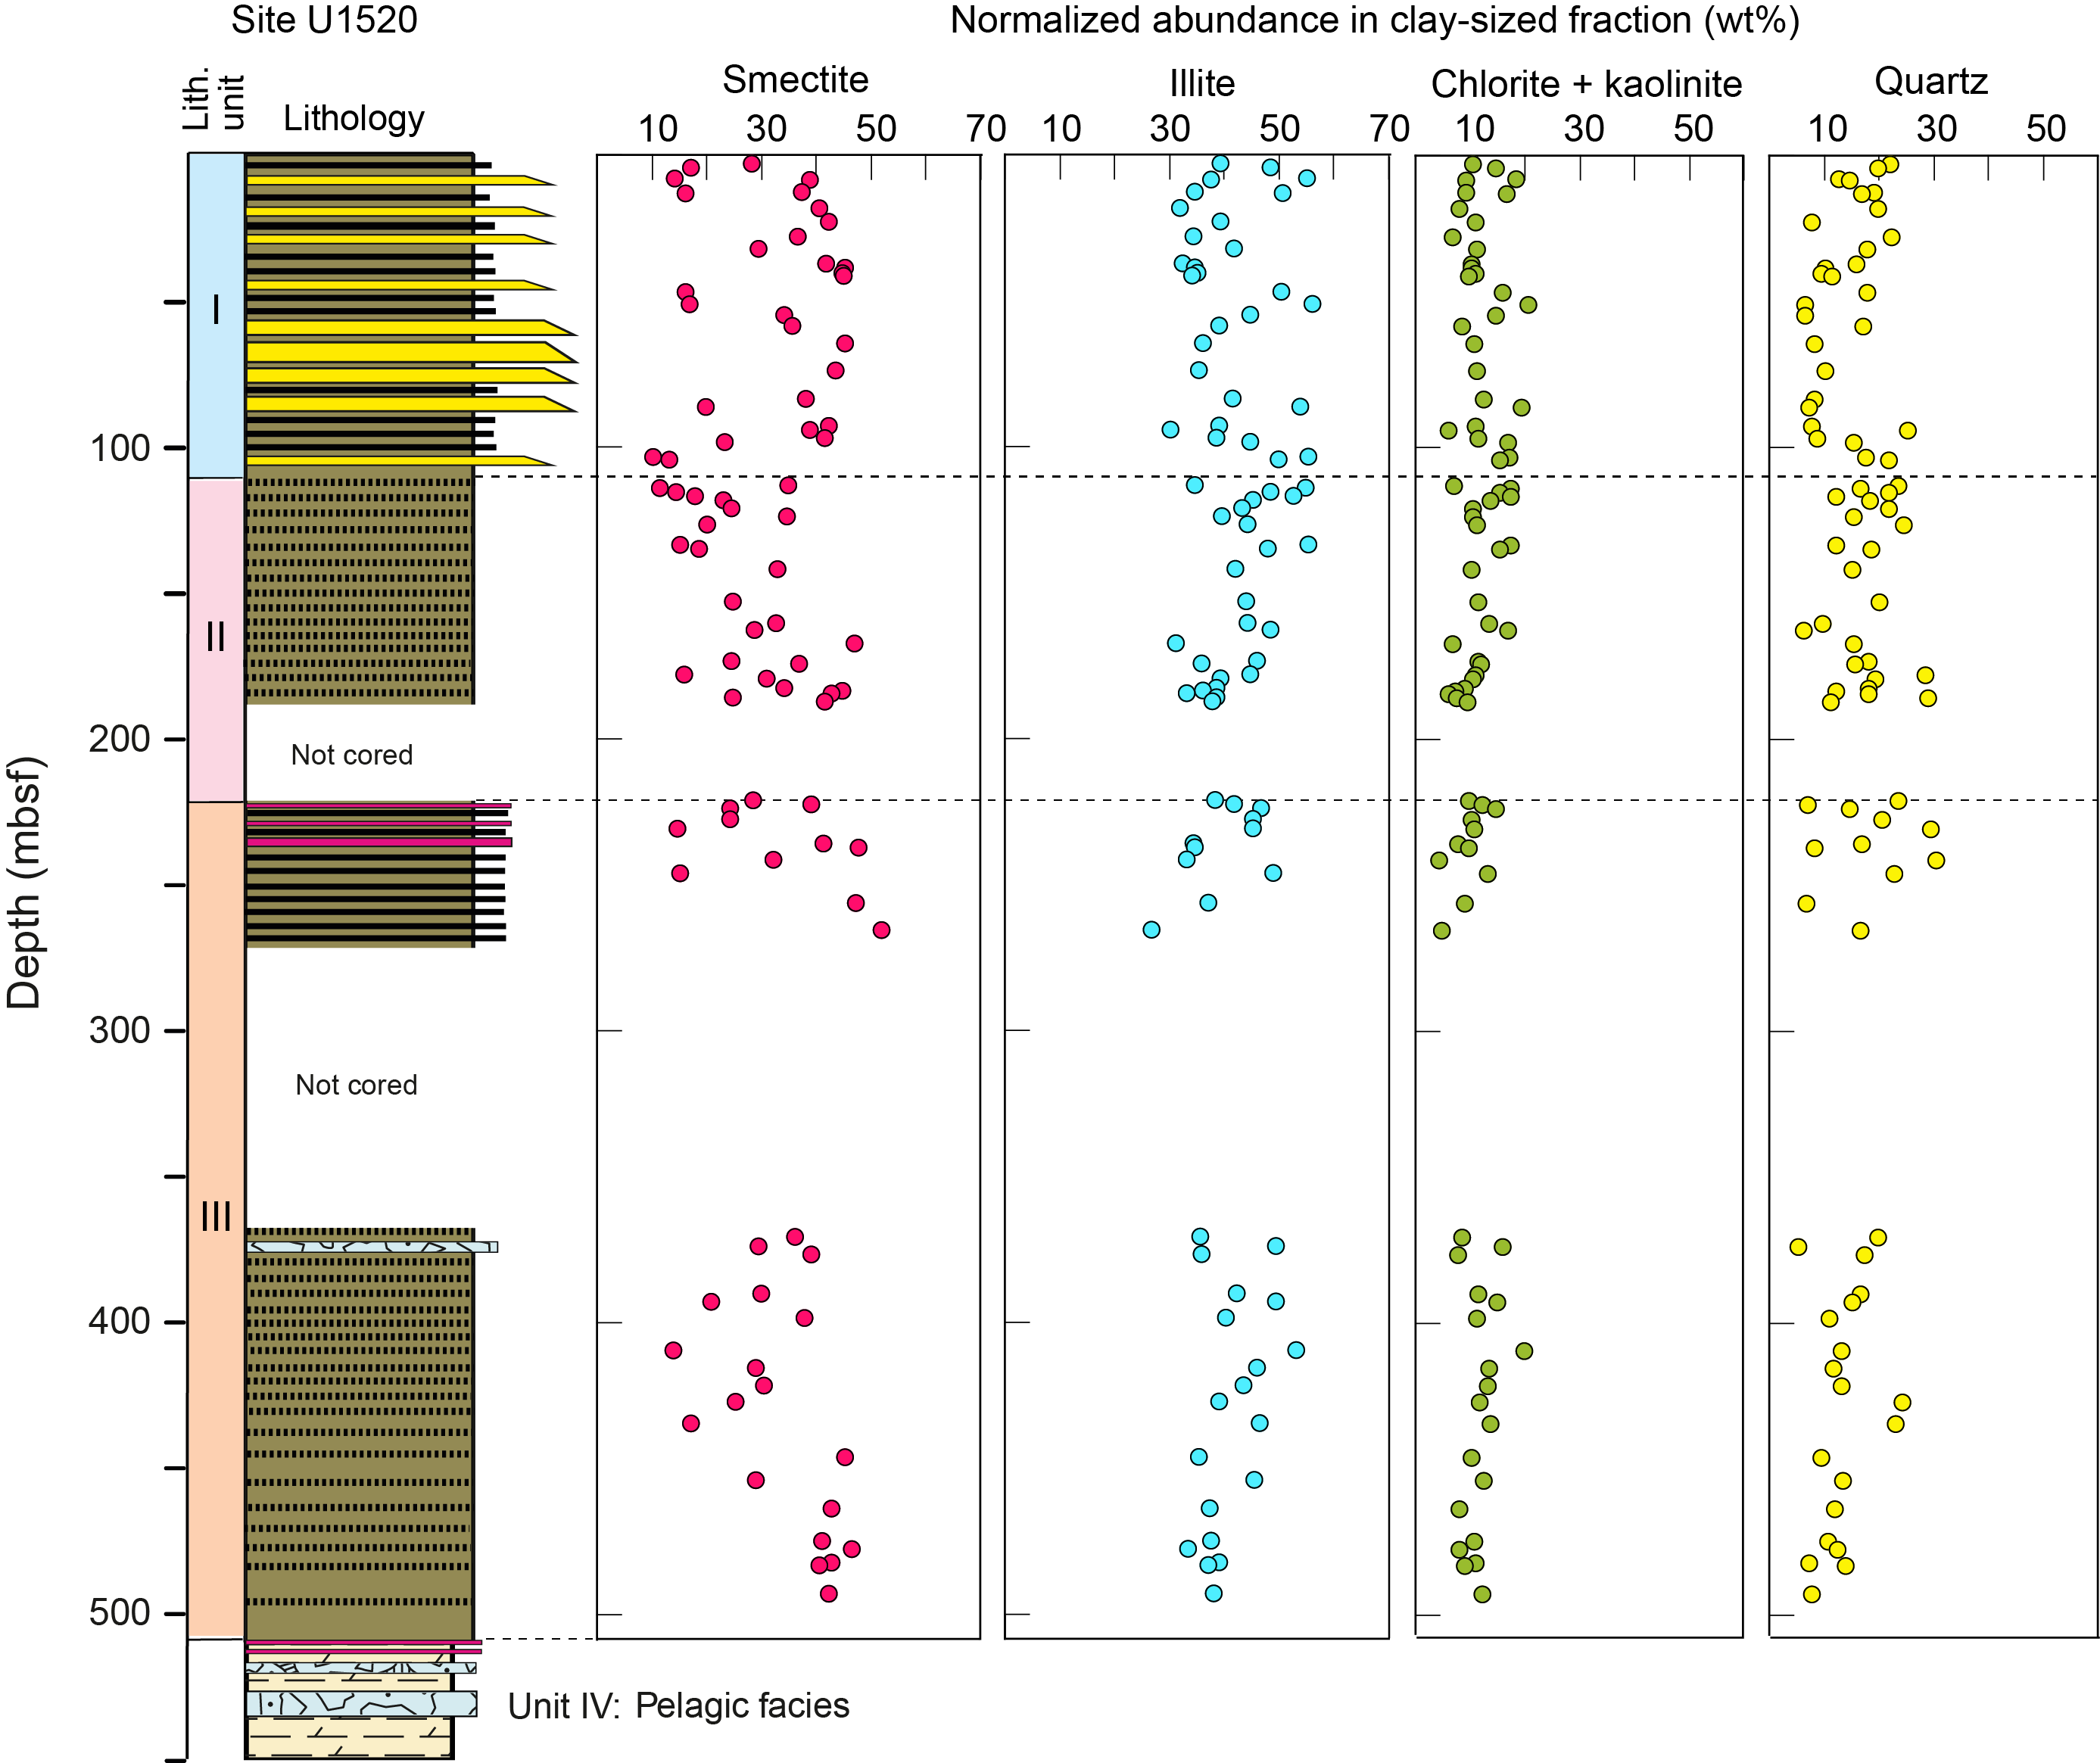
Figure F7. Normalized relative abundance values of minerals in the clay-sized fraction, Site U1520.
Normalized weight percent values among the clay minerals (i.e., where smectite + illite + undifferentiated [chlorite + kaolinite] = 100%) are tabulated in Table T3. These results also reveal unusual degrees of scatter in all lithologic units (Figure F8). The values of mean weight percent and standard deviation for Unit I are
- Smectite: µ = 37.1 wt% and σ = 13.5.
- Illite: µ = 48.5 wt% and σ = 9.4.
- Undifferentiated (chlorite + kaolinite): µ = 14.3 wt% and σ = 4.3.
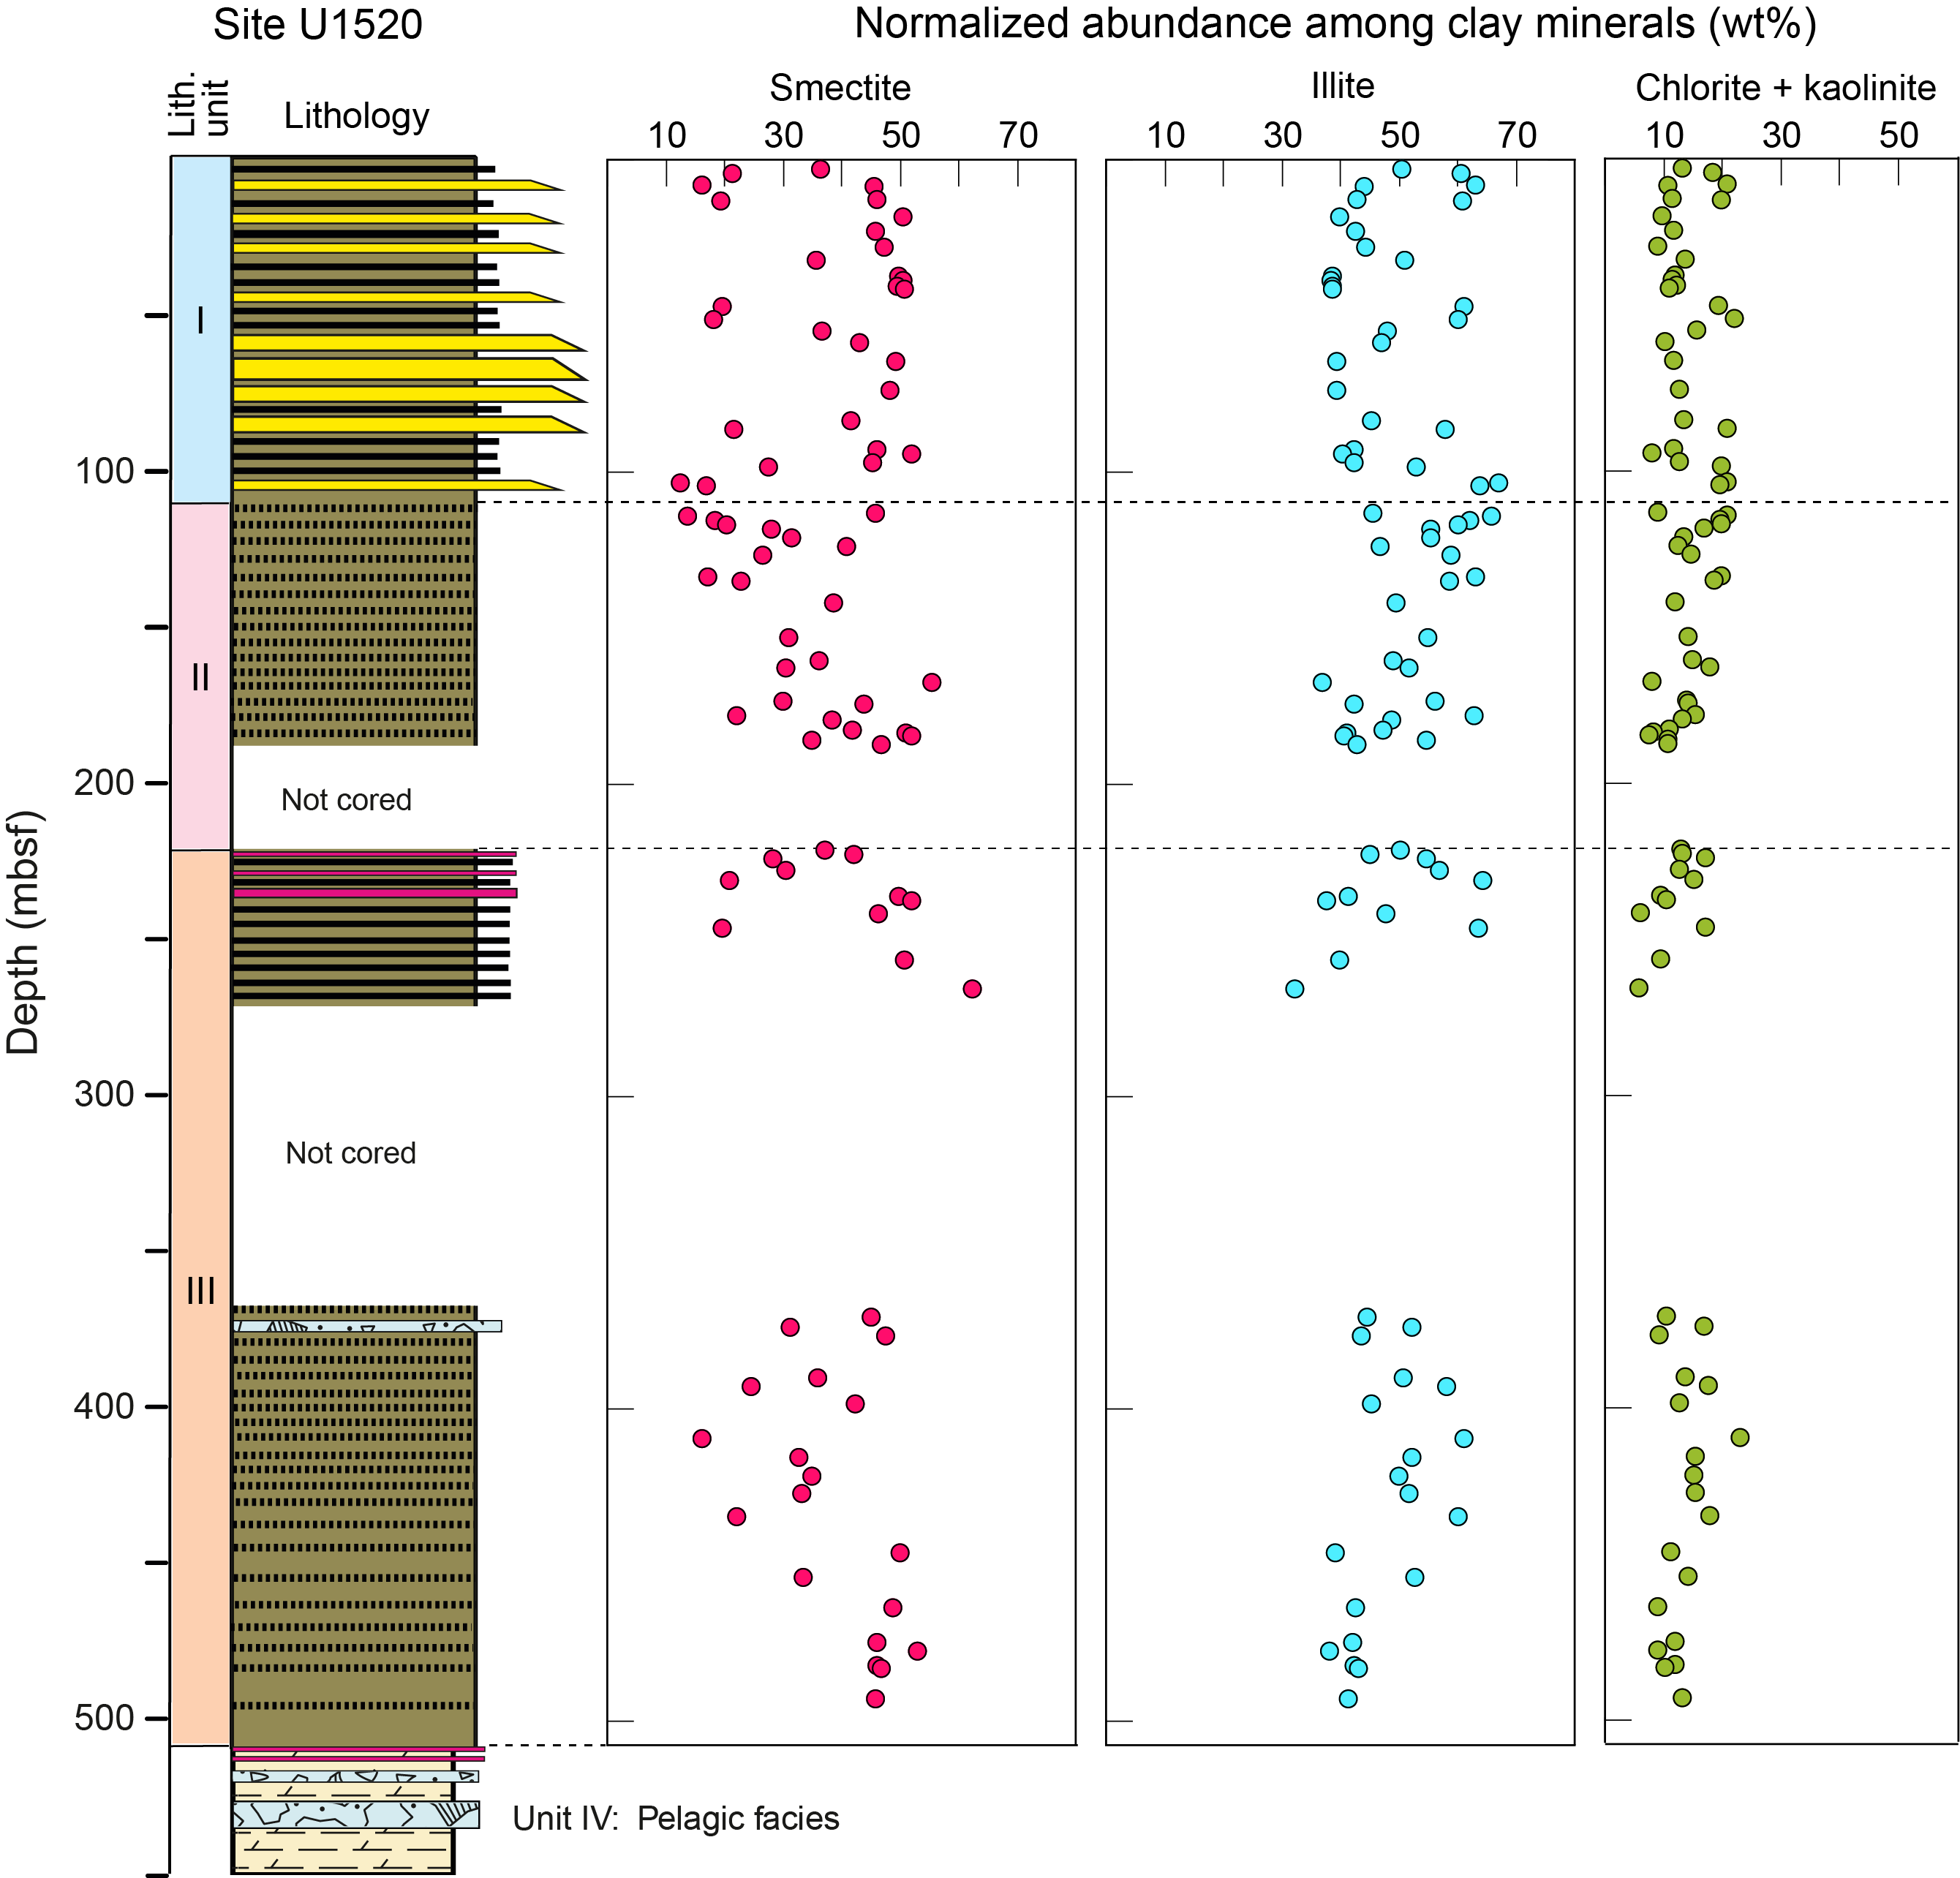
Figure F8. Normalized relative abundance values among the clay minerals, Site U1520.
Comparable values for Unit II are
- Smectite: µ = 34.0 wt% and σ = 11.7.
- Illite: µ = 52.0 wt% and σ = 8.1.
- Undifferentiated (chlorite + kaolinite): µ = 14.0 wt% and σ = 4.0.
Mean values for Unit III are smectite = 39.1 wt% (σ = 11.6), illite = 48.1 wt% (σ = 8.3), and undifferentiated (chlorite + kaolinite) = 12.9 wt% (σ = 3.8). Figure F9 demonstrates that increases in the proportion of smectite are balanced mostly by decreases in the proportion of illite and vice versa. Statistical differences among the three lithologic units (Figure F10) are within the margins of accuracy for the clay-sized XRD methods and indicative of commonality in detrital provenance.
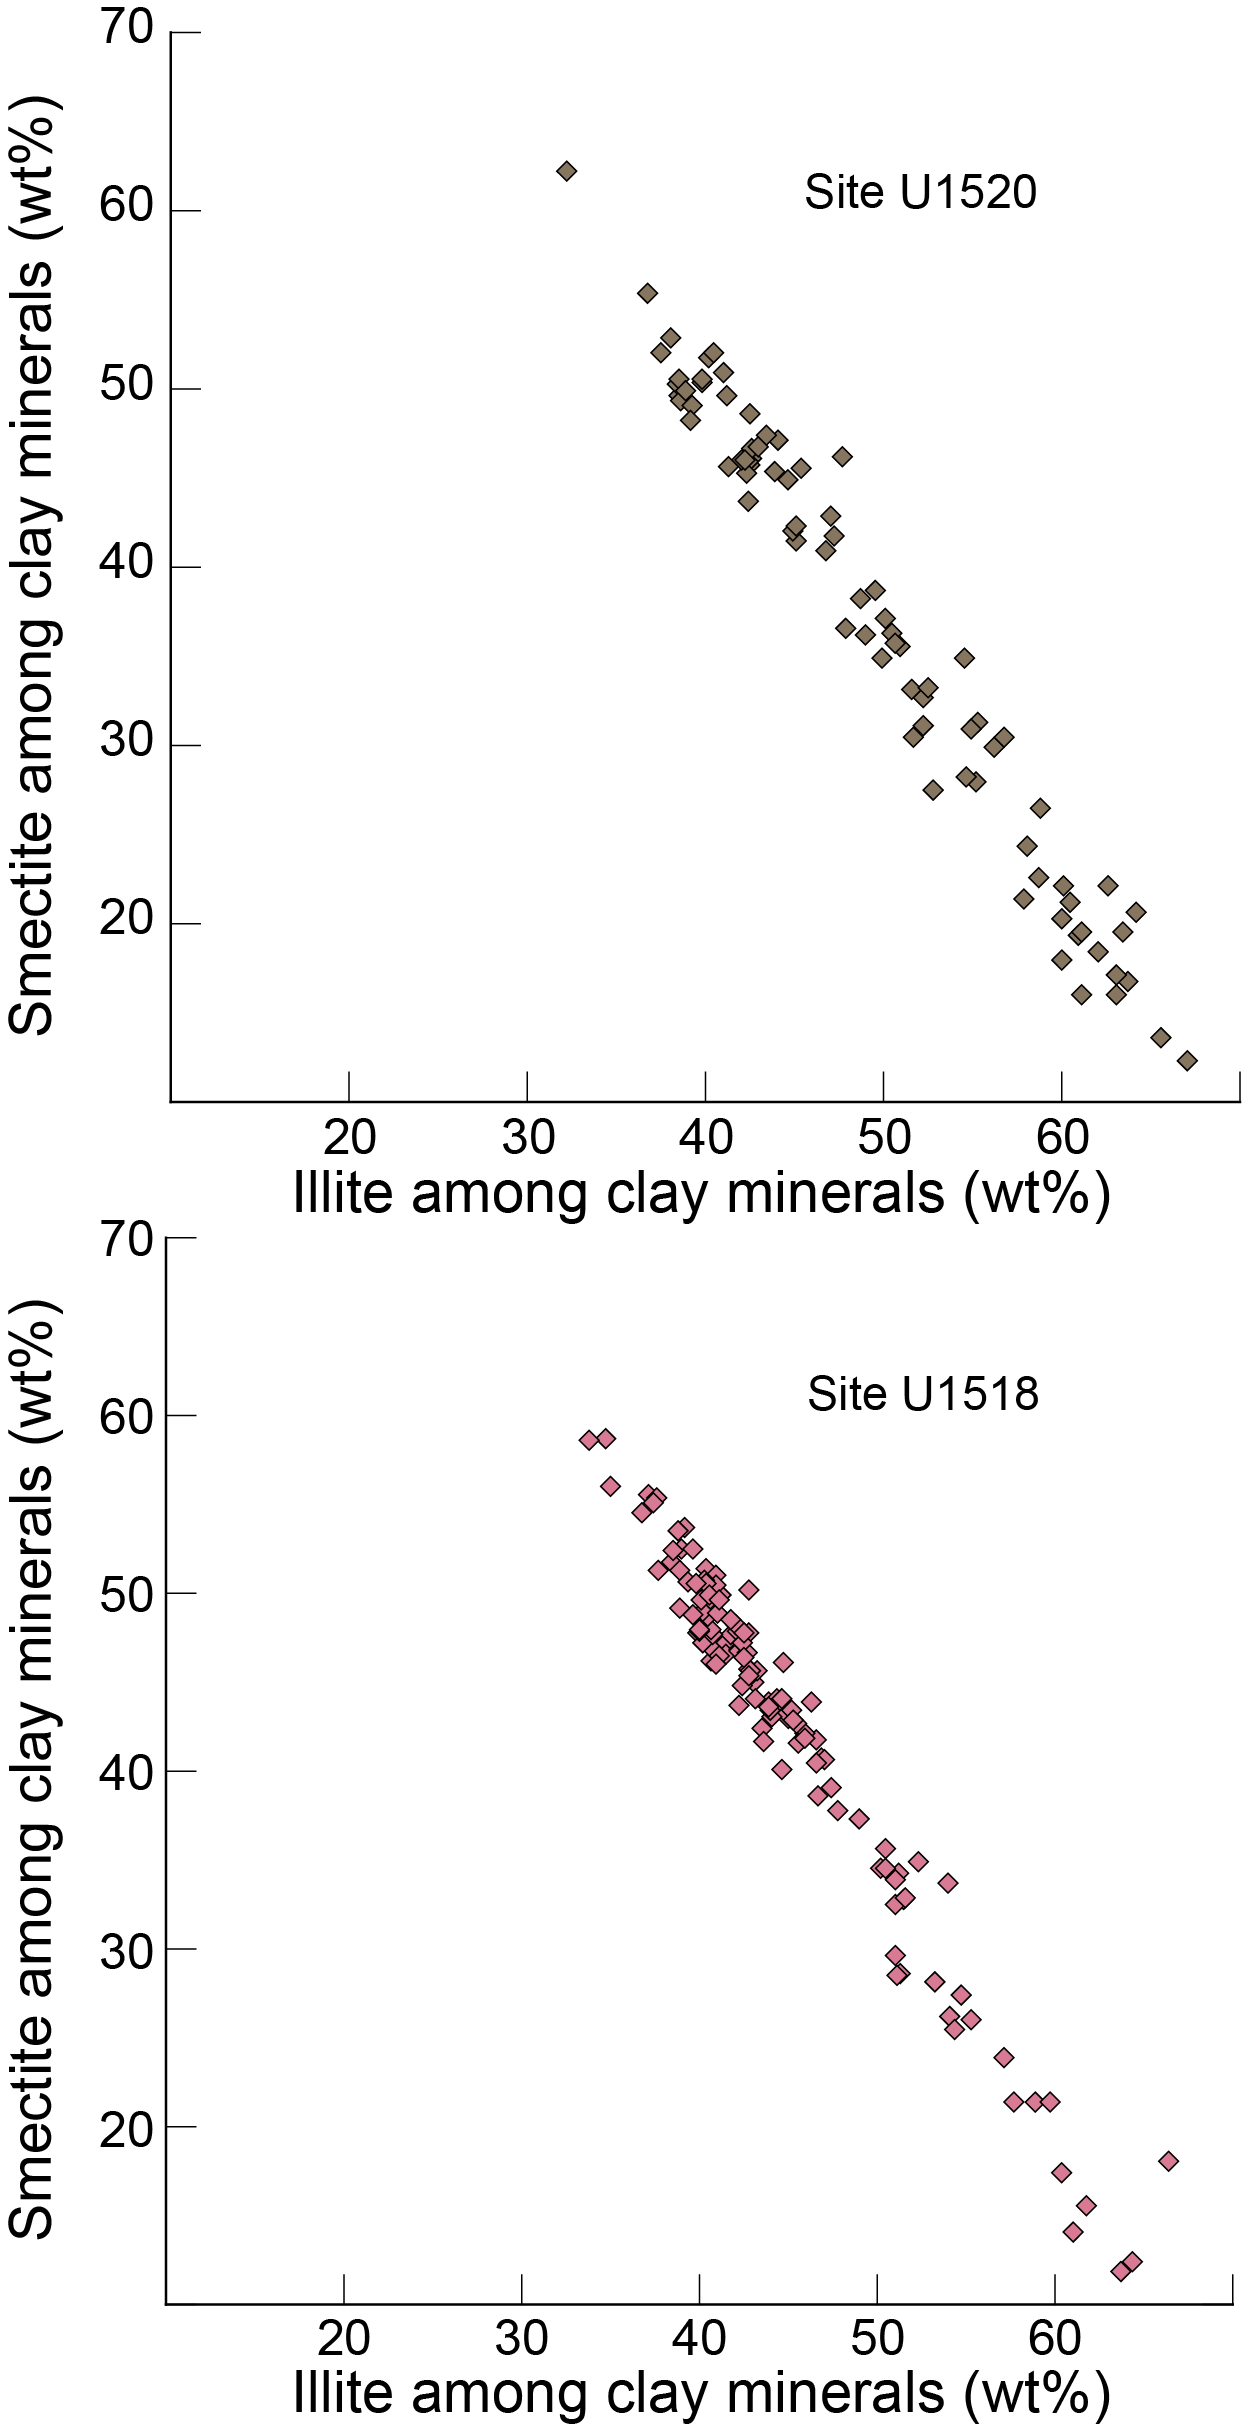
Figure F9. Computed smectite versus illite weight percent values.
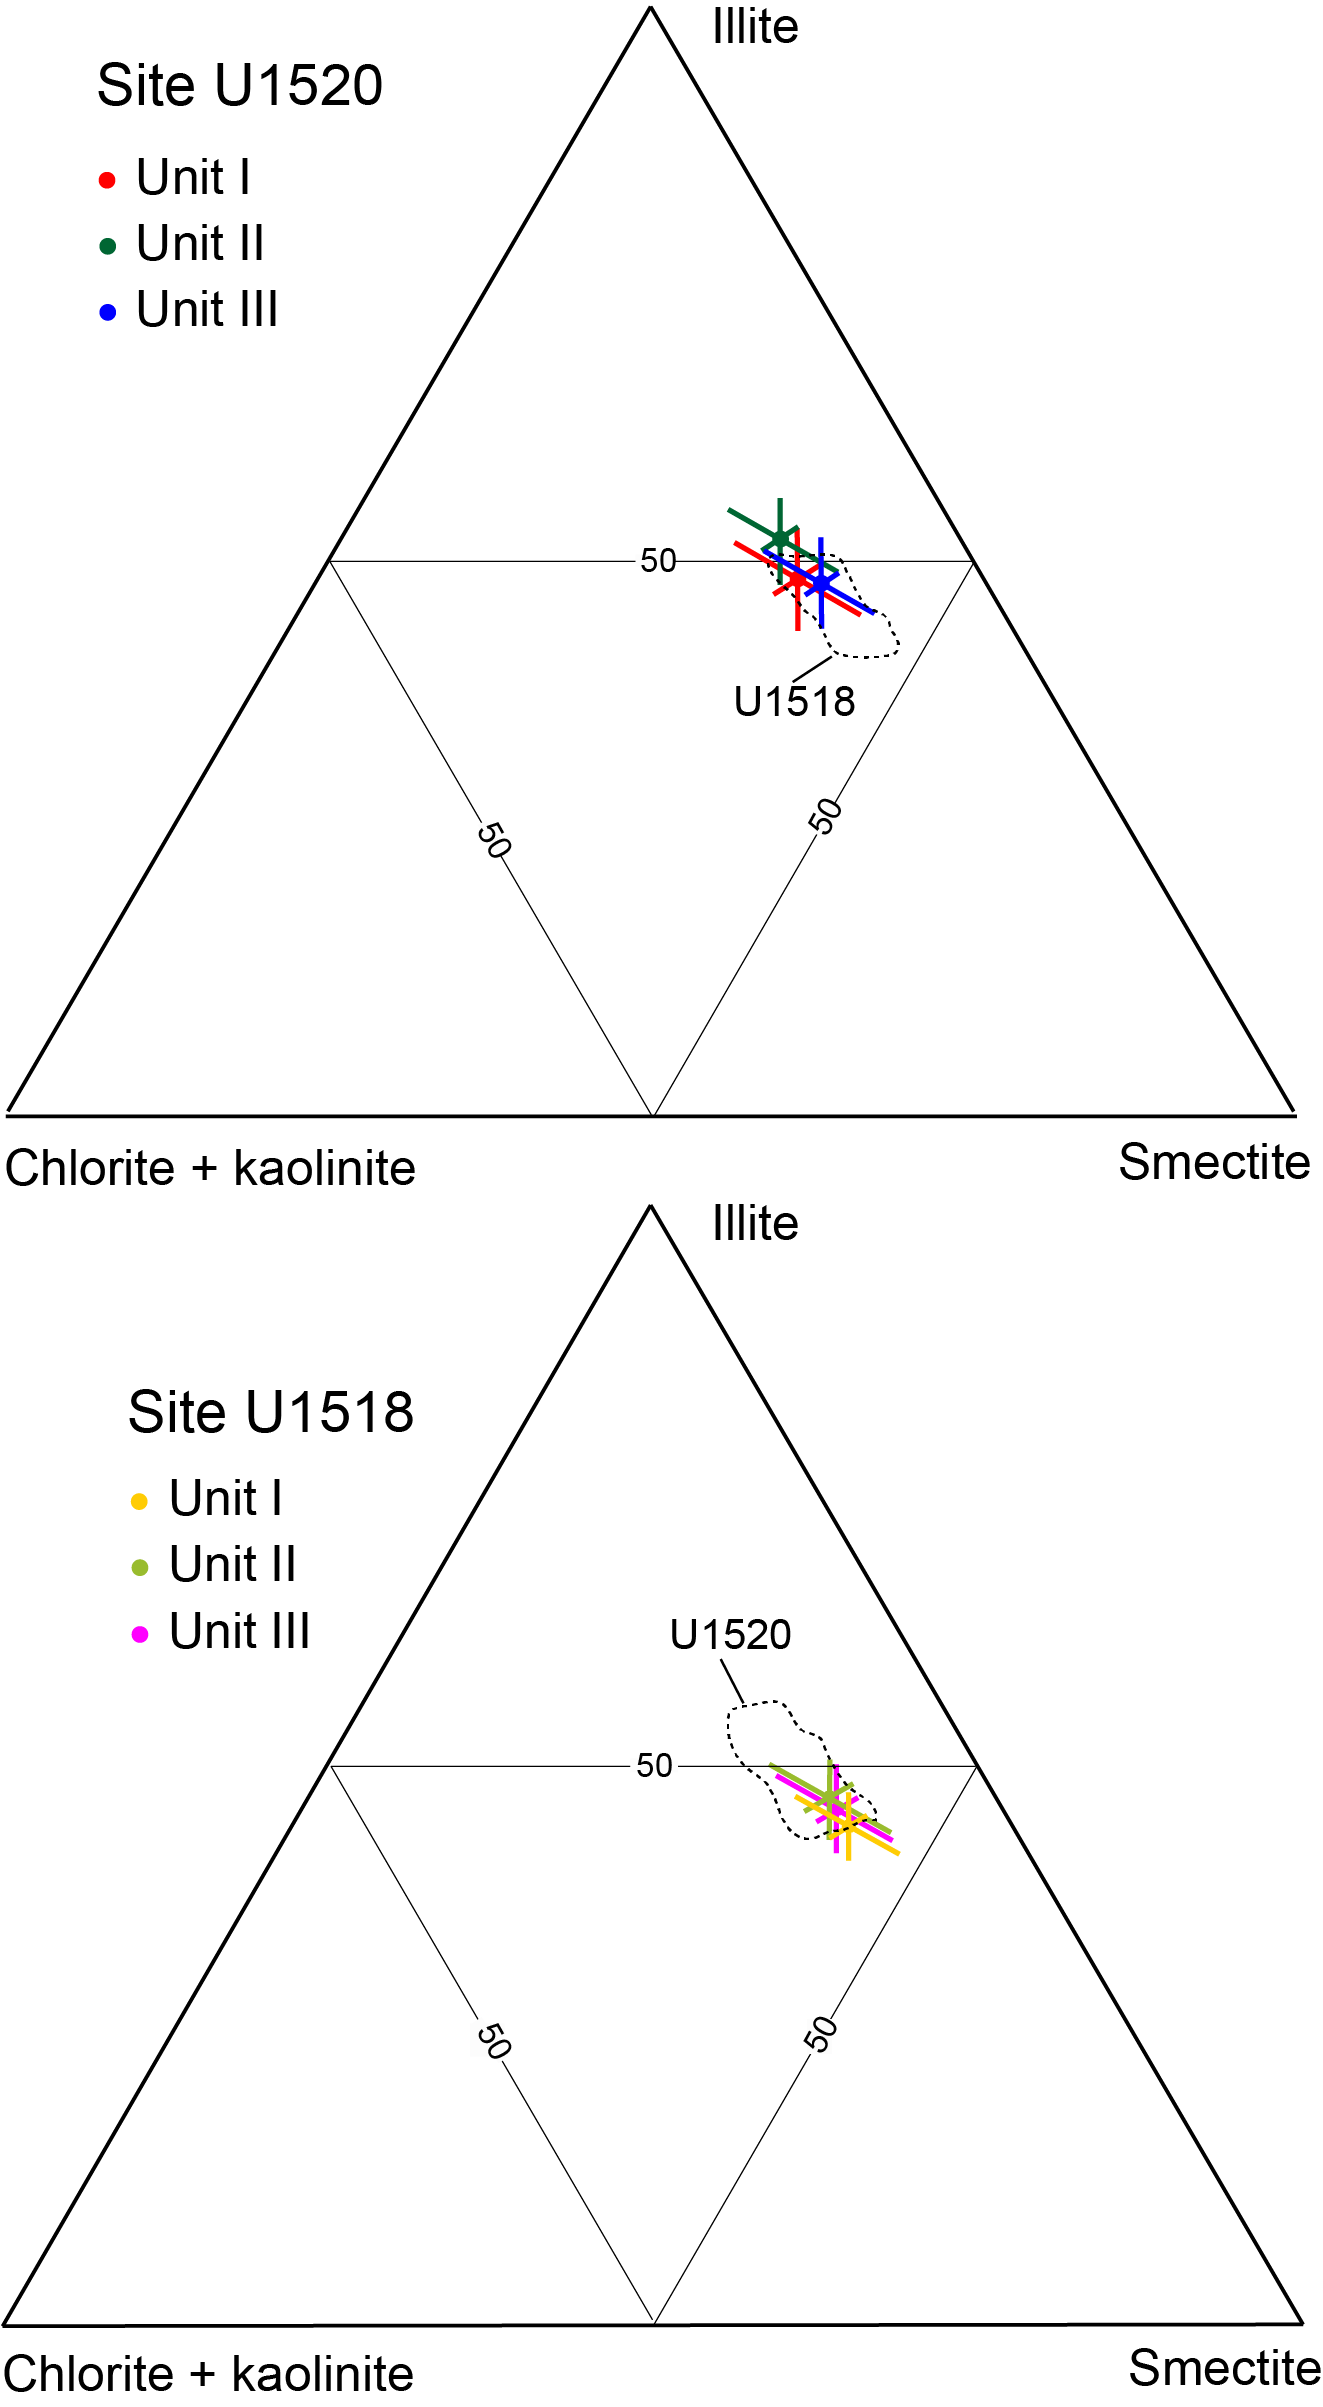
Figure F10. Mean weight percent values.
Figure F11 shows normalized weight percent values for smectite, illite, and undifferentiated (chlorite + kaolinite) in the bulk sediment. Those values are probably the most relevant for assessing whether sediment composition modulates potential variations in hydrogeological, frictional, and geotechnical properties. The average content of total clay minerals from shipboard XRD analyses of bulk powders is 43.0 wt%, and those values range from 11.1 to 53.3 wt% (Barnes et al., 2019). Contrasts among the lithologic units in terms of bulk sediment clay minerals are statistically insignificant (Table T3), and no systematic trends are evident as a function of depth or across unit boundaries (Figure F11). The mean and standard deviation values for the entire trench-wedge interval are smectite = 15.7 wt% (σ = 6.0), illite = 21.3 wt% (σ = 6.0), and undifferentiated (chlorite + kaolinite) = 6.0 wt% (σ = 2.4). Larger amounts of scatter within Unit I bulk sediments are probably a function of greater textural variability among the interbeds of mud and the tops of silt to sand turbidites.
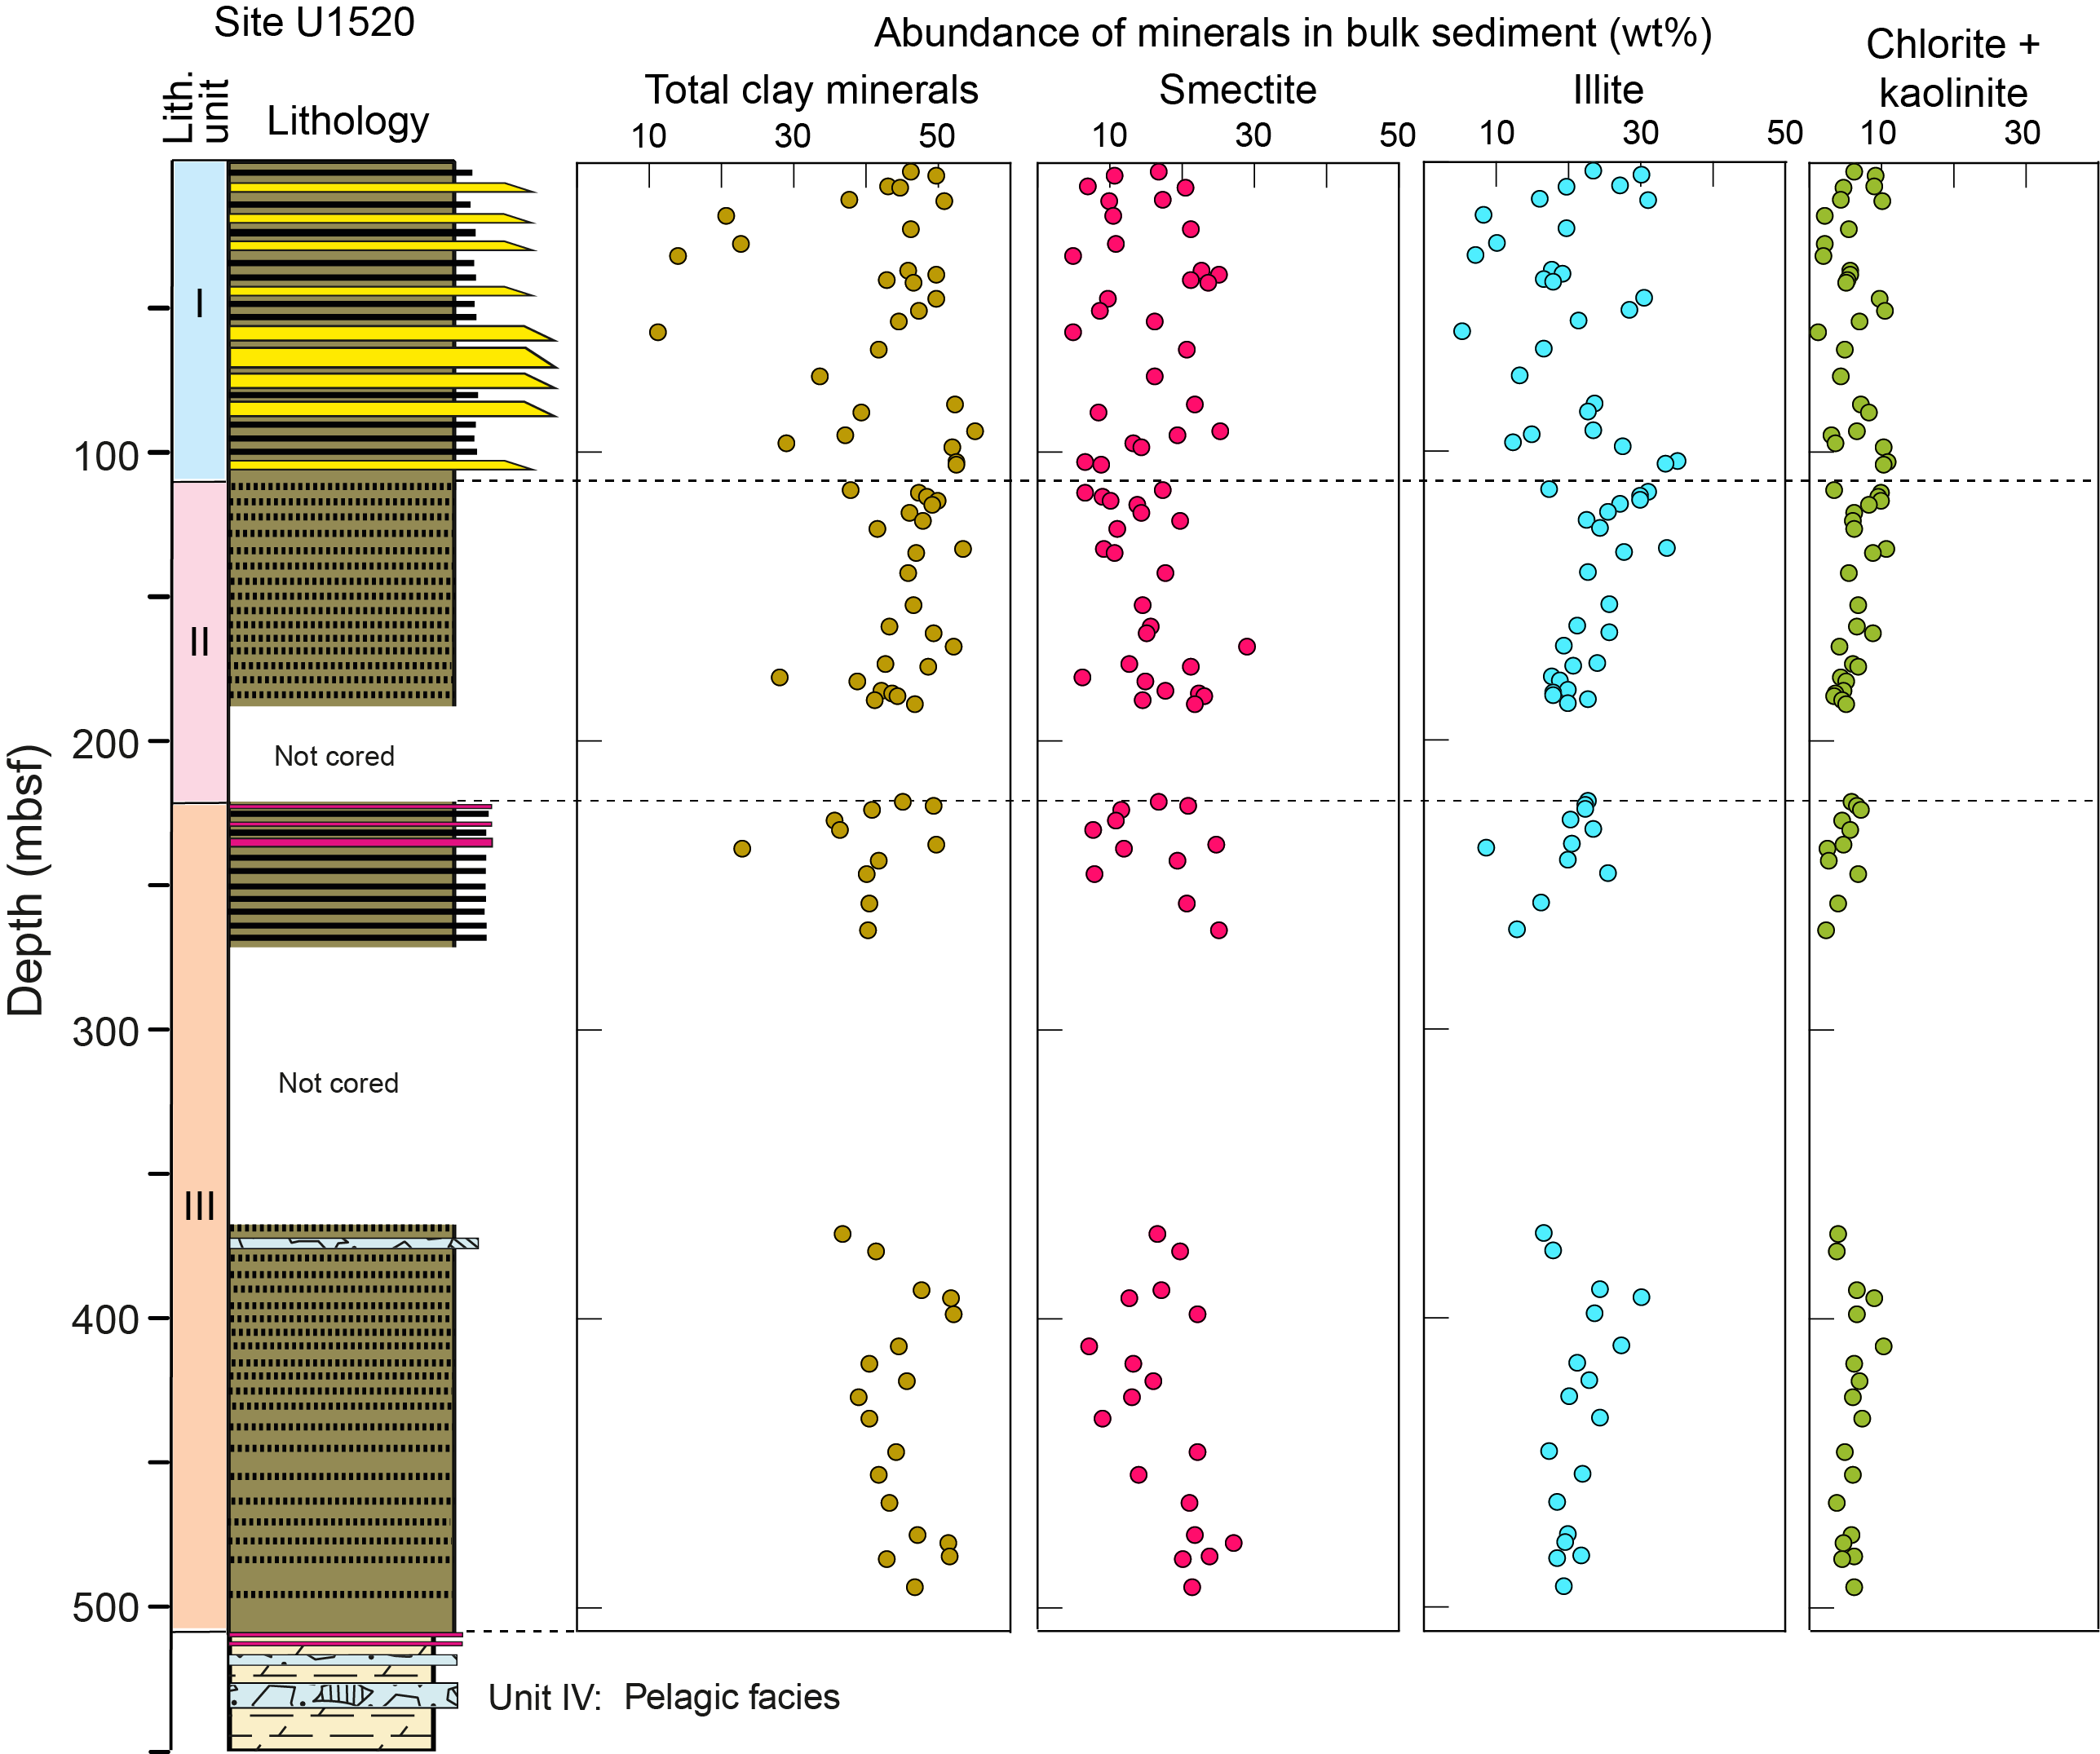
Figure F11. Abundance of minerals in bulk sediment, Site U1520.
Clay mineral assemblages at Site U1518
The results of 126 XRD measurements for Site U1518 are tabulated in Table T4, and the computed values of normalized wt%, using the three computational approaches, are listed in Table T5. When considered as a whole, the accreted trench-wedge deposits at Site U1518 (Units I–III) display unusual amounts of scatter in clay-sized mineral assemblages (Figure F12). Proportions of smectite range from 8.7 to 52.5 wt% (computed using regression equations) with a mean value of 38.4 wt% and a standard deviation of 9.8. Weight percent values for illite range from 28.5 to 61.1 wt% (µ = 41.5; σ = 6.9), and the proportion of undifferentiated (chlorite + kaolinite) ranges from 5.4 to 25.8 wt% (µ = 11.8; σ = 4.1). As at Site U1520, these values of standard deviation are approximately 2× greater than comparable statistics for Site U1517 on the upper trench slope (Underwood and Dugan, submitted). Kaolinite occurs in trace amounts with an average of only 1.0 wt%. Compared to Site U1520, the content of clay-sized quartz shows less variability, ranging from 3.9 to 17.9 wt% (µ = 8.3; σ = 2.3). This difference in quartz content is consistent with the greater abundance of turbidites at Site U1520, particularly in Unit I.
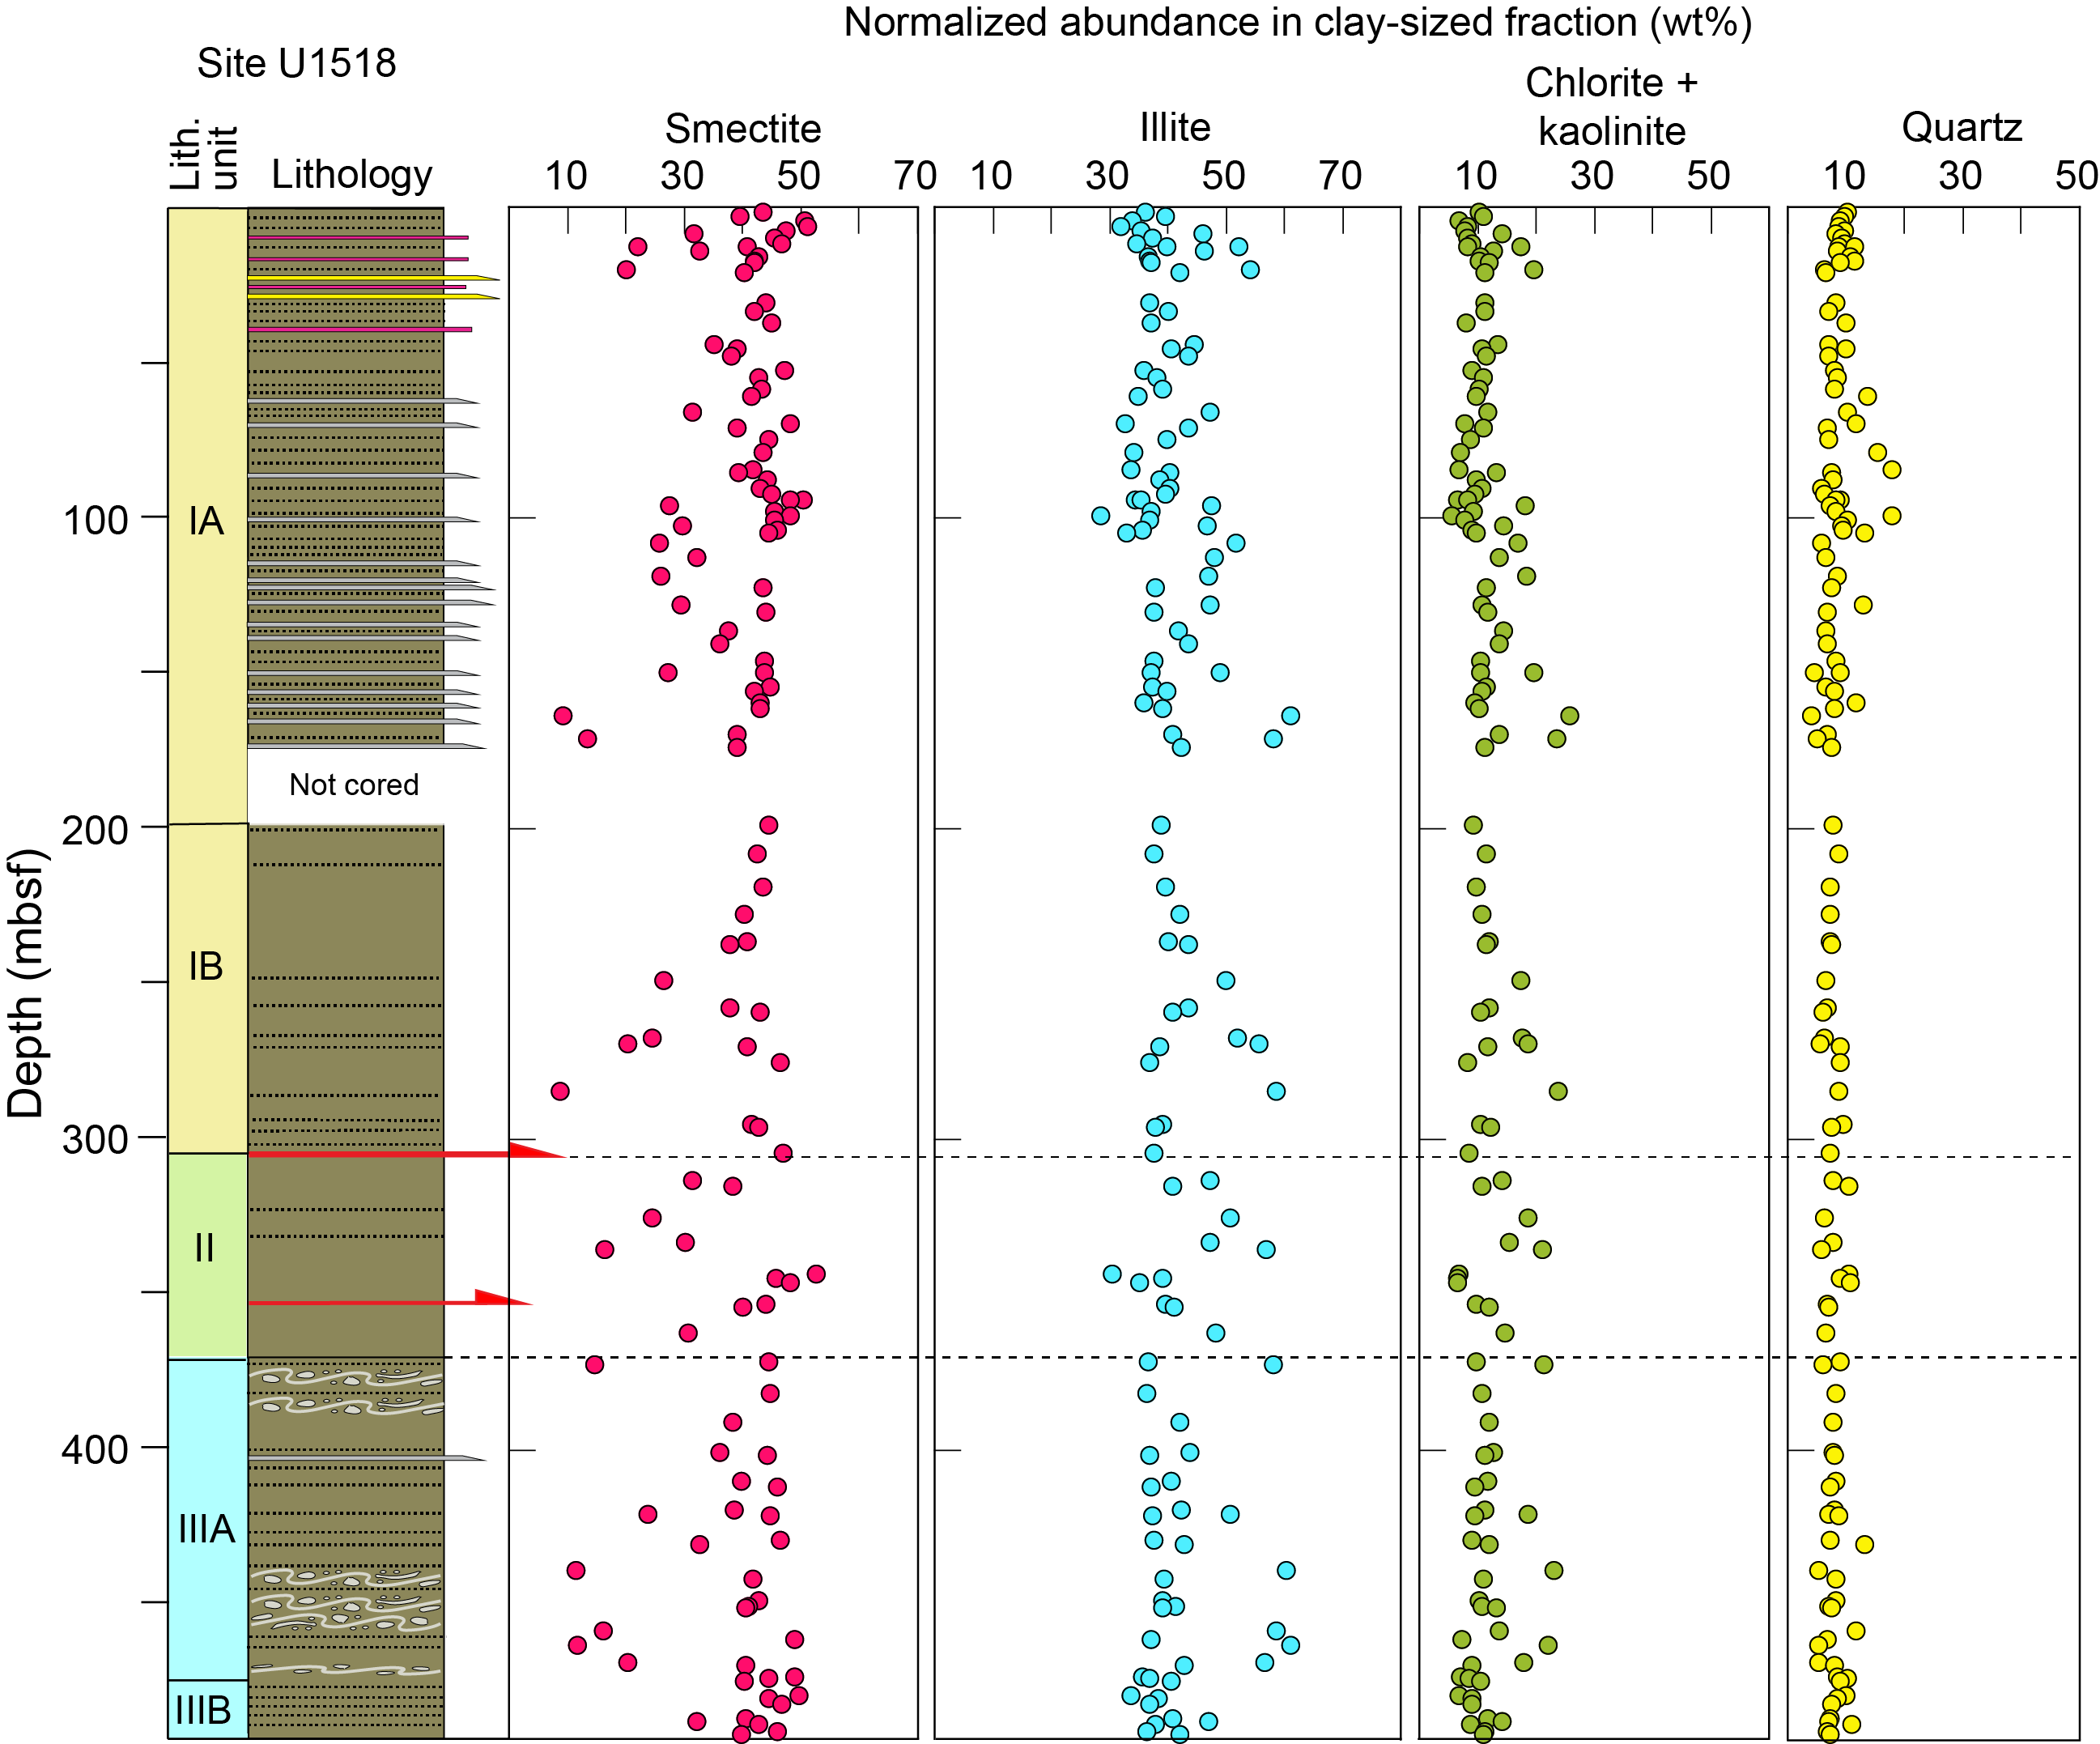
Figure F12. Normalized relative abundance values of minerals in the clay-sized fraction, Site U1518.
Normalized weight percent values among the clay minerals (i.e., where smectite + illite + undifferentiated [chlorite + kaolinite] = 100%) are tabulated in Table T5 and illustrated in Figure F13. The values of mean weight percent and standard deviation for samples from Unit I are
- Smectite: µ = 42.6 wt% and σ = 10.3.
- Illite: µ = 44.7 wt% and σ = 6.4.
- Undifferentiated (chlorite + kaolinite): µ = 12.7 wt% and σ = 4.1.
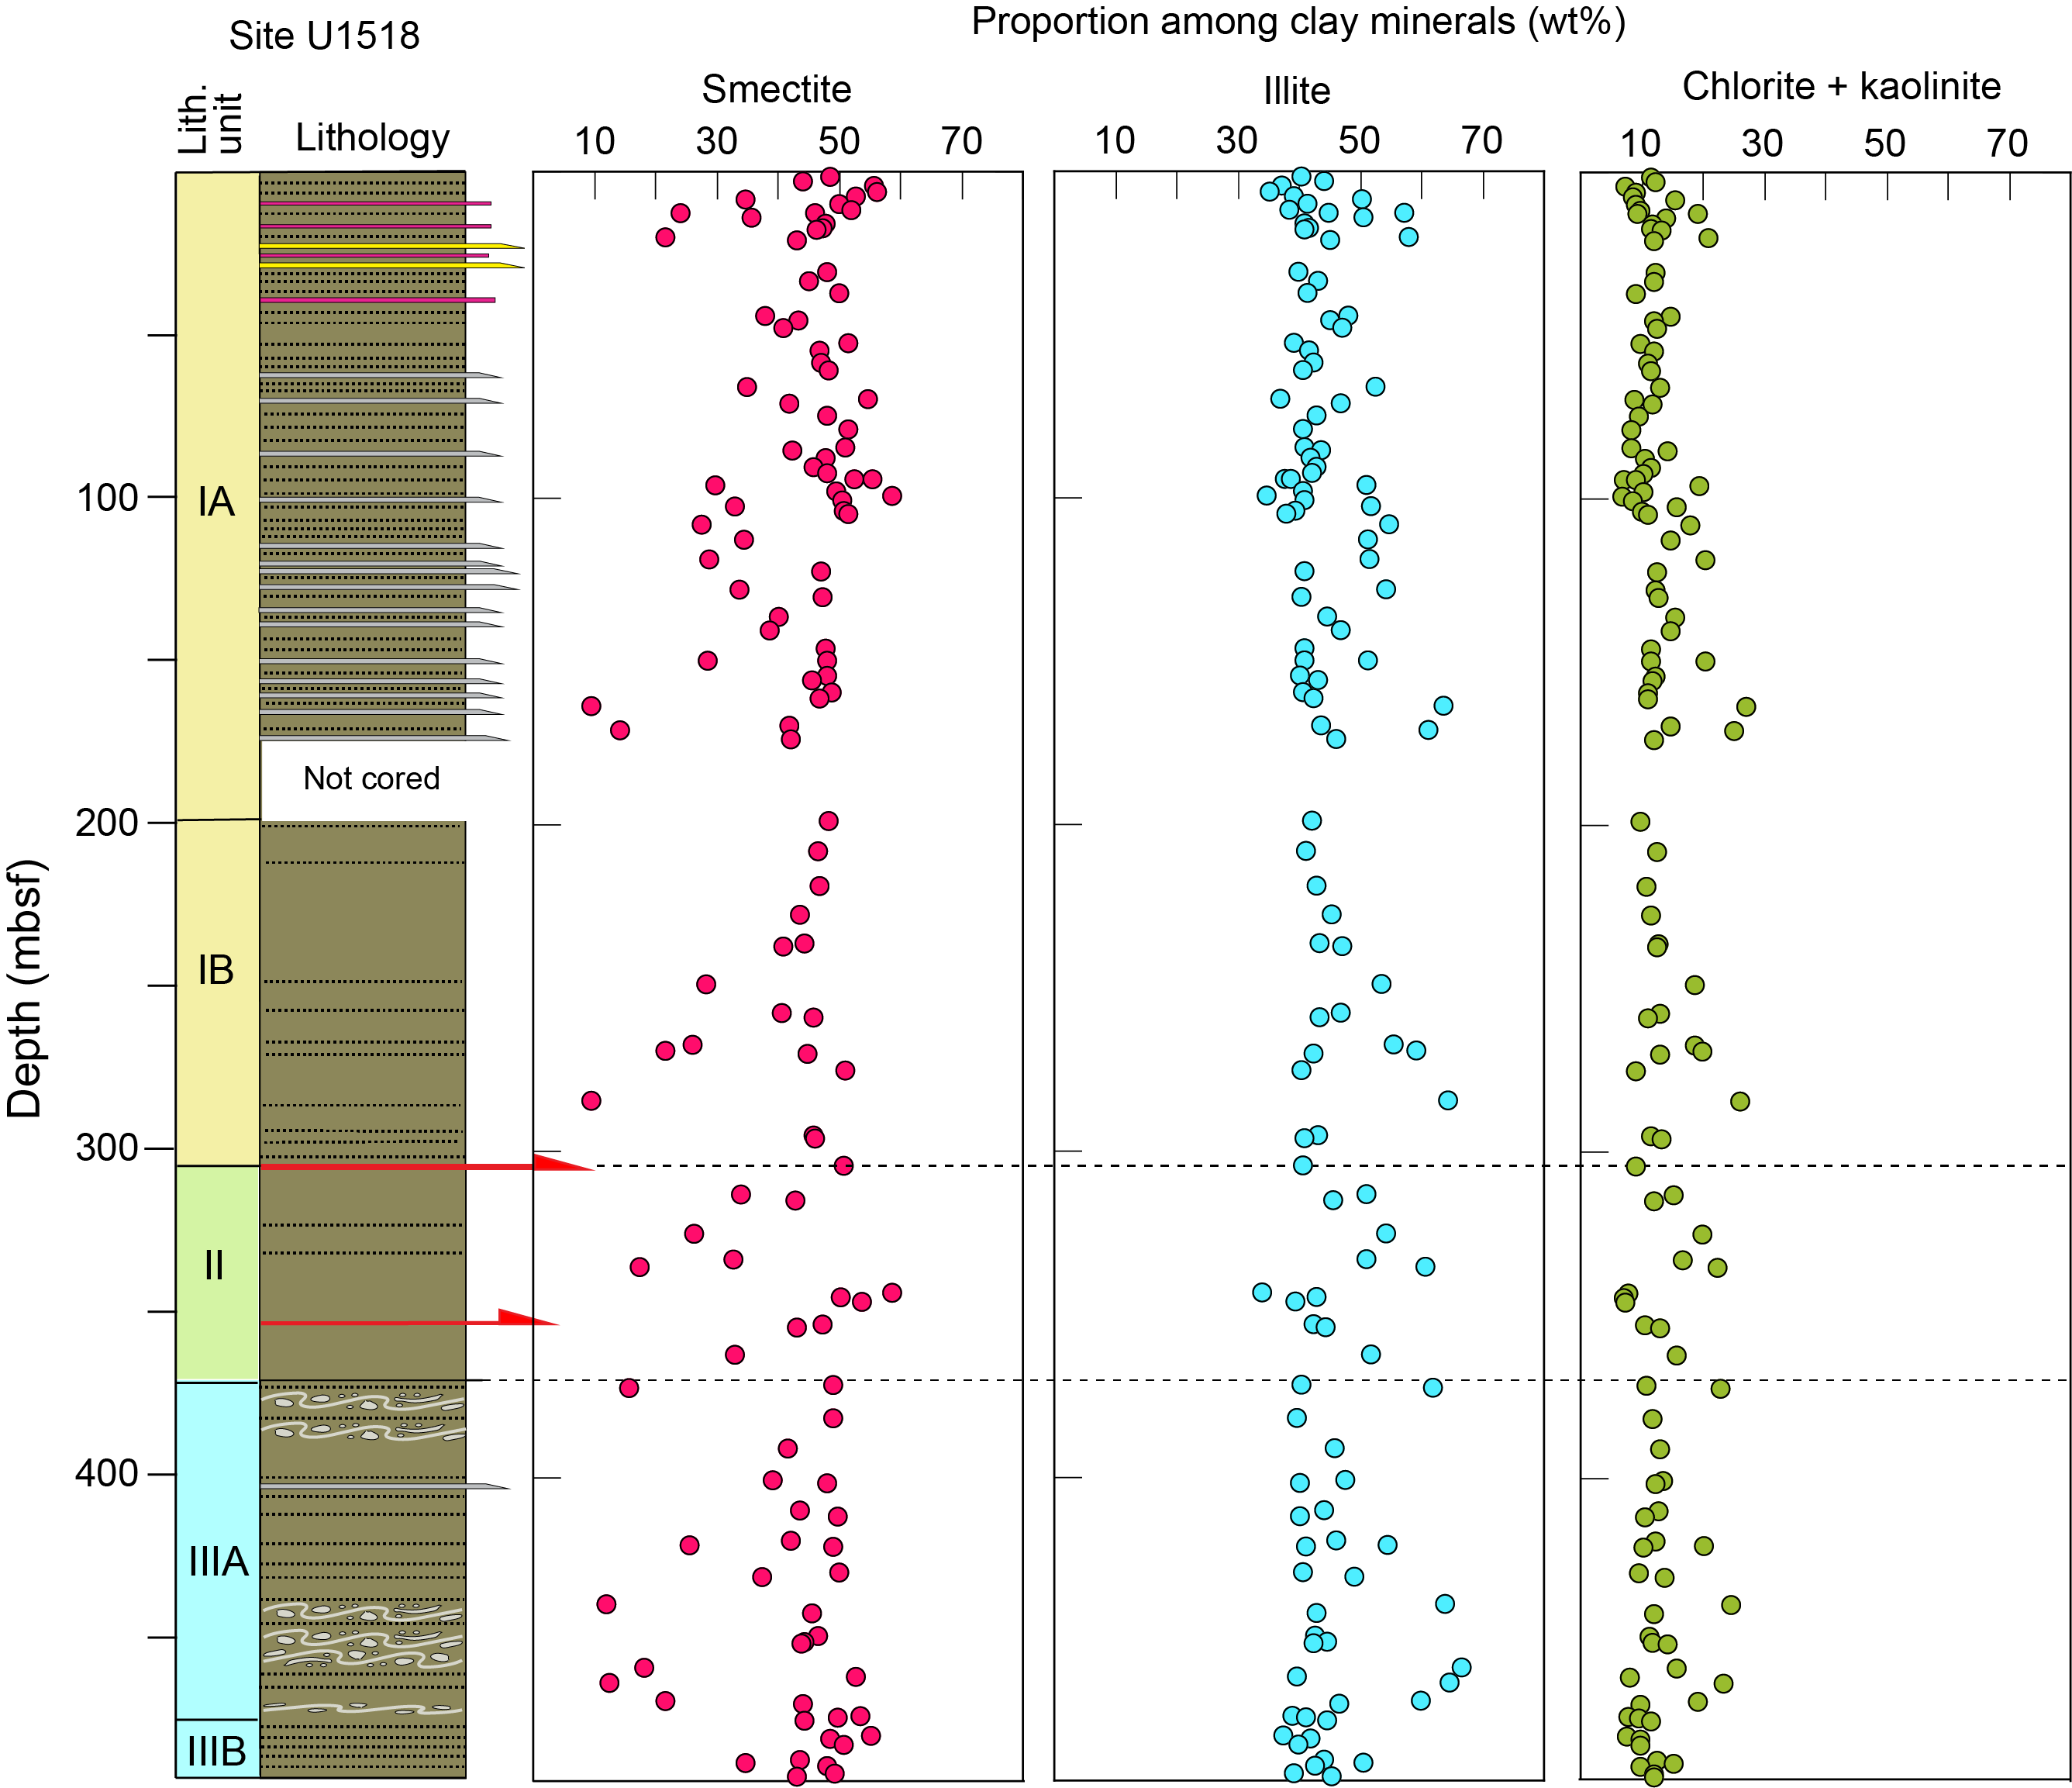
Figure F13. Normalized relative abundance values among the clay minerals, Site U1518.
In Unit II, the comparable values are
- Smectite: µ = 39.8 wt% and σ = 12.5.
- Illite: µ = 46.9 wt% and σ = 7.5.
- Undifferentiated (chlorite + kaolinite): µ = 13.3 wt% and σ = 5.1.
In Unit III, the mean values are smectite = 41.1 wt% (σ = 12.1), illite = 46.1 wt% (σ = 8.1), and undifferentiated (chlorite + kaolinite) = 12.8 wt% (σ = 4.3). Figure F9 demonstrates that increases in the proportion of smectite are balanced mostly by decreases in the proportion of illite and vice versa. Similar to Site U1520, statistical differences among the three lithologic units (Figure F10) are within the margins of accuracy for the clay-sized XRD methods. Moreover, the collective results for Site U1518 match closely with the results for Unit III at Site U1520 (Figure F10). These compositional similarities reinforce interpretations of acoustic units and intersite correlations using seismic reflection data (Figure F2).
Figure F14 shows normalized weight percent values for smectite, illite, and undifferentiated (chlorite + kaolinite) in the bulk sediment. The average content of total clay minerals from shipboard XRD analyses of bulk powders is 45.9 wt% (marginally higher than at Site U1520), and those values range from 23.0 to 53.0 wt% (Saffer et al., 2019b). The proportion of total clay minerals decreases slightly near the base of Unit I, but contrasts among the three lithologic units, when viewed in terms of the bulk sediment clay minerals, are statistically insignificant (Table T5). Gradual trends in composition are not apparent as a function of depth (Figure F14), and there are no excursions in bulk clay composition in close proximity to the main brittle fault. The mean and standard deviation values for the entire site are smectite = 19.3 wt% (σ = 5.3), illite = 20.7 wt% (σ = 4.0), and undifferentiated (chlorite + kaolinite) = 5.8 wt% (σ = 2.1).
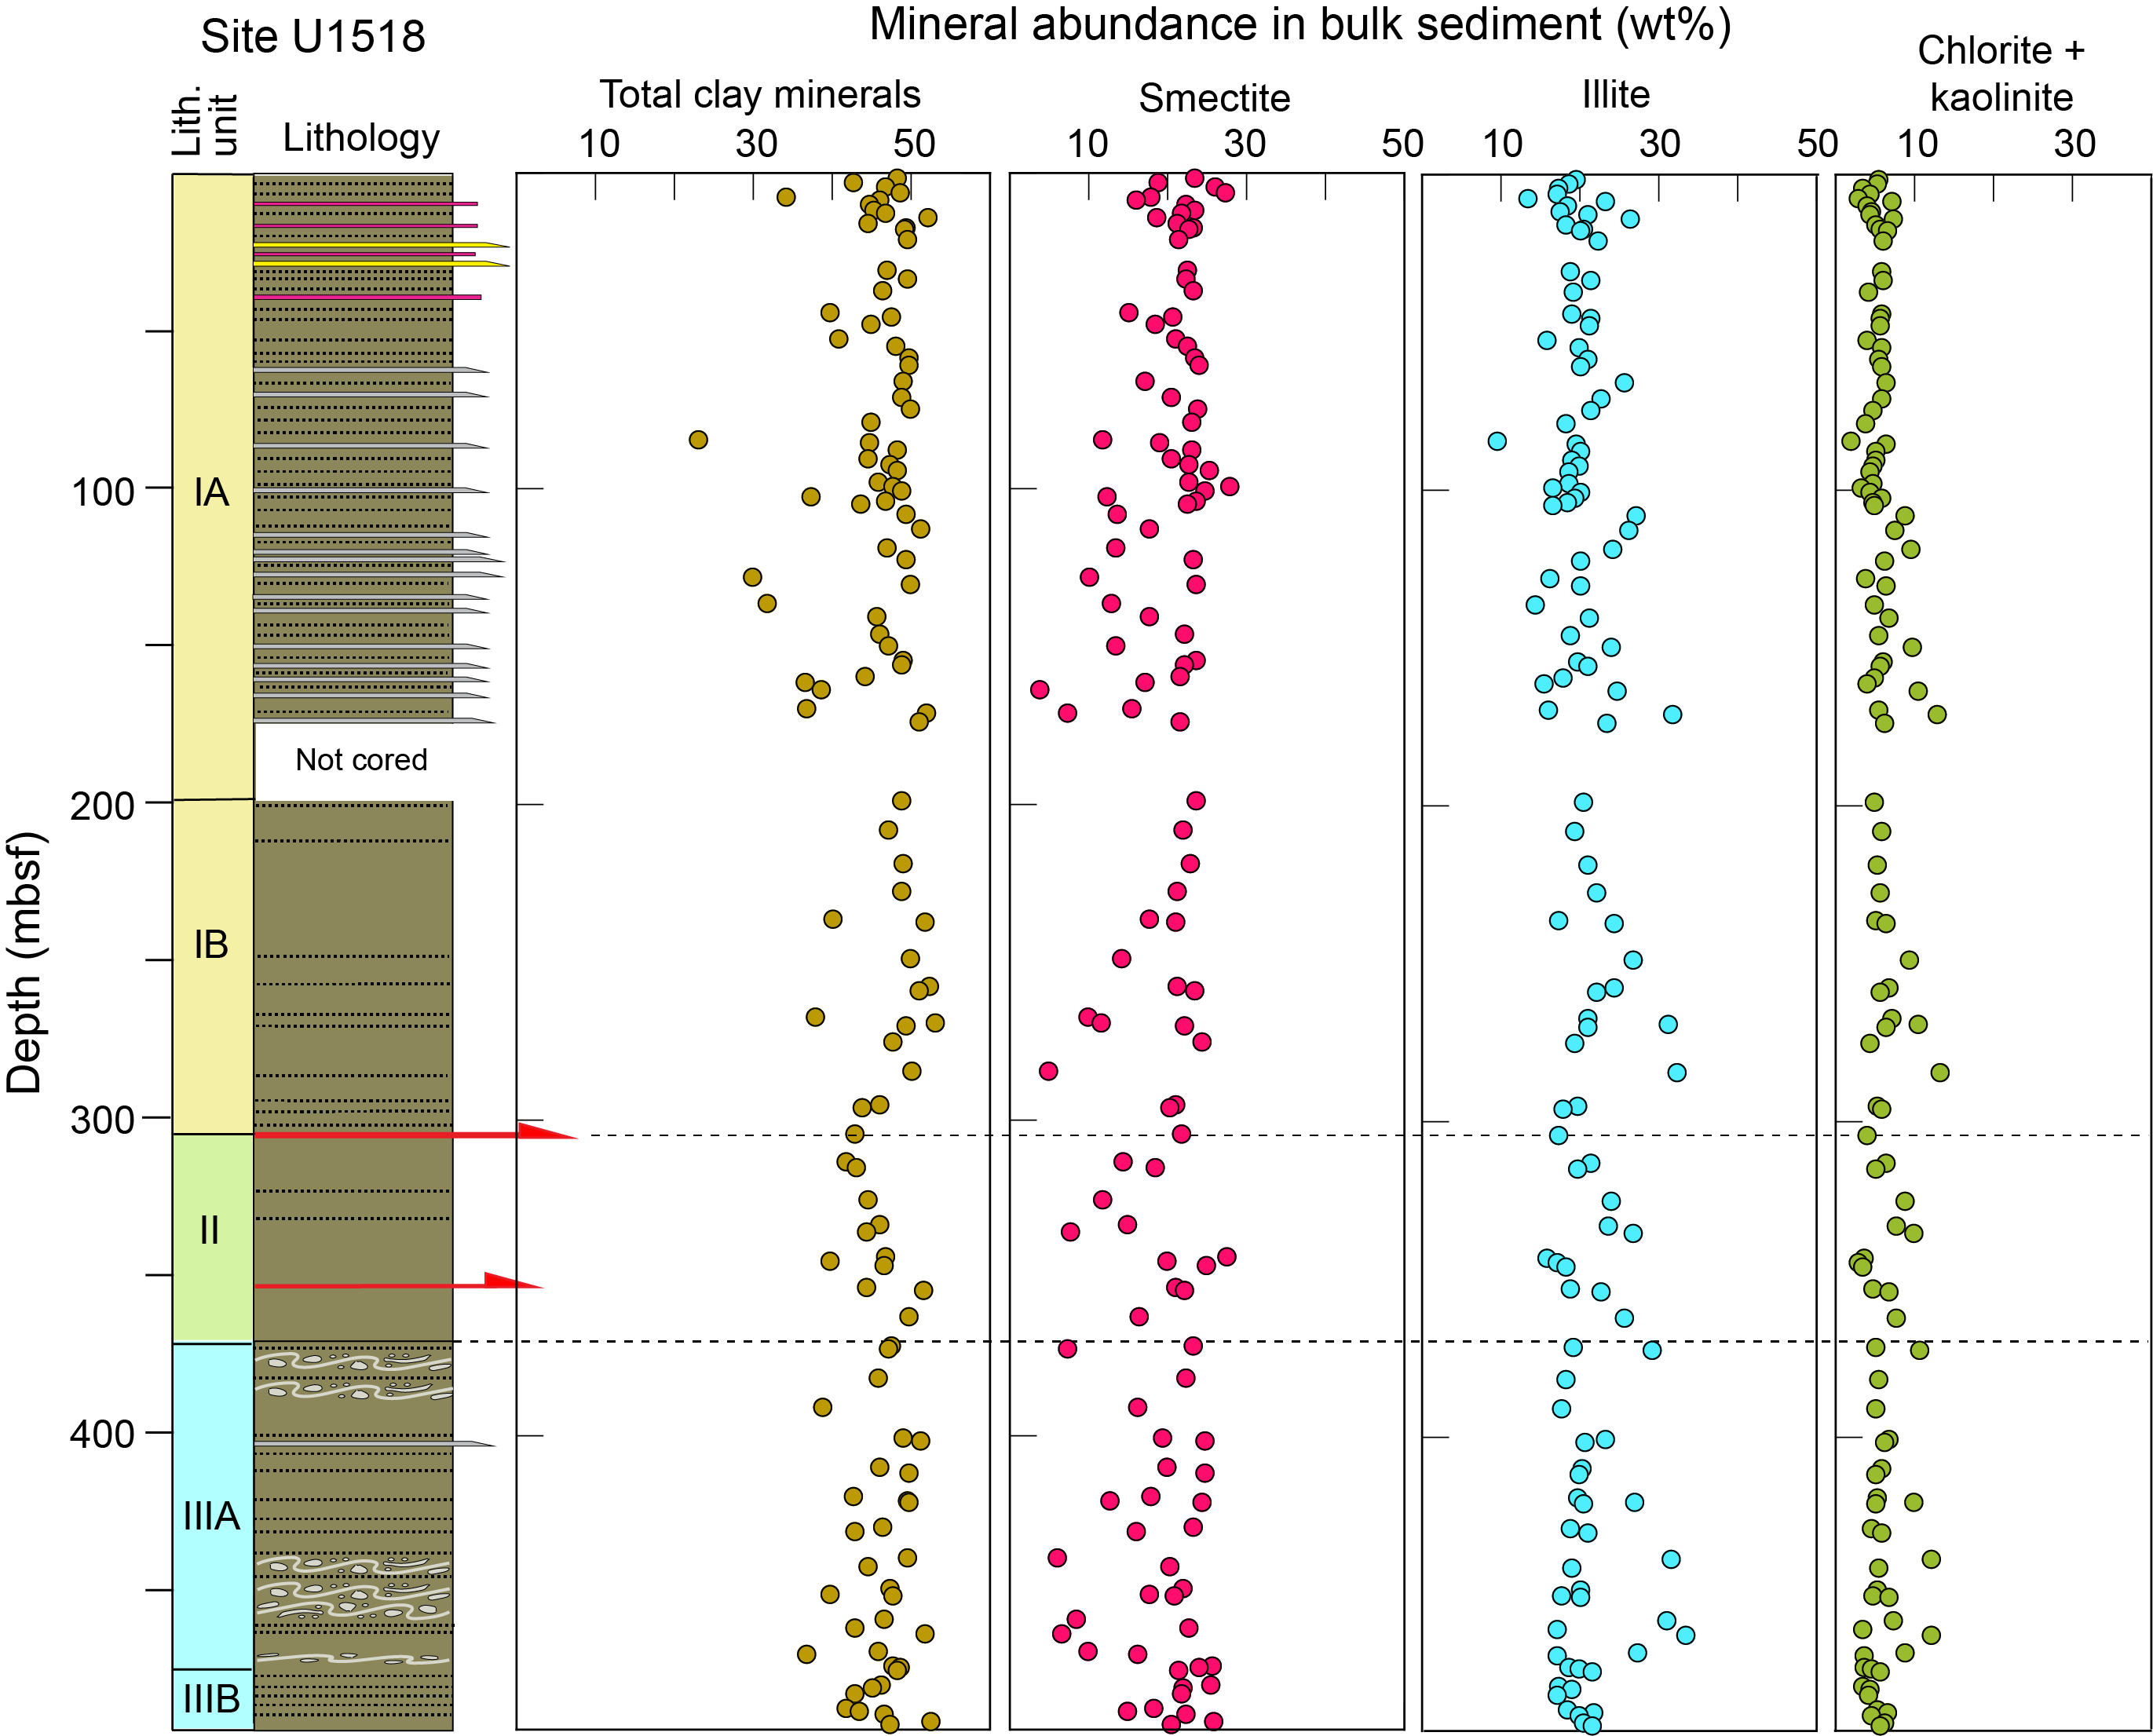
Figure F14. Abundance of minerals in bulk sediment, Site U1518.
Indicators of clay diagenesis
At Site U1520, values of crystallinity index for the detrital illite assemblage in trench-wedge sediments fall between 0.413 and 0.567Δ°2θ with a mean of 0.53Δ°2θ and a standard deviation of 0.027 (Table T2; Figure F15). According to the criteria of Warr and Ferreiro Mählmann (2015), that range of crystallinity values straddles the domains of advanced diagenesis and anchimetamorphism (i.e., incipient greenschist facies). Values are more scattered within Unit I, whereas data from Units II and III fall more consistently within the anchizone (Figure F15). Given the relatively cool in situ burial temperatures in Hole U1520D (Barnes et al., 2019), these results should be viewed as indicators of geologic conditions within detrital source terranes (e.g., Warr and Cox, 2016) rather than in situ diagenesis. Viewed similarly, the expandability of smectite and smectite-rich I/S mixed-layer clay ranges from 53% to 89% with a mean value of 70.4% and a standard deviation of 7.2 (Table T2; Figure F15). For generic reference, lower values (less expandability) are consistent with higher proportions of detrital I/S mixed-layer clay in the assemblage, whereas higher values are indicative of more discrete smectite from altered volcanic sources. Percentages of illite within the I/S mixed-layer phase range from 1% to 34% with a mean of 12.6% and a standard deviation of 6.5 (Table T2; Figure F15). No systematic variations or gradients exist in any of these diagenetic indicators as a function of burial depth or lithostratigraphic unit.
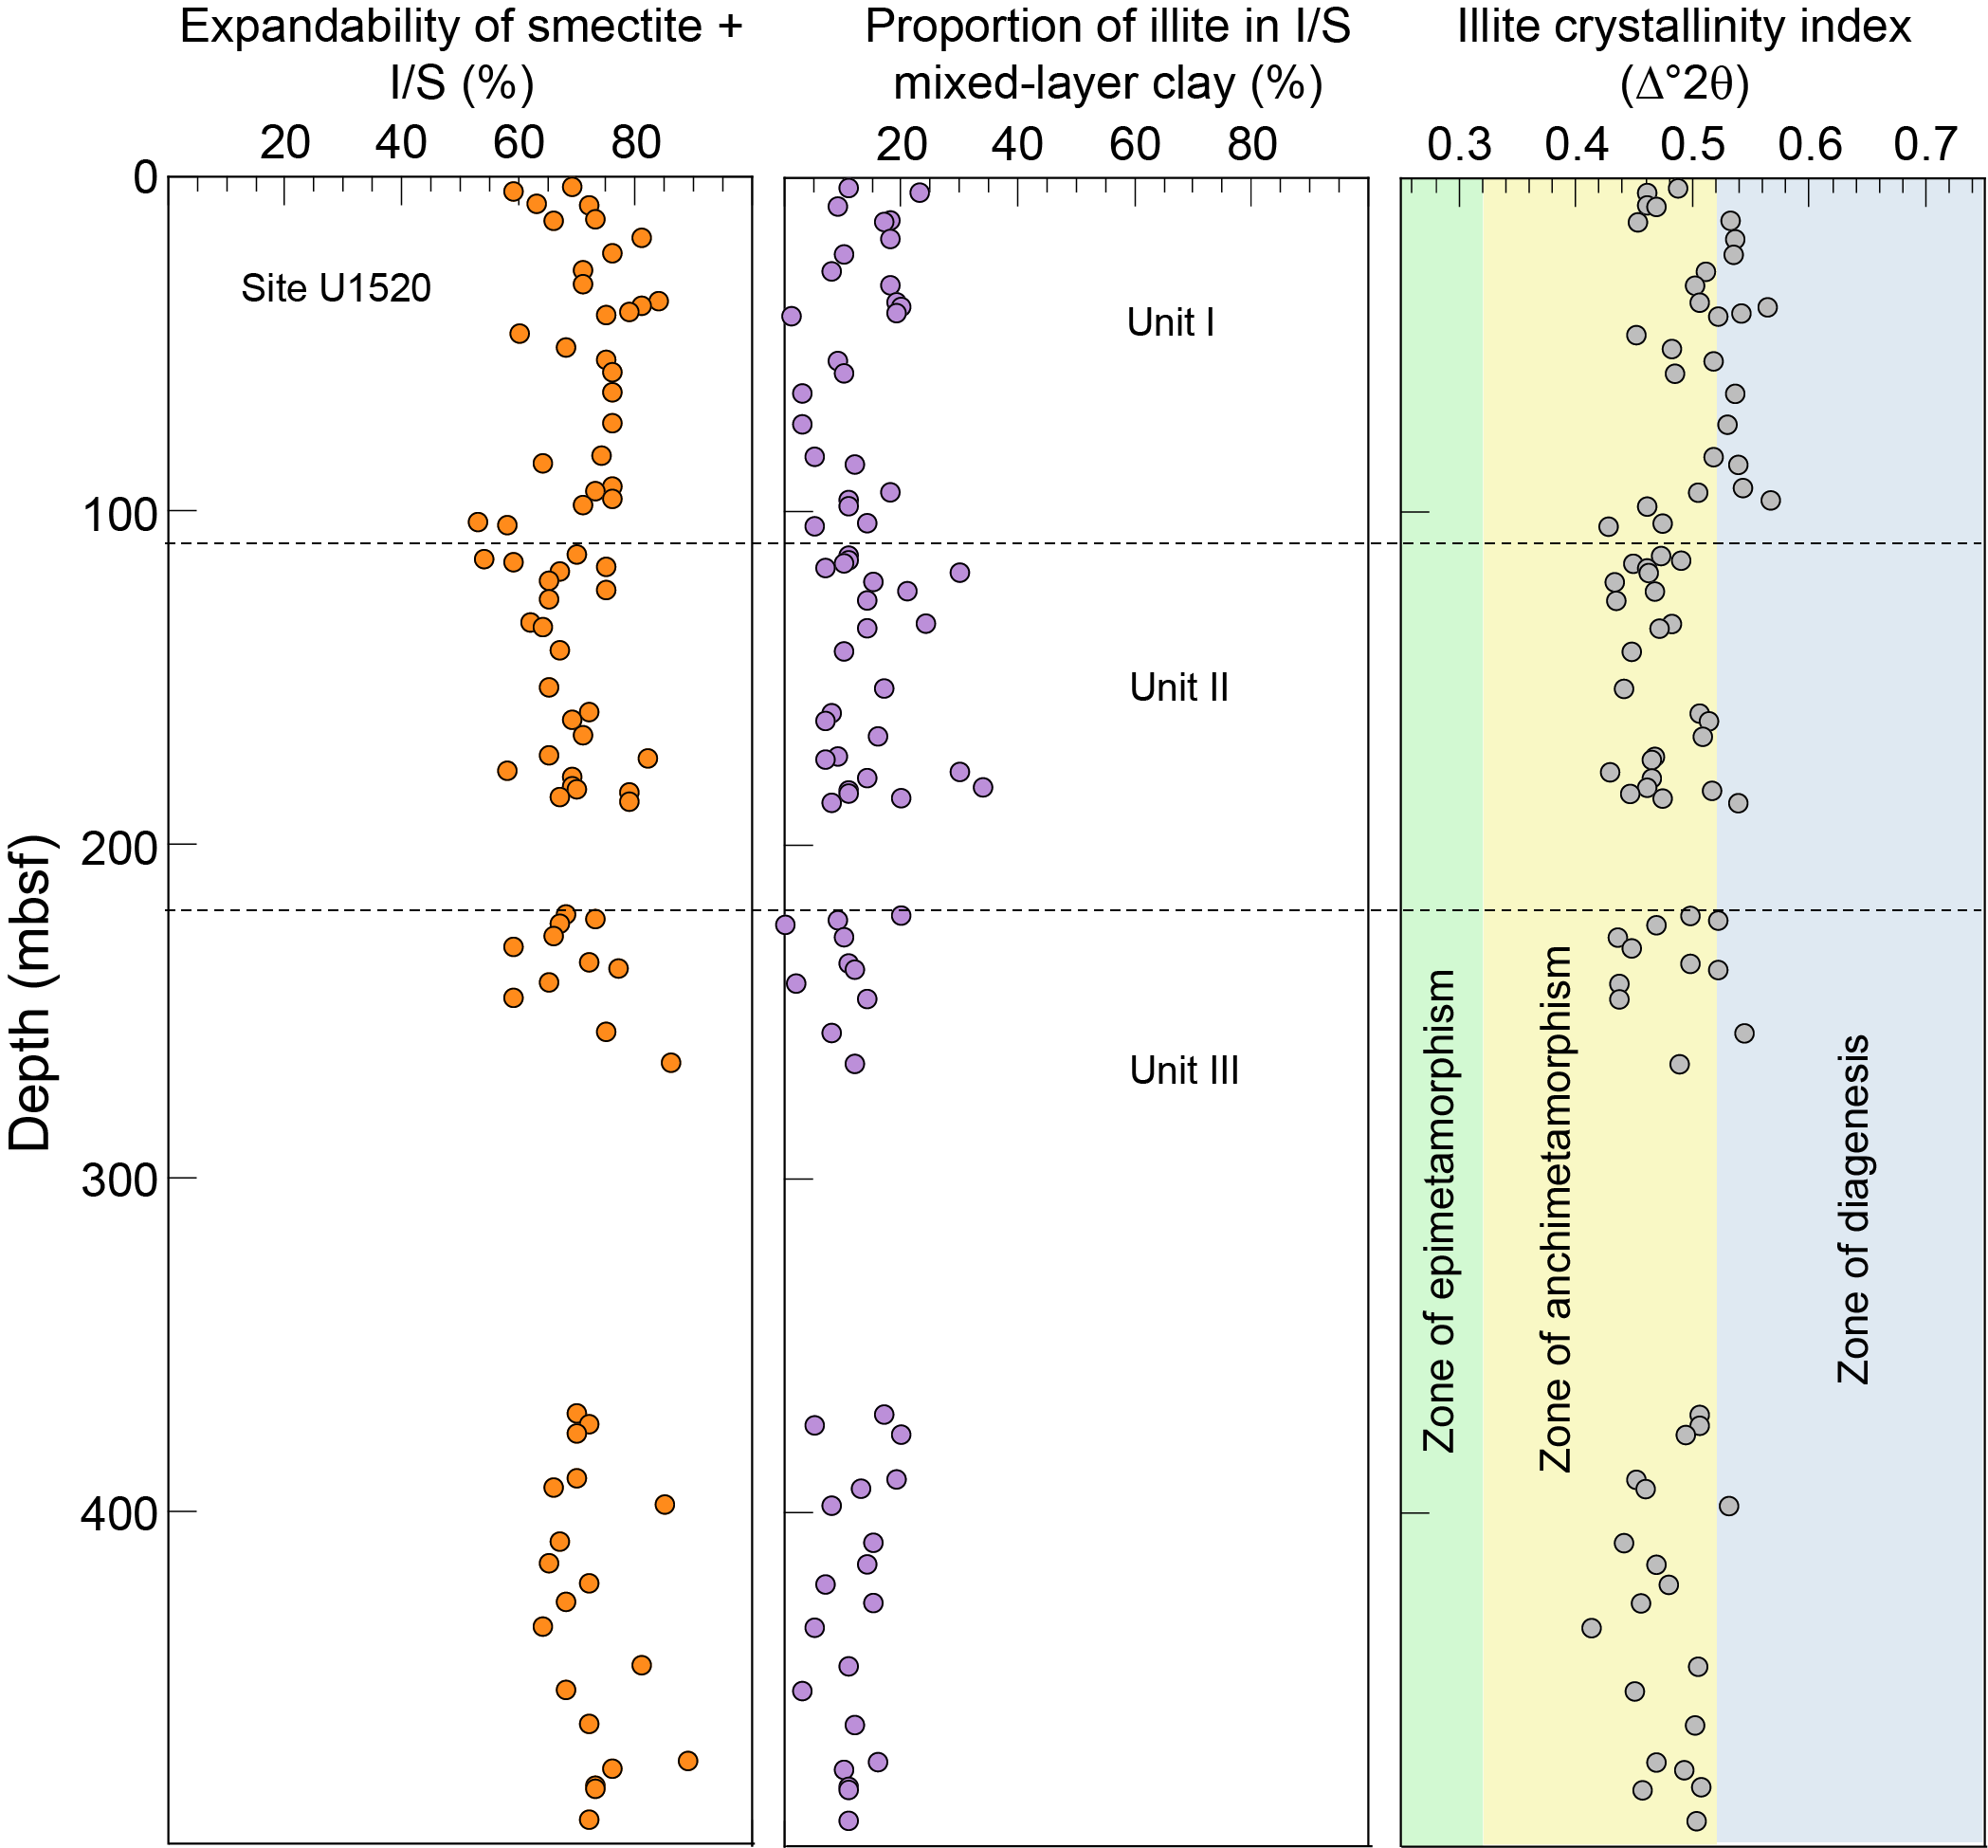
Figure F15. Expandability values, Site U1520.
At Site U1518, values of crystallinity index fall between 0.463 and 0.573Δ°2θ with a mean of 0.517Δ°2θ and a standard deviation of 0.020 (Table T4; Figure F16). Similar to Site U1520, that range of crystallinity values straddles the domains of advanced diagenesis and anchimetamorphism but with a small shift of the average to higher levels of thermal maturity. The expandability of smectite plus smectite-rich I/S mixed-layer clay ranges from 57% to 91% with a mean value of 75.2% and a standard deviation of 6.0 (Table T4; Figure F16). Percentages of illite within the I/S mixed-layer phase range from 1% to 21% with a mean of 10.3% and a standard deviation of 5.0 (Table T2; Figure F16). As with results from Site U1520, the data fail to reveal systematic gradients as a function of burial depth or shifts among the lithostratigraphic units.
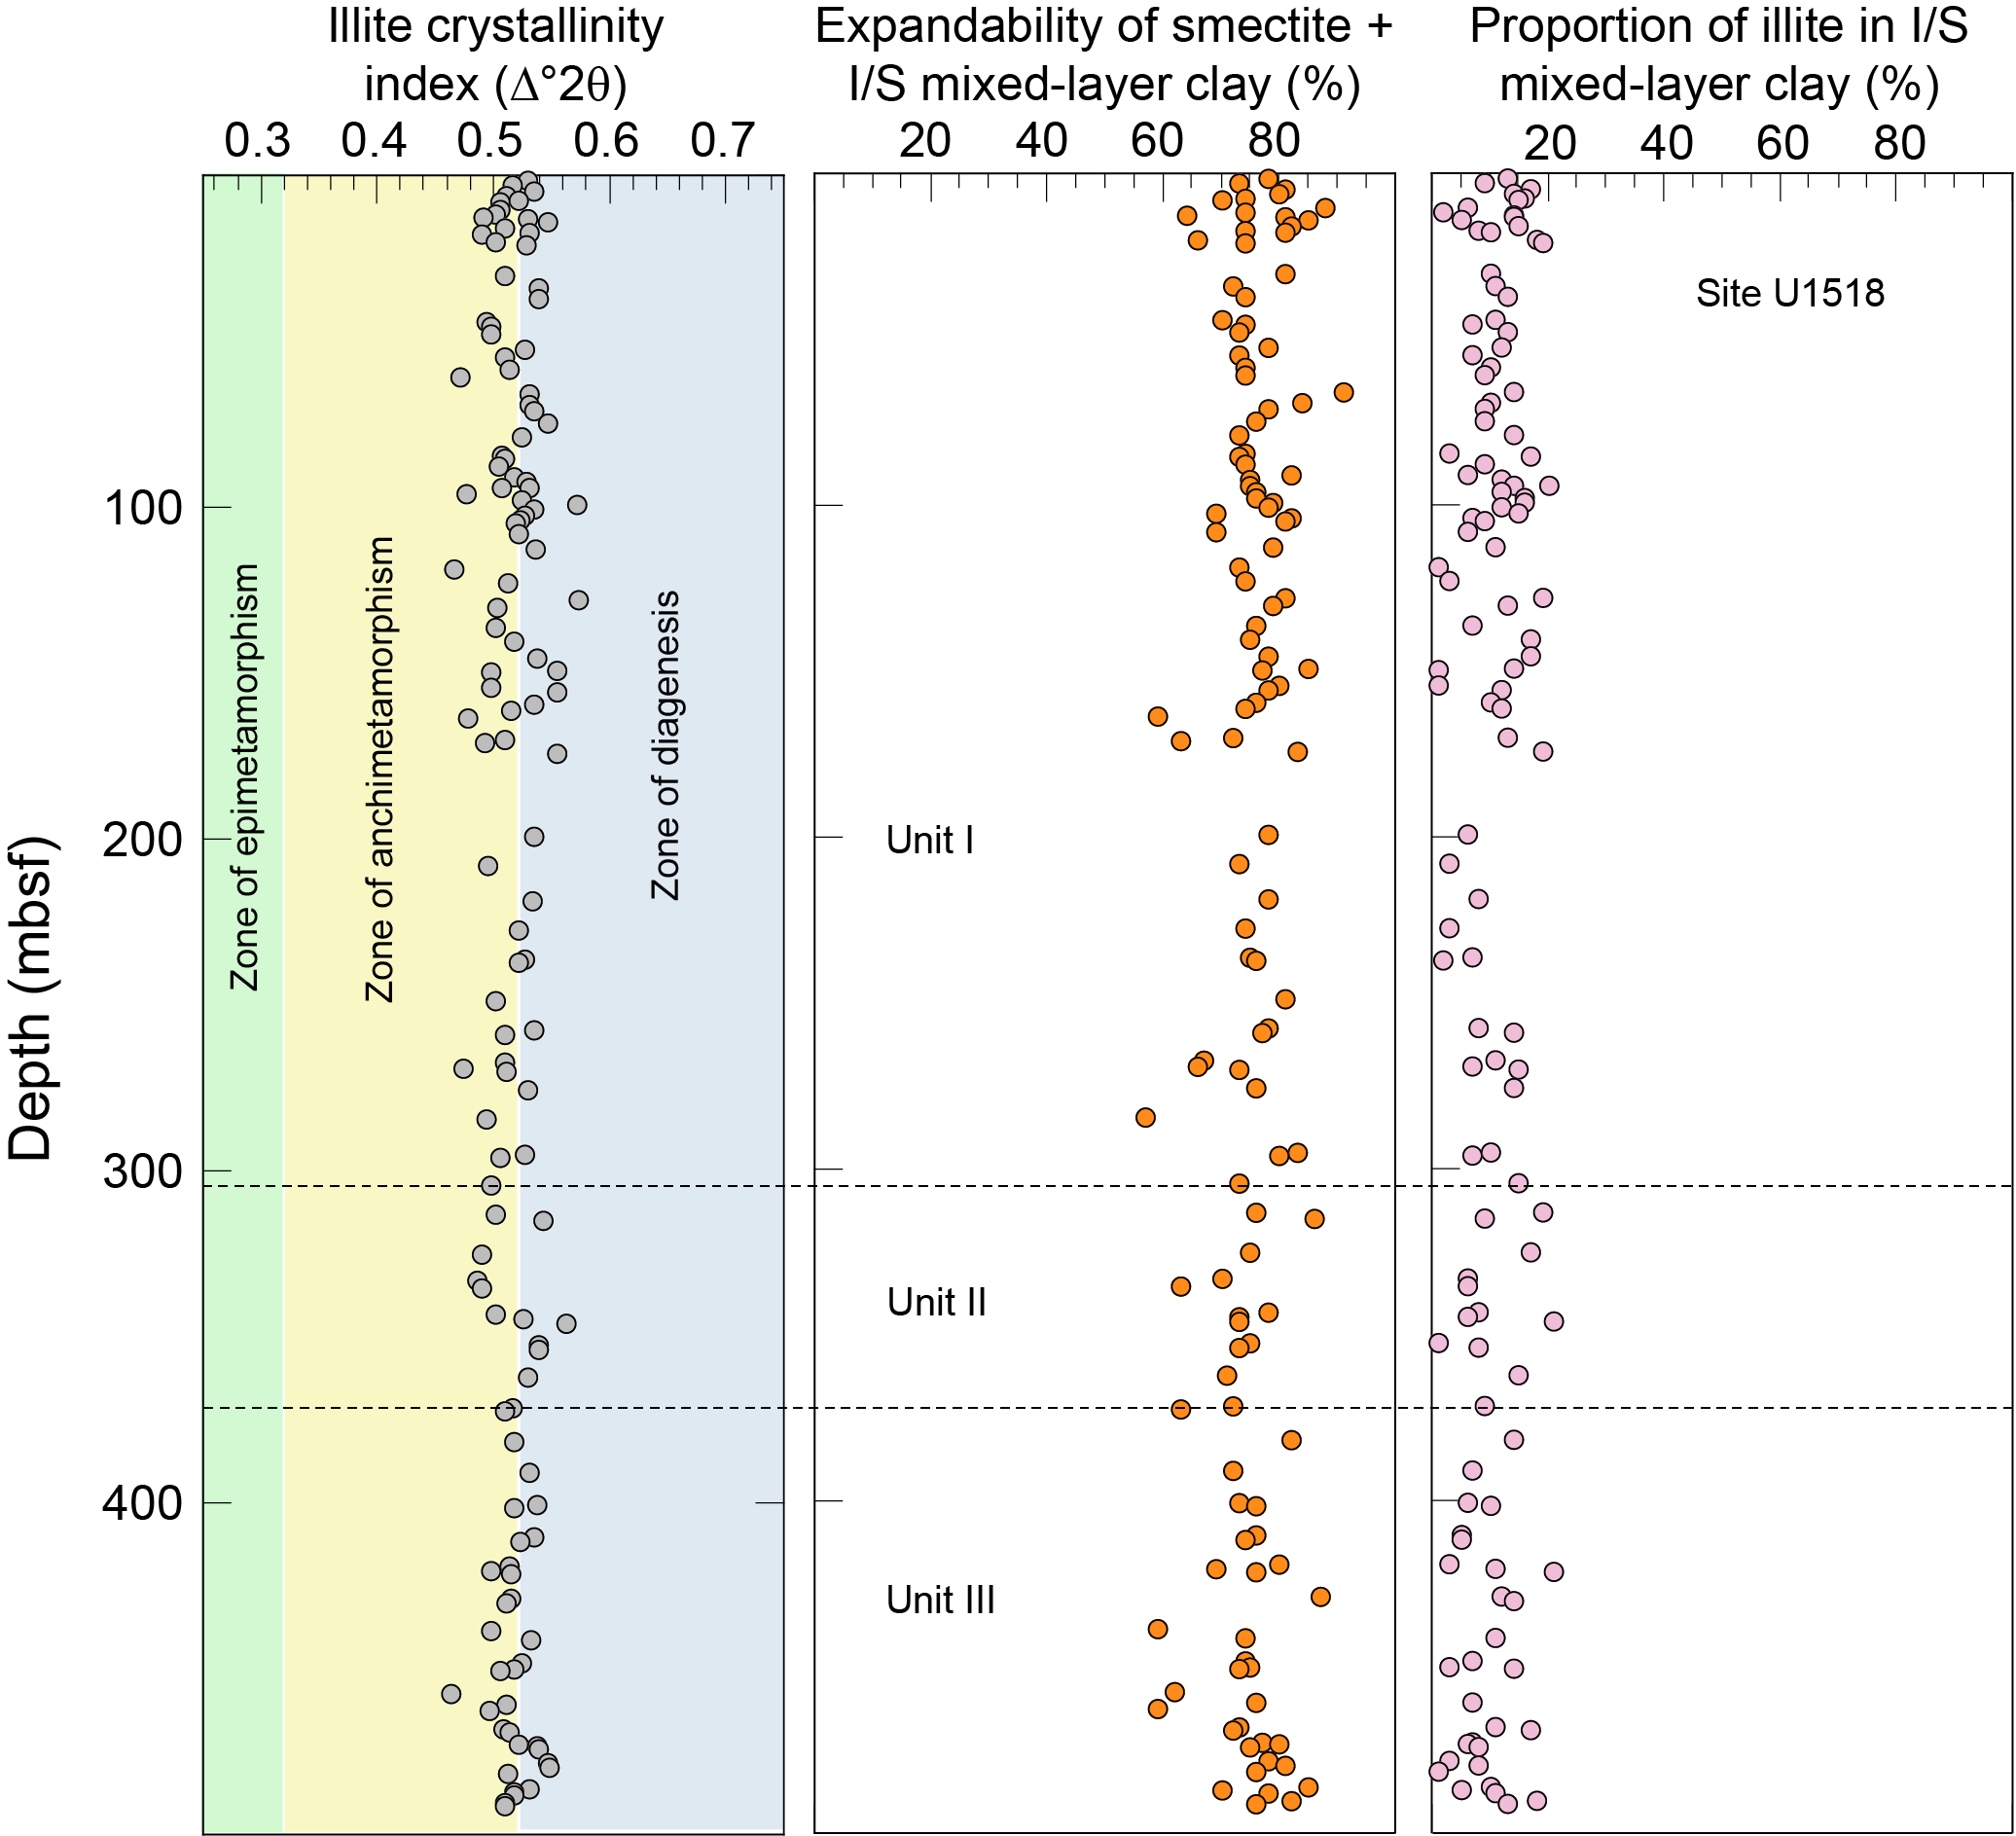
Figure F16. Expandability values, Site U1518.
Conclusions
XRD analyses of the clay-sized fraction of hemipelagic mud(stone) specimens from Sites U1520 (trench-wedge deposits) and U1518 (accreted trench-wedge deposits) reveal unusually large amounts of scatter in clay mineral assemblages. Smectite is dominant in some specimens but markedly depleted in others. Increases in the abundance of smectite are balanced largely by decreases in the abundance of illite and vice versa. Results from Site U1518 closely match those from Unit III at Site U1520. Overall, the proportions of smectite at Site U1520 (Units I–III) range from 11.4 to 51.9 wt% with a mean value (µ) of 31.4 wt% and a standard deviation (σ) of 11.1. Weight percent values for illite range from 26.8 to 56.1 wt% (µ = 41.5; σ = 6.9), and the proportion of undifferentiated (chlorite + kaolinite) ranges from 4.3 to 20.6 wt% (µ = 11.6; σ = 3.6). The content of clay-sized quartz also shows considerable variability, ranging from 5.1 to 30.3 wt% (µ = 15.5; σ = 6.1). At Site U1518, proportions of smectite range from 8.7 to 52.5 wt% with a mean value of 38.4 wt% and a standard deviation of 9.8 wt%. Weight percent values for illite range from 28.5 to 61.1 wt% (µ = 41.5; σ = 6.9), and the proportion of undifferentiated (chlorite + kaolinite) ranges from 5.4 to 25.8 wt% (µ = 11.8; σ = 4.1). The content of clay-sized quartz shows less variability, ranging from 3.9 to 17.9 wt% (µ = 8.3; σ = 2.3). Excursions in mineralogy are not evident at the interpreted fault-slip surfaces (e.g., Pāpaku fault), nor are they evident across boundaries between lithologic units. XRD indicators of clay diagenesis (illite crystallinity index, smectite expandability, and %illite in I/S mixed-layer clay) show no depth-dependent trends. Their values should be viewed as measures of geologic conditions within potential detrital source regions.
Acknowledgments
This study used samples provided by the International Ocean Discovery Program. I thank the crew members, IODP technicians, and shipboard scientists for their assistance with sample acquisition during Expedition 375. Funding was provided by the U.S. Science Support Program. Karissa Rosenberger and Mercedes Salazar assisted with sample preparation at the New Mexico Institute of Mining and Technology, and Kelsey McNamara completed XRD scans at the New Mexico Bureau of Geology and Mineral Resources. An anonymous reviewer provided suggestions to improve clarity of the report.
References
Bailey, W.S., McArthur, A.D., and McCaffrey, W.D., 2021. Distribution of contourite drifts on convergent margins: examples from the Hikurangi subduction margin of New Zealand. Sedimentology, 68(1):294–323. https://doi.org/10.1111/sed.12779
Barnes, P.M., Wallace, L.M., Saffer, D.M., Bell, R.E., Underwood, M.B., Fagereng, A., Meneghini, F., et al., 2020. Slow slip source characterized by lithological and geometric heterogeneity. Science Advances, 6:eaay3314. https://doi.org/10.1126/sciadv.aay3314
Barnes, P.M., Wallace, L.M., Saffer, D.M., Pecher, I.A., Petronotis, K.E., LeVay, L.J., Bell, R.E., Crundwell, M.P., Engelmann de Oliveira, C.H., Fagereng, A., Fulton, P.M., Greve, A., Harris, R.N., Hashimoto, Y., Hüpers, A., Ikari, M.J., Ito, Y., Kitajima, H., Kutterolf, S., Lee, H., Li, X., Luo, M., Malie, P.R., Meneghini, F., Morgan, J.K., Noda, A., Rabinowitz, H.S., Savage, H.M., Shepherd, C.L., Shreedharan, S., Solomon, E.A., Underwood, M.B., Wang, M., Woodhouse, A.D., Bourlange, S.M., Brunet, M.M.Y., Cardona, S., Clennell, M.B., Cook, A.E., Dugan, B., Elger, J., Gamboa, D., Georgiopoulou, A., Han, S., Heeschen, K.U., Hu, G., Kim, G.Y., Koge, H., Machado, K.S., McNamara, D.D., Moore, G.F., Mountjoy, J.J., Nole, M.A., Owari, S., Paganoni, M., Rose, P.S., Screaton, E.J., Shankar, U., Torres, M.E., Wang, X., and Wu, H.-Y., 2019. Site U1520. In Wallace, L.M., Saffer, D.M., Barnes, P.M., Pecher, I.A., Petronotis, K.E., LeVay, L.J., and the Expedition 372/375 Scientists, Hikurangi Subduction Margin Coring, Logging, and Observatories. Proceedings of the International Ocean Discovery Program, 372B/375: College Station, TX (International Ocean Discovery Program). https://doi.org/10.14379/iodp.proc.372B375.105.2019
Biscaye, P.E., 1965. Mineralogy and sedimentation of recent deep-sea clay in the Atlantic Ocean and adjacent seas and oceans. Geological Society of America Bulletin, 76(7):803–831. https://doi.org/10.1130/0016-7606(1965)76[803:MASORD]2.0.CO;2
Brown, K.M., Kopf, A., Underwood, M.B., and Weinberger, J.L., 2003. Compositional and fluid pressure controls on the state of stress on the Nankai subduction thrust: a weak plate boundary. Earth and Planetary Science Letters, 214(3–4):589–603. https://doi.org/10.1016/S0012-821X(03)00388-1
Carter, L., Carter, R.M., and McCave, I.N., 2004. Evolution of the sedimentary system beneath the deep Pacific inflow off eastern New Zealand. Marine Geology, 205(1–4):9–27. https://doi.org/10.1016/S0025-3227(04)00016-7
Carter, L., Manighetti, B., Elliot, M., Trustrum, N., and Gomez, B., 2002. Source, sea level and circulation effects on the sediment flux to the deep ocean over the past 15 ka off eastern New Zealand. Global and Planetary Change, 33(3–4):339–355. https://doi.org/10.1016/S0921-8181(02)00087-5
Carter, L., and Wilkin, J., 1999. Abyssal circulation around New Zealand – a comparison between observations and a global circulation model. Marine Geology, 159(1–4):221–239. https://doi.org/10.1016/S0025-3227(98)00205-9
Chiswell, S.M., Bostock, H.C., Sutton, P.J.H., and Williams, M.J.M., 2015. Physical oceanography of the deep seas around New Zealand: a review. New Zealand Journal of Marine and Freshwater Research, 49(2):286–317. https://doi.org/10.1080/00288330.2014.992918
Collot, J.-Y., Lewis, K., Lamarache, G., and Lallemand, S., 2001. The giant Ruatoria debris avalanche on the northern Hikurangi margin, New Zealand; result of oblique seamount subduction. Journal of Geophysical Research: Solid Earth, 106(B9):19271–19297. https://doi.org/10.1029/2001JB900004
Davy, B., Hoernle, K., and Werner, R., 2008. Hikurangi Plateau: crustal structure, rifted formation, and Gondwana subduction history. Geochemistry, Geophysics, Geosystems, 9(7):Q07004. https://doi.org/10.1029/2007GC001855
Fagereng, Å., Savage, H.M., Morgan, J.K., Wang, M., Meneghini, F., Barnes, P.M., Bell, R., et al., 2019. Mixed deformation styles observed on a shallow subduction thrust, Hikurangi margin, New Zealand. Geology, 47(9):872–876. https://doi.org/10.1130/G46367.1
Ferreiro Mählmann, R., and Frey, M., 2012. Standardisation, calibration and correlation of the Kübler-index and the vitrinite/bituminite reflectance: an interlaboratory and field related study. Swiss Journal of Geoscience, 105:153–170. https://doi.org/10.1007/s00015-012-0110-8
Fisher, A.T., and Underwood, M.B., 1995. Calibration of an X-ray diffraction method to determine relative mineral abundances in bulk powders using matrix singular value decomposition: a test from the Barbados accretionary complex. In Shipley, T.H., Ogawa, Y., Blum, P., et al., Proceedings of the Ocean Drilling Program, Initial Reports, 156: College Station, TX (Ocean Drilling Program), 29–37. https://doi.org/10.2973/odp.proc.ir.156.103.1995
Gingele, F.X., De Deckker, P., and Hillenbrand, C.-D., 2001. Clay mineral distribution in surface sediment between Indonesia and NW Australia—source and transport by ocean currents. Marine Geology, 179(3–4):135–146. https://doi.org/10.1016/S0025-3227(01)00194-3
Guo, J., and Underwood, M.B., 2011. Data report: refined method for calculating percentages of kaolinite and chlorite from X-ray diffraction data, with application to the Nankai margin of southwest Japan. In Kinoshita, M., Tobin, H., Ashi, J., Kimura, G., Lallemant, S., Screaton, E.J., Curewitz, D., Masago, H., Moe, K.T., and the Expedition 314/315/316 Scientists. Proceedings of the Integrated Ocean Drilling Program, Volume 314/315/316. Washington, DC (Integrated Ocean Drilling Program Management International, Inc.). https://doi.org/10.2204/iodp.proc.314315316.201.2011
Ikari, M.J., Kopf, A.J., Hüpers, A., and Vogt, C., 2018. Lithologic control of frictional strength variations in subduction zone sediment inputs. Geosphere, 14(2):604–625. https://doi.org/10.1130/GES01546.1
Jeppson, T., and Kitajima, H., 2019. Evolution of compressional wave velocity and porosity in carbonate and siliceous subduction zone input materials (presented at the 2019 American Geophysical Union Fall Meeting, San Francisco, California, 9–13 December 2019). (Abstract T41I-0240). https://agu.confex.com/agu/fm19/meetingapp.cgi/Paper/564867
Kisch, H.J., 1991. Illite crystallinity: recommendations on sample preparation, X-ray diffraction settings, and interlaboratory samples. Journal of Metamorphic Geology, 9(6):665–670. https://doi.org/10.1111/j.1525-1314.1991.tb00556.x
Kopf, A., and Brown, K.M., 2003. Friction experiments on saturated sediments and their implications for the stress state of the Nankai and Barbados subduction thrusts. Marine Geology, 202(3–4):193–210. https://doi.org/10.1016/S0025-3227(03)00286-X
Lewis, K.B., 1994. The 1500-km-long Hikurangi Channel: trench-axis channel that escapes its trench, crosses a plateau, and feeds a fan drift. Geo-Marine Letters, 14:19–28. https://doi.org/10.1007/BF01204467
Lewis, K.B., Collot, J.-Y., and Lallemand, S.E., 1998. The dammed Hikurangi Trough: a channel-fed trench blocked by subducting seamounts and their wake avalanches (New Zealand–France GeodyNZ Project). Basin Research, 10(4):441–468. https://doi.org/10.1046/j.1365-2117.1998.00080.x
Lewis, K.B., and Pantin, H.M., 2002. Channel-axis, overbank and drift sediment waves in the southern Hikurangi Trough, New Zealand. Marine Geology, 192(1–3):123–151. https://doi.org/10.1016/S0025-3227(02)00552-2
Marsaglia, K.M., Franco, A.M., Morgan, J., Allen, S., and Underwood, M., 2019. Origin and diagenetic priming of a potential slow-slip trigger zone in volcaniclastic deposits flanking a seamount on the subducting plate, Hikurangi margin, New Zealand (presented at the 2019 American Geophysical Union Fall Meeting 2019, San Francisco, California, 9–13 December 2019). (Abstract T51F-0350. https://agu.confex.com/agu/fm19/meetingapp.cgi/Paper/503922
Moore, D.M., and Reynolds, R.C., Jr., 1989a. Identification of mixed-layered clay minerals. In Moore, D.M., and Reynolds, R.C., Jr. (Eds.), X-Ray Diffraction and the Identification and Analysis of Clay Minerals: New York (Oxford Univ. Press USA), 241–271.
Moore, D.M., and Reynolds, R.C., Jr., 1989b. Sample preparation techniques for clay minerals. In Moore, D.M., and Reynolds, R.C., Jr. (Eds.), X-Ray Diffraction and the Identification and Analysis of Clay Minerals: New York (Oxford University Press), 179–201.
Petschick, R., Kuhn, G., and Gingele, F., 1996. Clay mineral distribution in surface sediments of the South Atlantic: sources, transport, and relation to oceanography. Marine Geology, 130(3–4):203–229. https://doi.org/10.1016/0025-3227(95)00148-4
Phillips, S.C., Johnson, J.E., Underwood, M.B., Guo, J., Giosan, L., and Rose, K., 2014. Long-timescale variation in bulk and clay mineral composition of Indian continental margin sediments in the Bay of Bengal, Arabian Sea, and Andaman Sea. Marine and Petroleum Geology, 58(Part A):117–138. https://doi.org/10.1016/j.marpetgeo.2014.06.018
Pouderoux, H., Proust, J.-N., Lamarche, G., Orpin, A., and Neil, H., 2012. Postglacial (after 18 ka) deep-sea sedimentation along the Hikurangi subduction margin (New Zealand): characterisation, timing and origin of turbidites. Marine Geology, 295–298:51–76. https://doi.org/10.1016/j.margeo.2011.11.002
Rettke, R.C., 1981. Probable burial diagenetic and provenance effects on Dakota Group clay mineralogy, Denver Basin. Journal of Sedimentary Research, 51(2):541–551. https://doi.org/10.1306/212F7CCF-2B24-11D7-8648000102C1865D
Saffer, D.M., Wallace, L.M., Barnes, P.M., Pecher, I.A., Petronotis, K.E., LeVay, L.J., Bell, R.E., Crundwell, M.P., Engelmann de Oliveira, C.H., Fagereng, A., Fulton, P.M., Greve, A., Harris, R.N., Hashimoto, Y., Hüpers, A., Ikari, M.J., Ito, Y., Kitajima, H., Kutterolf, S., Lee, H., Li, X., Luo, M., Malie, P.R., Meneghini, F., Morgan, J.K., Noda, A., Rabinowitz, H.S., Savage, H.M., Shepherd, C.L., Shreedharan, S., Solomon, E.A., Underwood, M.B., Wang, M., Woodhouse, A.D., Bourlange, S.M., Brunet, M.M.Y., Cardona, S., Clennell, M.B., Cook, A.E., Dugan, B., Elger, J., Gamboa, D., Georgiopoulou, A., Han, S., Heeschen, K.U., Hu, G., Kim, G.Y., Koge, H., Machado, K.S., McNamara, D.D., Moore, G.F., Mountjoy, J.J., Nole, M.A., Owari, S., Paganoni, M., Rose, P.S., Screaton, E.J., Shankar, U., Torres, M.E., Wang, X., and Wu, H.-Y., 2019a. Expedition 372B/375 summary. In Wallace, L.M., Saffer, D.M., Barnes, P.M., Pecher, I.A., Petronotis, K.E., LeVay, L.J., and the Expedition 372/375 Scientists, Hikurangi Subduction Margin Coring, Logging, and Observatories. Proceedings of the International Ocean Discovery Program, 372B/375: College Station, TX (International Ocean Discovery Program). https://doi.org/10.14379/iodp.proc.372B375.101.2019
Saffer, D.M., Wallace, L.M., Barnes, P.M., Pecher, I.A., Petronotis, K.E., LeVay, L.J., Bell, R.E., Crundwell, M.P., Engelmann de Oliveira, C.H., Fagereng, A., Fulton, P.M., Greve, A., Harris, R.N., Hashimoto, Y., Hüpers, A., Ikari, M.J., Ito, Y., Kitajima, H., Kutterolf, S., Lee, H., Li, X., Luo, M., Malie, P.R., Meneghini, F., Morgan, J.K., Noda, A., Rabinowitz, H.S., Savage, H.M., Shepherd, C.L., Shreedharan, S., Solomon, E.A., Underwood, M.B., Wang, M., Woodhouse, A.D., Bourlange, S.M., Brunet, M.M.Y., Cardona, S., Clennell, M.B., Cook, A.E., Dugan, B., Elger, J., Gamboa, D., Georgiopoulou, A., Han, S., Heeschen, K.U., Hu, G., Kim, G.Y., Koge, H., Machado, K.S., McNamara, D.D., Moore, G.F., Mountjoy, J.J., Nole, M.A., Owari, S., Paganoni, M., Rose, P.S., Screaton, E.J., Shankar, U., Torres, M.E., Wang, X., and Wu, H.-Y., 2019b. Site U1518. In Wallace, L.M., Saffer, D.M., Barnes, P.M., Pecher, I.A., Petronotis, K.E., LeVay, L.J., and the Expedition 372/375 Scientists, Hikurangi Subduction Margin Coring, Logging, and Observatories. Proceedings of the International Ocean Discovery Program, 372B/375: College Station, TX (International Ocean Discovery Program). https://doi.org/10.14379/iodp.proc.372B375.103.2019
Saffer, D.M., Wallace, L.M., and Petronotis, K., 2017. Expedition 375 Scientific Prospectus: Hikurangi Subduction Margin Coring and Observatories. International Ocean Discovery Program. https://doi.org/10.14379/iodp.sp.375.2017
Thiry, M., 2000. Palaeoclimatic interpretation of clay minerals in marine deposits: an outlook from the continental origin. Earth-Science Reviews, 49(1–4):201–221. https://doi.org/10.1016/S0012-8252(99)00054-9
Underwood, M.B., 2020. Data report: reconnaissance of bulk sediment composition and clay mineral assemblages: inputs to the Hikurangi subduction system. In Wallace, L.M., Saffer, D.M., Barnes, P.M., Pecher, I.A., Petronotis, K.E., LeVay, L.J., and the Expedition 372/375 Scientists, Hikurangi Subduction Margin Coring, Logging, and Observatories. Proceedings of the International Ocean Discovery Program, 372B/375: College Station, TX (International Ocean Discovery Program). https://doi.org/10.14379/iodp.proc.372B375.203.2020
Underwood, M.B., submitted. Data report: clay mineral assemblages within biocalcareous and volcaniclastic inputs to the Hikurangi subduction zone, IODP Sites U1520 and U1526, offshore New Zealand. In Wallace, L.M., Saffer, D.M., Barnes, P.M., Pecher, I.A., Petronotis, K.E., LeVay, L.J., and the Expedition 372/375 Scientists, Hikurangi Subduction Margin Coring, Logging, and Observatories. Proceedings of the International Ocean Discovery Program, 372B/375: College Station, TX (International Ocean Discovery Program).
Underwood, M.B., Basu, N., Steurer, J., and Udas, S., 2003. Data report: normalization factors for semiquantitative X-ray diffraction analysis, with application to DSDP Site 297, Shikoku Basin. In Mikada, H., Moore, G.F., Taira, A., Becker, K., Moore, J.C., and Klaus, A. (Eds.), Proceedings of the Ocean Drilling Program, Scientific Results, 190/196: College Station, TX (Ocean Drilling Program), 1–28. https://doi.org/10.2973/odp.proc.sr.190196.203.2003
Underwood, M.B., and Dugan, B., submitted. Data report: clay mineral assemblages within and beneath the Tuaheni landslide complex, IODP Site U1517, offshore New Zealand. In Pecher, I.A., Barnes, P.M., LeVay, L.J., and the Expedition 372A Scientists, Creeping Gas Hydrate Slides. Proceedings of the International Ocean Discovery Program, 372A: College Station, TX (International Ocean Discovery Program).
Underwood, M.B., Lawler, N., and McNamara, K., 2020. Data report: standard mineral mixtures, normalization factors, and determination of error for quantitative X-ray diffraction analyses of bulk powders and clay-sized mineral assemblages. In Wallace, L.M., Saffer, D.M., Barnes, P.M., Pecher, I.A., Petronotis, K.E., LeVay, L.J., and the Expedition 372/375 Scientists, Hikurangi Subduction Margin Coring, Logging, and Observatories. Proceedings of the International Ocean Discovery Program, 372B/375: College Station, TX (International Ocean Discovery Program). https://doi.org/10.14379/iodp.proc.372B375.201.2020
Wallace, L.M., Saffer, D.M., Barnes, P.M., Pecher, I.A., Petronotis, K.E., LeVay, L.J., Bell, R.E., Crundwell, M.P., Engelmann de Oliveira, C.H., Fagereng, A., Fulton, P.M., Greve, A., Harris, R.N., Hashimoto, Y., Hüpers, A., Ikari, M.J., Ito, Y., Kitajima, H., Kutterolf, S., Lee, H., Li, X., Luo, M., Malie, P.R., Meneghini, F., Morgan, J.K., Noda, A., Rabinowitz, H.S., Savage, H.M., Shepherd, C.L., Shreedharan, S., Solomon, E.A., Underwood, M.B., Wang, M., Woodhouse, A.D., Bourlange, S.M., Brunet, M.M.Y., Cardona, S., Clennell, M.B., Cook, A.E., Dugan, B., Elger, J., Gamboa, D., Georgiopoulou, A., Han, S., Heeschen, K.U., Hu, G., Kim, G.Y., Koge, H., Machado, K.S., McNamara, D.D., Moore, G.F., Mountjoy, J.J., Nole, M.A., Owari, S., Paganoni, M., Rose, P.S., Screaton, E.J., Shankar, U., Torres, M.E., Wang, X., and Wu, H.-Y., 2019. Expedition 372B/375 methods. In Wallace, L.M., Saffer, D.M., Barnes, P.M., Pecher, I.A., Petronotis, K.E., LeVay, L.J., and the Expedition 372/375 Scientists, Hikurangi Subduction Margin Coring, Logging, and Observatories. Proceedings of the International Ocean Discovery Program, 372B/375: College Station, TX (International Ocean Discovery Program). https://doi.org/10.14379/iodp.proc.372B375.102.2019
Warr, L.N., and Cox, S.C., 2016. Correlating illite (Kübler) and chlorite (Árakai) "crystallinity" indices with metamorphic mineral zones of the South Island, New Zealand. Applied Clay Science, 134(3):164–174. https://doi.org/10.1016/j.clay.2016.06.024
Warr, L.N., and Ferreiro Mählmann, R.F., 2015. Recommendations for Kübler Index standardization. Clay Minerals, 50(3):283–286. https://doi.org/10.1180/claymin.2015.050.3.02
Winkler, A., and Dullo, W.-C., 2002. Data report: Miocene to Pleistocene sedimentation pattern on the Chatham Rise, New Zealand. In Richter, C. (Ed.), Proceedings of the Ocean Drilling Program, Scientific Results, 181:1–21. College Station, TX (Ocean Drilling Program). https/doi.org/10.2973/odp.proc.sr.181.206.2002
1 Underwood, M.B., 2021. Data report: clay mineral assemblages within trench-floor and accreted trench-floor deposits, IODP Expedition 372B/375 Sites U1518 and U1520, offshore New Zealand. In Wallace, L.M., Saffer, D.M., Barnes, P.M., Pecher, I.A., Petronotis, K.E., LeVay, L.J., and the Expedition 372/375 Scientists, Hikurangi Subduction Margin Coring, Logging, and Observatories. Proceedings of the International Ocean Discovery Program, 372B/375: College Station, TX (International Ocean Discovery Program). https://doi.org/10.14379/iodp.proc.372B375.206.2021
2 Department of Earth & Environmental Science, New Mexico Institute of Mining & Technology, USA. UnderwoodM@missouri.edu
This work is distributed under the Creative Commons Attribution 4.0 International (CC BY 4.0) license. 