Teske, A., Lizarralde, D., Höfig, T.W., and the Expedition 385 Scientists
Proceedings of the International Ocean Discovery Program Volume 385
publications.iodp.org
https://doi.org/10.14379/iodp.proc.385.105.2021
Sites U1547 and U15481
![]() A. Teske,
A. Teske,
![]() D. Lizarralde,
D. Lizarralde,
![]() T.W. Höfig,
T.W. Höfig,
![]() I.W. Aiello,
I.W. Aiello,
![]() J.L. Ash,
J.L. Ash,
![]() D.P. Bojanova,
D.P. Bojanova,
![]() M.D. Buatier,
M.D. Buatier,
![]() V.P. Edgcomb,
V.P. Edgcomb,
![]() C.Y. Galerne,
C.Y. Galerne,
![]() S. Gontharet,
S. Gontharet,
![]() V.B. Heuer,
V.B. Heuer,
![]() S. Jiang,
S. Jiang,
![]() M.A.C. Kars,
M.A.C. Kars,
![]() S. Khogenkumar Singh,
S. Khogenkumar Singh,
![]() J.-H. Kim,
J.-H. Kim,
![]() L.M.T. Koornneef,
L.M.T. Koornneef,
![]() K.M. Marsaglia,
K.M. Marsaglia,
![]() N.R. Meyer,
N.R. Meyer,
![]() Y. Morono,
Y. Morono,
![]() R. Negrete-Aranda,
R. Negrete-Aranda,
![]() F. Neumann,
F. Neumann,
![]() L.C. Pastor,
L.C. Pastor,
![]() M.E. Peña-Salinas,
M.E. Peña-Salinas,
![]() L.L. Pérez-Cruz,
L.L. Pérez-Cruz,
![]() L. Ran,
L. Ran,
![]() A. Riboulleau,
A. Riboulleau,
![]() J.A. Sarao,
J.A. Sarao,
![]() F. Schubert,
F. Schubert,
![]() J.M. Stock,
J.M. Stock,
![]() L.M.A.A. Toffin,
L.M.A.A. Toffin,
![]() W. Xie,
W. Xie,
![]() T. Yamanaka,
T. Yamanaka,
![]() G. Zhuang
2
G. Zhuang
2
1 Teske, A., Lizarralde, D., Höfig, T.W., Aiello, I.W., Ash, J.L., Bojanova, D.P., Buatier, M.D., Edgcomb, V.P., Galerne, C.Y., Gontharet, S., Heuer, V.B., Jiang, S., Kars, M.A.C., Khogenkumar Singh, S., Kim, J.-H., Koornneef, L.M.T., Marsaglia, K.M., Meyer, N.R., Morono, Y., Negrete-Aranda, R., Neumann, F., Pastor, L.C., Peña-Salinas, M.E., Pérez Cruz, L.L., Ran, L., Riboulleau, A., Sarao, J.A., Schubert, F., Stock, J.M., Toffin, L.M.A.A., Xie, W., Yamanaka, T., and Zhuang, G., 2021. Sites U1547 and U1548. In Teske, A., Lizarralde, D., Höfig, T.W., and the Expedition 385 Scientists, Guaymas Basin Tectonics and Biosphere. Proceedings of the International Ocean Discovery Program, 385: College Station, TX (International Ocean Discovery Program). https://doi.org/10.14379/iodp.proc.385.105.2021
2 Expedition 385 Scientists’ affiliations.
1. Summary
1.1. Background and objectives
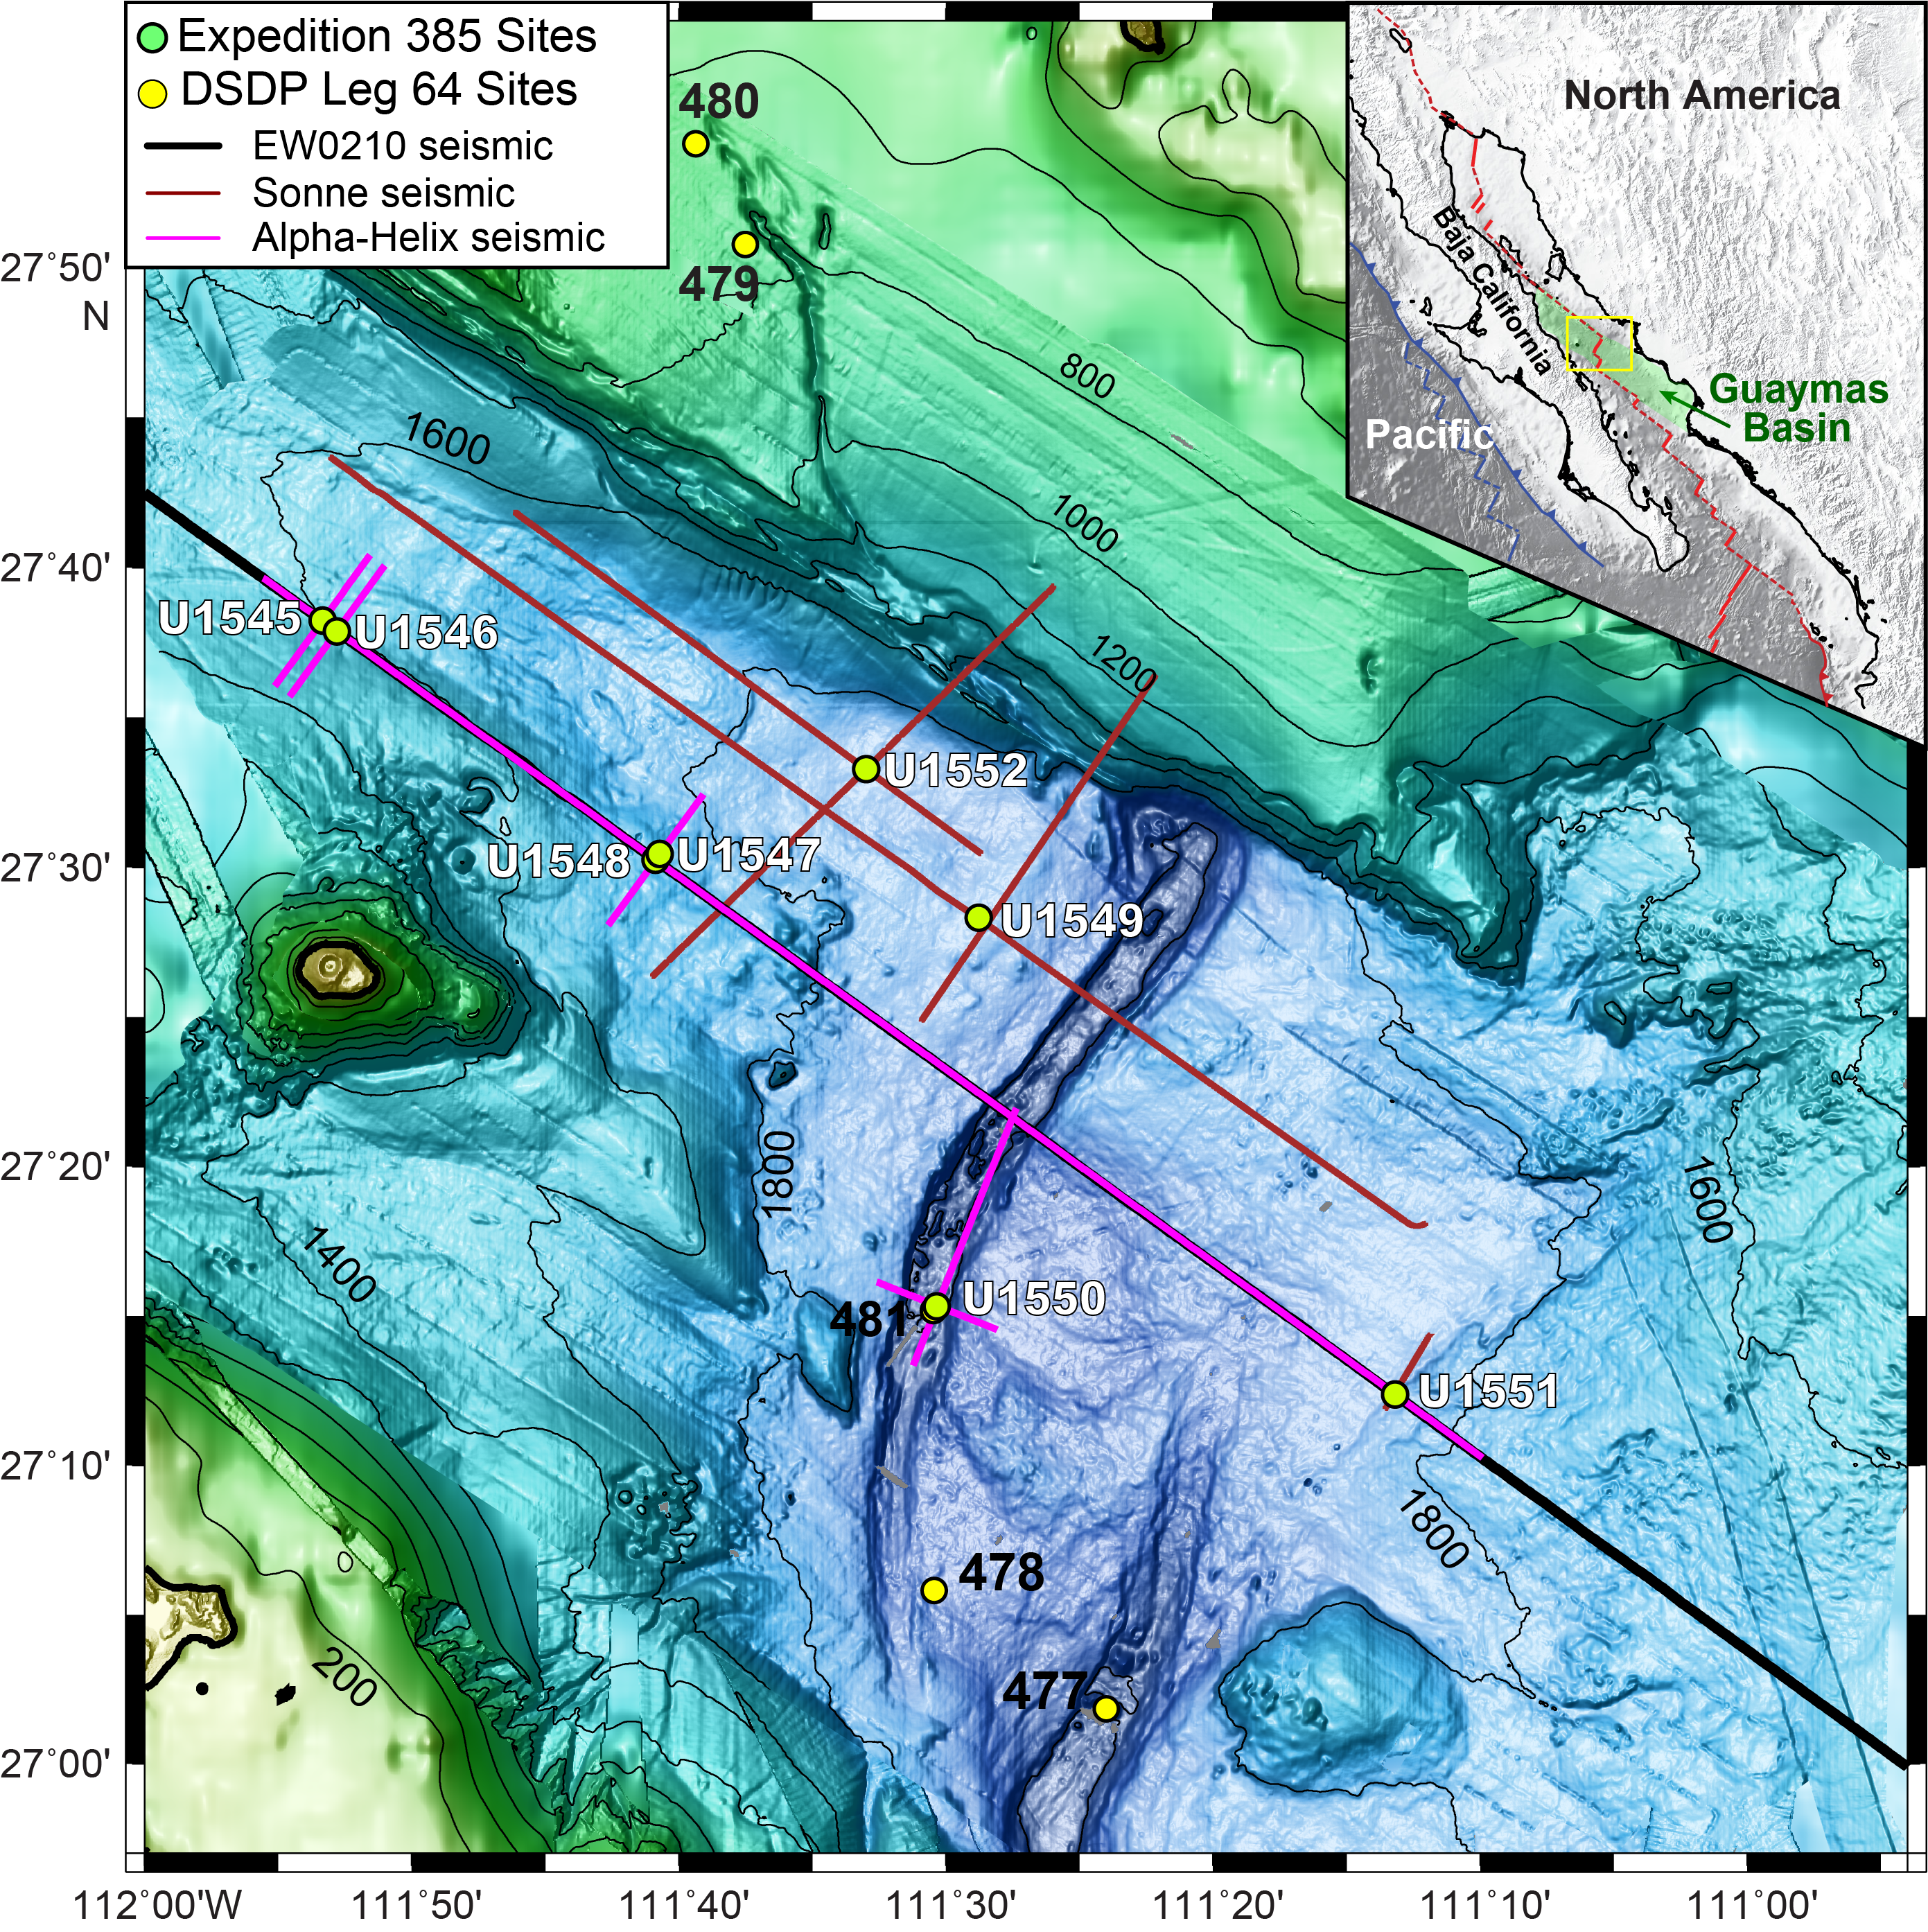
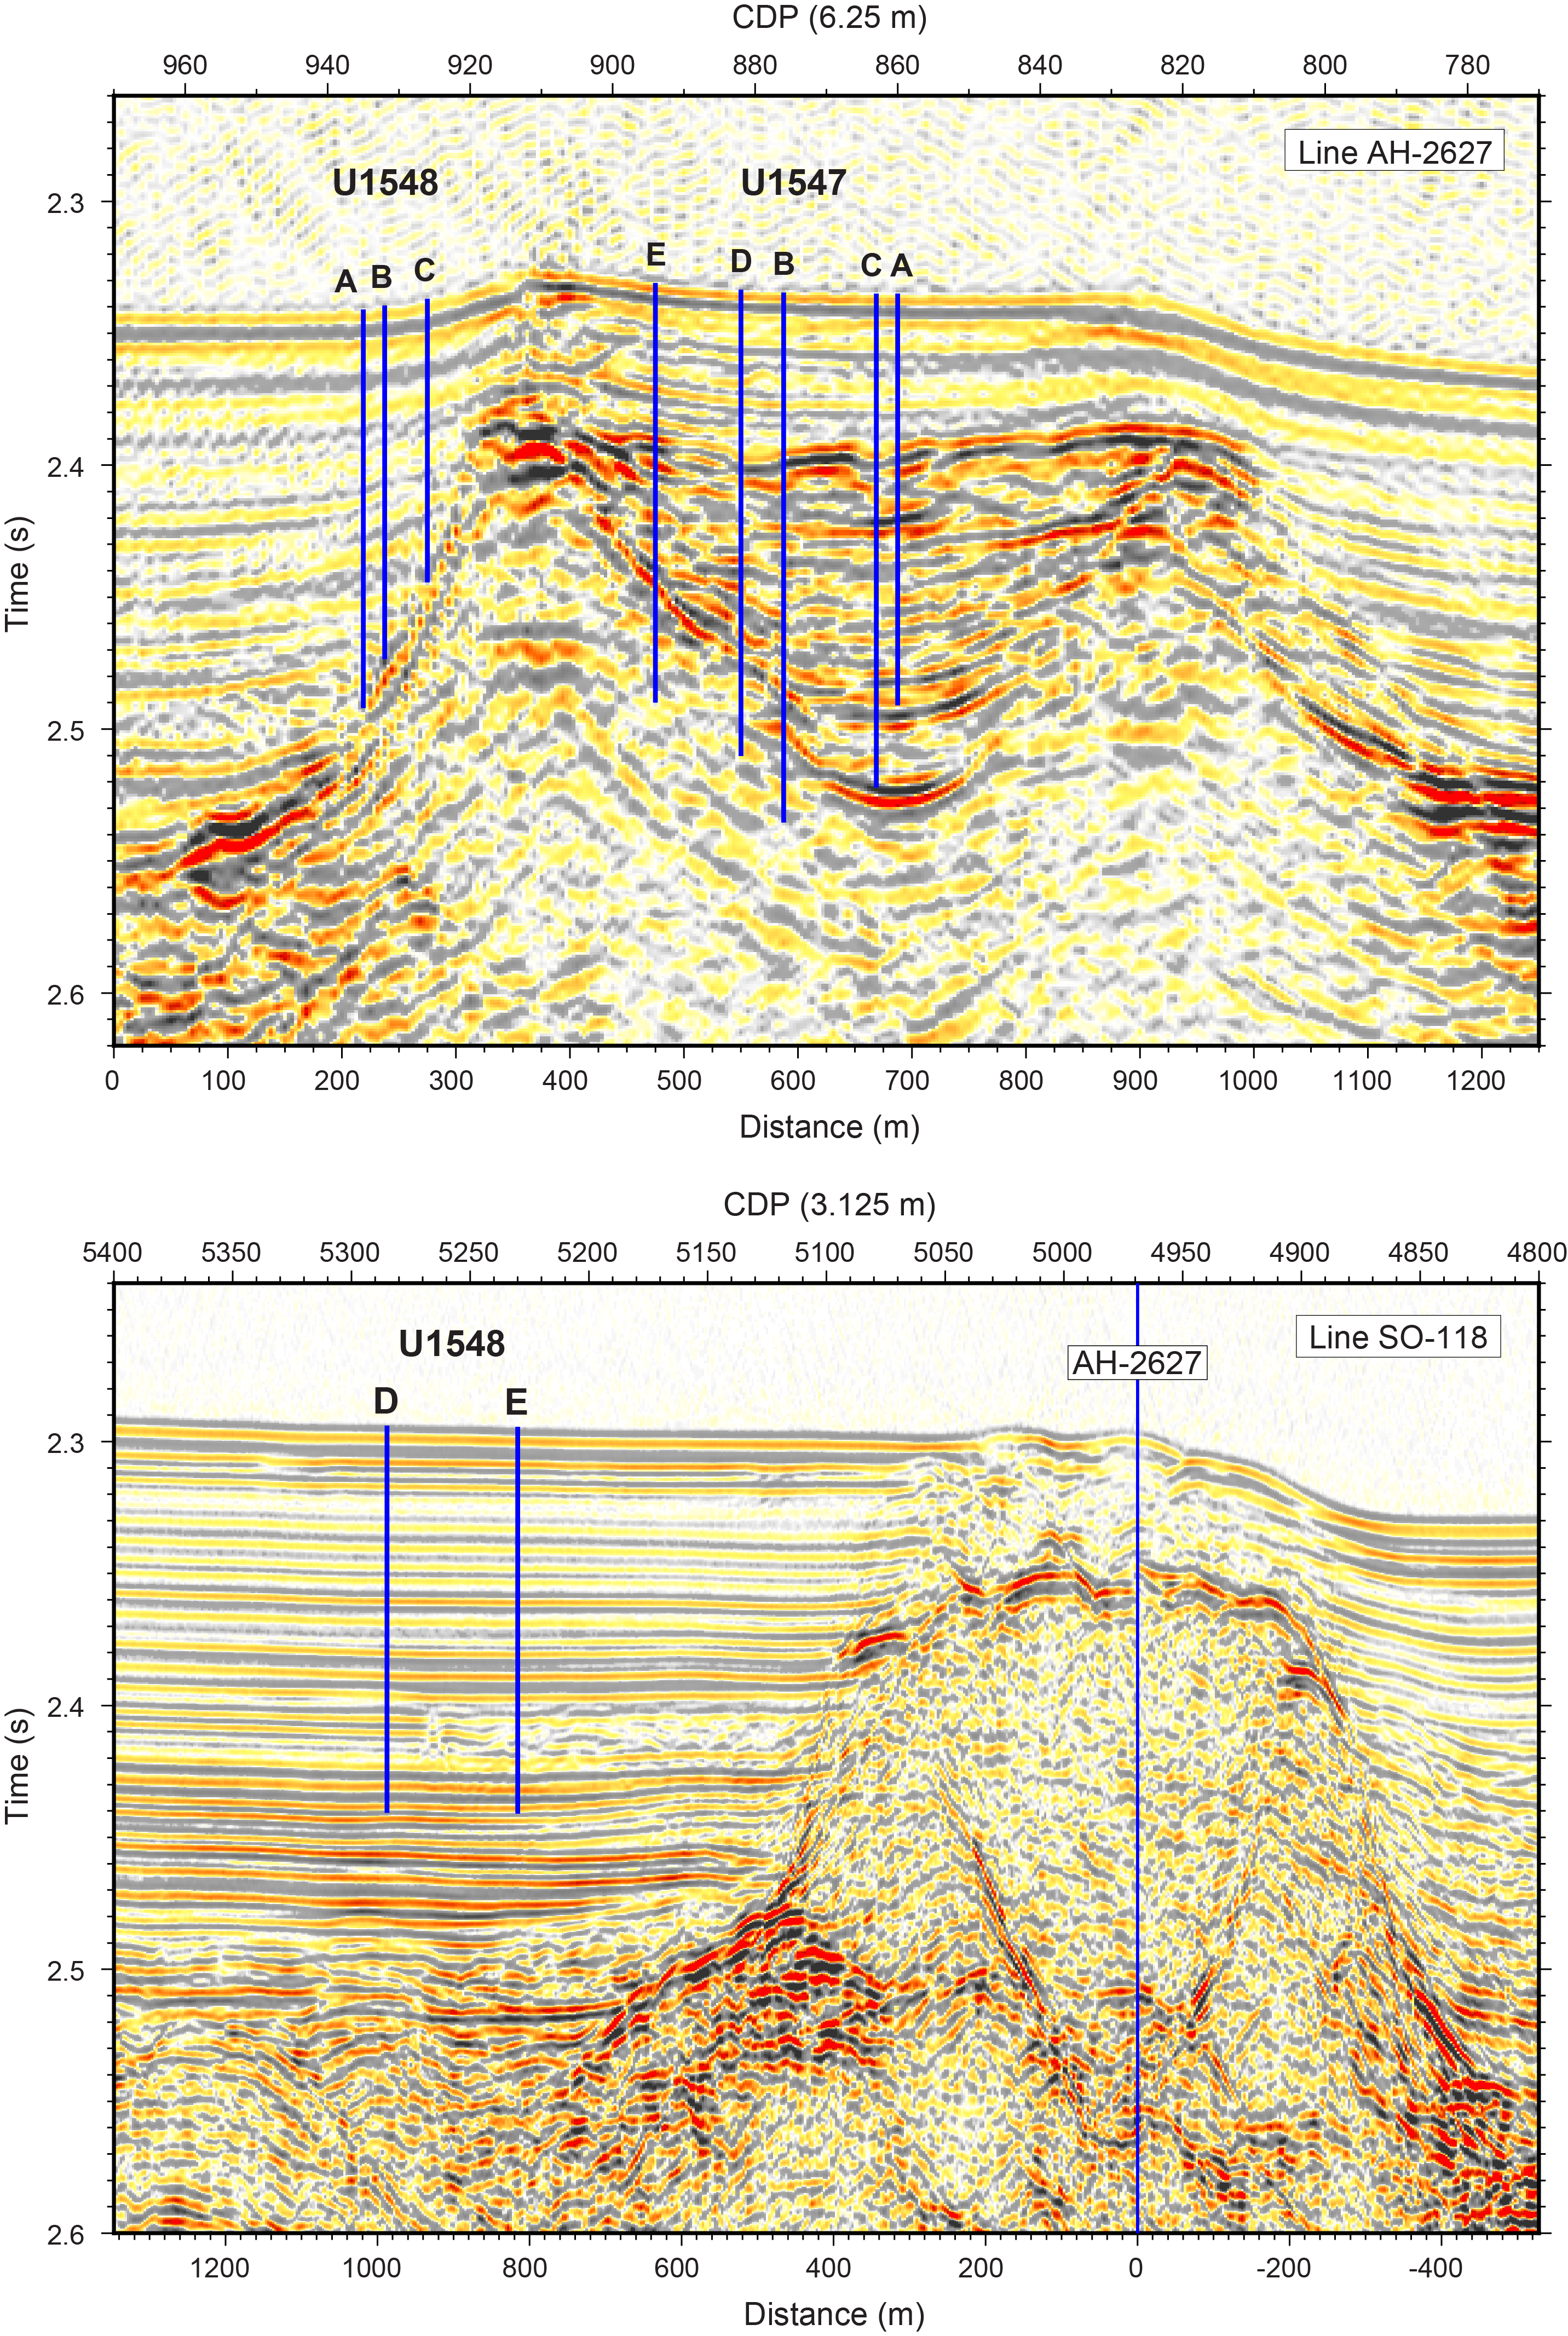
Sites U1547 and U1548 are located ~27 km northwest of the axial graben of the northern Guaymas Basin (Figure F1). Site U1547 lies within a circular, bowl-shaped hydrothermal mound called Ringvent that rises ~20 m above the seafloor and has a maximum diameter of ~800 m. Three holes at Site U1548 (U1548A–U1548C) lie at the periphery of Ringvent’s southeastern edge, and two holes (U1548D and U1548E) are situated ~600 m west-northwest of Ringvent (Figure F2). Seismic profiles across Ringvent show a prominent subseafloor mound feature at ~0.06 s two-way traveltime (TWT) that is characterized by brightly reflective strata within the central bowl-shaped region. A bright reflector underlying the base of the bowl (at ~0.18 s TWT) is interpreted to be a sill intrusion. It is hypothesized that this and previous similar intrusions provided the heat that formed Ringvent and keep it active today. Ringvent is the best-characterized active, sill-associated hydrothermal system at an off-axis site in Guaymas Basin, and the temperature of its vent fluids varies between 20° and 75°C (Teske et al., 2019). Site survey data suggest that the central portion of Ringvent may thus function as a hydrothermal recharge zone. Therefore, Sites U1547 and U1548 were intended to core sediments and sills to explore patterns of hydrothermal circulation at Ringvent, which were suspected to be different within (Site U1547) and outside of (Holes U1548A–U1548C) the ring structure. The comparatively hot sill intrusion setting at Ringvent represents a shallow-emplacement end-member. The primary objectives for Sites U1547 and U1548 were to characterize the physical, chemical, and biological processes driven and affected by this end-member type of sill–sediment system, with a particular focus on the response of microbial communities to the expected steep temperature gradients at these sites. Moreover, two additional holes in an area near Ringvent were added to Site U1548 during the expedition (Holes U1548D and U1548E), with the joint objective of characterizing the geochemical signature of the abrupt lateral change in seismic character observed in sediment strata between ~2.39 and 2.42 s TWT, which may be related to a diagenetic change caused by the proximity to the igneous intrusions at Ringvent.

1.2. Operations
At Sites U1547 and U1548, ten holes were established within or adjacent to the Ringvent structure to characterize this hydrothermal mound and its immediate surroundings.
We cored five holes at Site U1547. In Hole U1547A, located at 27°30.4561′N, 111°40.6980′W in a water depth of 1733.7 m, we used the advanced piston corer (APC), half-length APC (HLAPC), and extended core barrel (XCB) systems to advance from the seafloor to a final depth of 141.3 meters below seafloor (mbsf) with a recovery of 145.3 m (103%). We made formation temperature measurements at several depths using the advanced piston corer temperature (APCT-3) tool and the Sediment Temperature 2 (SET2) tool. In Hole U1547B, located at 27°30.4128′N, 111°40.7341′W in a water depth of 1732.2 m, we deployed the APC, HLAPC, and XCB systems. Cores penetrated from the seafloor to a final depth of 209.8 mbsf and recovered 161.3 m (77%). Formation temperature measurements were made at several depths using the APCT-3 and SET2 tools. Next, we deployed the Kuster Flow Through Sampler (Kuster FTS) to successfully recover two borehole fluid samples, one each from 109.7 and 135.7 mbsf. We then conducted downhole wireline logging with the triple combination (triple combo) and Formation MicroScanner (FMS)-sonic logging tool strings. In Hole U1547C, located at 27°30.4455′N, 111°40.7064′W in a water depth of 1732.2 m, we first drilled without core recovery from the seafloor to 81.3 mbsf. We then used the rotary core barrel (RCB) system to advance from 81.3 mbsf to a final depth of 159.2 mbsf with a recovery of 9.0 m (12%). In Hole U1547D, located at 27°30.3947′N, 111°40.7483′W in a water depth of 1732.2 m, we first drilled without core recovery from the seafloor to 81.3 mbsf. We then used the RCB system to advance from 81.3 mbsf to a final depth of 193.0 mbsf with a recovery of 34.9 m (31%). The Elevated Temperature Borehole Sensor (ETBS) was deployed to take a temperature measurement at the bottom of the hole. In Hole U1547E, located at 27°30.3598′N, 111°40.7756′W in a water depth of 1732.1 m, we first drilled without core recovery from the seafloor to 61.8 mbsf. We then used the RCB system to advance from 61.8 mbsf to a final depth of 191.2 mbsf with a recovery of 44.9 m (35%). Holes U1547B–U1547D were dedicated to extensive microbial and biogeochemical sampling that required the deployment of perfluorocarbon tracers (PFTs) downhole for all cores to monitor drilling fluid (seawater) contamination. A total of 235.0 h, or 9.8 days, were spent at Site U1547 (Table T1).
Five holes were cored at Site U1548. In Hole U1548A, located at 27°30.2466′N, 111°40.8665′W in a water depth of 1739.9 m, we deployed the APC and XCB systems. Cores advanced from the seafloor to a final depth of 103.4 mbsf and recovered 114.0 m (110%). We made formation temperature measurements at several depths using the APCT-3 tool. In Hole U1548B, located at 27°30.2540′N, 111°40.8601′W in a water depth of 1738.9 m, we deployed the APC and XCB systems to advance from the seafloor to a final depth of 95.1 mbsf with a recovery of 87.7 m (92%). We made formation temperature measurements at several depths with the APCT-3 and SET2 tools. We then deployed the Kuster FTS to successfully recover a borehole fluid sample from 70.0 mbsf. In Hole U1548C, located at 27°30.2698′N, 111°40.8476′W in a water depth of 1737.0 m, we deployed the APC and XCB systems to advance from the seafloor to a final depth of 69.8 mbsf with a recovery of 71.0 m (102%). We made formation temperature measurements at several depths with the APCT-3 and SET2 tools. In Hole U1548D, located at 27°30.5316′N, 111°41.3855′W in a water depth of 1729.3 m, we deployed the APC and HLAPC systems. Cores penetrated from the seafloor to a final depth of 110.0 mbsf and recovered 120.5 m (110%). Formation temperature measurements were made at several depths using the APCT-3 tool. In Hole U1548E, located at 27°30.4829′N, 111°41.2922′W in a water depth of 1729.9 m, we deployed the APC system. Cores penetrated from the seafloor to a final depth of 110.0 mbsf and recovered 115.2 m (105%). We conducted formation temperature measurements at several depths using the APCT-3 tool. Holes U1548B and U1548C were dedicated to extensive microbial and biogeochemical sampling that required the deployment of PFTs downhole for all cores to monitor drilling fluid (seawater) contamination. A total of 94.6 h, or 3.9 days, were spent at Site U1548 (Table T2).
1.3. Principal results
1.3.1. Lithostratigraphy
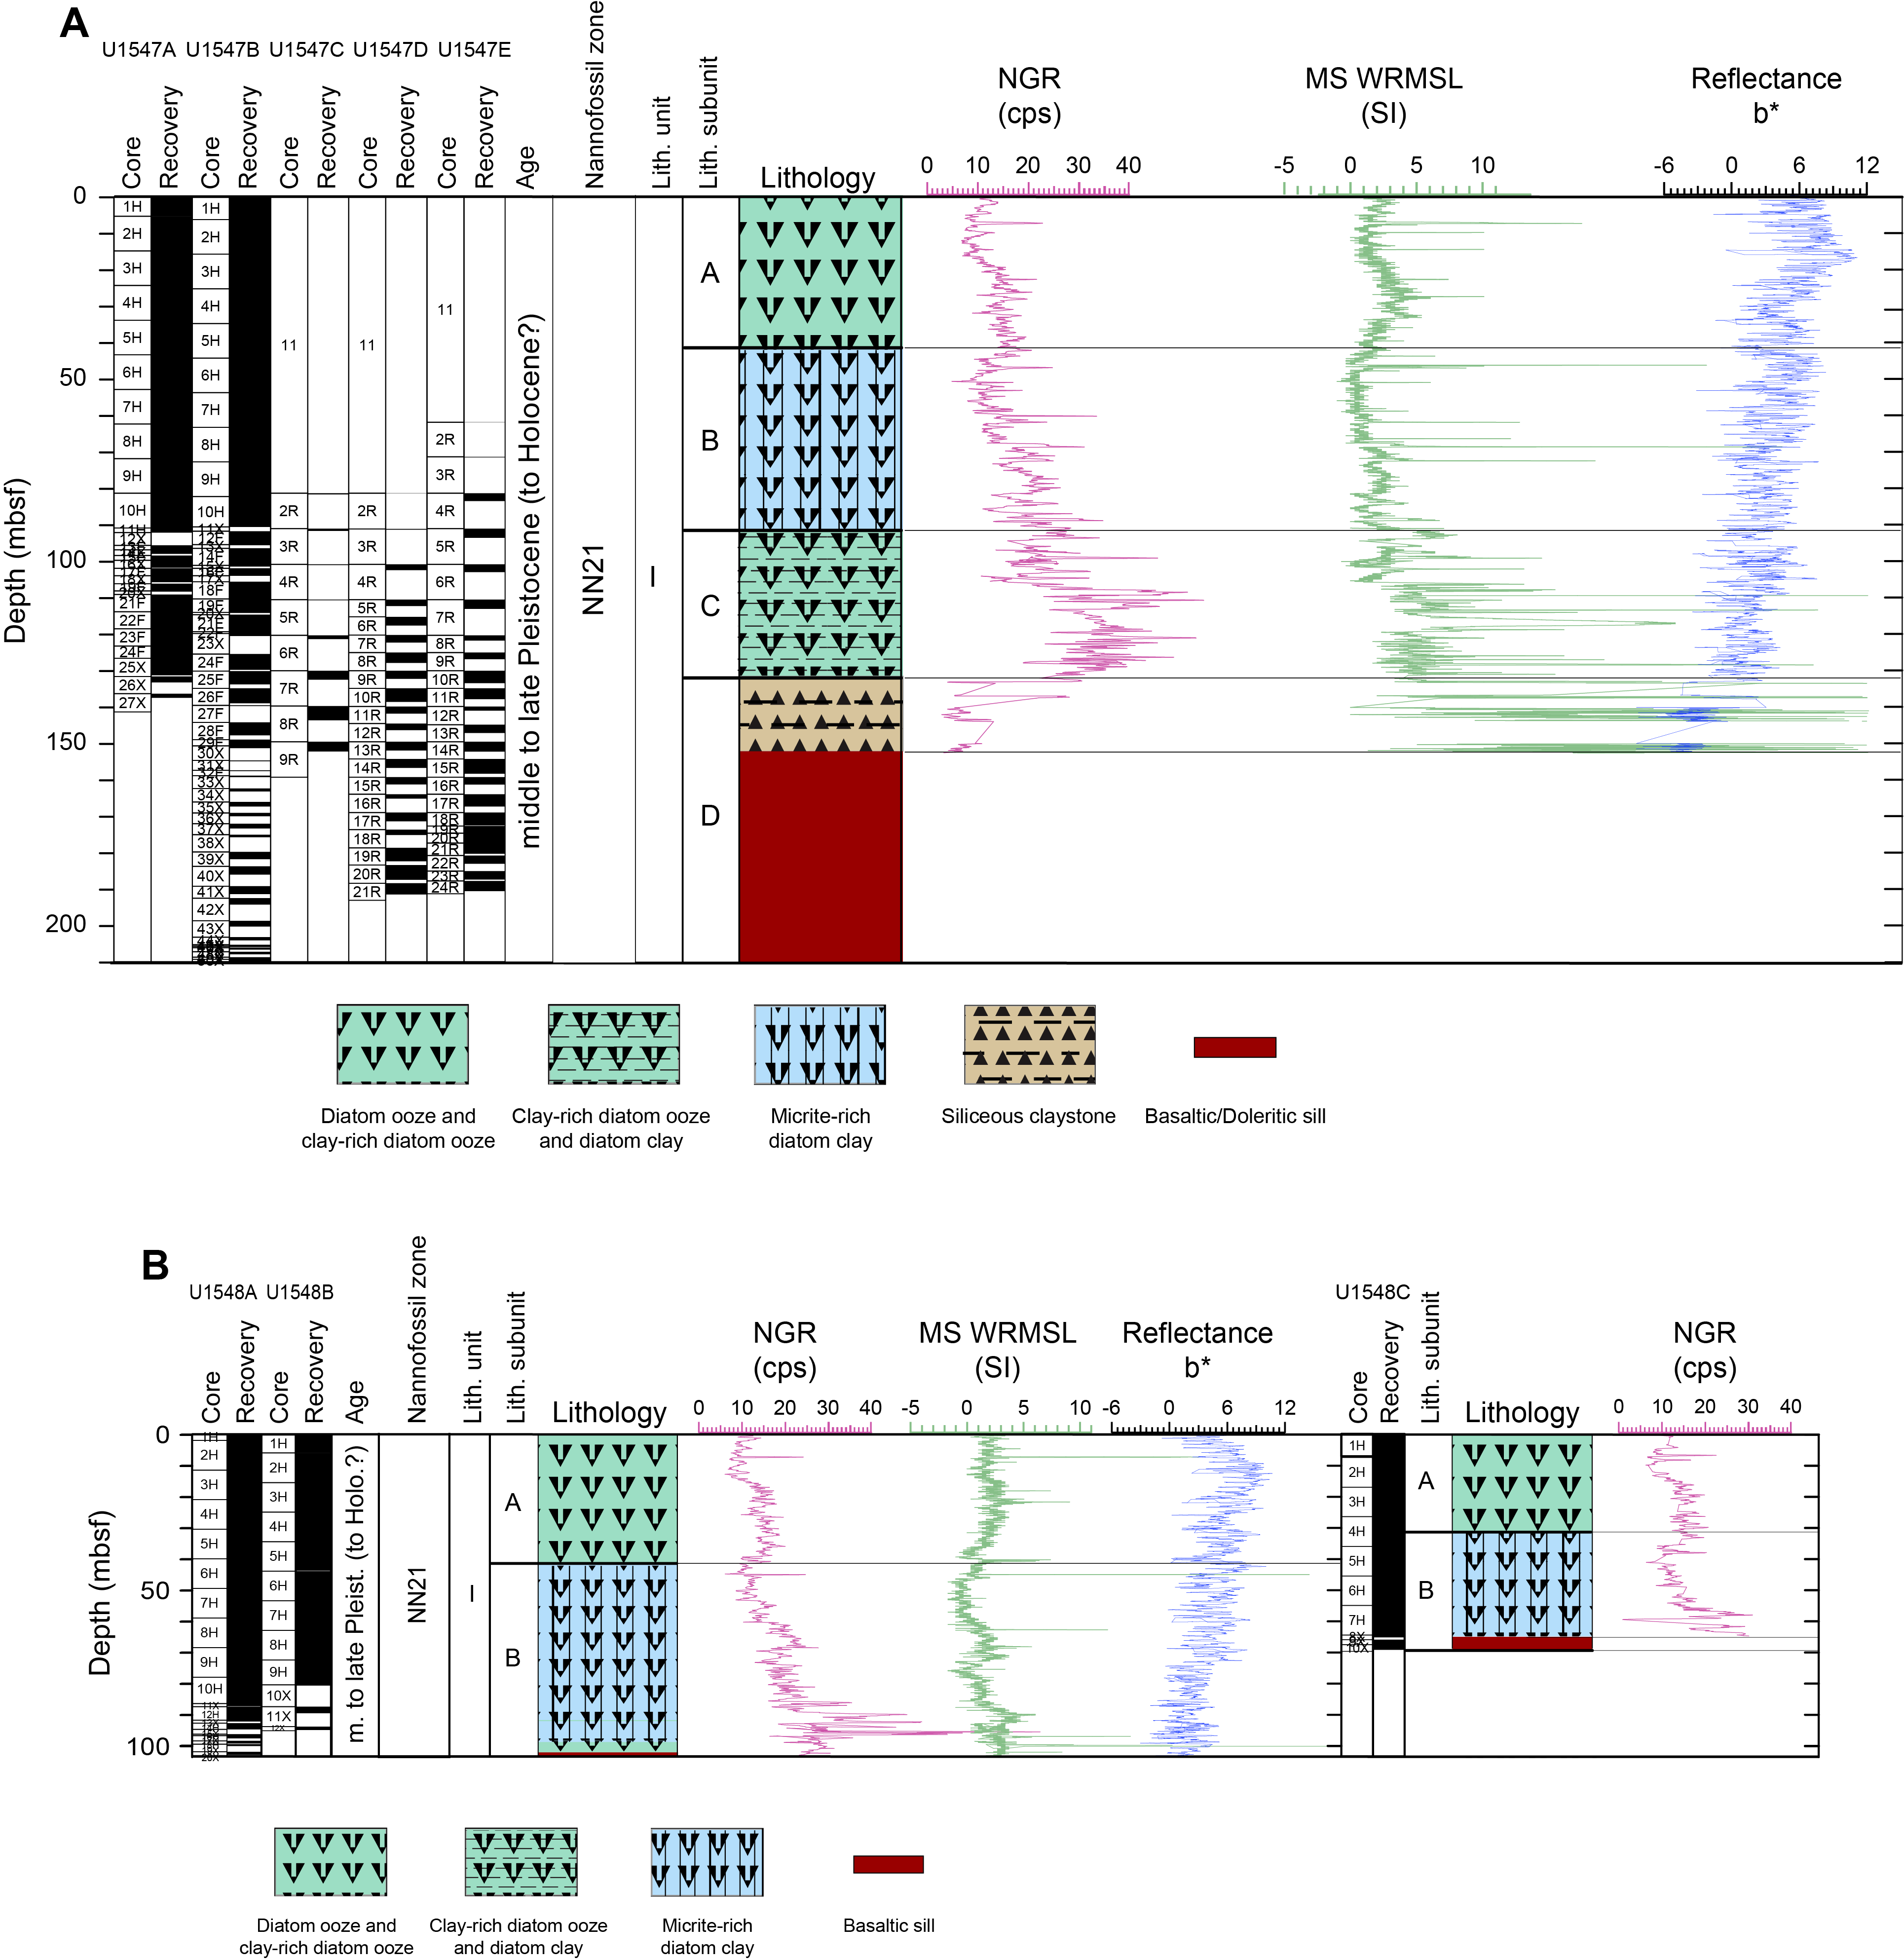
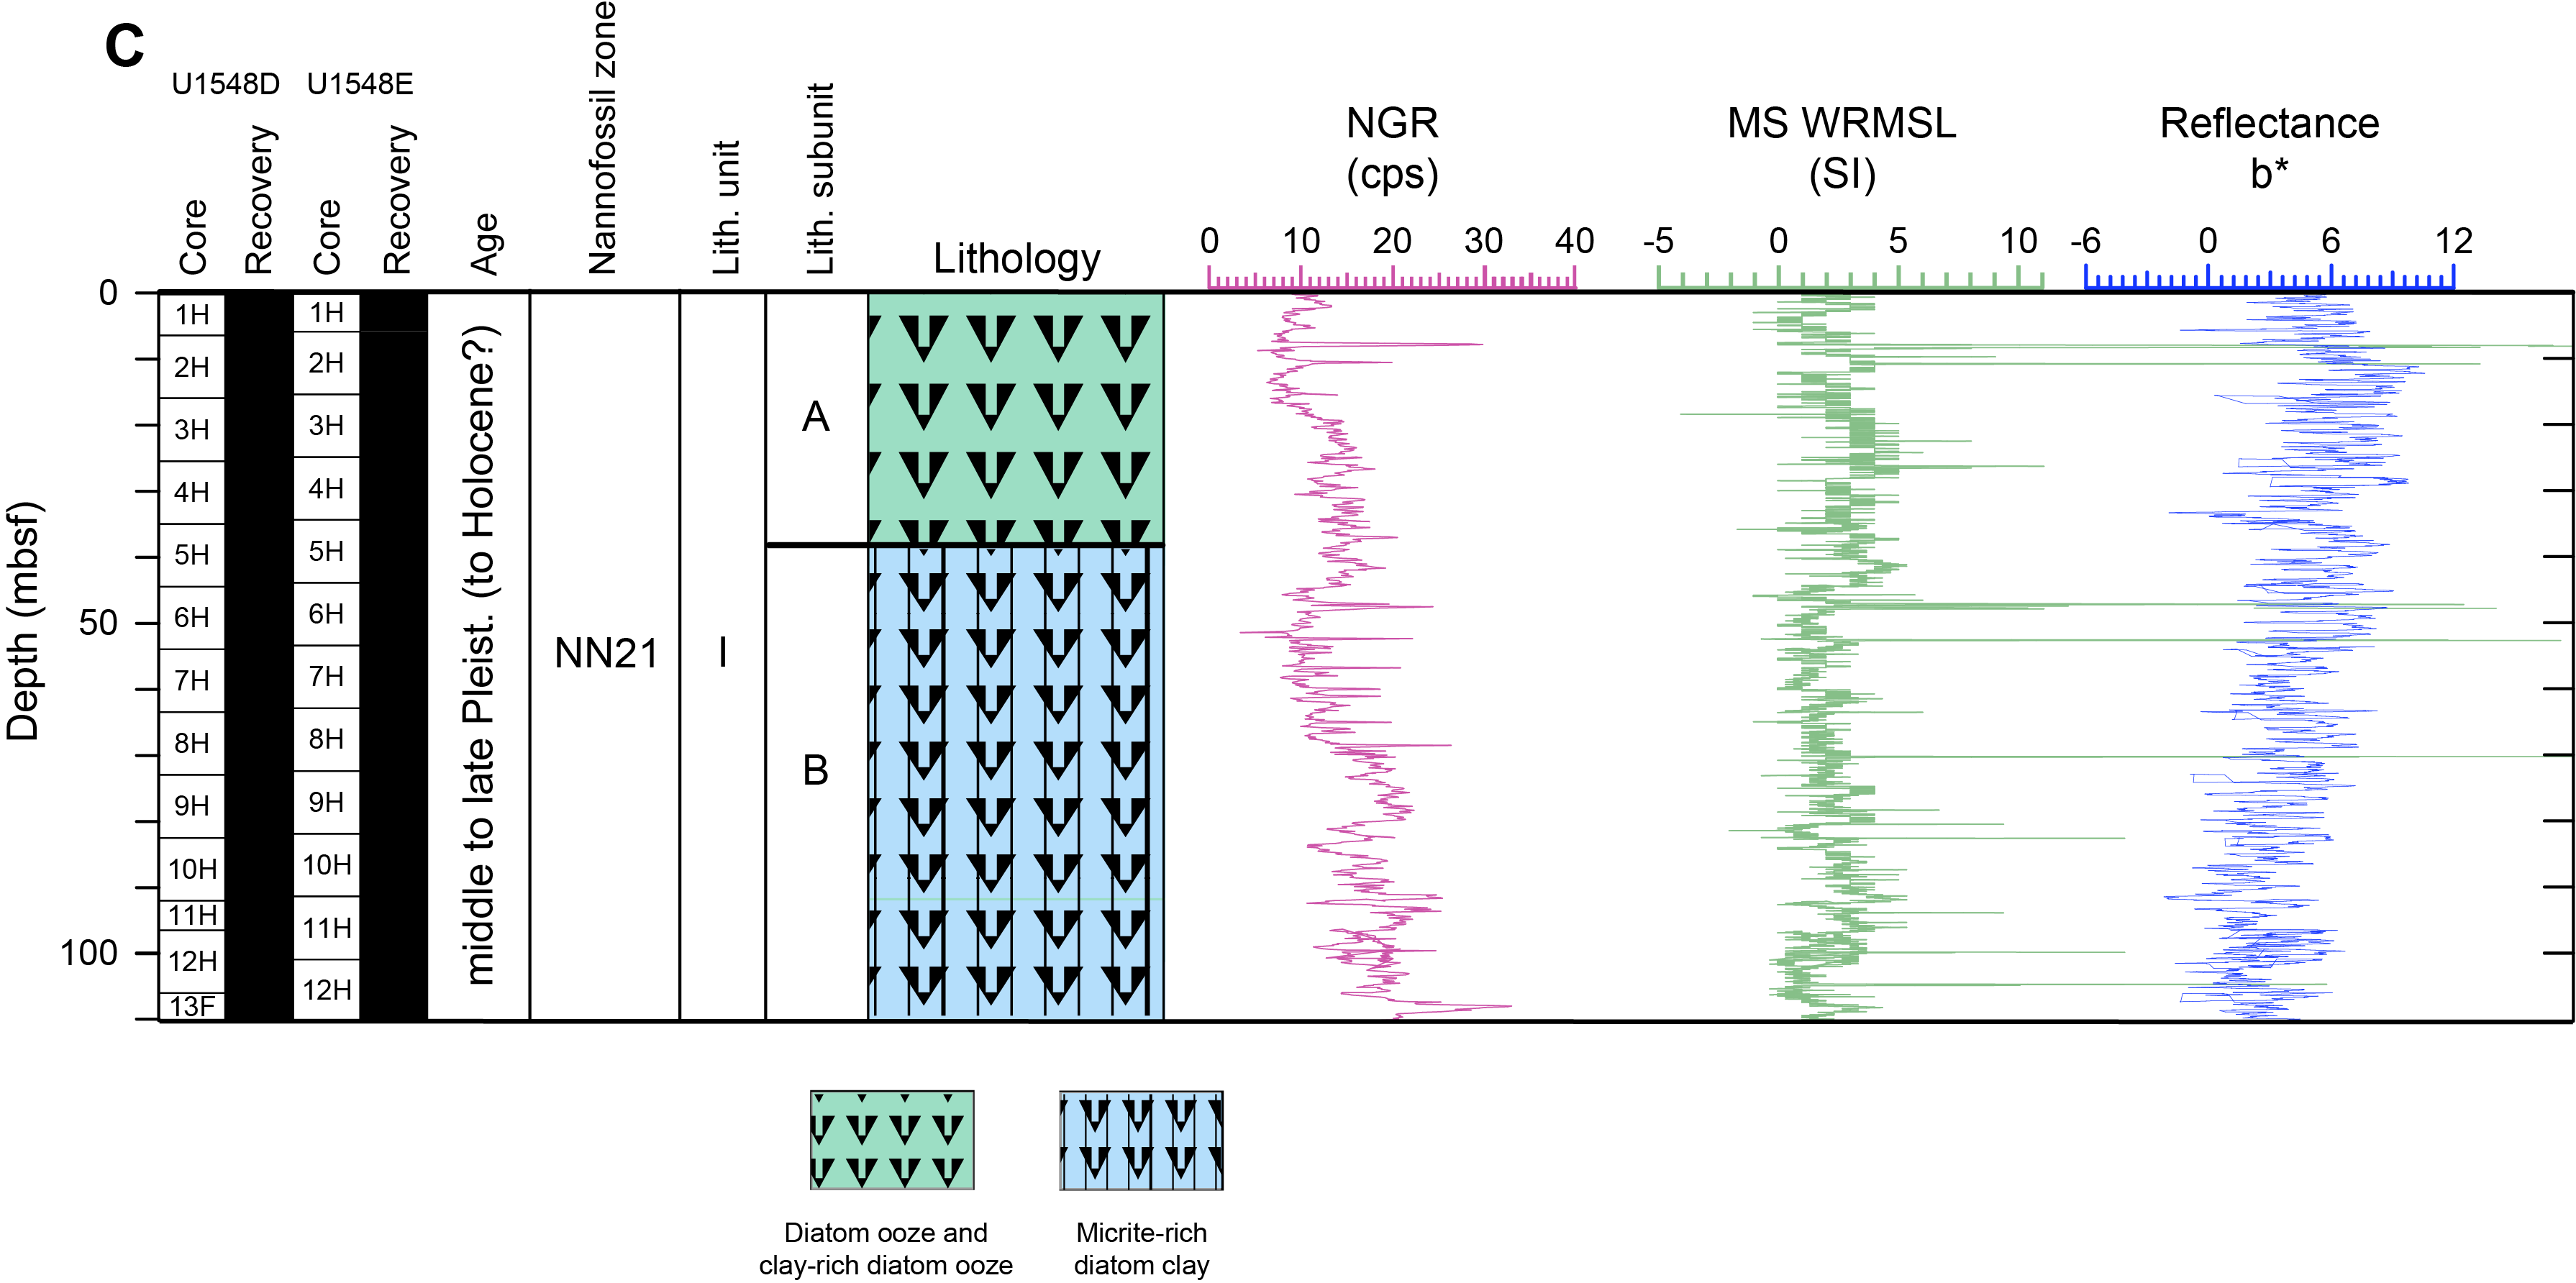
This lithostratigraphic summary characterizes Sites U1547 and U1548, which are located only a few hundred meters from each other (maximum distance between holes = ~800 m). Site U1547 and Holes U1548A–U1548C were drilled inside or adjacent to the Ringvent structure, and Holes U1548D and U1548E were drilled ~600 m west-northwest of Ringvent. The sediments recovered at Sites U1547 and U1548 are middle to late Pleistocene in age and mostly biogenic (mainly diatom ooze), although the proportion of siliciclastic components is more significant compared to Sites U1545 and U1546 in northwest Guaymas Basin (Figures F8, F9, F10). The sequence recovered at Sites U1547 and U1548 shows downhole changes in the lithologic characteristics of the sediment that are related to changes in (1) the abundance ratio between diatom ooze and clay minerals, (2) the abundance of carbonate precipitates, and (3) to a lesser extent, the diagenetic changes of biogenic silica. Downhole changes in lithology at Sites U1547 and U1548 are not significant enough to require division into more than one lithostratigraphic unit but are sufficient to warrant the division of Unit I into four subunits at Site U1547 and three subunits at Site U1548 (Figures F8, F9, F10). The uppermost subunit, Subunit IA, is made up of a similar lithology at both sites, mainly consisting of more or less laminated diatom ooze mixed with different amounts of clay minerals. The boundary between Subunits IA and IB is located at ~40 mbsf in holes at both sites except in Hole U1548C, where it occurs at ~27 mbsf. Subunit IB is mainly composed of varying proportions of diatoms and clay, with the addition of significant (>5%) micrite (euhedral to subhedral, micrometer-sized authigenic carbonate particles). Gray silty beds, often showing erosional bottom contacts, are also frequent, and some of these beds attain thicknesses of up to 1.2 m. The top of Subunit IC (only observed in Hole U1548C) is very thin and coincides with a significant drop in micrite content in the sediment, although limestone/dolostone intervals still persist. The main lithologies are diatom clay and clay-rich diatom ooze. Sandy and silty intervals are also common, and some intervals display evidence of syndepositional deformation. Subunit ID was only recovered at Site U1547, where it is a dusky yellowish brown siliceous claystone. Diatoms are absent, and X-ray diffraction (XRD) mineralogy indicates the onset of silica phase transition from opal-A to opal-CT. Basalt occurs at shallow depths at Sites U1547 (130.5–150 mbsf) and U1548 (90–100 mbsf). However, poor recovery provides only limited observations of contact zones with the adjacent sediment.
1.3.2. Igneous petrology and alteration
Mafic rocks from sill intrusions underlying the Ringvent structure were recovered in Holes U1547A–U1547E within the circular Ringvent mound and in Holes U1548A–U1548C outside the Ringvent mound at its periphery. The sill bodies were encountered at different depths and recovered at varying rates. Intersected sills at Site U1547 are mostly composed of aphyric to clinopyroxene-plagioclase phyric basalt. A ~20 m thick doleritic section recovered from the bottom part of Hole U1547E (to 191 mbsf) includes plagioclase and pyroxene phenocrysts 2–5 mm in size. The basaltic material is slightly to moderately vesicular, whereas doleritic intervals are nonvesicular to slightly vesicular. The subangular to subrounded vesicles range from 1 to 25 mm in diameter. Vesicles are either empty or partially/fully filled with carbonate that is often associated with pyrite (<0.5 mm). Empty vesicles are often coated with secondary bluish gray silicate material. The recovered basalts show variable degrees of alteration. Monomineralic carbonate veins are often surrounded by thin halos of pyrite. Occasionally, the latter also occurs as subordinate vein-filling material. In terms of modal composition, basalts recovered at Site U1548 resemble those from Site U1547, but they are darker in color and usually nonvesicular. Other common features observed in igneous rock cores from Holes U1547A–U1547E and U1548A–U1548C are injected sedimentary veins, contacts between sedimentary breccia and basalt, sediment-magma mingling (peperite facies), and glassy chilled margins. The presence of glassy chilled margins suggests direct contact of the magma with very wet sediment. Chemical data obtained from Site U1547 sill intervals overall reveal a subalkaline, tholeiitic mafic rock chemistry, and a few samples from Holes U1547D and U1547E show a calc-alkaline character. Based on their Ti-V pattern, all rock samples point to an enriched mid-ocean-ridge basalt (MORB) composition.
1.3.3. Structural geology
We made structural observations in all ten holes within (Site U1547) or near (Site U1548) the Ringvent structure. Structural information was sought from sedimentary units in four of the five holes at Site U1547 and all five holes at Site U1548. Hole U1547A was lithologically the most complete hole for examining the sedimentary succession. Bedding and lamination in sediments show no significant folds and few brittle fractures and faults, although in some cases fractures are seen much more easily in the X-ray images than on the cut surfaces of the cores. Additional structural information came from the basaltic rocks in Subunit ID, which were cored in eight of the holes. Holes U1547B, U1547D, and U1547E recovered the most mafic hypabyssal rock. Structural features observed in this igneous rock include preexisting fractures and faults, mineralized veins, glassy margins, sediment-filled veins, and fragments of columnar joints. Where possible, these features were measured for true dip, and they await possible reorientation using shore-based paleomagnetic results. Networks of veins with irregular branching patterns were not measured as planar features. No macroscopic shortening or folding of the veins was evident.
1.3.4. Biostratigraphy
Calcareous nannofossils are abundant to common above 43.51 mbsf at Site U1547 and in Holes U1548A–U1548C. This interval is followed by an alternation between intervals with few or barren occurrences of nannofossils and intervals with abundant/common populations from 43.73 to 151.93 mbsf at both sites. Nannofossil preservation varies from good to poor throughout the entire sedimentary sequence and is generally good and moderate in samples with abundant and common abundances and poor in those with few and barren abundances. In general, marine diatoms are dominant and abundant with good to moderate preservation above 131.21 mbsf in Hole U1547A, above 101.15 mbsf in Hole U1547B, above 81.6 mbsf in Hole U1547C, and above 91.25 mbsf in Hole U1547D. The barren intervals at the bottom of Site U1547 and in Holes U1548A–U1548C might be due to diagenetic alteration. In Hole U1548A, marine diatoms are mostly abundant with moderate preservation above 84.1 mbsf and are abundant to few and poorly preserved in the bottom interval (90.9–99.0 mbsf). In Holes U1548D and U1548E, calcareous nannofossils are common to abundant with moderate and poor preservation in most samples examined, except for those from three sampled depths (31, 92.29, and 101.58 mbsf) in Hole U1548D. Marine diatoms are dominant and abundant with good and moderate preservation throughout Holes U1548D and U1548E. The occurrence of calcareous nannofossil species Emiliania huxleyi to the bottom of all holes dates the entire sediment sequence to (Holocene to) late–middle Pleistocene, or younger than 0.29 Ma (Hole U1547A = 0–137 mbsf, Hole U1547B = 0–151.93 mbsf, Hole U1547C = 0–121.13 mbsf, Hole U1547D = 0–101.33 mbsf, Hole U1548A = 0–99 mbsf, Hole U1548D = 0–110.24 mbsf, and Hole U1548E = 0–91.81 mbsf). This age assignment is consistent with the absence of calcareous nannofossil species Pseudoemiliania lacunosa (last appearance datum [LAD] = 0.44 Ma) and Fragilariopsis reinholdii (LAD = 0.62 Ma) in all examined samples. The estimated average sedimentation rate is >524 m/My (>52.4 cm/ky).
1.3.5. Paleomagnetism
Alternating field (AF) demagnetization up to 20 mT was conducted with the superconducting rock magnetometer (SRM) on all sediment archive-half sections from Holes U1547A, U1548A, and U1548C–U1548E (APC, HLAPC, and XCB cores). The drilling-induced overprint was successfully removed from all cores upon demagnetization. Mean inclination values after demagnetization at 20 mT cluster around 46° at Site U1547 (Hole U1547A) and vary between ~40° and 47° at Site U1548, being comparable to the expected geocentric axial dipole (GAD) inclination at the latitude of the sites (46.2°). A detailed analysis of the remanence of discrete samples from Sites U1547 and U1548 shows that the drilling-induced overprint is removed by 10 mT and the characteristic remanent magnetization (ChRM) is in accordance with the SRM measurements. The natural remanent magnetization (NRM) of archive-half sections decreases at ~30–35 mbsf in Holes U1547A and U1548A and ~65–70 mbsf in Holes U1548D and U1548E. The magnetic mineral assemblage becomes coarser, and low-coercivity minerals, likely (titano)magnetite, are dominant. The anisotropy of magnetic susceptibility (AMS) of sediments in Holes U1547A, U1548A, and U1548C–U1548E shows a mixture of prolate, oblate, and triaxial behavior in the vast majority of sampled depths. The igneous rock archive-half sections from Holes U1547B–U1547E, U1548A, and U1548C were measured for their NRM only because the AF demagnetization protocol was not effective for the igneous sections. All cores from Sites U1547 and U1548 were assigned to the normal Brunhes Chron C1n (younger than 0.78 Ma).
1.3.6. Inorganic geochemistry
A total of 32 interstitial water (IW) samples were collected from the sediment columns in Holes U1547A and U1547B, and 68 were collected from the sedimentary successions in Holes U1548A–U1548E. In addition, 27 and 20 IW samples from sediments in Hole U1547A and Hole U1548A, respectively, were collected using Rhizon samplers. The holes at Sites U1547 and U1548 are divided into three groups: inside (U1547A–U1547E), peripheral to (U1548A–U1548C), and nearby (U1548D and U1548E) Ringvent. Above the encountered sills at Ringvent, the IW profiles show similar trends in all Site U1547 holes and in Holes U1548A–U1548C, with slight differences mainly in sulfate, alkalinity, phosphate, and sulfide concentrations. Alkalinity (~13–18 mM) and ammonia concentration maxima (~4–9 mM) in these holes are consistently the lowest of this expedition, indicating reduced biomineralization in sediments above the Ringvent sill. Abrupt changes were observed for many elements in the contact interval with the sill, suggesting that the sill acts as a source or sink: sulfate sharply decreases to depletion over a few meters coincident with increases in Li+, Ba2+, B, Sr2+, Ca2+, and Na+ and decreases in Mg2+, K+, and H4SiO4. Similar excursions were observed at Sites U1545 and U1546 above the sills. The IW chemical properties are likely influenced by sediment-fluid interaction associated with the sill intrusion and by precipitation/dissolution processes associated with sediment diagenesis, including opal-A dissolution and to a lesser extent combined biogeochemical processes. Northwest of Ringvent, the IW profiles for Holes U1548D and U1548E are different than those for the holes located inside Ringvent. In general, concentrations of alkalinity, ΣH2S, NH4+, and PO43− produced by organic matter mineralization are higher in Holes U1548D and U1548E than in Ringvent Holes U1548A–U1548C. The sulfate–methane transition zone (SMTZ) in Holes U1548D and U1548E is well defined around 76 mbsf by a concave downward decrease in sulfate and a concomitant increase in alkalinity, HS−, NH4+, and PO43−. Compared to the Ringvent holes, the lower concentrations of dissolved H4SiO4 in Holes U1548D and U1548E may reflect less alteration of silicate minerals or diatom tests due to the lower thermal gradient.
1.3.7. Organic geochemistry
At Sites U1547 and U1548, gas and solid-phase samples were sampled and analyzed. For all holes, one headspace gas sample was analyzed per 9.5 m of advancement for routine hydrocarbon safety monitoring. Void spaces were measured on the core receiving platform, and void gases were characterized for their hydrocarbon content. The carbon, nitrogen, and sulfur contents of particulate sediment were characterized, and source rock analysis was performed on selected solid-phase samples. When sampling was focused on microbiology and biogeochemistry objectives, H2 and CO contents were measured and gas and solid-phase materials were sampled for shore-based analyses. Headspace analyses of sediment and rock samples for methane and hydrocarbons yielded high concentrations that increased from the sediment column toward sill interfaces. CH4 concentrations reached a maximum of 125 mM at the sill interface of Hole U1547B and often exceeded 10 mM when small pieces of sill rock were used for headspace incubations during igneous rock recovery. To further examine these results, pieces of rock from whole-round cores were incubated in sealed trilaminated foil barrier bags to examine degassing of hydrocarbons. Methane and higher hydrocarbons were found in high concentrations throughout Sites U1547 and U1548. Concentrations in sill rock depend strongly on rock density and pore space assumptions; with an average density of 2.7 g/mL and 14% pore space, methane concentrations would range approximately from 30 to 140 mM at Site U1547 (Holes U1547B–U1547E) and up to 35 mM at Site U1548 (Holes U1548A–U1548C). Using the same assumptions, hydrogen concentrations in sills would range mostly between 2 and 20 µM with occasionally higher values. Elemental analysis revealed that organic matter at these sites originates primarily from marine sources, although some intervals may be influenced by terrestrial inputs. Source rock analysis indicated that thermal maturity of organic matter varies based on sill proximity. In sediment pore water profiles, H2 and CO show nanomolar concentrations and exhibit varying trends with depth.
1.3.8. Microbiology
The Ringvent sites present an opportunity to investigate the microbial consequences of elevated heat flow and hydrothermal circulation at Guaymas Basin off-axis sites. Previous sequencing studies of shallow piston-cored sediments from Ringvent revealed decreased microbial diversity and remnant populations of past methane seepage (Teske et al., 2019; Ramírez et al., 2020). Sediment cores for microbiological studies were obtained from Holes U1547B, U1548B, and U1548C using the APC and XCB systems. In addition, samples of igneous rock with indications of fluid-rock interaction, such as veins, sediment injections, and vesicularity with amygdules, were taken for microbiological studies from Holes U1547C–U1547E, U1548A, and U1548B. Syringe samples for cell counts, 3-D structural imaging, and RNA analyses were taken on the core receiving platform, preserved or frozen, and stored for further analyses. Whole-round core samples were either stored in a −80°C freezer or temporarily stored in a 4°–8°C cold room and processed further for shore-based analyses, as described for Site U1545. Samples for PFT measurements were taken on the core receiving platform by syringe from eight Hole U1547B cores and four Hole U1548B cores. Cell abundance was 1.0 × 10⁹ cells/cm3 in seafloor sediment within the perimeter of Ringvent (Hole U1547B) and 5.4 × 10⁸ cells/cm3 just outside of Ringvent (Hole U1548B). Cell abundance quickly decreased downhole at both Site U1547 (1.4 × 10⁶ cells/cm3 at approximately 66 mbsf) and Site U1548 (1.3 × 10⁶ cells/cm3 at approximately 57.7 mbsf in Holes U1548A–U1548C). Except for a few localized spikes, cells were not detected in deeper samples. These shallow depth limits for cell detection at Ringvent contrast with considerably deeper cell detection depths at Sites U1545 and U1546.
1.3.9. Petrophysics
Physical properties measured on whole-round and split core sections from Holes U1547A–U1547E and U1548A–U1548E were compared with each other and with downhole logging measurements from Hole U1547B for lithostratigraphic characterization and correlation between core description, logging data, and preexpedition seismic survey profiles. At Sites U1547 and U1548, a total of 31 in situ formation temperature measurements were taken with the APCT-3 and SET2 tools. The resulting geothermal gradient of ~511° to almost 960°C/km and thermal conductivity measurements were used to calculate a heat flow that varies between ~520 and ~930 mW/m2 depending on the vicinity to the Ringvent mound. Conductivity measurements at Site U1548 show values in the sediment layers that are similar to those at Site U1547. Sites U1547 and U1548 show similar profiles for density, porosity, strength, natural gamma radiation (NGR), magnetic susceptibility (MS), and P-wave velocity in the upper 90 m of sediment. Petrophysical variations highlight the main lithostratigraphic changes at Site U1548 through correlated variations in density and NGR values. Mafic sill material recovered from Site U1547 shows thick, continuous intrusion sheets across the transect of its boreholes, and no bottom contact to the underlying sediment was encountered.
2. Background and objectives
Site U1547 (proposed Site GUAYM-12A; 27°30.4560′N, 111°40.6980′W) and Site U1548 (proposed Site GUAYM-03B; 27°30.2460′N, 111°40.8660′W) are located ~27 km northwest of the axial graben of the northern Guaymas Basin spreading segment. Site U1547 lies within a ~800 m diameter, circular mound (Ringvent) that rises ~20 m above the seafloor, and three holes of Site U1548 (Holes U1548A–U1548C) lie just outside Ringvent’s southeastern edge (Figure F1). Seismic profiles across Ringvent show a prominent mound feature at ~0.06 s TWT below the seafloor that is characterized by brightly reflective strata within a central bowl-shaped region (Figure F3). A bright reflector underlying the base of the bowl at ~0.18 s TWT below the seafloor is interpreted to be a sill intrusion, and it is hypothesized that this and previous, similar igneous intrusions provided the heat that formed Ringvent and keeps it active today.
Ringvent is the best-characterized active, sill-associated hydrothermal system at an off-axis site in Guaymas Basin (Teske et al., 2019). The underlying sill is thought to have cooled substantially since its emplacement, but it appears to still sustain hydrothermal circulation and upflow along its margins. Vent fluids of 20°–75°C associated with sulfur-oxidizing microbial mats and sulfur-oxidizing, symbiont-dependent Riftia tube worms occur on the circular mound but not elsewhere. The presence of this hydrothermal fauna suggests channelized flow of hydrothermal fluids with temperatures of at least 75°C that originate at the buried sill, close to the thermal range that has been measured in Deep Sea Drilling Project (DSDP) boreholes such as Hole 481A in the northern spreading center of Guaymas Basin (Shipboard Scientific Party, 1982). A 5 m long piston core from the sedimented area within Ringvent that was recovered prior to Expedition 385 contained buried methane oxidation–derived carbonates near 1 mbsf and hydrothermally precipitated silicates near 2.5 mbsf, but pore water signatures showed a strong seawater influence (Teske et al., 2019). Thus, sedimented areas within Ringvent may currently function as a recharge zone for hydrothermal circulation, in which case Site U1547 will sample sediments within that setting. Site U1548, just outside of Ringvent, may be largely within the influence of the fluids discharging outward toward the ring itself. Gradients defined by Site U1547 and U1548 holes at different distances from the ring structure may constrain the hydrothermal circulation pattern and reveal correspondingly different degrees of hydrothermal influence.
The sill at Ringvent is the shallowest studied during Expedition 385 and as such represents a shallow-emplacement end-member for sill intrusion into dominantly biogenic, organic-rich sediments. The primary objectives for Sites U1547 and U1548 are thus to characterize the physical, chemical, and biological processes driven and affected by this end-member type of sill/sediment system, including physical sill-sediment interactions upon intrusion. These include chemical alteration of both the sediment and the igneous rock, mineral dissolution and precipitation in the surrounding sediments through time, carbon mobilization and capture, the implications of these processes for microbial life, and the interconnection of all these processes.
The still active hydrothermal state of the Ringvent structure provides a particular opportunity to study microbial life. With increasing depth, the sedimentary microbial community could show the impact of sill emplacement and hydrothermal heat that limit the survival of sedimentary microbes with increasing proximity to the sill, whereas hydrothermal carbon mobilization, including thermal release of low-molecular weight organic acids (Martens, 1990; Wellsbury et al., 1997), and the availability of hydrothermally generated carbon and energy sources are likely to select for distinct microbiota that are characteristic for vent and seep sites.
A new pair of holes, Holes U1548D and U1548E, were added to Site U1548 during the expedition. These holes, at ~810 and ~970 m from Hole U1548B, respectively, were designed to characterize an abrupt lateral transition in the seismic expression of a particular stratal unit observed between ~2.39 and ~2.42 s TWT. This abrupt change in character is observed in seismic profiles throughout the northwestern portion of the northern Guaymas Basin spreading segment, typically in proximity to interpreted sills. We hypothesize that the transition is related to a diagenetic change that is related in some way to pore water chemistry impacted by igneous material, perhaps as a consequence of silicate weathering, and that these transformations may play a role in chemical budgets. The joint objective of Holes U1548D and U1548E is to characterize the geochemical signature of this lateral change in seismic character.
3. Operations
3.1. Site U1547
Five holes were drilled at Site U1547 along a seismic transect. The original plan was for two holes to be APC cored with orientation to 150 mbsf and then XCB cored to 200 mbsf or a seismically imaged sill intrusion. The second hole would also be logged with the triple combo and FMS-sonic downhole tool strings. Hole U1547A would be dedicated to pore water and solid-phase geochemistry as well as lithologic, mineralogic, structural, and micropaleontological analyses, and Hole U1547B would be subject to microbial sampling. Actual operations significantly differed from the plan. Hole U1547A was subjected to lithologic description and sampling. Microbiological sampling was performed on sediment cores from Hole U1547B and occasionally on igneous cores recovered from Holes U1547C–U1547E. We intersected sill intrusions in all holes at Site U1547. Hole U1547A was APC/HLAPC/XCB cored to 141.3 mbsf. Upon terminating coring in Hole U1547A, the 600 mL Kuster FTS was deployed to sample borehole fluid. Hole U1547B was APC/HLAPC/XCB cored to 209.8 mbsf, followed by borehole fluid sampling through Kuster FTS deployment at two different depths and downhole wireline logging with the triple combo tool string. Hole U1547C was drilled without core recovery to 81.3 mbsf and subsequently cored to 159.2 mbsf using the RCB system. Holes U1547D and U1547E were drilled to 81.3 and 61.8 mbsf, respectively, without core recovery. Subsequently, both holes were RCB cored to 193.0 and 191.2 mbsf, respectively. Upon completion of coring in Hole U1547D, we deployed the ETBS to take a temperature measurement at the bottom of the hole. A total of 235.0 h, or 9.8 days, were spent at Site U1547.
3.1.1. Hole U1547A
After a 2 h transit from Site U1546, we arrived at the Site U1547 coordinates, lowered the thrusters, and switched to dynamic positioning (DP) mode at 2047 h on 14 October 2019. We then made up the APC bottom-hole assembly (BHA) and lowered the drill string to the seafloor. After the drill string reached 1700.9 meters below sea level (mbsl) at 0300 h on 15 October, we deployed the subsea camera to conduct a survey of the seafloor at this site, which is in a hydrothermally active area about 30 km northwest of the northern axial graben of Guaymas Basin. The seafloor survey did not find any vent communities. At 0530 h, we picked up the top drive and positioned the drill string above the seafloor to start APC coring. We spudded Hole U1547A at 0835 h on 15 October. Mudline Core 385-U1547A-1H recovered 5.4 m and established a seafloor depth of 1733.7 mbsl. Cores 1H–27X penetrated from the seafloor to 141.3 mbsf and recovered 145.3 m (103%) (Table T1). To improve core quality, the HLAPC coring tool was deployed after encountering a partial stroke on Core 11H. Deeper in the hole, we deployed the XCB system to break through hard carbonate layers on Cores 12X, 14X, 16X, 18X, and 20X and then used it continuously from Core 25X downhole. We penetrated two thin sill intervals in Cores 26X (top contact at ~132.8 mbsf; drilled thickness = ~3.9 m) and 27X (top contact at 137.0 mbsf; drilled thickness = ~0.1 m). Nonmagnetic core barrels were used for all APC and HLAPC cores, and orientation measurements were taken on all APC cores using the Icefield MI-5 core orientation tool. We made formation temperature measurements with the APCT-3 tool on Cores 4H, 6H, 8H, and 10H and the SET2 tool following Cores 16X and 23F. While coring and recovering Core 27X, hole conditions deteriorated and continued to worsen below 136.3 mbsf; as a result, we decided to terminate coring at 1200 h on 16 October with the hole deepened to a final depth of 141.3 mbsf. We then raised the drill string ~10 m and deployed the Kuster FTS to recover borehole fluid from 131.3 mbsf. We retrieved the tool at 1330 h and sampled 600 mL of fluid. We then started pulling the drill string out of the hole, and the bit cleared the seafloor at 1425 h on 16 October, ending Hole U1547A. A total of 41.8 h, or 1.7 days, were spent on Hole U1547A.
3.1.2. Hole U1547B
After offsetting the vessel 100 m southwest, we positioned the bit at 1728.9 mbsl and spudded Hole U1547B at 1545 h on 16 October 2019. Mudline Core 385-U1547B-1H recovered 6.3 m and determined a seafloor depth of 1732.2 mbsl. Cores 1H–50X penetrated from the seafloor to 209.8 mbsf and recovered 161.3 m (77%) (Table T1). Upon refusal of the APC system, we switched to the HLAPC system after Core 10H at 90.5 mbsf. Nonmagnetic core barrels were used for all APC and HLAPC cores, and orientation measurements were taken on all APC cores using the Icefield orientation tool. While coring with the HLAPC system, we had to deploy the XCB system to penetrate hard carbonate layers at several depths (Cores 11X, 13X, 15X, 17X, 20X, 23X, 30X, and 31X). We permanently switched to XCB coring after Core 32F indicated refusal at 158.8 mbsf. Core 23X penetrated an upper, thin sill interval from ~120 to ~125 mbsf of which we recovered only ~0.6 m. On Core 30X, we intersected a lower, massive sill intrusion (top contact at ~150.6 mbsf) that was drilled through the bottom of the hole. We made formation temperature measurements with the APCT-3 tool on Cores 4H, 6H, 8H, 10H, and 12F and the SET2 tool following Cores 20X and 26F. We pumped PFTs downhole on Cores 1H–32F to monitor drilling fluid (seawater) contamination. On Cores 1H–7H, the pacing of coring was adjusted to accommodate the complex microbiology and biogeochemistry sampling on the core receiving platform (one core recovered every ~75 min). We pumped 20 bbl (3179.8 L) of high-viscosity mud after every core for hole cleaning starting with Core 33X. On 18 October, a request to extend the total depth of Hole U1547B from 200 to 240 mbsf was approved by the International Ocean Discovery Program (IODP) Environmental Protection and Safety Panel (EPSP). At 1200 h on 19 October, we terminated coring at a final depth of 209.8 mbsf due to the slow advancement and hole stability issues encountered at the bottom of the hole. We picked up the top drive and raised the drill string to 103.7 mbsf. We then deployed the Kuster FTS to successfully recover two borehole fluid samples from 109.7 and 135.7 mbsf. In preparation for downhole wireline logging, we raised the end of the drill string to 69.7 mbsf, and the rig floor was prepared for deploying the triple combo logging tool string. At 1700 h on 19 October, we started to rig up a modified triple combo tool string. The Magnetic Susceptibility Sonde (MSS) was removed from the string to shorten it, enabling more hole coverage by the other tools. It was made up of the following tools:
- High-Resolution Laterolog Array (HRLA),
- Hostile Environment Litho-Density Sonde (HLDS) (with source),
- Hostile Environment Natural Gamma Ray Sonde (HNGS),
- Enhanced Digital Telemetry Cartridge (EDTC), and
- Logging equipment head-mud temperature (LEH-MT).
At 1800 h, we lowered the tool string into the hole until we encountered a ledge at 168.7 mbsf. After a short calibration pass, we implemented a full logging pass to the seafloor that ended at 1945 h. The triple combo tool string returned to the rig floor at 2045 h, and its tools were rigged down by 2145 h. The intended deployment of the FMS-sonic tool string was canceled because of deteriorating hole conditions. We pulled the drill string out of the hole, and the bit cleared the seafloor at 2205 h on 19 October, ending Hole U1547B. We then deployed the subsea camera to observe the seafloor while moving ~500 m southwest to the coordinates of Site U1548. We spent a total of 79.7 h, or 3.3 days, on Hole U1547B.
3.1.3. Hole U1547C
Upon completing Holes U1548A and U1548B, the vessel moved back to Site U1547 and arrived at the coordinates of Hole U1547C at 1806 h on 21 October 2019. We made up the RCB BHA and started lowering the drill string to the seafloor in preparation for spudding Hole U1547C. Upon reaching 1706.9 mbsl, we picked up the top drive and dropped the center bit, and the end of the drill string tagged the seafloor at 1732.2 mbsl. We then spudded Hole U1547C at 0300 h on 22 October and drilled without core recovery from the seafloor to 81.3 mbsf. Upon retrieving the center bit, we began RCB coring at 0545 h. Cores 385-U1547C-2R through 9R penetrated from 81.3 to 159.2 mbsf and recovered 9.0 m (12%) (Table T1). We intersected the upper sill contact on Core 7R at ~130.1 mbsf and drilled sill material throughout the remainder of the hole. Nonmagnetic core barrels were used on all cores. No temperature measurements were taken in the hole. We pumped PFTs for drilling fluid (seawater) contamination monitoring on Cores 3R–9R. Hole problems led to strong overpull force from 139.7 to 149.5 mbsf. While recovering Core 9R, we determined that our coring location should be shifted southwest of Hole U1547B. We thus terminated coring in Hole U1547C at 1830 h at a final depth of 149.5 mbsf. We pulled the drill string out the hole, and the bit cleared the seafloor at 1927 h on 22 October, ending Hole U1547C. A total of 23.5 h, or almost 1.0 days, were spent on Hole U1547C.
3.1.4. Hole U1547D
We offset the vessel to the coordinates for Hole U1547D along a northeast–southwest transect approaching the southwestern rim of the Ringvent structure (Figure F2). At 1945 h on 22 October 2019, we dropped the center bit and positioned the drill string above the seafloor. A tagged seafloor depth of 1732.2 mbsl was determined. We spudded Hole U1547D at 2005 h and drilled without core recovery from the seafloor to 81.3 mbsf. After retrieving the center bit, we began RCB coring at 2130 h on 22 October. Cores 2R–21R penetrated from 81.3 to 193.0 mbsf and recovered 34.0 m (30%) (Table T1). We intersected the upper sill contact on Core 4R at ~101.4 mbsf and drilled sill material throughout the remainder of the hole. Nonmagnetic core barrels were used on all cores. We pumped PFTs for drilling fluid (seawater) contamination monitoring on all cores. Upon accomplishing the microbiology sampling objectives for Hole U1547D, we terminated coring operations at a final depth of 193.0 mbsf. At 0815 h on 24 October, we deployed the ETBS to measure the postdrilling temperature at the bottom of the hole. We retrieved the ETBS at 0945 h and pulled the drill string out of the hole. The bit cleared the seafloor at 1130 h and the rotary table at 1445 h on 24 October, ending Hole U1547D. We spent a total of 43.7 h, or 1.8 days, on Hole U1547D.
Prior to leaving the Ringvent area, the vessel performed a precision depth recorder (PDR) survey of the area running along the seismic transect from southwest to northeast (from Hole U1548A to Hole U1547A), beginning at 1528 h and ending at 1554 h on 24 October. The vessel then began the transit to Site U1549.
3.1.5. Hole U1547E
Following completion of Site U1551 coring operations, we returned to Site U1547 11 days after we ended Hole U1547D to establish another hole even closer to the circular Ringvent mound to get further insights into the local sill architecture and recover an additional set of samples for microbiology research. At 0115 h on 4 November 2019, we completed our transit to Site U1547 and arrived at the site coordinates. We lowered the thrusters and switched to DP mode at 0137 h to start operations in Hole U1547E (77 m southwest of Hole U1547D) (Figure F2). We made up the RCB BHA and started lowering the drill string to the seafloor. At 0645 h, we picked up the top drive and dropped the center bit, and the end of the drill string tagged the seafloor at 1732.1 mbsl. We spudded Hole U1547E at 0800 h and drilled ahead without core recovery to 61.8 mbsf. At 0915 h on 4 November, we retrieved the center bit and started RCB coring. Cores 2R–24R penetrated from 61.8 to 191.2 mbsf and recovered 44.9 m (35%) (Table T1). We intersected the upper sill contact on Core 4R at ~81.5 mbsf and did not reach the bottom of the sill when drilling was terminated. Core 24R penetrated from 187.7 to 191.2 mbsf by 0900 h on 6 November. In view of the remaining science objectives of the expedition, we decided to stop coring in Hole U1547E after retrieving Core 24R. We then started pulling the drill string out of the hole, and the bit cleared the seafloor at 1045 h on 6 November. While we continued to raise the drill string to the surface, the vessel moved to Site U1548. At 1440 h on 6 November, the bit arrived at the rig floor, ending Hole U1547E and Site U1547. The total time spent on Hole U1547E amounted to 46.3 h, or 1.9 days.
3.2. Site U1548
Site U1548 consists of five holes. Three holes (U1548A–U1548C) were drilled along a seismic transect that forms a southwest prolongation of Holes U1547A–U1547E at the outside edge of Ringvent, and the other two holes (U1548D and U1548E) were established ~600 m northwest of Ringvent (Figure F2). The original plan was for two holes at Site U1548: Hole U1548A would be cored using the APC/XCB systems to 200 mbsf. Hole U1548B would be APC cored with orientation to 150 mbsf. Upon APC refusal, both holes would be XCB cored to 200 mbsf or a seismically imaged sill intrusion. The second hole would be logged with the triple combo and FMS-sonic downhole tool strings. Hole U1548A would be dedicated to pore water and solid-phase geochemistry as well as lithologic, mineralogic, structural, and micropaleontological analyses, and Hole U1548B would be subject to microbiology and biogeochemistry sampling. Actual operations proved significantly different from the plan, with operations split between drilling at (Holes U1548A–U1548C; original drilling target area) and near Ringvent (Holes U1548D and U1548E; added during the expedition upon EPSP approval). We intersected sill intrusions in Holes U1548A–U1548C. This occurred at a much shallower depth than expected (around and shallower than 100 mbsf). Additionally, target depths in Holes U1548D and U1548E were only 110 mbsf. Thus, logging in any of these shallow holes at Site U1548 was not regarded as beneficial. Hole U1548A was subjected to lithologic description and sampling. Microbiological sampling was performed on sediment cores from Holes U1548B. Igneous material from Holes U1548A and U1548B was occasionally sampled for microbiology research as well. Holes U1548D and U1548E focused on lithostratigraphic, mineralogic, and geochemical analyses. Holes U1548A, U1548B, and U1548C were APC/XCB cored to 103.4, 95.1, and 69.8 mbsf, respectively. Hole U1548D was APC/HLAPC cored to 110.0 mbsf. Hole U1548E was APC cored to 110.0 mbsf. Upon terminating coring in Hole U1548B, the 600 mL Kuster FTS was deployed. A total of 94.6 h, or 3.9 days, were spent at Site U1548.
3.2.1. Hole U1548A
We deployed the subsea camera to observe the seafloor while moving ~500 m southwest from Hole U1547B to the coordinates of Site U1548. The vessel was positioned over the location of Hole U1548A at 2359 h on 19 October 2019 and a PDR reading gave a seafloor depth of 1734.3 mbsl. The seafloor camera survey did not find any vent communities at the location of Site U1548. We retrieved and secured the subsea camera by 0230 h on 20 October. We then picked up the top drive, positioned the bit above the seafloor, and spudded Hole U1548A at 0350 h. Mudline Core 385-U1548A-1H recovered 1.9 m and established a seafloor depth of 1739.9 mbsl. Cores 1H–20X penetrated from the seafloor to 103.4 mbsf and recovered 114.0 m (110%) (Table T2). While coring with the APC system, we had to deploy the XCB system to penetrate hard layers at several depths (Cores 11X, 13X, 15X, and 17X). After recovering Core 18H at 99.4 mbsf, we switched to XCB coring permanently. We intersected the upper contact of a sill at the top of Core 19X (~99.4 mbsf) and drilled sill material throughout the remainder of the hole. Nonmagnetic core barrels were used on all cores, and orientation measurements were taken on all APC cores using the Icefield orientation tool. APCT-3 temperature measurements were taken on Cores 4H, 6H, 8H, and 10H. We terminated coring upon recovering Core 20X because of slow penetration rates. We then pulled the drill string out of the hole, and the bit cleared the seafloor at 2140 h on 20 October, ending Hole U1548A. A total of 21.7 h, or 0.9 days, were spent on Hole U1548A.
3.2.2. Hole U1548B
We moved the vessel 20 m northeast and arrived at the coordinates of Hole U1548B at 2200 h on 20 October 2019. We positioned the bit above the seafloor to start APC coring and spudded Hole U1548B at 2215 h. Mudline Core 385-U1548B-1H recovered 5.9 m and determined a seafloor depth of 1738.9 mbsl. Cores 1H–12X penetrated from the seafloor to 95.1 mbsf and recovered 87.7 m (92%) (Table T2). Upon encountering a partial stroke of 8 m on Core 9H, we switched from the APC to the XCB coring system on Core 10X at 80.4 mbsf. We then continued coring until slow penetration rates marked XCB refusal at a final depth of 95.1 mbsf. We made contact with a sill at the top of Core 11X (~89.2 mbsf) and drilled sill material throughout the remainder of the hole. Nonmagnetic core barrels were used, and orientation measurements were taken on all APC cores deploying the Icefield orientation tool. We deployed PFTs for drilling fluid (seawater) contamination monitoring on all cores to aid microbiology sampling. The APCT-3 tool was deployed on Cores 4H and 6H. Two temperature measurements were taken with the SET2 temperature probe following Cores 7H and 8H, and each measurement was preceded by a 20 bbl (3179.8 L) mud sweep for hole cleaning. At 1345 h on 21 October, we raised the end of the drill string to 58 mbsf and rigged up the Kuster FTS. Upon lowering the bit to 70 mbsf, we deployed the Kuster FTS and recovered a borehole fluid sample from the same depth. We then pulled the drill string out of the hole, and the bit cleared the seafloor at 1622 h and the rotary table at 2000 h on 21 October, ending Hole U1548B. The vessel was repositioned back to Site U1547 in DP mode while the drill string was being recovered. A total of 22.3 h, or 0.9 days, were spent on Hole U1548B.
3.2.3. Hole U1548C
While we continued to raise the drill string to the surface upon completing our operations in Hole U1547E, the vessel moved back to Site U1548 on 6 November 2019, 15 days after completion of Hole U1548B. The goal was to recover another set of microbiology samples from the hydrothermally influenced sediments associated with the Ringvent structure. We then made up an APC/XCB BHA and started lowering the drill string to the seafloor. At 2100 h, we pulled the upper guide horn and deployed the subsea camera to conduct a survey of the seafloor at the intended location of Hole U1548C. At 2223 h, we moved the vessel to new hole coordinates 5 m southwest from the original coordinates to avoid a clam bed. By the end of the day, the subsea camera was retrieved and the drill string was positioned above the seafloor to start coring with the APC system. We spudded Hole U1548C at 0055 h on 7 November. Mudline Core 385-U1548C-1H recovered 7.6 m and established a seafloor depth of 1737.0 mbsl. Cores 1H–10X penetrated from the seafloor to a final depth of 69.8 mbsf and recovered 71.0 m (102%) (Table T2). Nonmagnetic core barrels were used, and orientation measurements were taken on all APC cores deploying the Icefield orientation tool. We made formation temperature measurements on Core 4H with the APCT-3 tool and following Cores 5H, 6H, and 7H with the SET2 tool. The third deployment of the SET2 tool bent the tip of the tool upon encountering a hard formation at ~65 mbsf. We then switched to the XCB system on Core 8X, which recovered a sediment/sill contact from ~64.6 mbsf. Upon recovering Core 10X, we terminated coring in the sill in Hole U1548C because our microbiology sampling and target depth objectives were accomplished. We started pulling the drill string out of the hole, and the bit cleared the seafloor at 1610 h on 7 November, ending Hole U1548C. A total of 25.4 h, or 1.1 days, were spent on Hole U1548C.
3.2.4. Hole U1548D
After offsetting the vessel to the coordinates of Hole U1548D, we positioned the bit above the seafloor to start APC coring. We spudded Hole U1548D at 1902 h on 7 November 2019. Mudline Core 385-U1548D-1H recovered 6.4 m and determined a seafloor depth of 1729.3 mbsl. Cores 1H–13F penetrated from the seafloor to 110.0 mbsf and recovered 120.5 m (110%) (Table T2). Nonmagnetic core barrels were used, and orientation measurements were taken on all APC cores deploying the Icefield orientation tool. We made a formation temperature measurement with the APCT-3 tool on Cores 4H, 8H, and 12H. We deployed the HLAPC system on Core 13F. After recovering this core that reached the target depth, we terminated coring in Hole U1548D. The drill string was pulled out of the hole, and the bit cleared the seafloor at 0450 h on 8 November 2019, ending Hole U1548D. The total time spent on Hole U1548D amounted to 12.7 h, or 0.5 days.
3.2.5. Hole U1548E
We then offset the vessel to the Hole U1548E coordinates while cutting and reheading the core line. The bit was positioned above the seafloor, and Hole U1548E was spudded at 0655 h on 8 November 2019. Mudline Core 385-U1548E-1H recovered 5.7 m and established a seafloor depth of 1729.9 mbsl. Cores 1H–12H penetrated from the seafloor to a final depth of 110.0 mbsf and recovered 115.2 m (105%) (Table T2). Nonmagnetic core barrels were deployed, and orientation measurements were made on all APC cores using the Icefield orientation tool. The APCT-3 tool was deployed to make formation temperature measurements on Cores 4H, 7H, and 10H. Coring was terminated upon reaching the target depth of 110 mbsf. We pulled the drill string out of the hole, and the bit cleared the seafloor at 1705 h on 8 November 2019. We began to move the vessel in DP mode to Site U1552 at 1715 h on 8 November, ending Hole U1548E and Site U1548. The total time spent on Hole U1548E amounted to 12.5 h, or 0.5 days.
4. Lithostratigraphy
This section reports lithostratigraphic descriptions for Ringvent Sites U1547 and U1548, which are located only a few hundred meters from each other (maximum distance of ~500 m between Site U1547 holes and Holes U1548A–U1548C). Although there are many lithostratigraphic similarities between the two sites, especially within the middle to upper part of the recovered sequences, there are also important differences (see Discussion).
For both Sites U1547 and U1548, lithostratigraphic descriptions and analyses were carried out based on the curated length of the cores (core depth below seafloor, Method A [CSF-A]); all references to depths in the text, figures, and tables are expressed as CSF-A and use mbsf as the unit. As seen at other sites drilled during Expedition 385, the quality and quantity of recovered core in any hole was partly a function of the lithologies encountered and the coring systems used: APC, HLAPC, XCB, and RCB (core designations H, F, X, and R, respectively).
Five holes were drilled at Site U1547. Hole U1547A was drilled to a bottom depth of 141.3 mbsf and a total curated core depth of 137.5 mbsf. The deepest hole, Hole U1547B, penetrated 209.8 mbsf to a total curated core depth of 209.94 mbsf. Holes U1547C and U1547D penetrated 159.2 and 193 mbsf to total curated core depths of 152.16 and 191.38 mbsf, respectively. Hole U1547E penetrated to 191.2 mbsf and a total curated core depth of 191.24 mbsf. Five holes were drilled at Site U1548. The deepest one, Hole U1548A, penetrated 103.4 m to a total curated core depth of 103.04 mbsf. Hole U1548B was drilled to 95.1 mbsf and a total curated core depth of 94.8 mbsf. Hole U1548C was drilled to 69.8 mbsf and a curated depth of 69.55 mbsf (Figure F4). Holes U1548D and U1548E were drilled about ~800 m northwest of Hole U1548A, and both penetrated to 110 mbsf. Their total curated depths are 110.29 and 110.86 mbsf, respectively.
The lithologic determinations and interpretations made on cores from these two sites were based on a combination of visual core description, examination of smear slides and thin sections with a petrographic microscope, mineralogic analysis by XRD, and carbonate analyses. The interpretation was also aided by analysis of measured physical properties such as MS, NGR, and color reflectance (see Lithostratigraphy and Petrophysics in the Expedition 385 methods chapter [Teske et al., 2021a]). At Sites U1547 and U1548, Hole A was dedicated to the lithostratigraphic description of sedimentary facies, so most of the observations and the depths of lithologic changes reported are from these holes. In contrast, the igneous rock descriptions at Sites U1547 and U1548 were not only based on Hole A results at each site but also on results from six other holes (Holes U1547B–U1547E, U1548B, and U1548C) (see Igneous petrology and alteration).
The sediments recovered at Sites U1547 and U1548 are mostly biogenic (mainly diatom ooze), although the siliciclastic component is more abundant compared to previously drilled Sites U1545 and U1546 in northwest Guaymas Basin. The latter component is represented by three main modal sizes: (1) clay, mainly consisting of clay minerals, that occurs either mixed with diatom ooze or constitutes the fine portion of depositional units (event beds), which are typically gray in color and have coarser siliciclastic bases; (2) silt, which occurs either as an accessory component mixed with diatom ooze or constitutes the bulk of the depositional units that are found mainly in Lithostratigraphic Subunit IB at both sites; and (3) sand (mainly at Site U1547), which is primarily found in discrete, often laminated dark gray layers that occur either as isolated laminae or at the bottom of the aforementioned event beds (more abundant in Subunit IC; see Discussion). At Site U1547, accessory granule-sized siliciclastic grains were also observed. The sedimentologic and textural characteristics of the event beds suggest deposition by gravity-flow processes (see Discussion). These depositional event beds are less common and thinner in Holes U1548D and U1548E.
Similar to what was observed at northwestern Sites U1545 and U1546, the sequence recovered at Sites U1547 and U1548 shows downhole changes in the lithologic characteristics of the sediment that are related to changes in the ratio between diatoms and clay minerals, the presence of carbonate precipitates, and to a lesser extent diagenesis of biogenic silica. However, as mentioned before, siliciclastic silt and sand are more abundant at Sites U1547 and U1548 than at Sites U1545 and U1546. Distinctive downhole changes in lithology at Sites U1547 and U1548 are not significant enough to require division into more than one lithostratigraphic unit (Unit I). The changes, however, are sufficient to warrant division of Unit I into four subunits at Site U1547 and three subunits at Site U1548 (Tables T3, T4; Figure F4). Unlike northwestern Sites U1545 and U1546, some of the subunit boundaries characterize depths at which both diagenetic processes and changes in primary sedimentation occur; for instance, the first occurrence of micrite that marks the top of Subunit IB also coincides with an increase of siliciclastic (mainly silt-sized) content.
Different types and degrees of core disturbance were observed in sediments and rocks at this site, including the following textures: soupy, voids and gas expansion cracks, flow-in, fractures, brecciation, and biscuiting. The latter two are more prevalent in the cores recovered using the XCB coring system. The low recovery as well as small-scale lithologic variability between sites and holes hindered the ability to exactly position and correlate the boundaries of Subunits IB/IC and IC/ID.
In the following unit descriptions, we first summarize the Site U1547 and U1548 holes that are spatially closely associated with the Ringvent structure (Holes U1547A–U1547E [located inside the perimeter of Ringvent] and Holes U1548A–U1548C [situated at the outside edge of Ringvent]) and then summarize Holes U1548D and U1548E, which are located near Ringvent (~800 and ~1000 m from Hole U1548B, respectively).
4.1. Unit descriptions (Ringvent holes)
4.1.1. Lithostratigraphic Unit I
- Intervals: 385-U1547A-1H-1, 0 cm, to 27X-CC, 25 cm; 385-U1547B-1H-1, 0 cm, to 50X-1, 74 cm; 385-U1547C-2R-CC, 0 cm, to 9R-2, 116 cm; 385-U1547D-2R-CC, 0 cm, to 21R-3, 92 cm; 385-U1547E-2R-CC, 0 cm, to 24R-3, 111 cm
- Intervals: 385-U1548A-1H-1, 0 cm, to 20X-1, 114 cm; 385-U1548B-1H-1, 0 cm, to 12X-1, 100 cm; 385-U1548C-1H-1, 0 cm, to 10X-2, 38 cm
- Depths: Hole U1547A = 0–137.5 mbsf, Hole U1547B = 0–209.94 mbsf, Hole U1547C = 81.3–152.16 mbsf, Hole U1547D = 81.3–191.38 mbsf, Hole U1547E = 61.8–191.24 mbsf
- Depths: Hole U1548A = 0–103.04 mbsf, Hole U1548B = 0–94.8 mbsf, Hole U1548C = 0–69.55 mbsf
- Thickness: Hole U1547A = 137.5 m, Hole U1547B = 209.94 m, Hole U1547C = 152.16 m, Hole U1547D = 191.38 m, Hole U1547E = 191.24 m, Hole U1548A = 103.04 m, Hole U1548B = 94.8 m, Hole U1548C = 69.55 m
- Age: (Holocene? to) late to middle Pleistocene
- Lithology: diatom ooze, clay-rich diatom ooze, diatom clay, clay, diatom-rich clay, micrite-bearing to micrite-rich diatom clay, micrite-rich diatom ooze, sand, limestone/dolostone, siliceous claystone, and mafic igneous rock
Lithostratigraphic Unit I is composed of ~210 m (Site U1547) to ~110 m (U1548) of late to middle Pleistocene sediments as well as sedimentary and igneous rocks. At Site U1547, igneous rocks represent more than one-third (or ~59 m) of the total recovered stratigraphic succession.
At Site U1547 and in Holes U1548A–U1548C, Unit I is divided into four (Site U1547) or three to two (Holes U1548A–U1548C) subunits (Figure F4) mainly based on the presence of minor yet significant lithologic changes occurring downhole and/or changes in sediment induration and physical properties such as NGR, MS, and color reflectance. The transitions between the subunits are not sharp but gradual and occur over more than one core. The unit boundaries were selected based on the “first appearance” approach; boundaries are located at the depth at which the subunit’s defining characteristic, in this case new diagenetically modified lithology, is first encountered when describing the holes from top to bottom (Tables T3, T4).
4.1.1.1. Subunit IA
- Intervals: 385-U1547A-1H-1, 0 cm, to 5H-5, 77 cm; 385-U1547B-1H-1, 0 cm, to 5H-4, 96 cm
- Intervals: 385-U1548A-1H-1, 0 cm, to 6H-1, 56 cm; 385-U1548B-1H-1, 0 cm, to 5H-4, 68 cm; 385-U1548C-1H-1, 0 cm, to 4H-1, 0 cm
- Depths: Hole U1547A = 0–40.58 mbsf, Hole U1547B = 0–39.4 mbsf
- Depths: Hole U1548A = 0–40.46 mbsf, Hole U1548B = 0–38.5 mbsf, Hole U1548C = 0–26.6 mbsf
- Thickness: Hole U1547A = 40.58 m, Hole U1547B = 39.4 m, Hole U1548A = 40.46 m, Hole U1548B = 38.5 m, Hole U1548C = 26.6 m
- Age: (Holocene? to) late Pleistocene
- Lithology: clay-rich diatom ooze, diatom clay, and diatom ooze
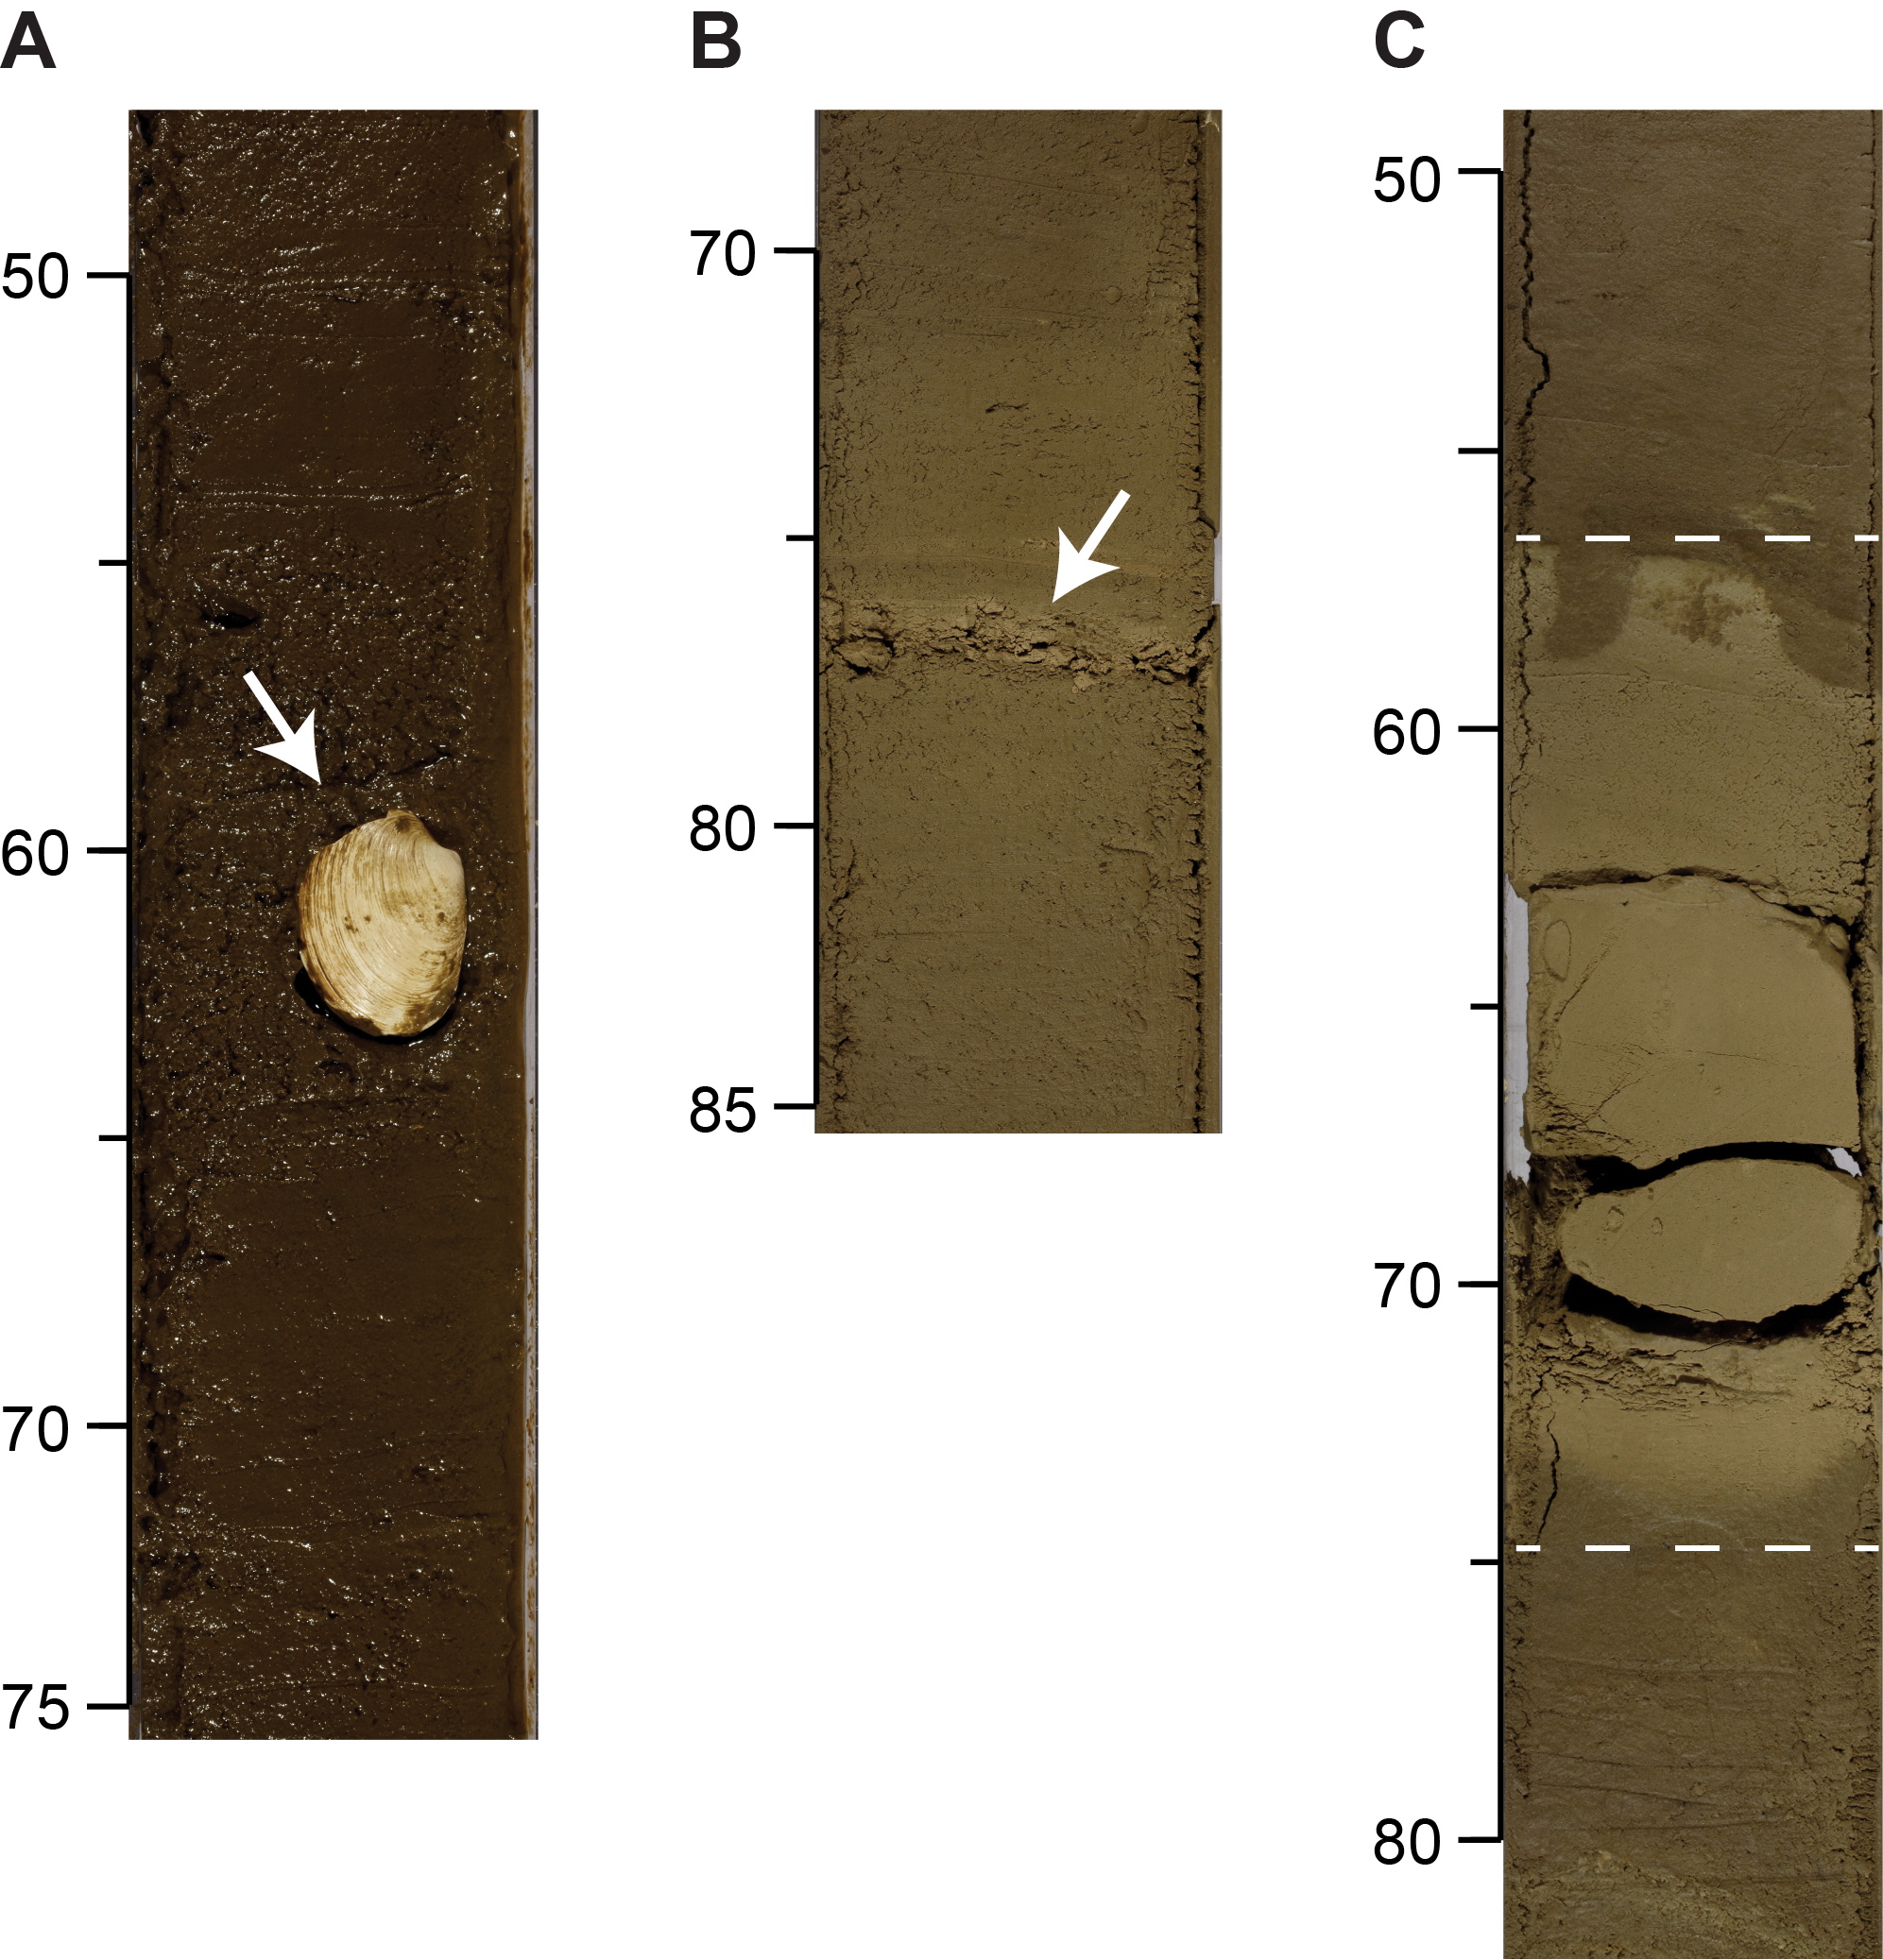
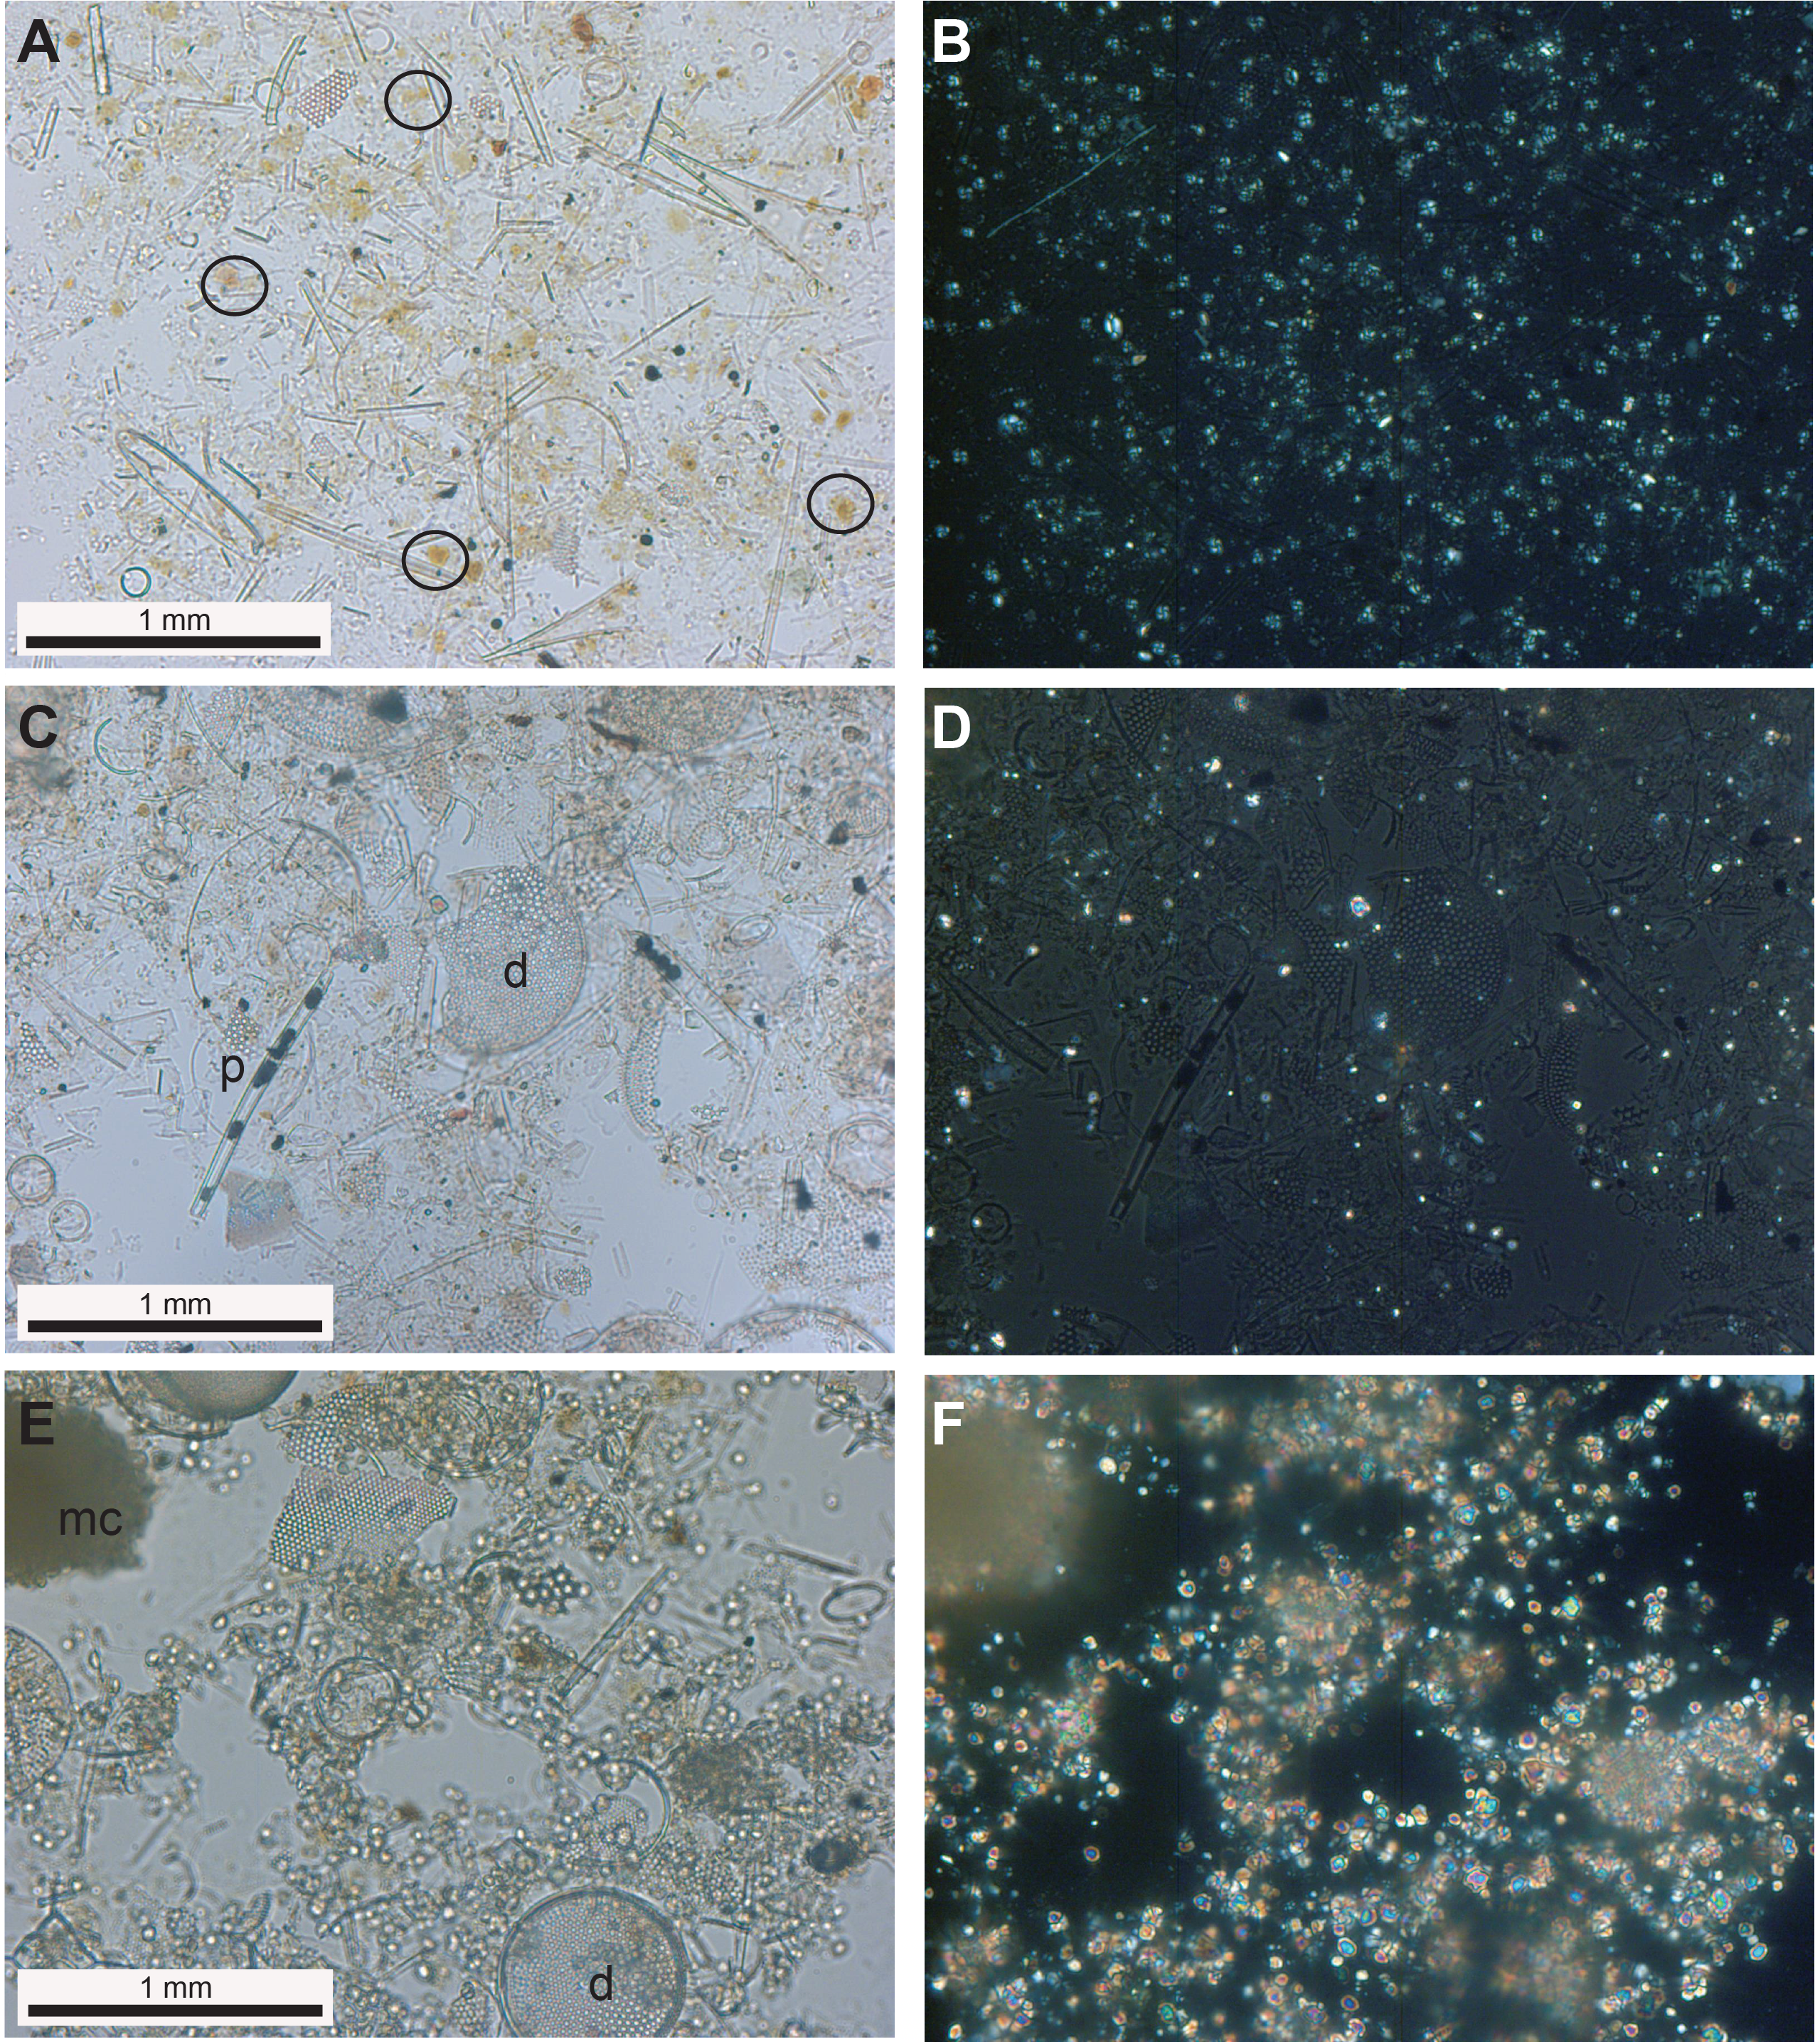
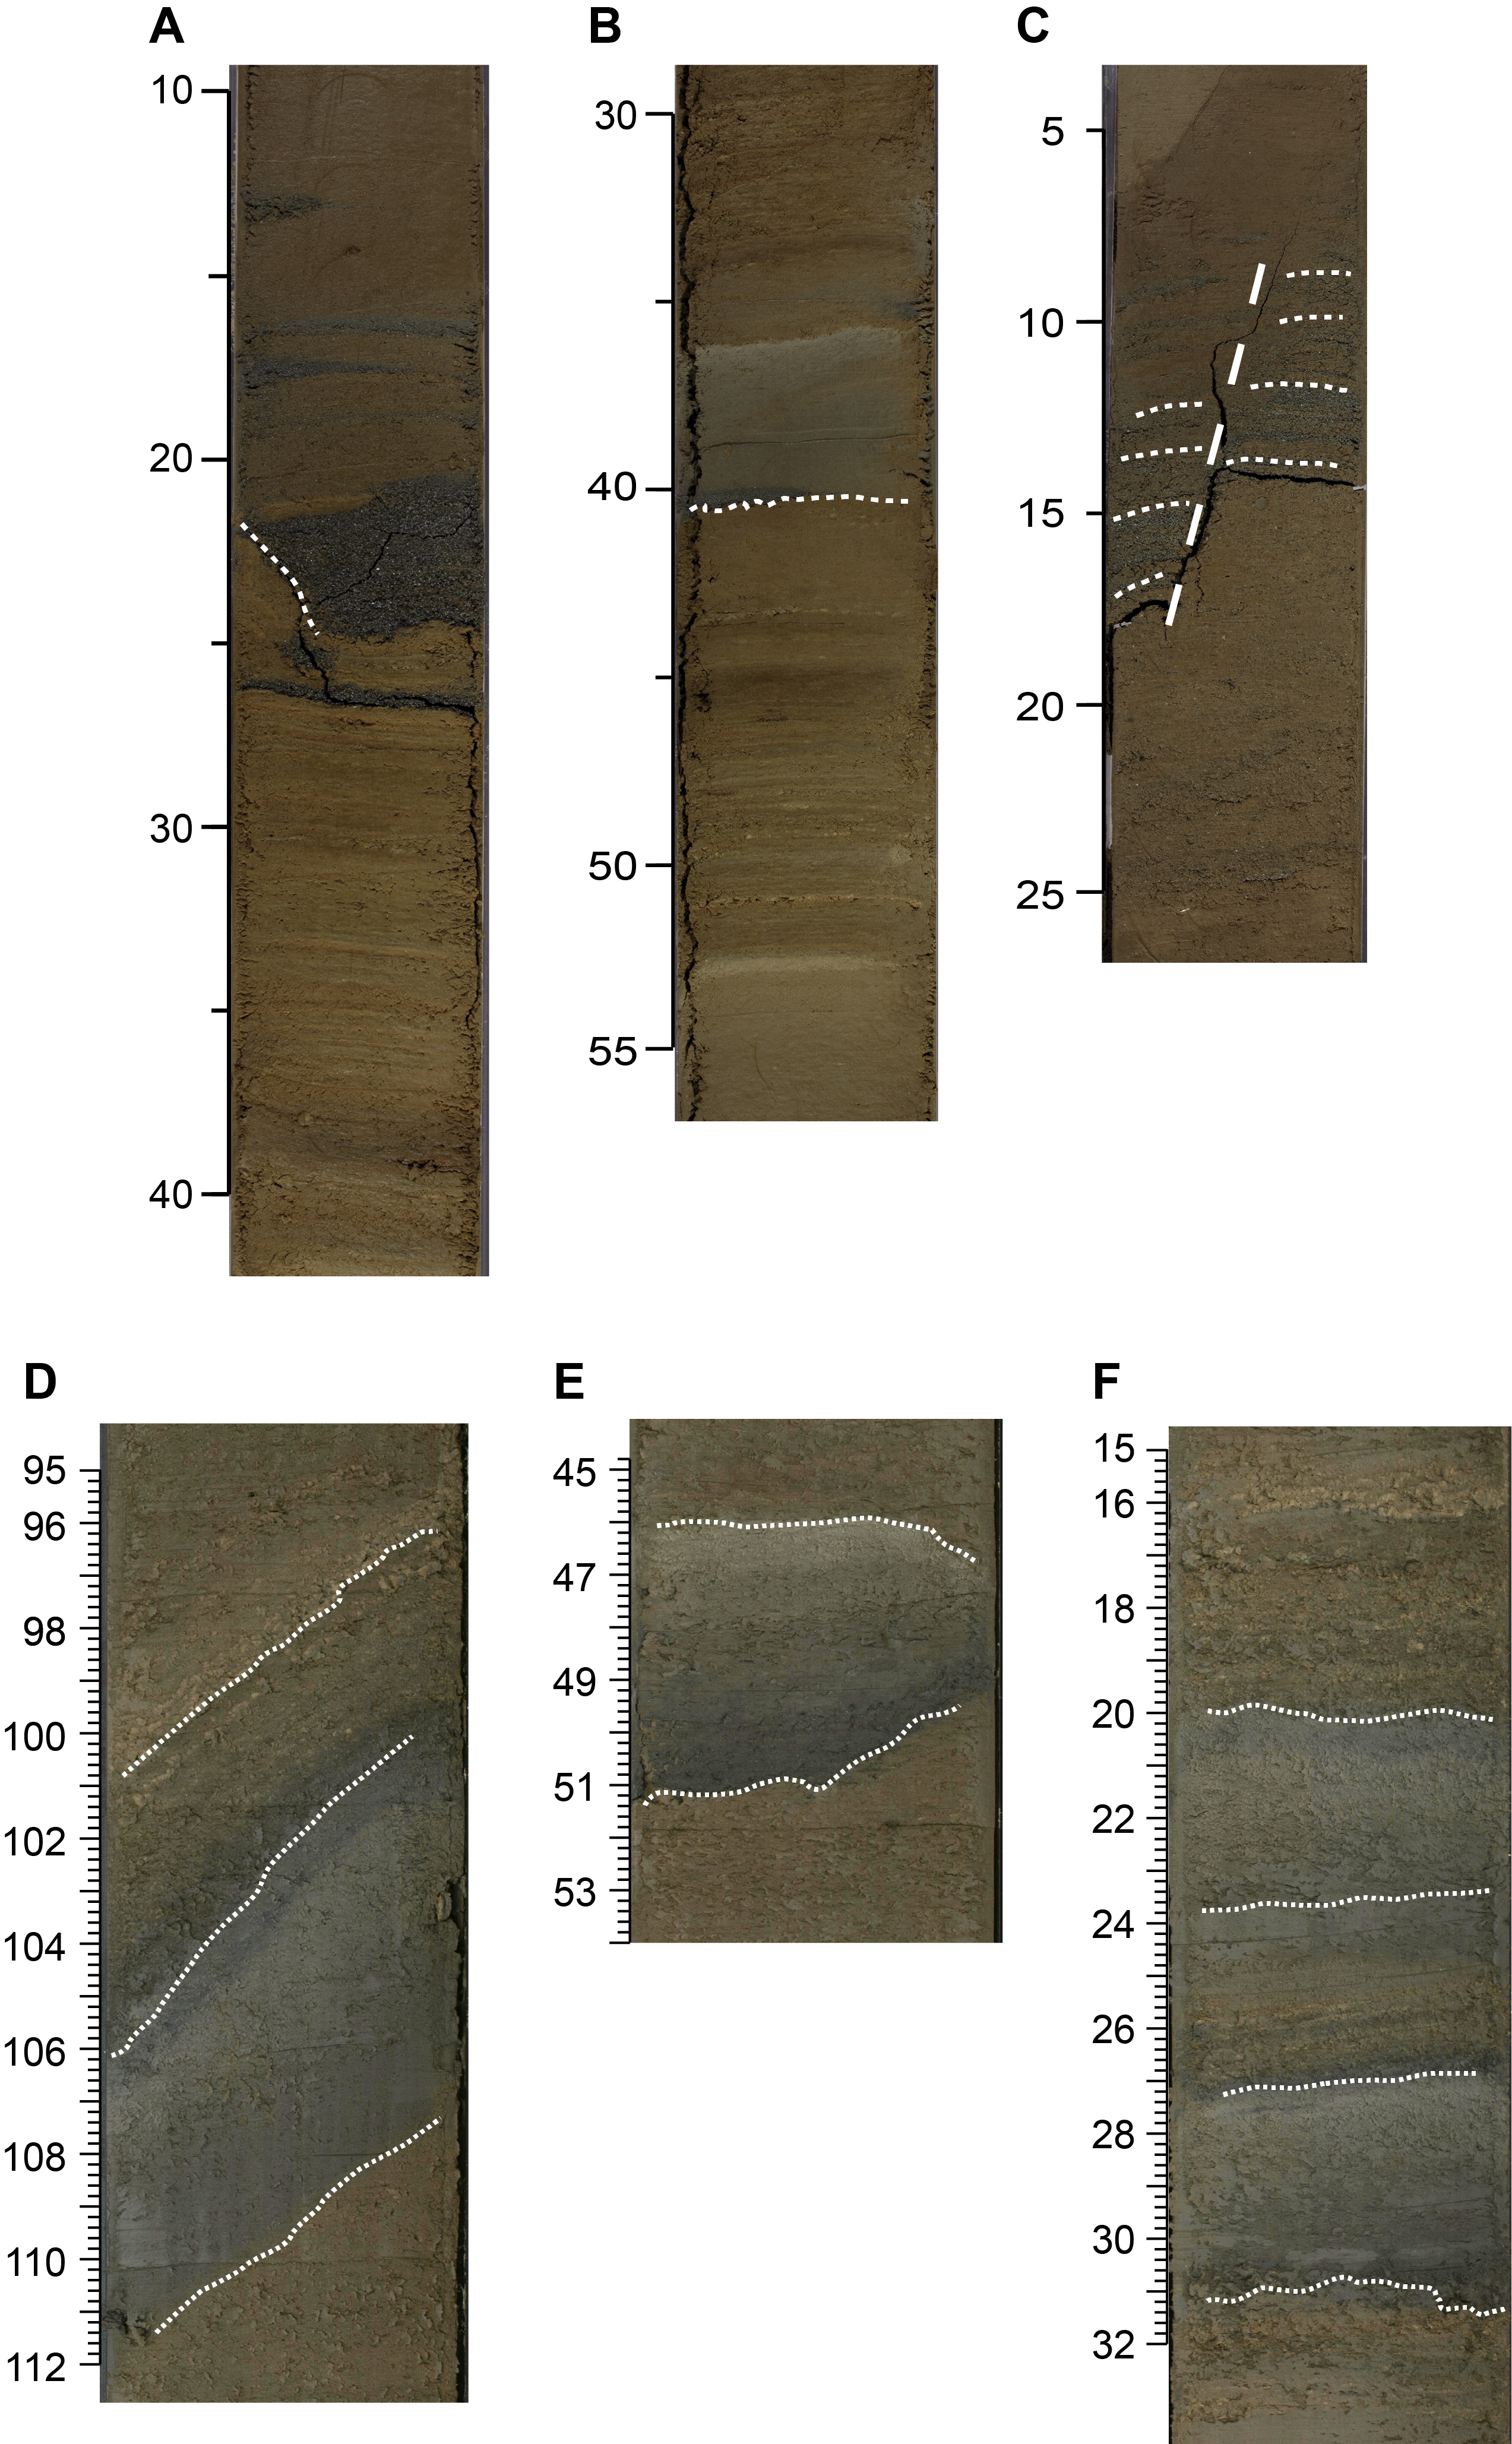
At Site U1547, Subunit IA consists mainly of diatom ooze mixed with different amounts of clay minerals. The intervals with higher diatom content are generally light olive-gray, whereas the intervals with higher clay content tend to be darker (e.g., olive-gray). In Holes U1548A and U1548B, Subunit IA overall has similar thickness and attributes to those observed for Site U1547. The upper ~5 m of the subunit at each site/hole reveals homogeneous diatom clay (Figure F5A). Below this interval, the sediments are mainly laminated and composed of diatom ooze mixed with variable amounts of clay minerals (Figure F6A–F6B). In Hole U1547A, the uppermost section includes a bivalve belonging to the Lucinidae family, which hosts sulfur-oxidizing symbionts capable of chemosynthesis (Taylor et al., 2011, and references therein) (Figure F5A) and shell fragments. In this subunit, lamination is often slightly contorted, tilted, or truncated, probably as a result of confined episodes of soft-sediment deformation. At Sites U1547 and U1548, open burrows are abundant throughout the uppermost core.
4.1.1.2. Subunit IB
- Intervals: 385-U1547A-5H-5, 77 cm, to 10H-CC, 34 cm; 385-U1547B-5H-4, 96 cm, to 10H-CC, 41 cm; 385-U1547C-2R-CC, 0 cm, to 2R-CC, 30 cm
- Intervals: 385-U1548A-6H-1, 56 cm, to 20X-1, 114 cm; 385-U1548B-5H-5, 68 cm, to 12X-1, 109 cm; 385-U1548C 4H-1, 0 cm, to 10X-2, 38 cm
- Depths: Hole U1547A = 40.58–91.37 mbsf, Hole U1547B = 39.4–90.98 mbsf, Hole U1547C = 81.3–81.6 mbsf, Hole U1548A = 40.46–103.04 mbsf, Hole U1548B = 38.50–94.8 mbsf, Hole U1548C = 26.6–69.55 mbsf
- Thickness: Hole U1547A = 50.79 m, Hole U1547B = 51.58 m, Hole U1547C = 0.3 m, Hole U1548A = 62.58 m, Hole U1548B = 56.3 m, Hole U1548C = 42.95 m
- Age: middle Pleistocene
- Lithology: micrite-rich diatom ooze, micrite-bearing diatom clay, clay-rich diatom ooze, clay and micrite-rich diatom ooze, diatom-rich micrite, limestone/dolostone, and mafic igneous rock
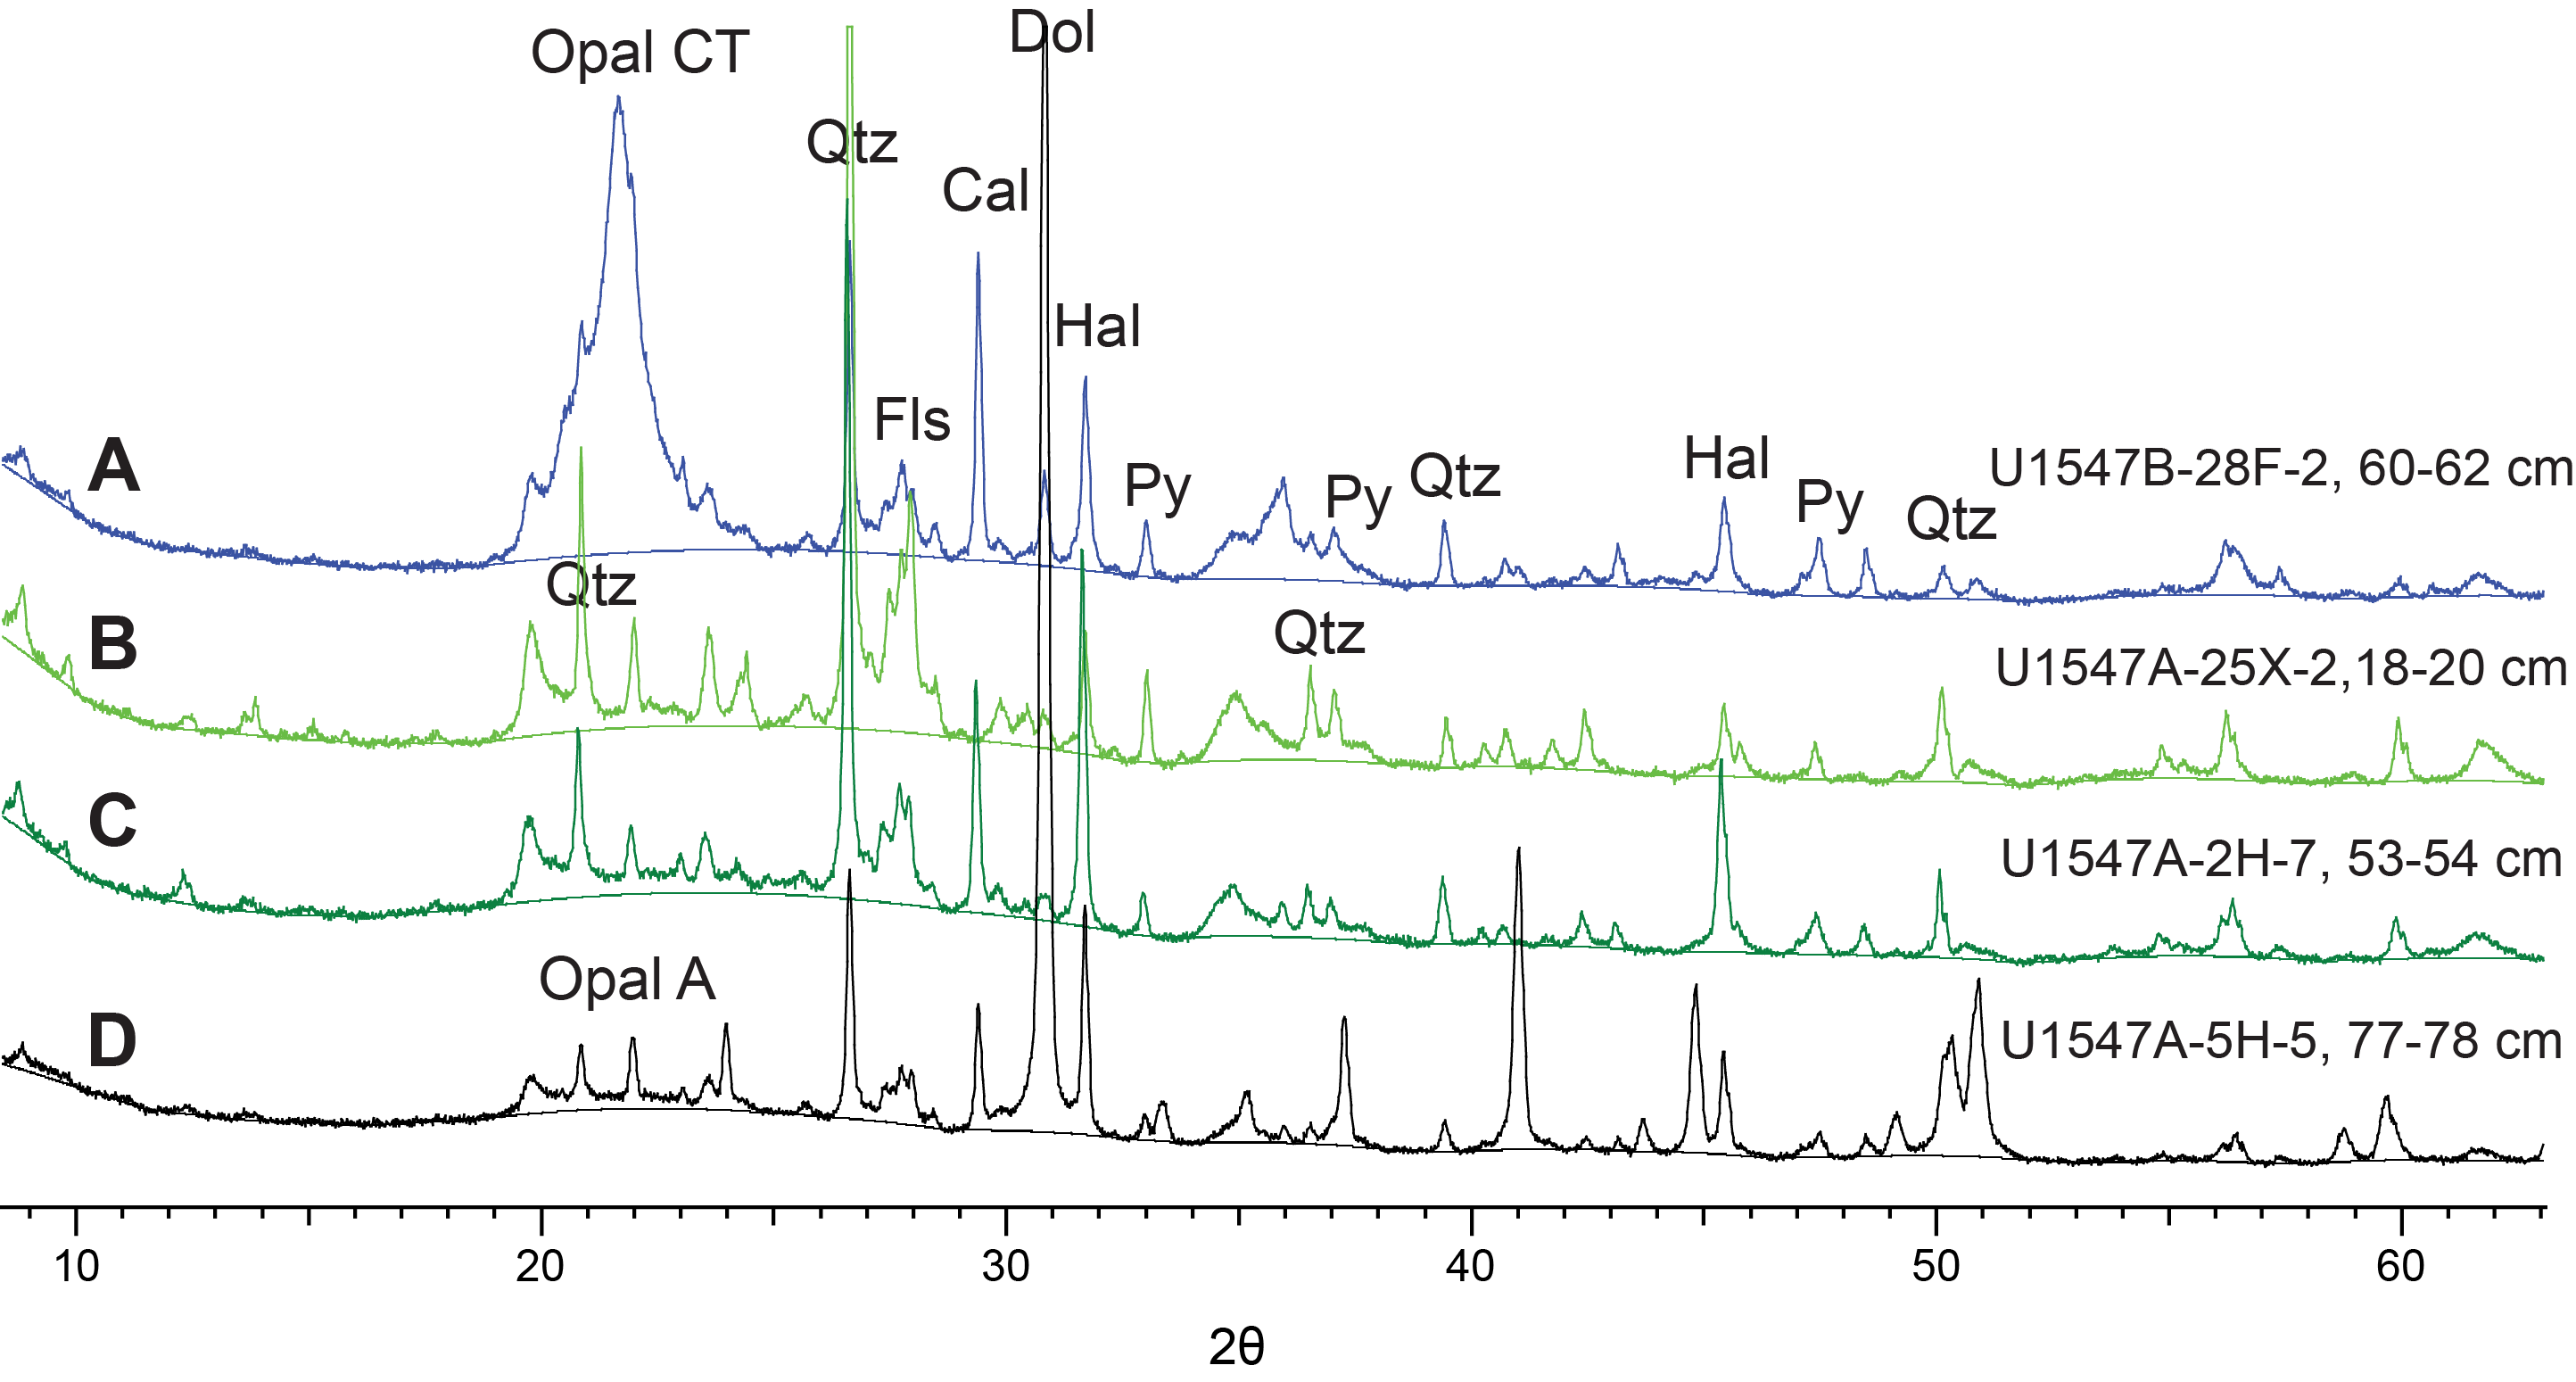
At Site U1547 and in Holes U1548A–U1548C, Subunit IB is mainly composed of varying proportions of diatoms and clay with significant (>5%) micrite (euhedral to subhedral, micrometer-sized authigenic carbonate particles) (Figure F6D) that are often composed of dolomite (Figure F7A). The XRD analyses from Subunits IA and IB clearly show the diatom silica phase, opal-A, which is visible as a broad “hump” from 21° to 22°2θ in the X-ray diffractogram (Figure F7B). Authigenic carbonate precipitates (micrite and carbonate nodules) are abundant, and at times they become the dominant lithologic components (Figures F5B, F6E–F6F). Gray to medium gray silty beds, often showing erosional basal contacts, are also frequent, and some of these beds can attain thicknesses of up to 1.2 m (see Discussion for the interpretation of these depositional units). The lateral continuity of these beds is supported by a single marker bed that was traced between Hole U1547A (67.2 mbsf) and Hole U1547B (69.04 mbsf), attaining thicknesses of ~1.1 and 0.4 m, respectively (Figure F8A–F8B). At Site U1547, the concentration of micrite reaches a peak between Cores U1547A-7H and 9H (between ~52 and ~82 mbsf); the micrite content then rapidly decreases to only trace amounts at the bottom of Core 10H. This rapid decline in micrite content defines the top boundary of underlying Subunit IC, which is designated to be the base of Core 10H. Because of the low recovery and extensive whole-round core sampling in Holes U1547B and U1547C, the lowermost micrite-rich interval could not be located precisely. Nevertheless, based on visual core description, the base of Subunit IB in Hole U1547B was assigned to the bottom of Core 10H. The authigenic carbonates in the Subunit IB sediments in Holes U1548A–U1548C show distributions and styles (disseminated micrite as well as concretion) similar to those at Site U1547. In Hole U1548C, the top boundary of this subunit is particularly shallow, with the first micrite-rich interval occurring in Core 4H at 26.6 mbsf. Farther downhole, carbonate concretions are abundant from ~45 to 65 mbsf in Hole U1548C (Cores 6H and 7H). The bottom part of Core 7H (Sections 7H-7 and 7H-CC) consists of siliceous claystone. The bottom part of Holes U1548A–U1548C intersected ~4–6 m of hypabyssal mafic rock that makes up the basis of Subunit IB at the outside edge of Ringvent (see Igneous petrology and alteration).

4.1.1.3. Subunit IC
- Intervals: 385-U1547A-10H-CC, 34 cm, to 25X-CC, 21 cm; 385-U1547B-10H-CC, 41 cm, to 22F-CC, 25 cm; 385-U1547C-3R-1, 0 cm, to 9R-2, 116 cm; 385-U1547D-2R-CC, 0 cm, to 4R-1, 61 cm; 385-U1547E-2R-CC, 0 cm, to 4R1, 20 cm
- Depths: Hole U1547A = 91.37–131.23 mbsf, Hole U1547B = 90.98–120.64 mbsf, Hole U1547C = 91.0–152.16 mbsf, Hole U1547D = 81.3–101.41 mbsf, Hole U1547E = 61.8–81.5 mbsf
- Thickness: Hole U1547A = 39.86 m, Hole U1547B = 29.66 m, Hole U1547C = 61.16 m, Hole U1547D = 20.11 m, Hole U1547E = 19.7 m
- Age: late to middle Pleistocene
- Lithology: diatom clay, sand, clay-rich diatom ooze, diatom ooze, and basaltic rock
The top of Subunit IC coincides with a significant decrease in micrite content in the sediment, although limestone/dolostone concretion intervals are still present in almost all the cores recovered from this interval. The main lithology is more or less laminated diatom clay and clay-rich diatom ooze (Figure F9). At Site U1547, coarse-grained, occasionally laminated dark sandy intervals become common in the lower half of the subunit (Figures F9C–F9F, F10A–F10C). At Site U1547, the top boundaries of many of these dark gray silty-sandy layers are capped by a few-centimeter-thick lighter colored band, which contains abundant, often pennate-type diatoms (Figure F10E–F10F).
Because of the low recovery at these depths in Holes U1547A–U1547D (Figure F4) and extensive sampling of whole-round cores for microbiology in Hole U1547B, it is difficult to locate the exact depth of the boundary, which is transitional in nature to begin with, and consequently challenging to correlate among holes.
4.1.1.4. Subunit ID
- Intervals: 385-U1547A-25X-CC, 21 cm, to 27X-CC, 25 cm; 385-U1547B-22F-CC, 25 cm, to 50X-1, 74 cm; 385-U1547D-4R-2, 0 cm, to 21R-3, 92 cm; 385-U1547E-4R-2, 0 cm, to 24R-3, 111 cm
- Depths: Hole U1547A = 131.23–137.5 mbsf, Hole U1547B = 120.64–209.94 mbsf, Hole U1547D = 101.41–191.38 mbsf, Hole U1547E = 81.5–191.24 mbsf
- Thickness: Hole U1547A = 6.27 m, Hole U1547B = 89.3 m, Hole U1547D = 89.97 m, Hole U1547E = 109.74 m
- Age: late to middle Pleistocene
- Lithology: siliceous claystone, limestone, dolostone, and mafic igneous rock
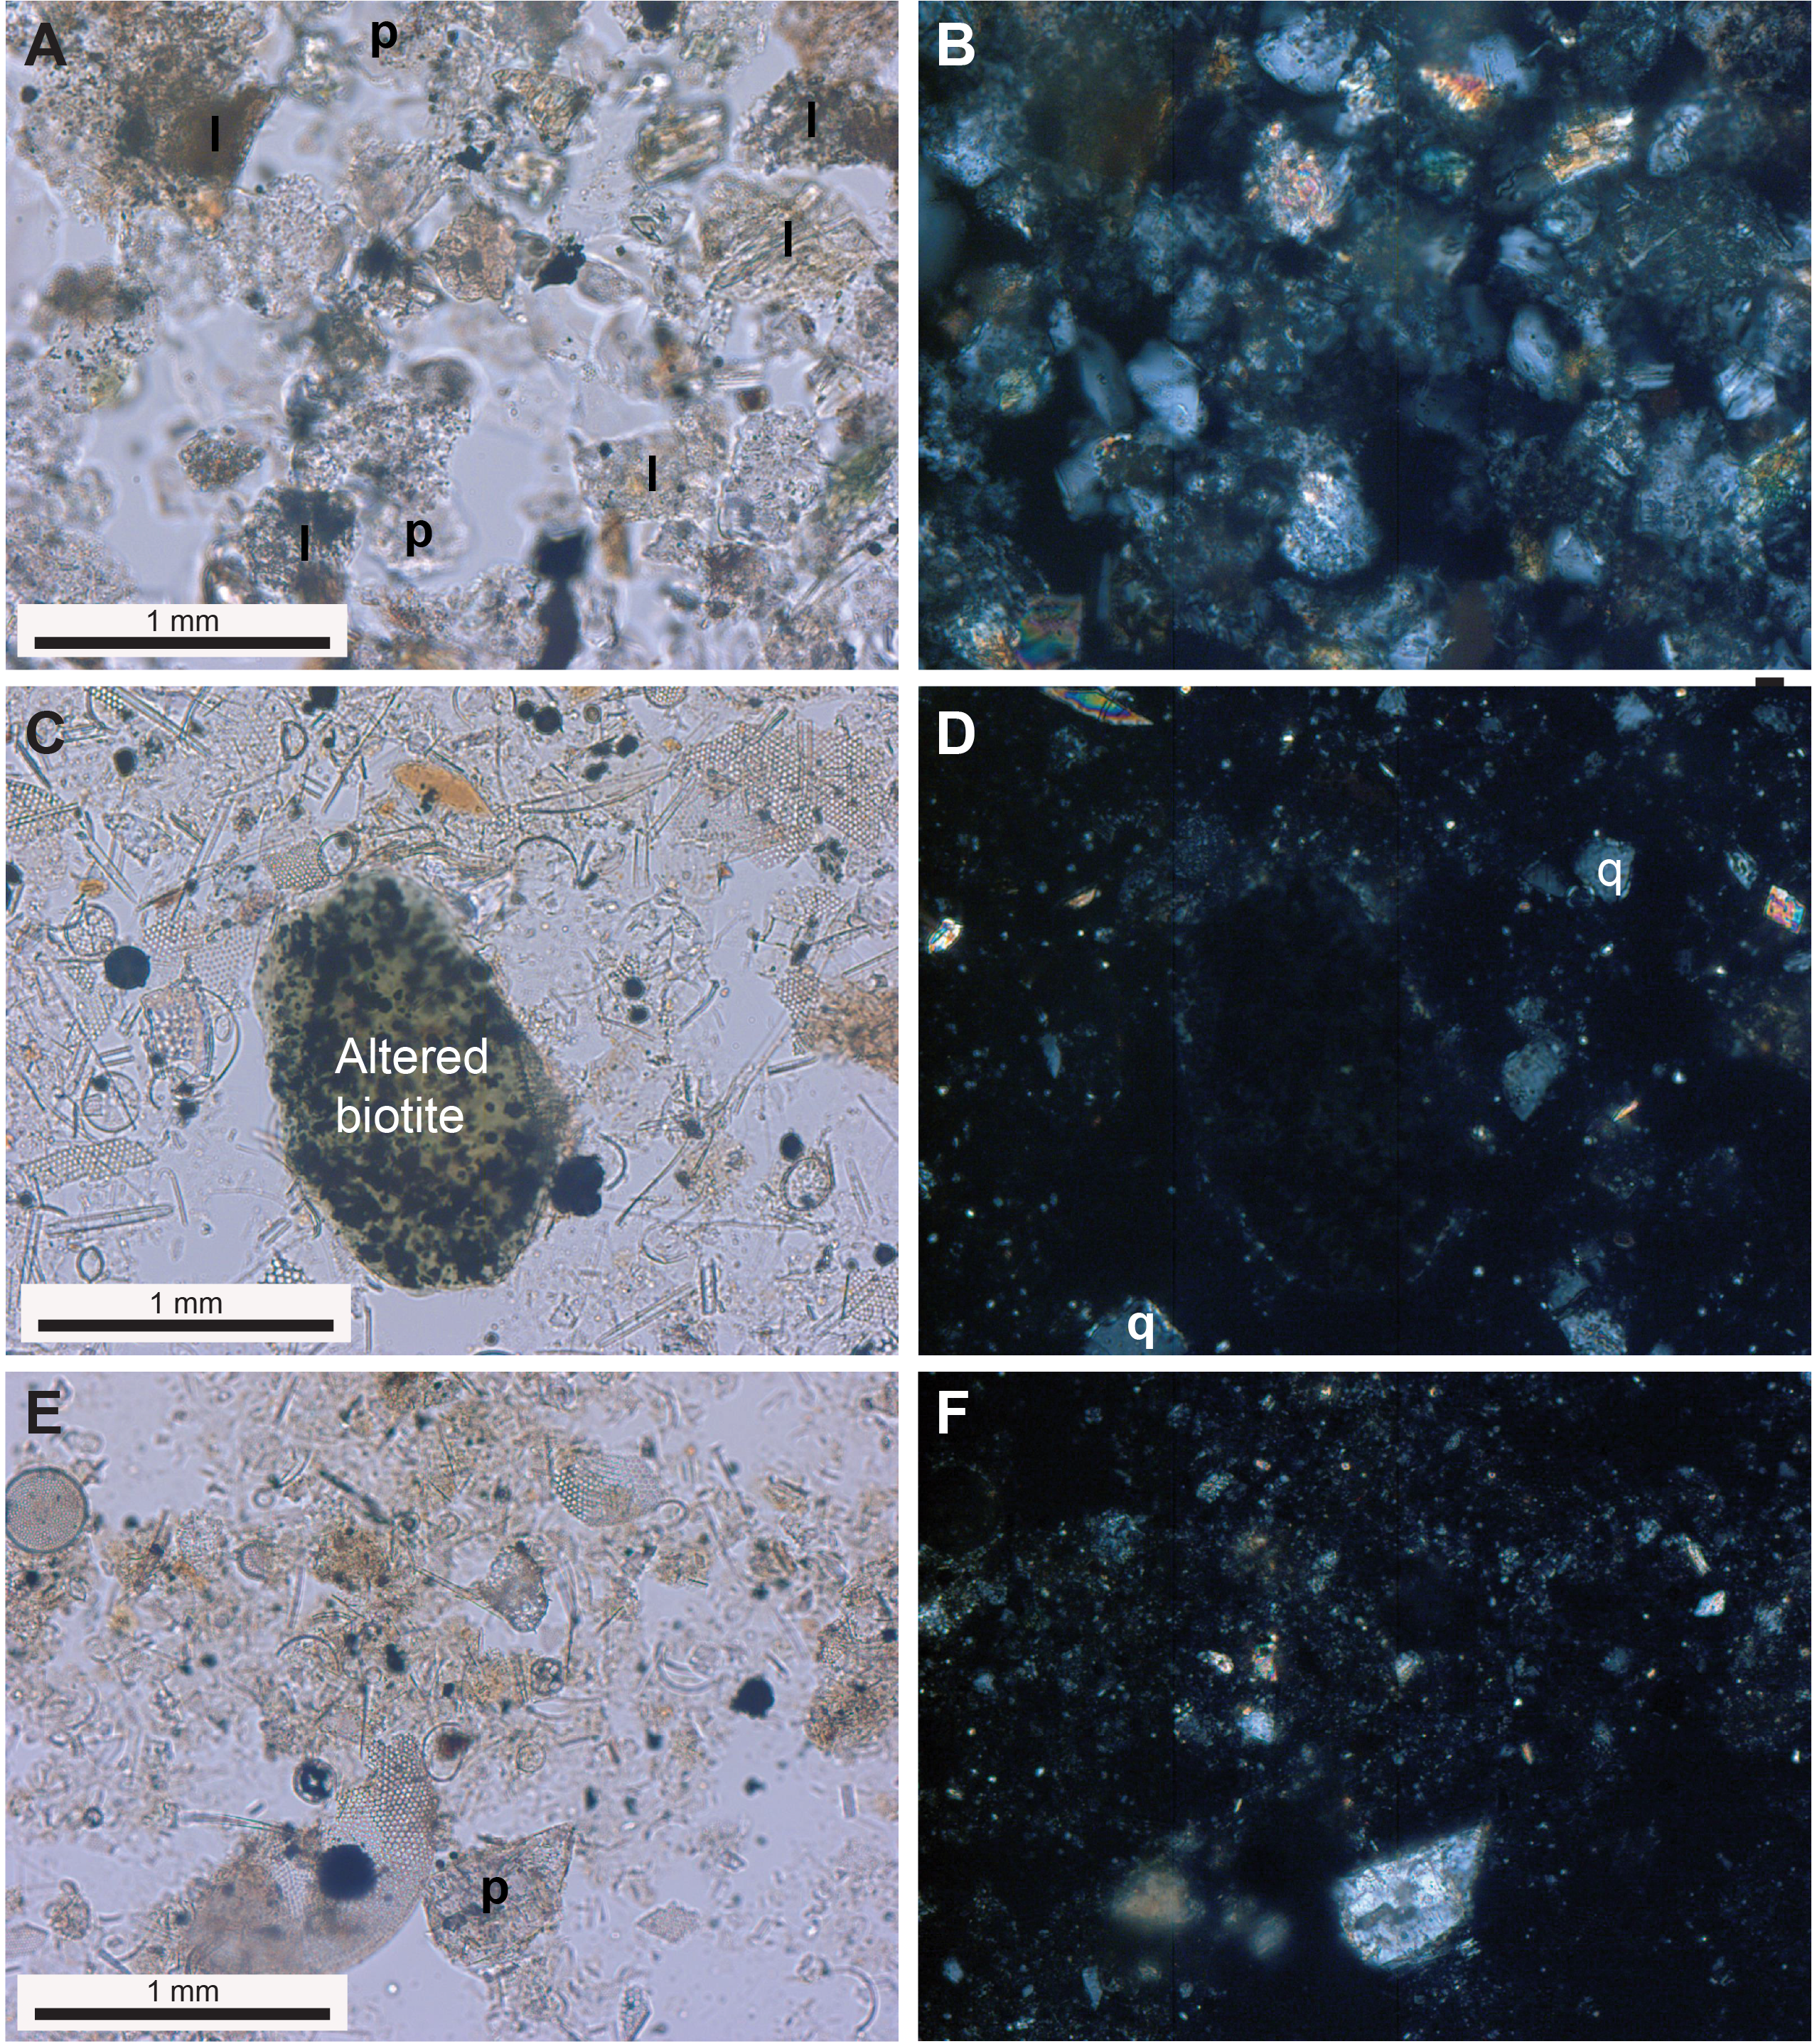
Subunit ID was only recovered at Site U1547. It is siliceous claystone that varies in color from dusky to dark yellowish brown to olive-black to brownish black. Smear slides show that diatoms are absent, and the main visible component is clay with lesser detrital silt and pyrite framboids. The silica phase transition from opal-A to opal-CT occurs in the lowermost cores above the sill in Hole U1547B but was not recovered in Hole U1547D (Figure F7C–F7D). In its deeper part, Subunit ID consists of hypabyssal basaltic and doleritic rocks that were extensively drilled in all holes at Site U1547, with several tens of meter thickness intersected in Holes U1547B, U1547D, and U1547E (see Igneous petrology and alteration).
4.1.1.5. Sediment/sill contact
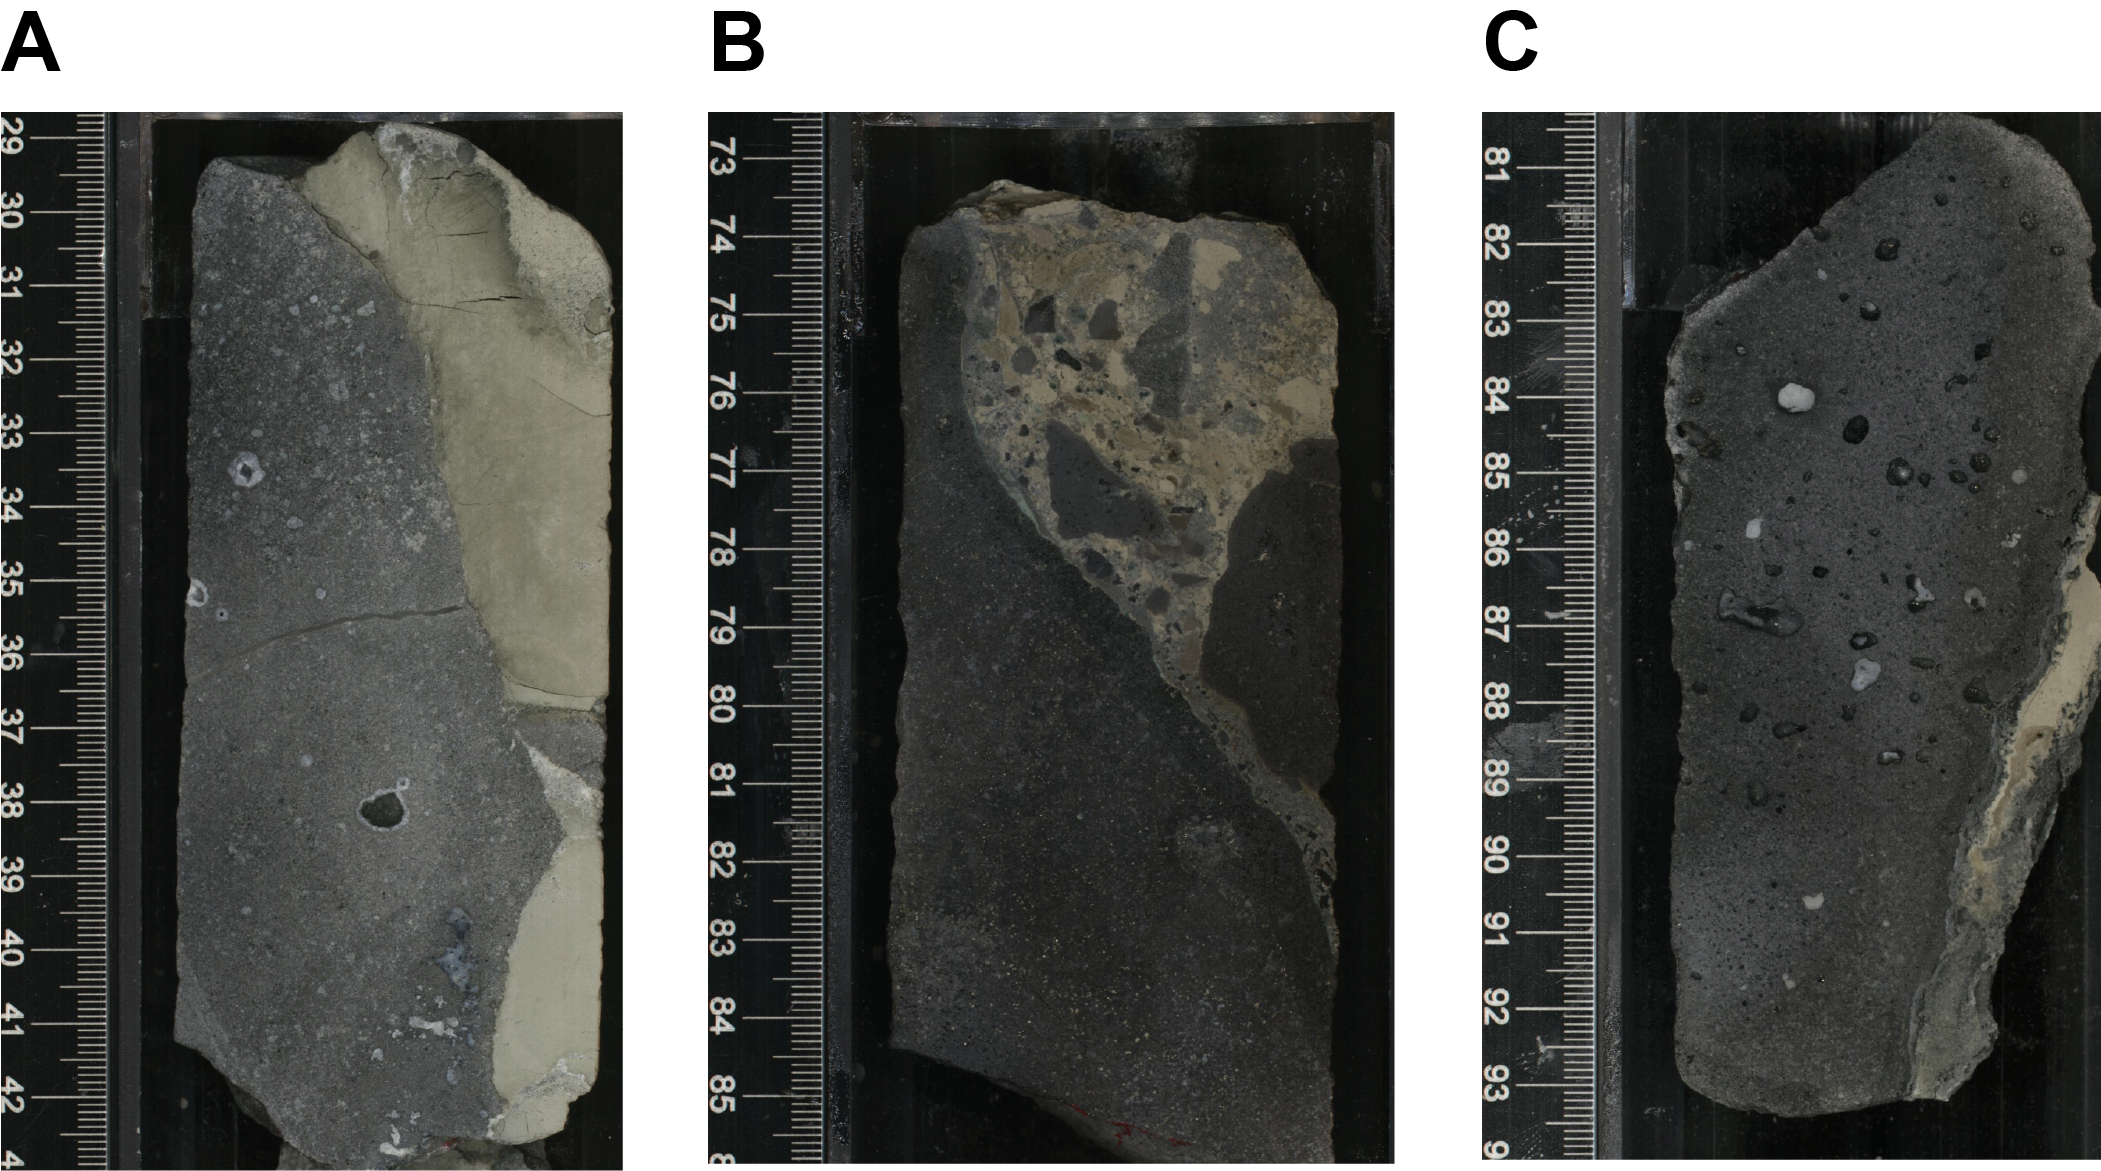
Mafic sill material was first encountered at a relatively shallow depth at Sites U1547 (ranging from 81.5 mbsf [Hole U1547E] to 150 mbsf [Hole U1547C]) and U1548 (ranging from 69.6 mbsf [Hole U1548C] to 103 mbsf [Hole U1548A]). However, poor recovery provides only a limited view of the sediment/sill contact zones. No mineralogic changes were noted in nonindurated sediments recovered above the sill, yet indurated pieces of sediment were found admixed with basaltic rock or basaltic glass in Holes U1547B–U1547E and U1548A–U1548C (Table T5; Figure F11). Basaltic conglomerate and breccia clasts as well as indurated sediment cemented by micritic calcite are present in Section 385-U1547C-7R-1. Other common features in the mafic sill are fractures or veins filled with lithified sediment or authigenic calcite and polymictic breccia that includes angular fragments of sedimentary rock, glass, and basaltic rock (Figure F11). All of these features suggest that these sediment/sill associations formed during sill emplacement as solidifying magma intruded young, unconsolidated, wet sediment that was locally mobilized and injected into the sill. This intrusive contact relationship is confirmed by preliminary XRD data and microscopic observations on indurated sediments from the contact zone that suggest the occurrence of different types of recrystallized carbonate (e.g., calcite, dolomite, or ankerite), hydrothermal pyrite, and zeolite (clinoptilolite).
4.2. Unit descriptions (Site U1548 holes near Ringvent)
4.2.1. Lithostratigraphic Unit I
- Intervals: 385-U1548D-1H-1, 0 cm, to 13F-CC, 9 cm; 385-U1548E-1H-1, 0 cm, to 12H-CC, 25 cm
- Depths: Hole U1548D = 0–110.29 mbsf, Hole U1548E = 0–110.86 mbsf
- Thickness: Hole U1548D = 110.29 m, Hole U1548E = 110.86 m
- Age: Holocene (?) or late Pleistocene to middle Pleistocene
- Lithology: diatom ooze, nannofossil-rich and clay-rich diatom ooze, diatom clay, micrite-bearing to micrite-rich diatom clay, micrite-rich diatom ooze, silty clay, diatom-rich silty clay, silt, and sand
Lithostratigraphic Unit I is composed of ~110.29 m (Hole U1548D) to ~110.86 m (Hole U1548E) of (Holocene? and) late to middle Pleistocene sediments. In both holes, Unit I was divided into two subunits (Figure F4C) mainly based on minor yet significant lithologic changes occurring downhole and/or changes in sediment induration and physical properties such as NGR, MS, and color reflectance. The transitions between the subunits are not sharp but gradual and occur over more than one core (Table T3).
4.2.1.1. Subunit IA
- Intervals: 385-U1548D-1H-1, 0 cm, to 7H-5, 40 cm; 385-U1548E-1H-1, 0 cm, to 7H-5, 62 cm
- Depths: Hole U1548D = 0–60.12 mbsf, Hole U1548E = 0–59.82 mbsf
- Thickness: Hole U1548D = 60.12 m, Hole U1548E = 59.82 m
- Age: (Holocene? to) late Pleistocene
- Lithology: clay-rich diatom ooze, diatom clay, and diatom ooze
Subunit IA is composed of mainly laminated diatom ooze with variable amounts of clay-sized nonbiogenic debris, mainly clay minerals. As in Subunit IA at Site U1545, the content of the clay varies over multiple spatial scales from micrometer-thick lamination to meter intervals. Combined smear slide and macroscopic visual observations indicate that the intervals with higher diatom content (diatom ooze) are generally light olive-gray, whereas mixed lithologies (e.g., diatom and clay) tend to be darker (e.g., olive-gray; 5Y 3/2). Diatoms are well preserved throughout the subunit, and nannofossils are the second most common biogenic component. The lower boundary of this subunit was chosen as the first occurrence of carbonate concretions or micrite-rich lithologies. Other very minor lithologies include laminae of terrigenous silt, sand, and tephra. Open burrows are present at the top of the subunit, and shells, fragmented during core splitting, are present in most cores.
4.2.1.2. Subunit IB
- Intervals: 385-U1548D-7H-5, 40 cm, to 13F-CC, 5 cm; 385-U1548E-7H-5, 62 cm, to 12H-CC, 25 cm
- Depths: Hole U1548D = 60.12–110.29 mbsf, Hole U1548E = 59.82–110.86 mbsf
- Thickness: Hole U1548D = 50.17 m, Hole U1548E = 51.04 m
- Age: late to middle Pleistocene
- Lithology: micrite-rich diatom ooze, micrite-bearing diatom clay, clay-rich diatom ooze, clay- and micrite-rich diatom ooze, diatom-rich micrite, carbonate concretion, and limestone/dolostone
Subunit IB is mainly composed of varying proportions of diatoms and clay with significant (>5%) micrite (euhedral to subhedral, micrometer-sized authigenic carbonate particles). The boundary between Subunits IA and IB is placed at the first occurrence of micrite-rich diatom ooze in Sections 385-U1548E-7H-5 at 40 cm and 7H-5 at 62 cm. The main lithologies are micrite-bearing diatom clay and micrite-rich diatom ooze. The homogeneous intervals become dominant in this subunit. The carbonate concretions are generally small and locally coalesce to form indurated laminae.
Holes U1548D and U1548E can be correlated using key beds, including a depositional unit composed of brownish gray, normally graded sand with a sharp basal contact that is overlain by light olive-gray diatom ooze (intervals 385-U1548D-6H-6, 36–94 cm, and 385-U1548E-6H-6, 74–102 cm, respectively).
4.3. Discussion
The lithostratigraphic descriptions above show that Sites U1547 and U1548 have both similarities and differences in terms of depth to initial sill intersection, thickness of igneous rock bodies, and number of subunits. The most notable differences include the thickness of the sediment column above igneous rocks for the Ringvent holes because the deepest sills were intersected to different extent (but never drilled through): in Hole U1547A, the deepest hole at Site U1547, the total curated core depth is 209.94 mbsf and about one-third of the total core length is igneous rocks (~133 m of sediment versus ~76 m of igneous rocks); in Hole U1548A, the deepest hole at Site U1548, the maximum total curated length is only 103.4 m, of which only the bottom ~2.5 m recovered igneous rocks (Figure F4). Because the subunit divisions are a function of diagenesis, they are broadly depth related. Therefore, deeper holes at Site U1547 encountered more subunits than the shallow proximal Ringvent holes (U1548A–U1548C) (Table T3).
Sites U1547 and U1548 also show some important differences from Sites U1545 and U1546, located ~25 km northwest. At Sites U1547 and U1548, micrometer-sized authigenic carbonate particles (micrite) and carbonate nodules and layers appear at shallower depths than at the northwestern sites, and the depths of the sill/sediment contact zones are much shallower (Table T3). The shallowest occurrence of micrite was found in Hole U1548C (~42 mbsf), whereas the Subunit IA/IB boundary for Holes U1548D and U1548E is deeper (~60 mbsf). Moreover, the nonbiogenic siliciclastic layers at the Ringvent holes occur more frequently and have greater thickness and grain size than those observed in Holes U1548D and U1548E and at Sites U1545 and U1546. Some of the siliciclastic layers show erosional bottom contacts, locally attaining thicknesses of up to 1.2 m.
At Site U1547, the two APC/XCB-drilled holes (U1547A and U1547B) can be correlated at very high resolution (single laminae in correlative packages) in the upper part of the sequence. However, correlation becomes more difficult at depths below ~65 mbsf because of changes in the lateral continuity of the silty beds and the possible presence of associated erosional surfaces. We interpret these silty beds as distinct depositional entities because they seem to be traceable between holes and show the distinctive sedimentological characteristics of mass-gravity flows such as grain flows or hybrid flows.
The sill/sediment contact zone is very different from the contact zone observed at Site U1546. The latter displays contact-metamorphosed sediment in sharp (baked) contact with highly altered sill with basaltic texture, whereas at Sites U1547 and U1548 the sill/sediment contact is characterized by basaltic rock commingled with sediment. Conglomerate, breccia, and sediment injections in the basaltic rock along fractures and within veins suggest that this association probably formed through dynamic interactions between hot magma and wet unconsolidated sediments (White et al., 2000) and can be called peperite.
5. Igneous petrology and alteration
Hypabyssal sill intrusions underlying the circular hydrothermal mound (Ringvent) were intersected in five holes (U1547A–U1547E) inside the Ringvent structure and in three holes (U1548A–U1548C) immediately outside its perimeter (Figure F12). Apart from three Site U1547 holes that were established using the RCB system (U1547C–U1547E), in situ igneous rock intervals in all other holes (n = 5) were recovered using the XCB system. Slightly to moderately altered, aphyric to (clinopyroxene-)plagioclase phyric basaltic rock with sparse to high vesicularity is the predominant rock type intersected below Ringvent, and it shows abundant magma-sediment interaction (sedimentary veins, hyaloclastite, and basaltic breccia) along glassy and chilled margins. These observations attest to the relatively rapid cooling of shallow (top sill contact = ≤150 mbsf) intrusion bodies in wet sediment. Only the bottommost ~20 m in Hole U1547E consists of sill material with doleritic texture; it is overall more altered than its basaltic counterpart. A generally decreasing depth of initial sill intersection with decreasing lateral seafloor distance to the hydrothermal mound is present both inside (Site U1547) and immediately outside (Holes U1548A–U1548C) the Ringvent perimeter (Figure F12).
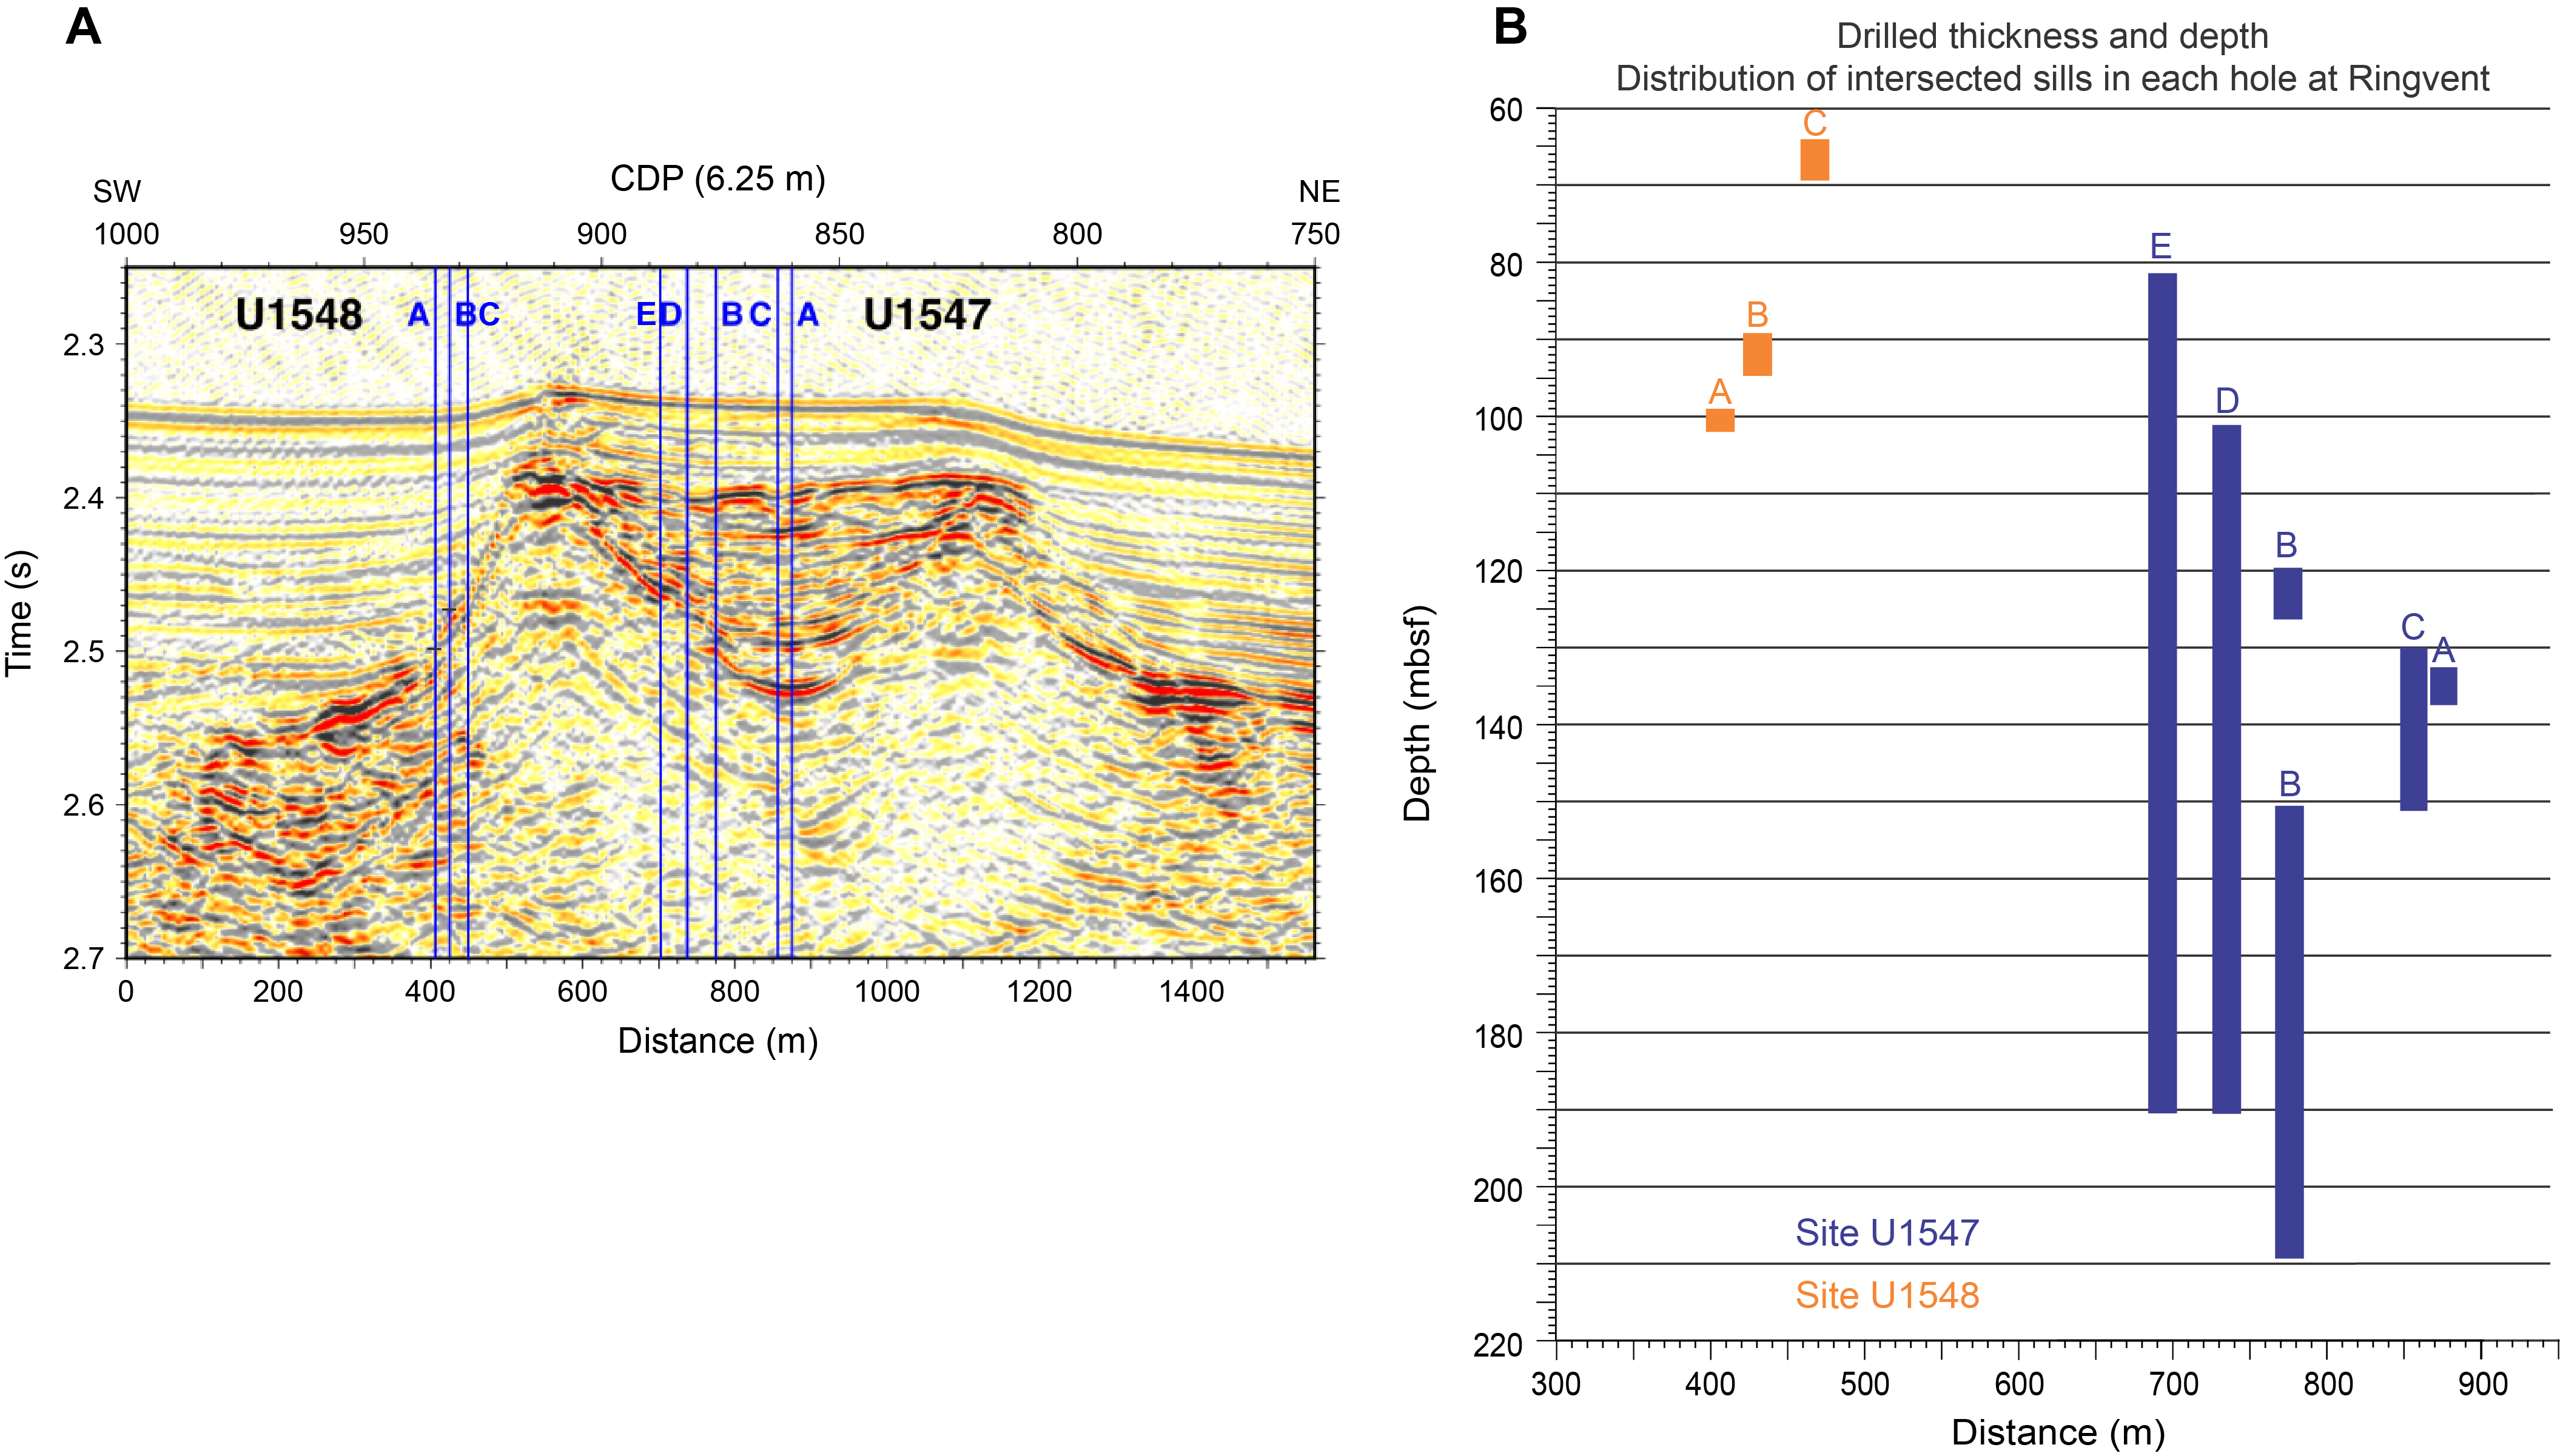
5.1. Igneous Lithologic Unit 1 (Site U1547)
5.1.1. Lithostratigraphic Subunit ID
- Intervals: 385-U1547A-26X-2, 0 cm, to 27X-1, 30 cm; 27X-2, 42–53 cm
- Depth: 132.75–136.6 mbsf (upper interval), 137.02–137.13 mbsf (lower interval)
- Drilled thickness: 3.85 m (upper interval), 0.11 m (lower interval)
- Recovery: 0.7 m (18%) (upper interval), unknown (lower interval)
- Lithology: hypabyssal mafic rock with basaltic texture and metasediment
- Age: middle Pleistocene or younger (younger than 0.29 Ma)
5.1.2. Lithostratigraphic Subunit IC
- Interval: 385-U1547B-23X-1, 0 cm, to 23X-2, 60 cm
- Depth: 119.80–125.49 mbsf
- Drilled thickness: 5.6 m (119.80–125.40 mbsf)
- Recovery: 0.69 m (12%)
- Lithology: hypabyssal mafic rock with basaltic texture
- Age: middle Pleistocene or younger (younger than 0.29 Ma)
5.1.3. Lithostratigraphic Subunit ID
- Interval: 385-U1547B-30X-1, 0 cm, to 50X-1, 74 cm
- Depth: 150.6–209.94 mbsf
- Drilled thickness: 59.34 m
- Recovery: 18.9 m (32%)
- Lithology: hypabyssal mafic rock with basaltic texture
- Age: middle Pleistocene or younger (younger than 0.29 Ma)
- Interval: 385-U1547C-7R-1, 11 cm, to 9R-2, 116 cm
- Depth: 130.11–152.16 mbsf
- Drilled thickness: 22.05 m
- Recovery: 6.66 m (30%)
- Lithology: hypabyssal mafic rock with basaltic texture occasionally mingled with sediment
- Age: middle Pleistocene or younger (younger than 0.29 Ma)
- Interval: 385-U1547D-4R-2, 0 cm, to 21R-3, 92 cm
- Depth: 101.41–191.38 mbsf
- Drilled thickness: 89.97 m
- Recovery: 34.74 m (39%)
- Lithology: hypabyssal mafic rock with basaltic texture occasionally mingled with sediment
- Age: middle Pleistocene or younger (younger than 0.29 Ma)
- Interval: 385-U1547E-4R-2, 0 cm, to 24R-3, 111 cm
- Depth: 81.5–191.2 mbsf
- Drilled thickness: 109.7 m
- Recovery: 44.5 m (41%)
- Lithology: hypabyssal mafic rock with basaltic and doleritic texture occasionally mingled with sediment
- Age: middle Pleistocene or younger (younger than 0.29 Ma)
All five holes at Site U1547 form a northeast–southwest transect over a distance of 200 m; Hole U1547A is situated in the center of Ringvent, and Hole U1547E is located ~120 m northeast of the closest hydrothermal vents (Figure F12A). The initially encountered depth of hypabyssal mafic rock decreases by ~50 m with decreasing distance to the hydrothermal mound, from ~132.8 mbsf in Hole U1547A to ~81.5 mbsf in Hole U1547E (Figure F12B). Hole U1547E penetrated almost 110 m of sill intrusion, representing the thickest sill section recovered during Expedition 385. The smallest thickness of a Site U1547 sill interval was encountered in the hole closest to the center of Ringvent (U1547A) where an interval of just ~4 m thickness was intersected. The bottom of this hole displays a few decimeters of sediment material. However, it is unclear whether this represents the sill-underlying sediment because there is intense drilling disturbance at the bottom of Hole U1547A. The structure of the intersected sill intrusion seems to be somewhat intricate, with Holes U1547A and U1547B including two individual sill sections separated by 0.4 m and 30 m of sediment, respectively. In contrast, the other three holes are characterized by one coherent mafic rock interval each, ranging from ~20 m (Hole U1547C) to ~110 m (Hole U1547E) in drilled thickness (Figure F12B).
Although the encountered upper interval of hypabyssal mafic rock in Hole U1547B is part of Lithostratigraphic Subunit IC, all other intersected sill intervals are part of Lithostratigraphic Subunit ID. The bottom sediment at the upper sill/sediment contact zone was never completely recovered at Site U1547. Nevertheless, in Holes U1547C and U1547E, pieces of (meta)carbonate rock (see Lithostratigraphy) make up the sedimentary layer adjoining the uppermost basaltic rock pieces. On the contrary, the other holes (Holes U1547A, U1547B, and U1547D) are marked by either diatom-rich silty clay/clayey silt or clay-rich diatom ooze close to the contact with the underlying sill and have a high degree of drilling-induced disturbance (see Lithostratigraphy). The top contact of the intersected sill intervals is usually indicated by a glassy margin with moderate to high vesicularity or, subordinate, a chilled margin with a highly vesicular, micro- to cryptocrystalline texture. There is no intersected sill section reflecting any mineralogic or sharp textural changes that would warrant establishing igneous subunits. Thus, within each hole, the sill makes up only a single Igneous Lithologic Unit 1.
5.2. Igneous Lithologic Unit 1 (Site U1548)
5.2.1. Lithostratigraphic Subunit IB
- Interval: 385-U1548A-19X-1, 0 cm, to 20X-1, 114 cm
- Depth: 99.4–103.04 mbsf
- Drilled thickness: 3.64 m
- Recovery: 1.6 m (44%)
- Lithology: hypabyssal mafic rock with basaltic texture
- Age: middle Pleistocene or younger (younger than 0.29 Ma)
- Interval: 385-U1548B-11X-3, 0 cm, to 12X-1, 100 cm
- Depth: 89.18–94.8 mbsf
- Drilled thickness: 5.62 m
- Recovery: 1.4 m (25%)
- Lithology: hypabyssal mafic rock with basaltic texture
- Age: middle Pleistocene or younger (younger than 0.29 Ma)
- Interval: 385-U1548C-8X-1, 14 cm, to 10X-2, 38 cm
- Depth: 64.74–69.55 mbsf
- Drilled thickness: 4.81 m
- Recovery: 4.54 m (94%)
- Lithology: hypabyssal mafic rock with basaltic texture
- Age: middle Pleistocene or younger (younger than 0.29 Ma)
At Site U1548, the three holes drilled immediately outside the perimeter of Ringvent intersected a hypabyssal sill intrusion along a southwest–northeast transect over a distance of 60 m. Hole U1548A is farthest away, and Hole U1548C is located just ~100 m southwest of the circular hydrothermal mound (Figure F12A). The initial encountered depth of hypabyssal mafic rock decreases by ~35 m with shorter distance to the hydrothermal mound, from 99.4 mbsf in Hole U1548A to 64.6 mbsf in Hole U1548C (Figure F12B). All holes were terminated after 4–6 m of sill penetration (Figure F12B), with no hole reaching the bottom contact to underlying sedimentary material.
All hypabyssal mafic rock encountered at Site U1548 is part of Lithostratigraphic Subunit IB. The top chilled contact with the overlying micrite-bearing diatom clay was only recovered in Hole U1548B at a curated core depth of 89.18 mbsf (interval 11X-3, 0 cm). In Hole U1548C, the sedimentary core section (7H-CC) directly above the top igneous rock section (8X-1) consists of siliceous clay (see Lithostratigraphy), and Hole U1548A yielded a highly disturbed sediment core of unidentifiable composition that preceded the uppermost sill section (19X-1). The top contact or margin of the intersected sill intervals is characterized by hyaloclastite (Hole U1548A), glassy margin of a moderately to highly vesicular aphyric aphanitic basaltic rock (Hole U1548B), or fine-grained igneous rock mingled with light gray sediment (peperite) (Hole U1548C) (see the visual core description sheets [VCDs] in Core descriptions). There is no sill section intersected that reflects any mineralogic or textural change. Thus, a single Igneous Lithologic Unit 1 has been assigned to the sill in each hole.
5.3. Petrographic description
In both Holes U1547A and U1547B, a shallower sill interval is separated from a deeper one by a sandwiched sediment layer. The former hole yielded a mafic body of ~4 m drilled thickness that is followed by just a decimeter thick igneous interval after penetrating ~0.6 m of sediment in between (Figure F13). The latter hole recovered two intervals separated by ~25 m of sediment. Its shallower igneous section revealed a drilled thickness of ~6 m, and the deeper section yielded a minimum thickness of almost 60 m when drilling was terminated within the sill at the deepest hole bottom depth of Site U1547 at ~210 m. Mineralogically, the upper and lower sill intervals in Holes U1547A and U1547B are very similar. The textural appearance is overall comparable, too. The glassy or cryptocrystalline, moderately to highly vesicular top margin of each hypabyssal mafic rock body, which has 1–5 mm large vesicles with low to highly elongate sphericity, usually starts to transition to a sparsely to moderately vesicular, occasionally plagioclase phyric texture with cryptocrystalline matrix ~1–3 cm below the contact. Only the top margin of the deeper sill body in Hole U1547B (Section 30X-1) at ~151 mbsf has a somewhat different texture, evident by fewer but individually larger and more spherical vesicles that are more often filled with carbonate and pyrite, in comparison to the shallower sill intervals. This texture, which is also on display in the Hole U1547C sill section, transitions to a sparsely to nonvesicular, aphyric, microcrystalline assemblage and is therefore slightly coarser than the shallower intervals in Holes U1547A and U1547B. The sill bodies that were penetrated over a thickness of ~92 m and ~110 m in Holes U1547D and U1547E, respectively, may form the continuation of the sill that makes up the bottom part of Hole U1547B (Figure F12B), being subject to an increasingly shallow depth of initial intersection from Hole U1547B (~151 mbsf) southwestward to Holes U1547D (~101 mbsf) and U1547E (~82 mbsf) (Figure F12). These sill bodies mainly consist of gray to dark gray aphyric to clinopyroxene-plagioclase phyric basaltic rock. In the deeper part of Hole U1547E (169.2–191.2 mbsf), greenish gray plagioclase-clinopyroxene phyric doleritic rock was recovered. The change from basaltic to doleritic texture in Hole U1547E was observed to be gradual.
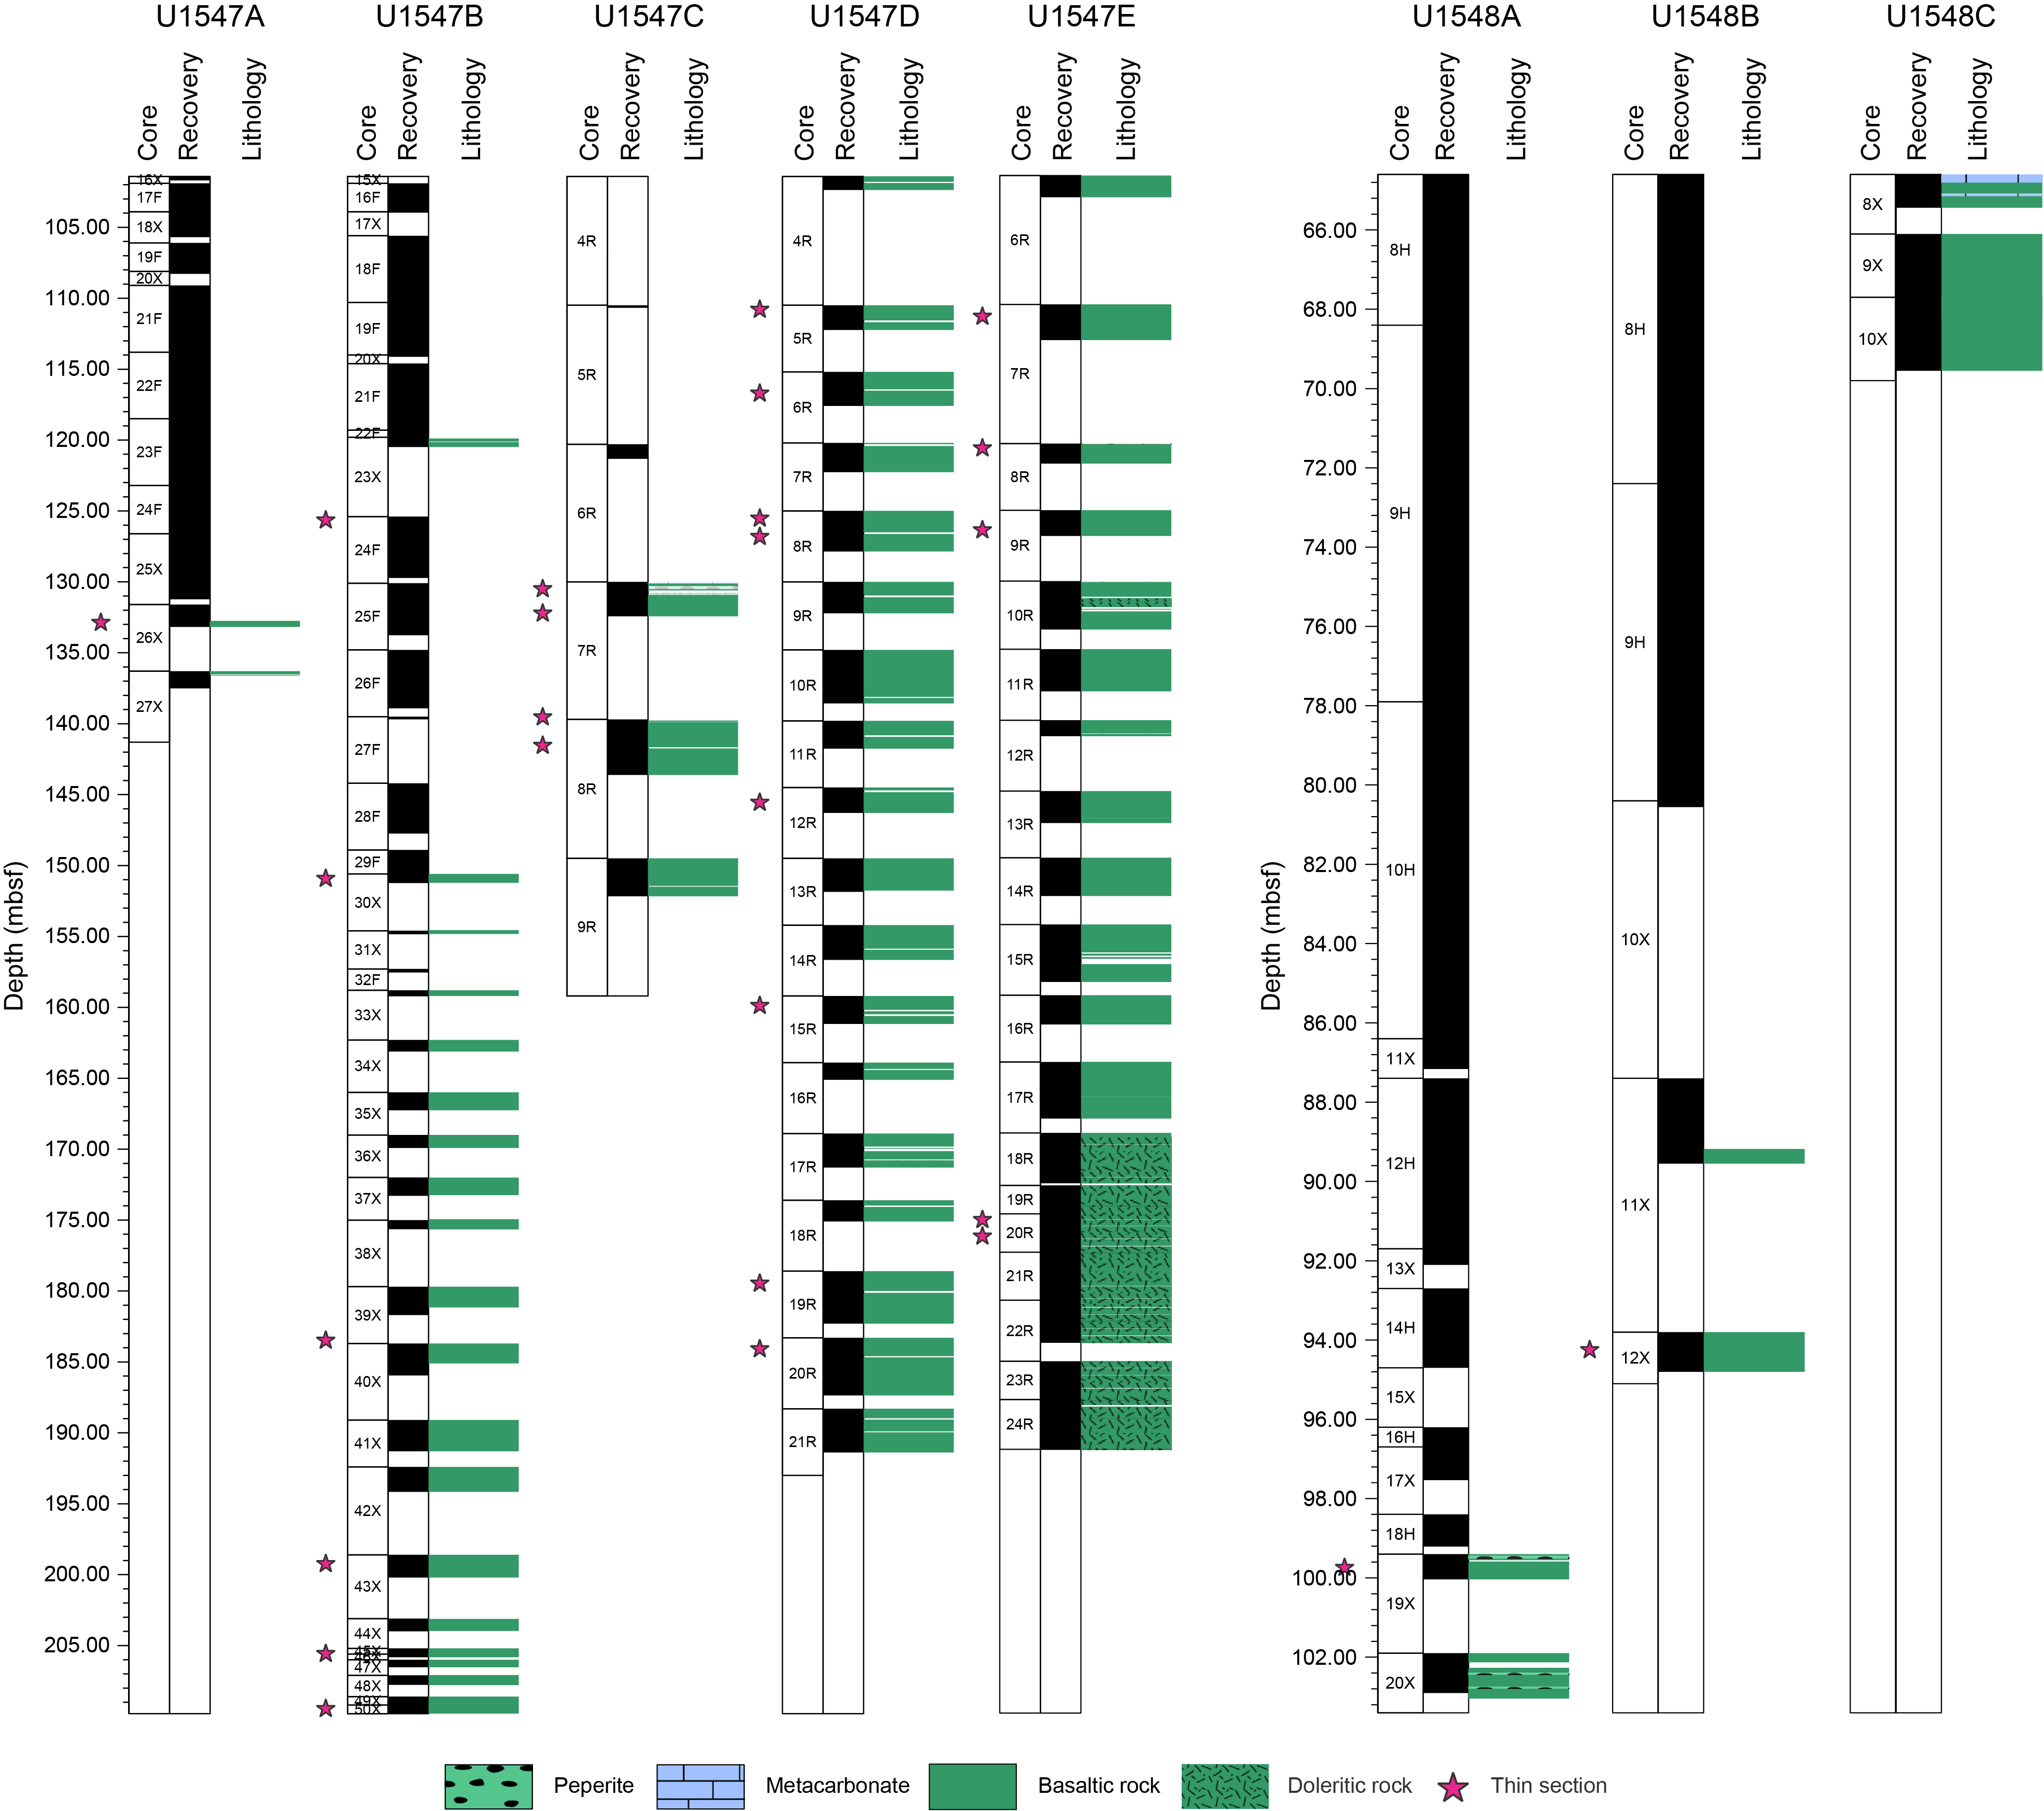
Mingling of sediment and basaltic rock is common in the hypabyssal intrusive bodies at Site U1547. Volcaniclastic rock (basaltic breccia) that represents igneous clasts hosted by sediment, forming so-called peperite, is a typical product of the interaction between magma and wet sediment that took place below the seafloor of Ringvent (Figure F14). Brecciated basalt also results from the same interaction (Figure F14). The interacting sediment is made up of carbonate, conglomerate, or chert (Figure F15). Fluidized sediment also injected the basaltic rock along cracks, forming sedimentary veins that are common at Site U1547, such as in Sections 385-U1547B-44X-1 and 385-U1547D-10R-1 and 10R-2 and in most basaltic cores in Hole U1547E (Figure F15). Occasionally, these veins are also filled with pyrite. They are usually surrounded by dark green halos and sometimes occur in association with glass margins throughout the basaltic intervals of the Site U1547 sills (e.g., Sections 385-U1547C-8R-1 and 9R-1, 385-U1547D-5R-1, and 385-U1547E-5R-1 through 13R-1) (Figure F14). There is an inhomogeneous vesicle distribution in the recovered mafic rock material. Nonvesicular intervals <5 m thick occur at the bottom of Holes U1547B, U1547D, and U1547E, and highly vesicular intervals also appear discontinuously throughout the upper and middle parts of every hole except the comparatively short sill interval in Hole U1547A (Table T6; Figure F16). Most of the recovered hypabyssal mafic rock shows sparse to moderate vesicularity with a 1–8 mm mode vesicle size. Vesicles are rounded (<1 mm) to highly elongate (>10 mm). In higher abundance, they always occur in association with chilled or glassy margins or fractures. Most vesicles are fully filled with white carbonate or partially filled with pyrite and bluish to white zeolite or phyllosilicate minerals.
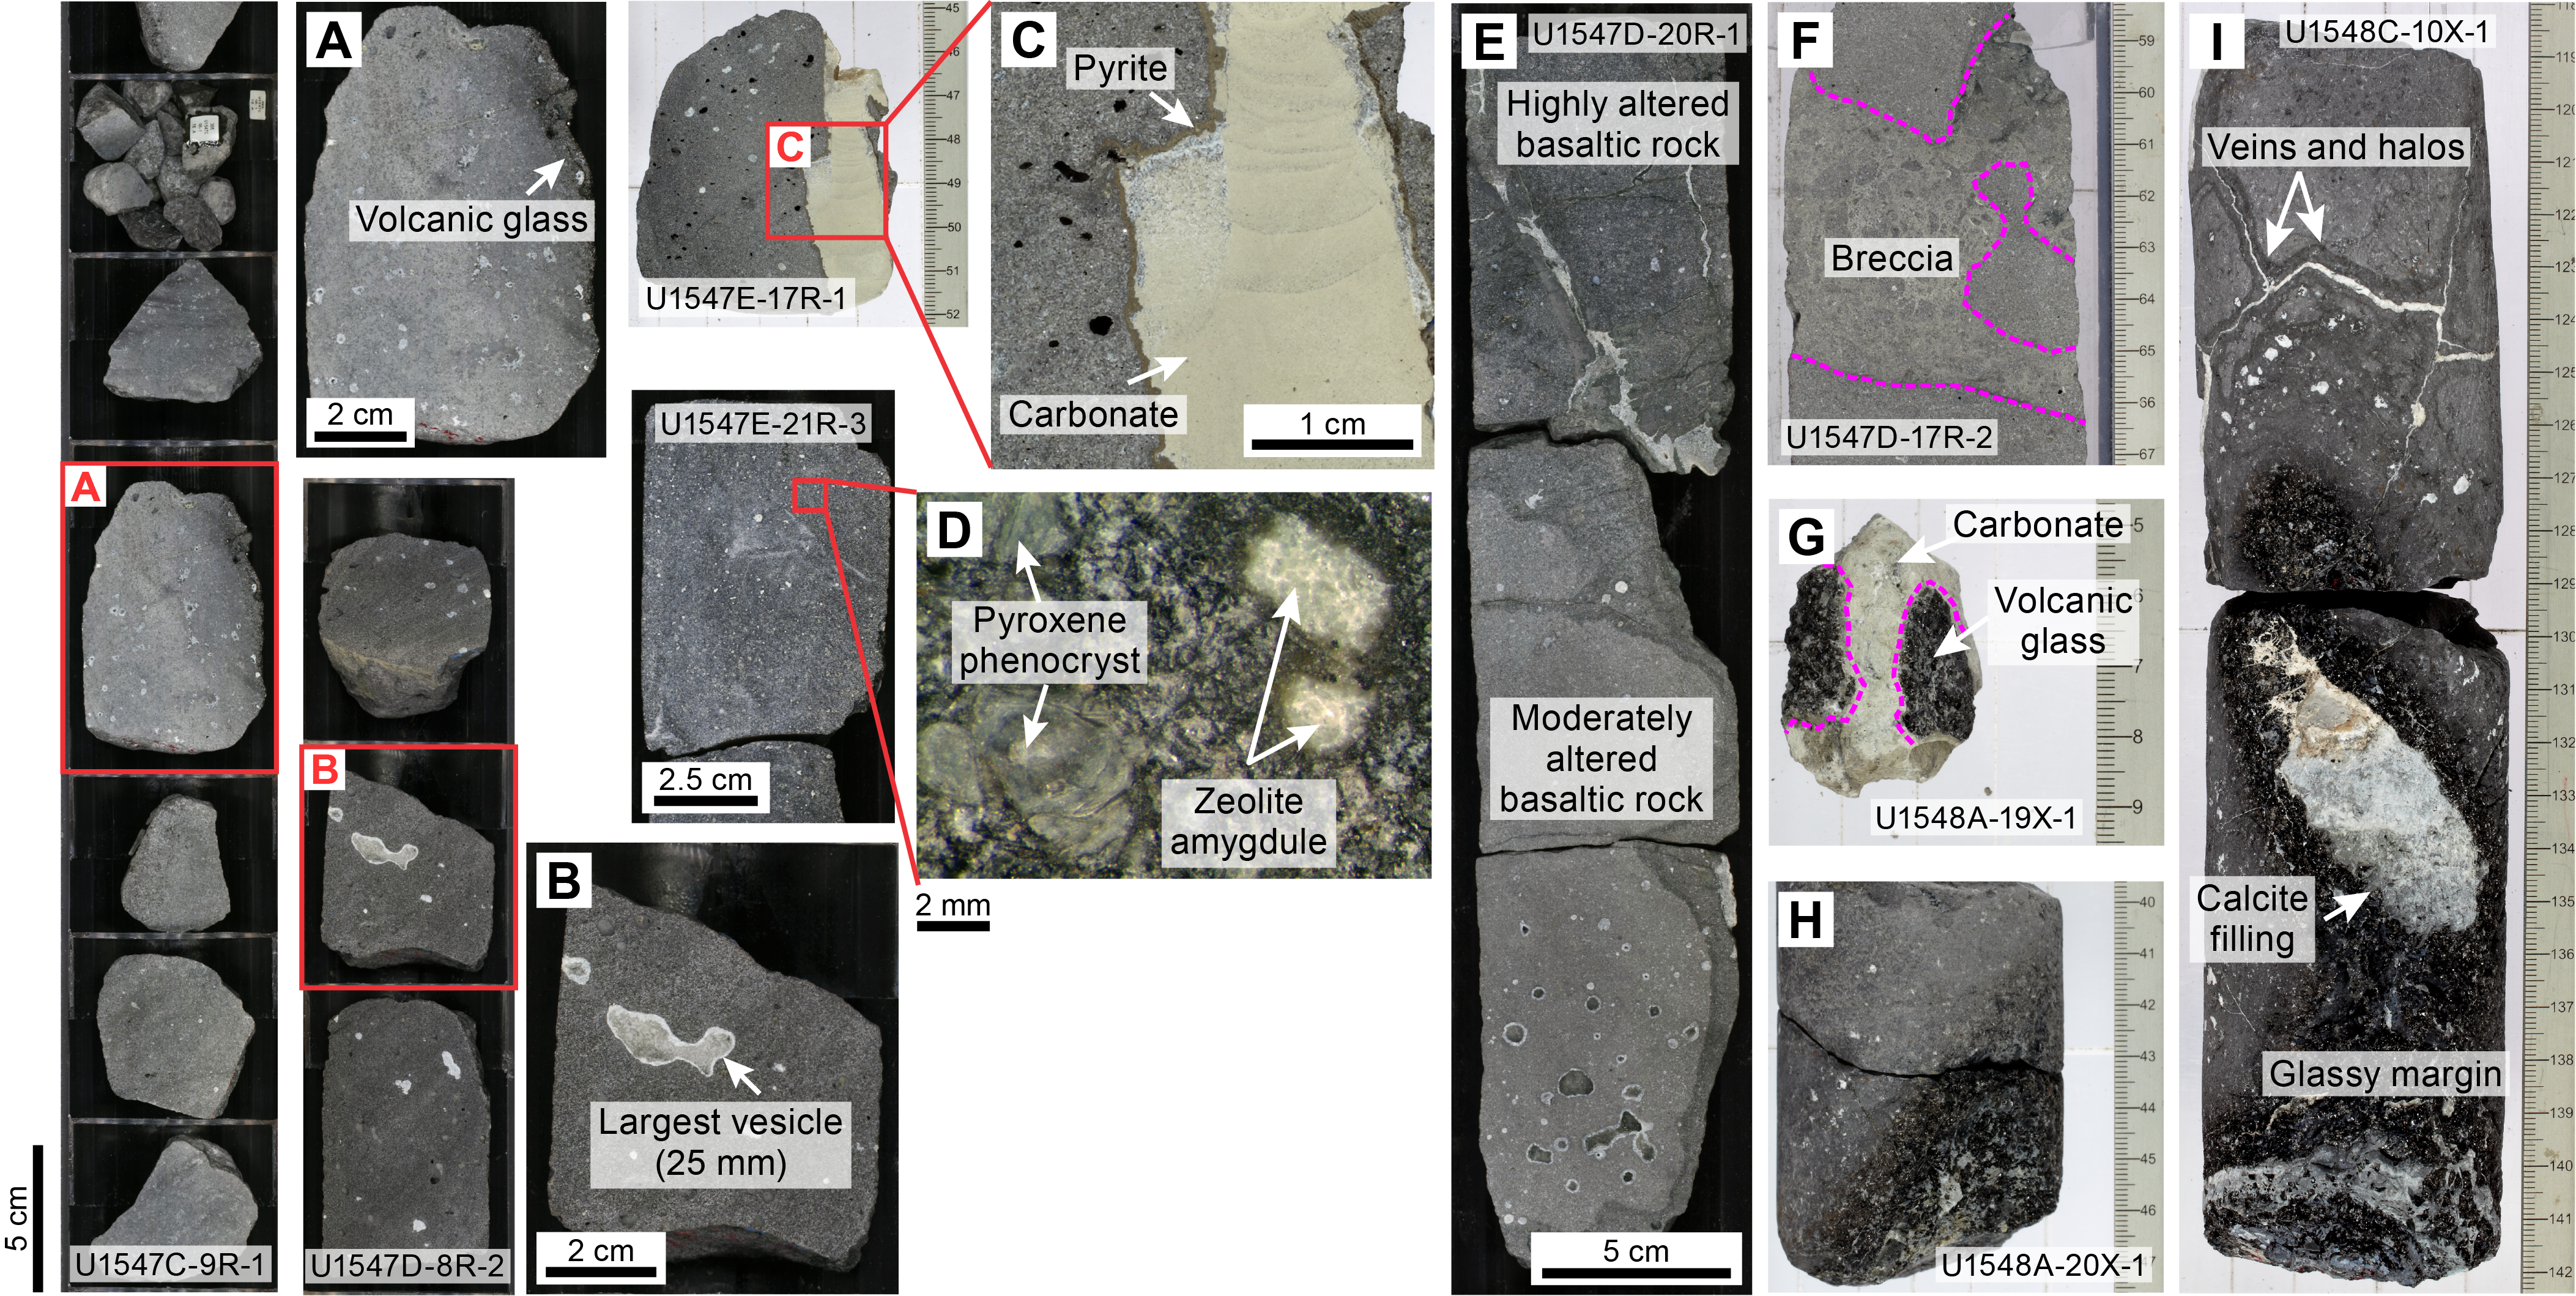
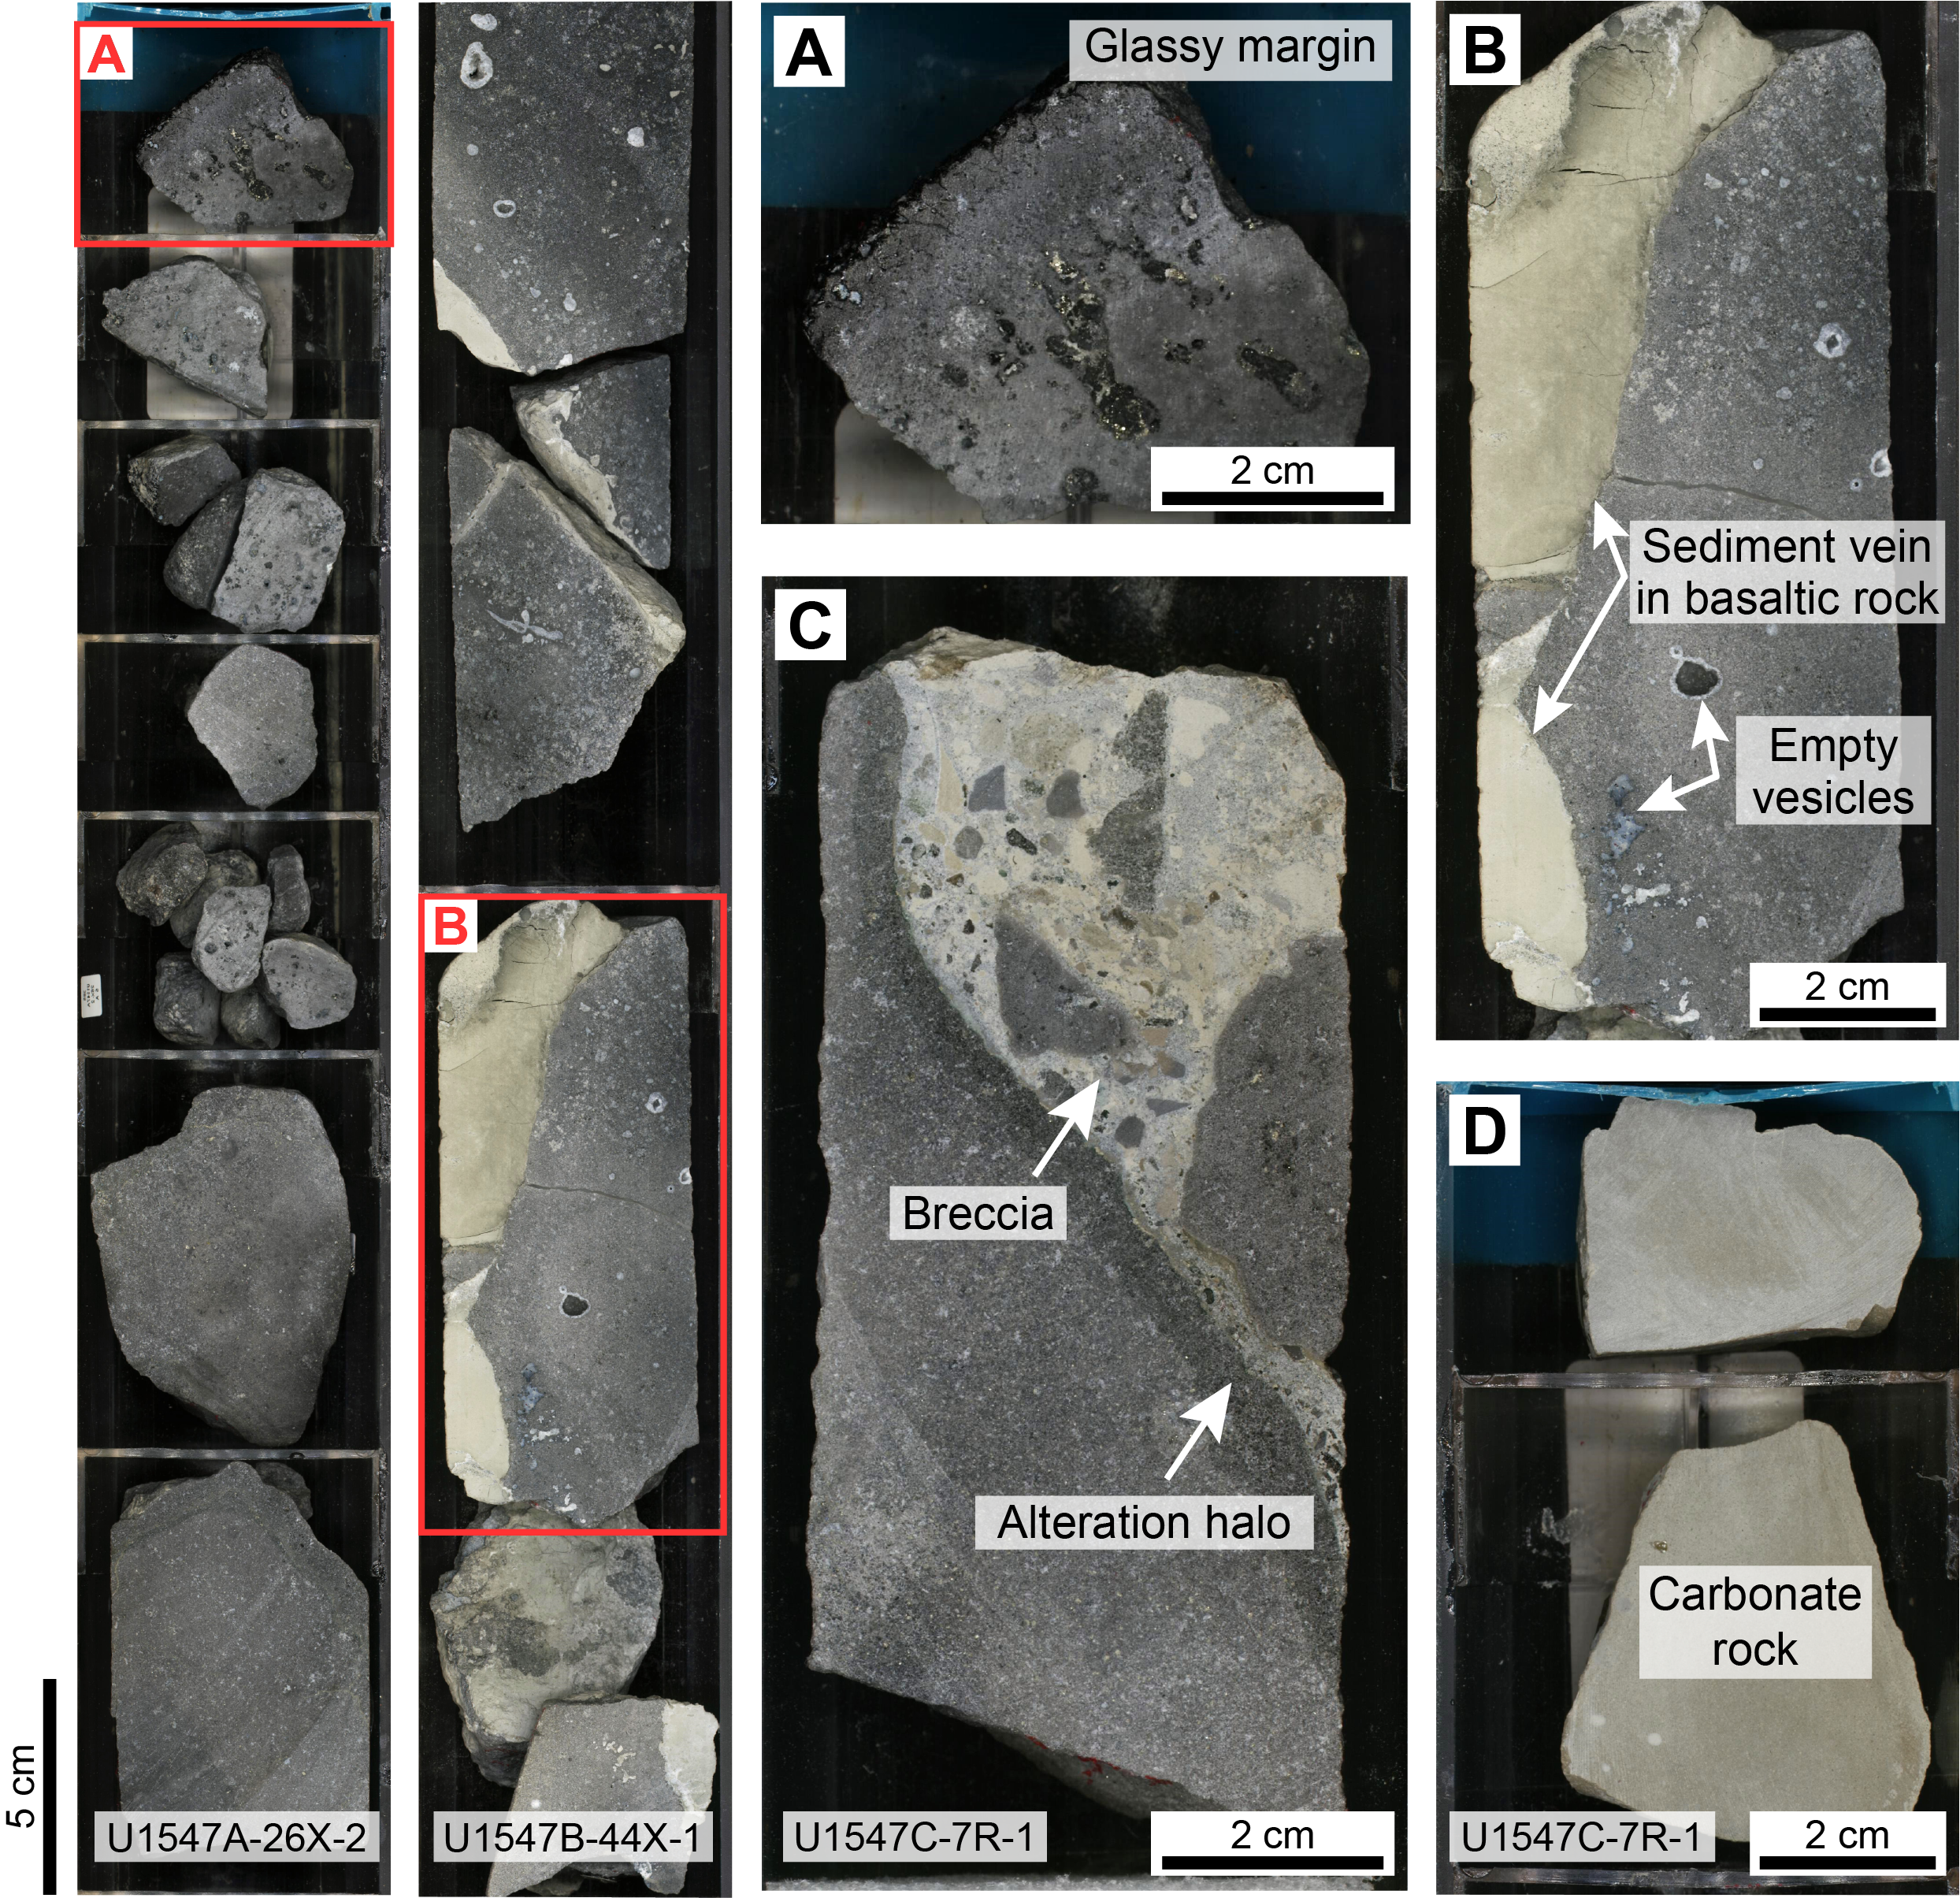
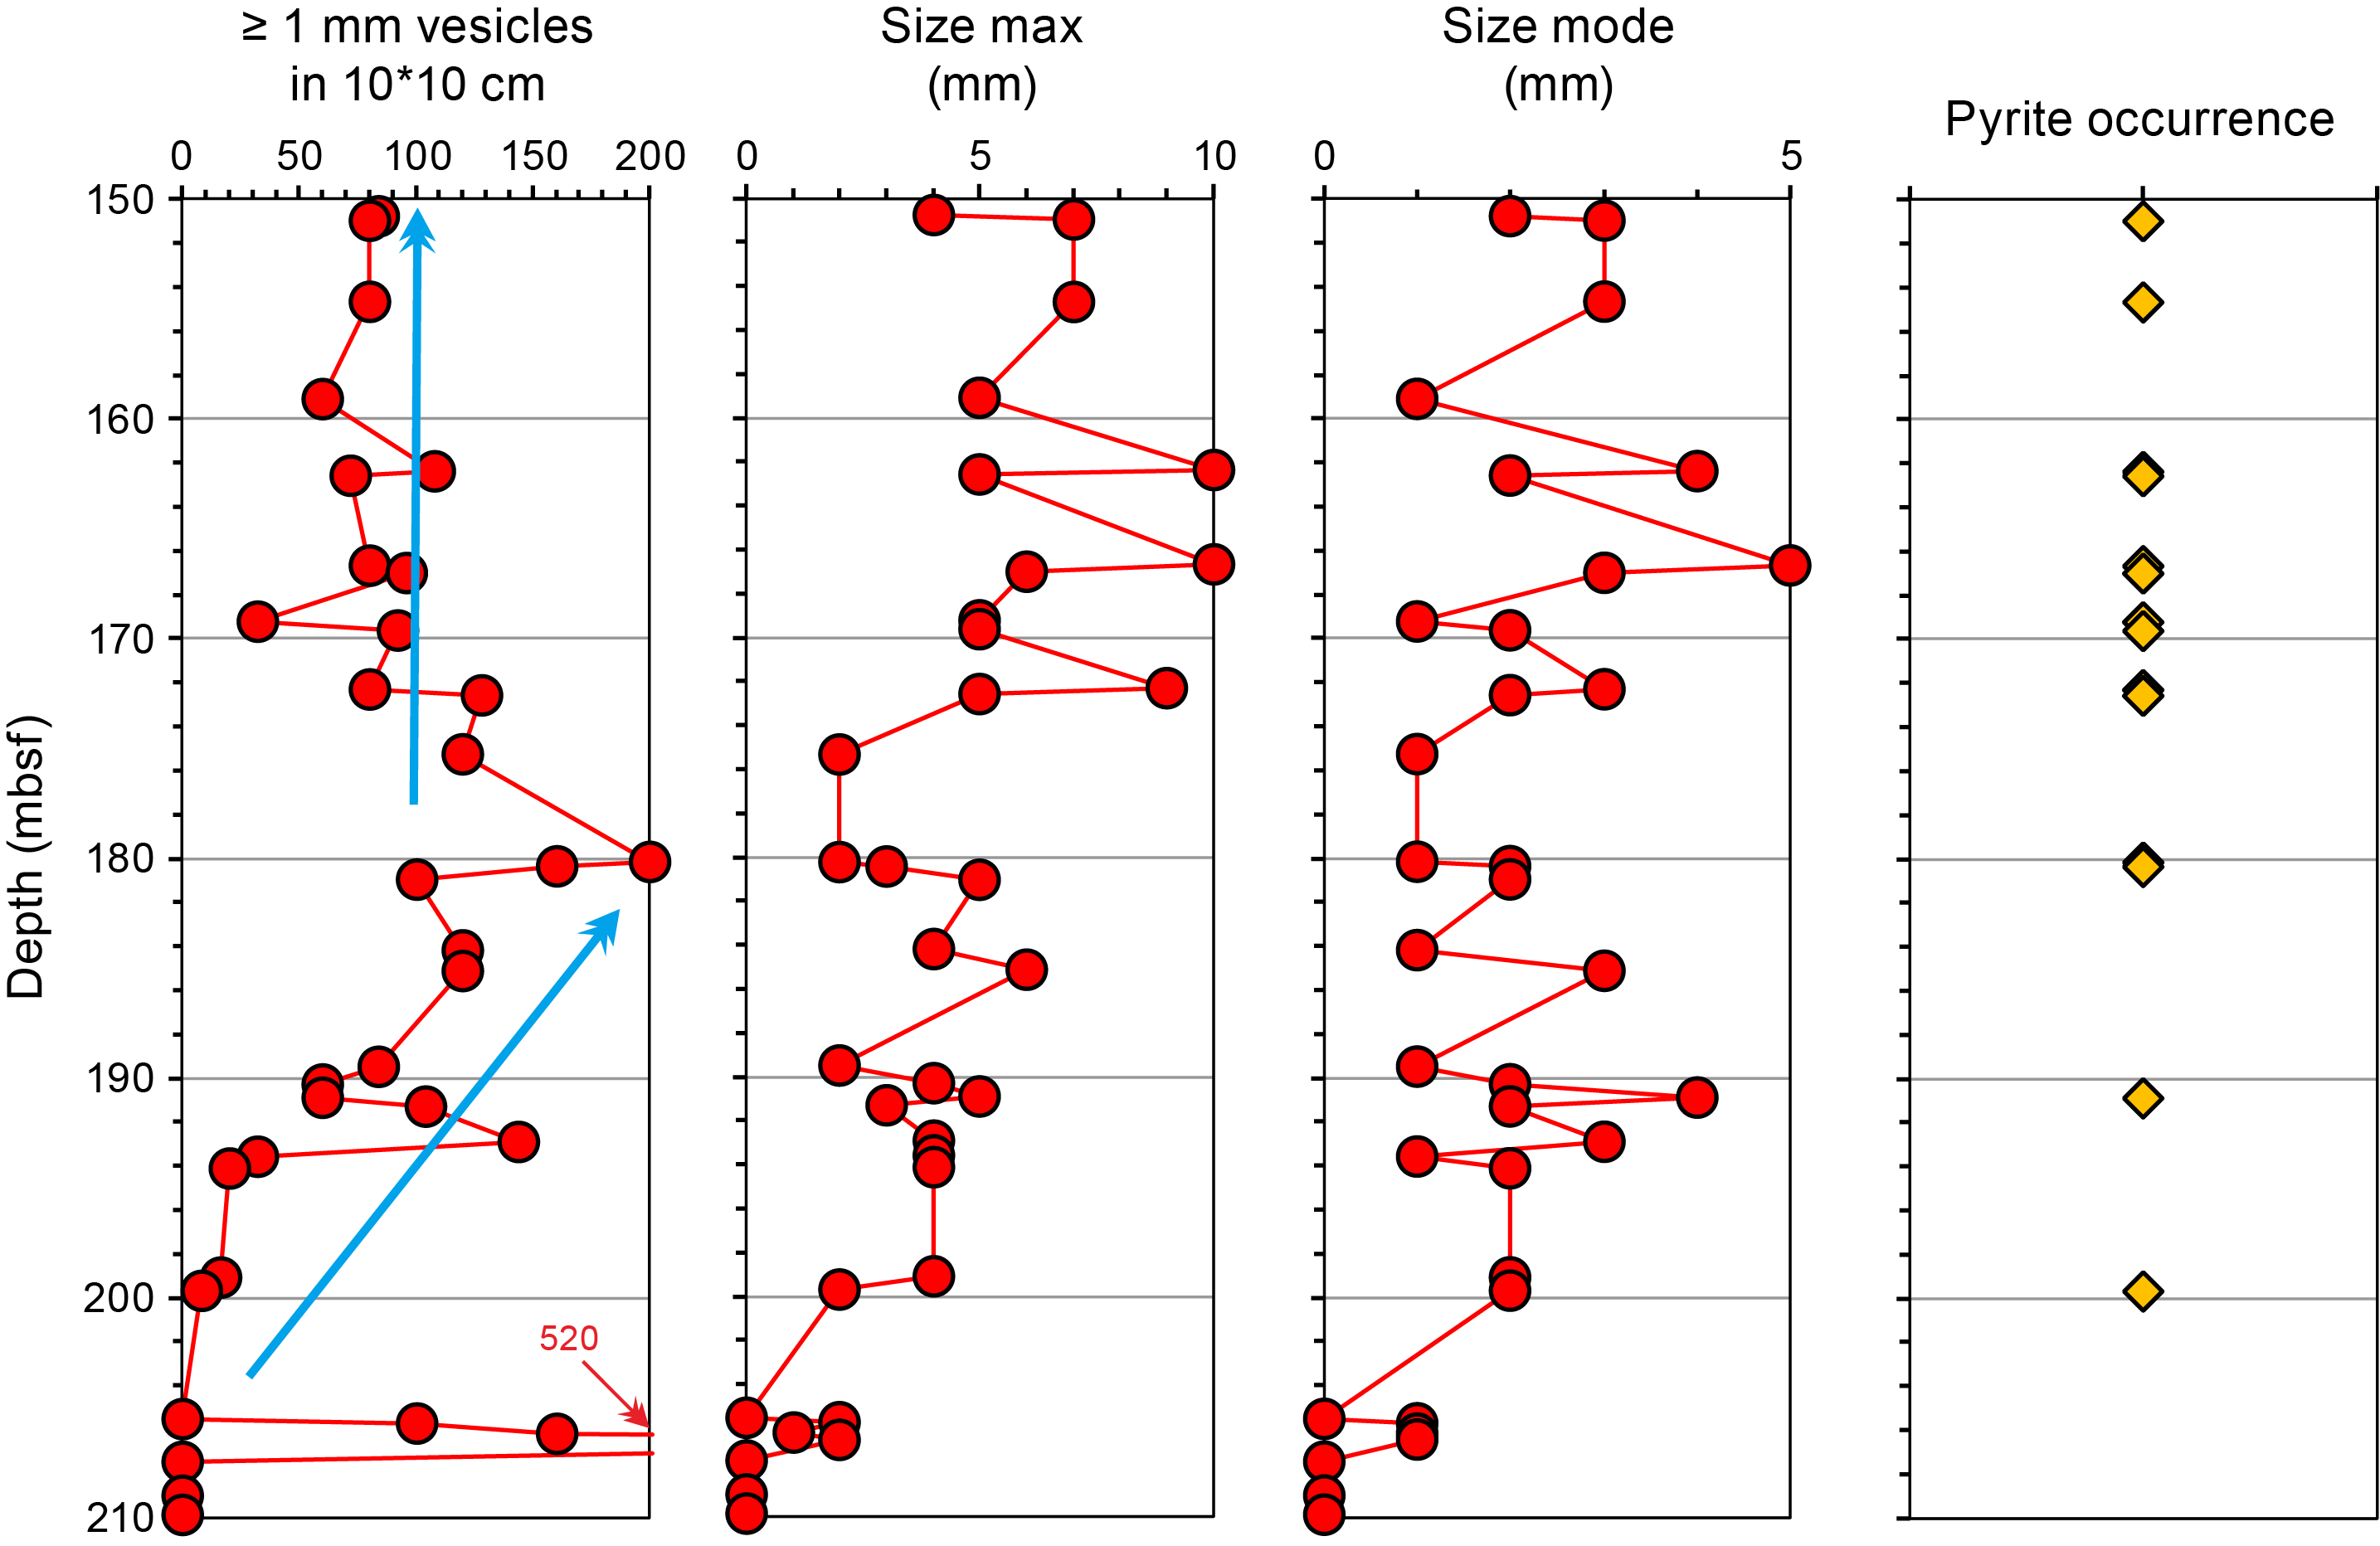
At Site U1548, the intersected hypabyssal sill material consists of dark gray, nonvesicular to sparsely vesicular, aphyric to moderately plagioclase phyric basaltic rock with a micro- to cryptocrystalline groundmass. Glassy and chilled margins along the interfaces of magma and sediment, mostly inside (all holes) but also at the top margin of the sill (Hole U1548B), along with sedimentary veins were observed in the upper portions of Sections 385-U1548A-19X-1 and 385-U1548B-11X-3 and throughout the portion of the sill drilled in Hole U1548C (Figure F14G–F14I). For example, interaction between wet sediment and magma is manifested by hyaloclastite occurrence (Figure F14G). Some glass is associated with sulfide and white to gray fine-grained minerals that are possibly made up of carbonate. The presence of glassy and chilled margins with brecciation of glassy and crystalline igneous clasts indicates interaction of magma with wet sediment, which is evident in recovered material up to 4.5 m below the top margin of the sill in Hole U1548C. When vesicularity is present, it shows 0.2–0.5 mm large subrounded, open vesicles along the glass margin. Few larger vesicles were found to be filled with white carbonate.
At the microscopic scale, aphyric basaltic, sparsely to moderately clinopyroxene-plagioclase phyric basaltic, and plagioclase-clinopyroxene phyric doleritic rocks show a well-preserved primary igneous mineral assemblage (plagioclase, clinopyroxene, and Fe-Ti oxides) and microtextures (e.g., glomeroporphyritic, subophitic, and intersertal) (Figure F17). The gray to dark gray clinopyroxene-plagioclase phyric basaltic rock contains 2–10 vol% acicular and lath-shaped, euhedral plagioclase phenocrysts (1–2 mm in size) and 1–2 vol% euhedral to subhedral-shaped clinopyroxene phenocrysts. Plagioclase glomerocrysts are also commonly present (Figure F17B). The felty, equigranular to inequigranular groundmass is very fine grained (≤0.5 mm) and displays euhedral to subhedral acicular plagioclase (~60 vol%) and subhedral stubby pyroxene crystals (~30 vol%). The greenish gray plagioclase-clinopyroxene phyric doleritic rock contains 3–5 vol% lath-shaped and euhedral plagioclase phenocrysts (1–2 mm) and 5–20 vol% euhedral to subhedral clinopyroxene phenocrysts (1–3 mm). This groundmass is texturally and mineralogically similar to the basaltic one but is somewhat more altered, indicating a slight to moderate overprint. Plagioclase mostly occurs as narrow, elongate tabular crystals in subophitic relationship with subhedral prismatic clinopyroxene in clinopyroxene-plagioclase phyric basaltic and plagioclase-clinopyroxene phyric doleritic material. Recovered equigranular to inequigranular aphyric basaltic rock is microcrystalline and composed of 50–65 vol% plagioclase and 30–40 vol% clinopyroxene. Vesicles from the three textural types of igneous rock (aphyric basaltic, phyric basaltic, and phyric doleritic rock) are generally rounded to subrounded. The presence of small (<0.5 mm) secondary pyrite crystals in the groundmass (Figure F18A–F18B) or inside vesicles was observed in almost all core sections, which indicates sulfur-retaining hydrothermal alteration under chemically reduced condition. Brecciated basalt is present as peperite facies, indicative of sediment injection or mingling. Brecciated basalt consists of rounded and angular clasts of hyaline and hypocrystalline basaltic material embedded in an indurated sediment matrix. Some fossils and altered glass (palagonite) were found in peperite (Figure F17E–F17F).
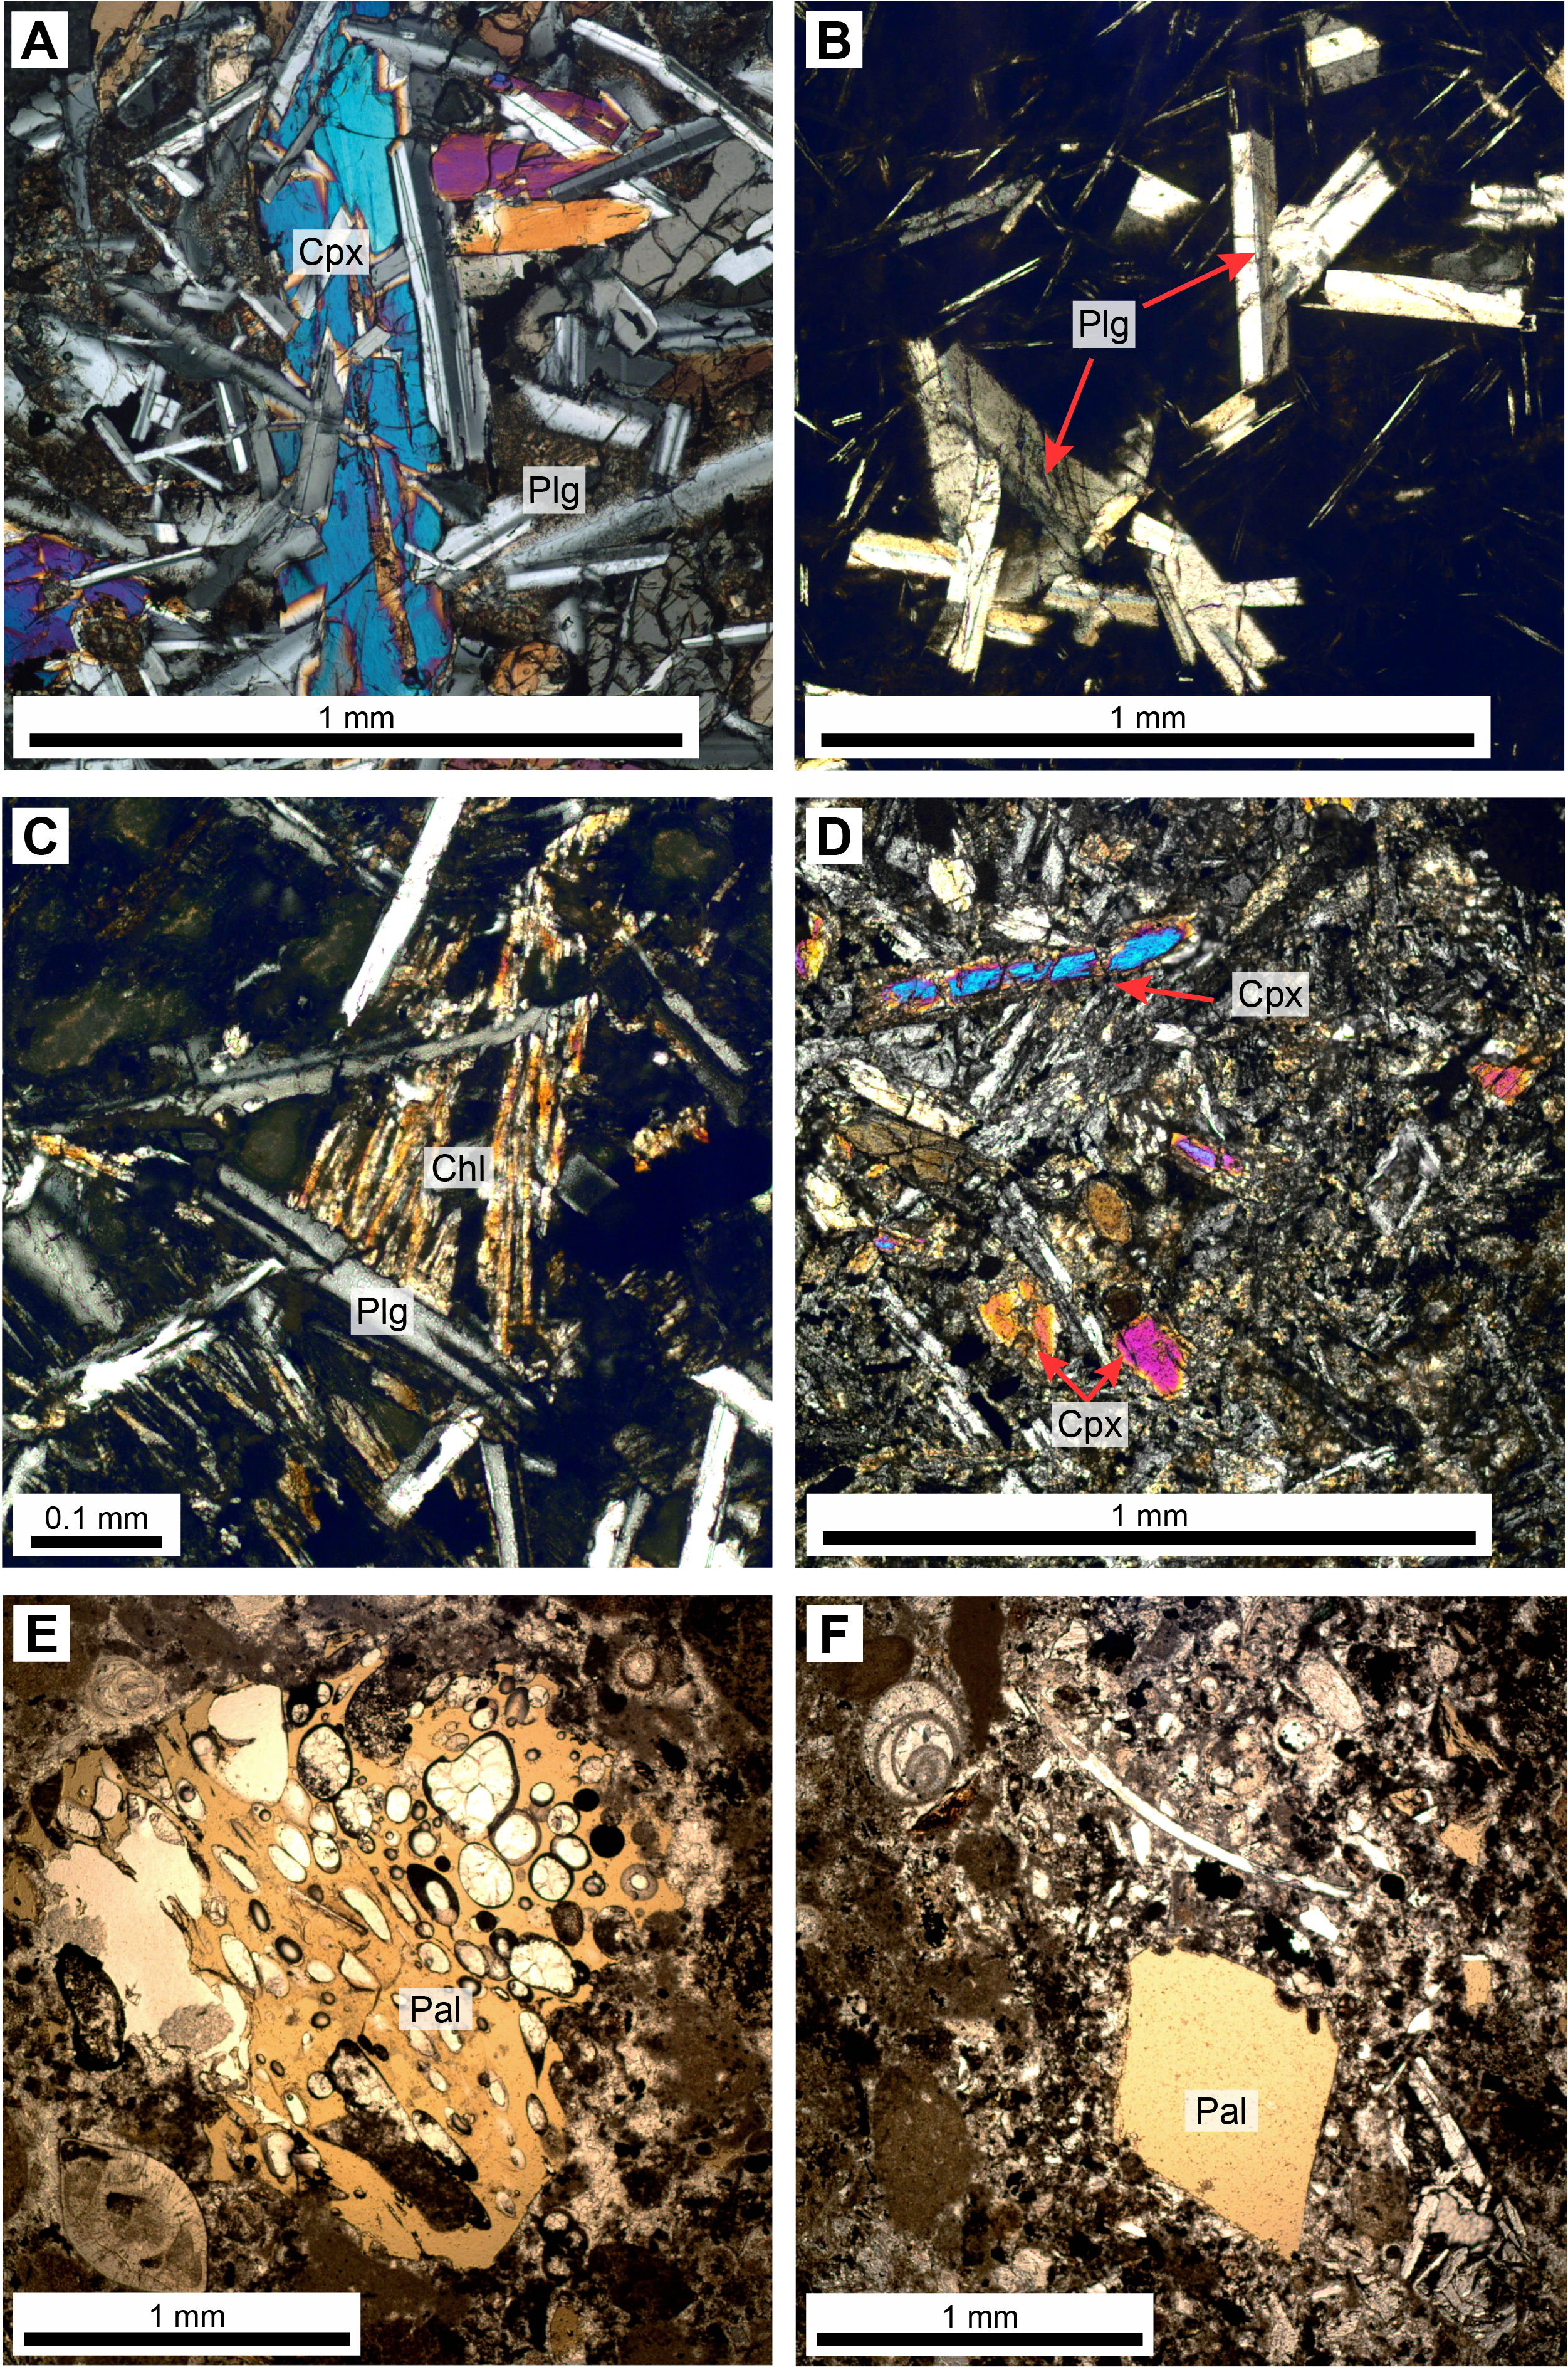
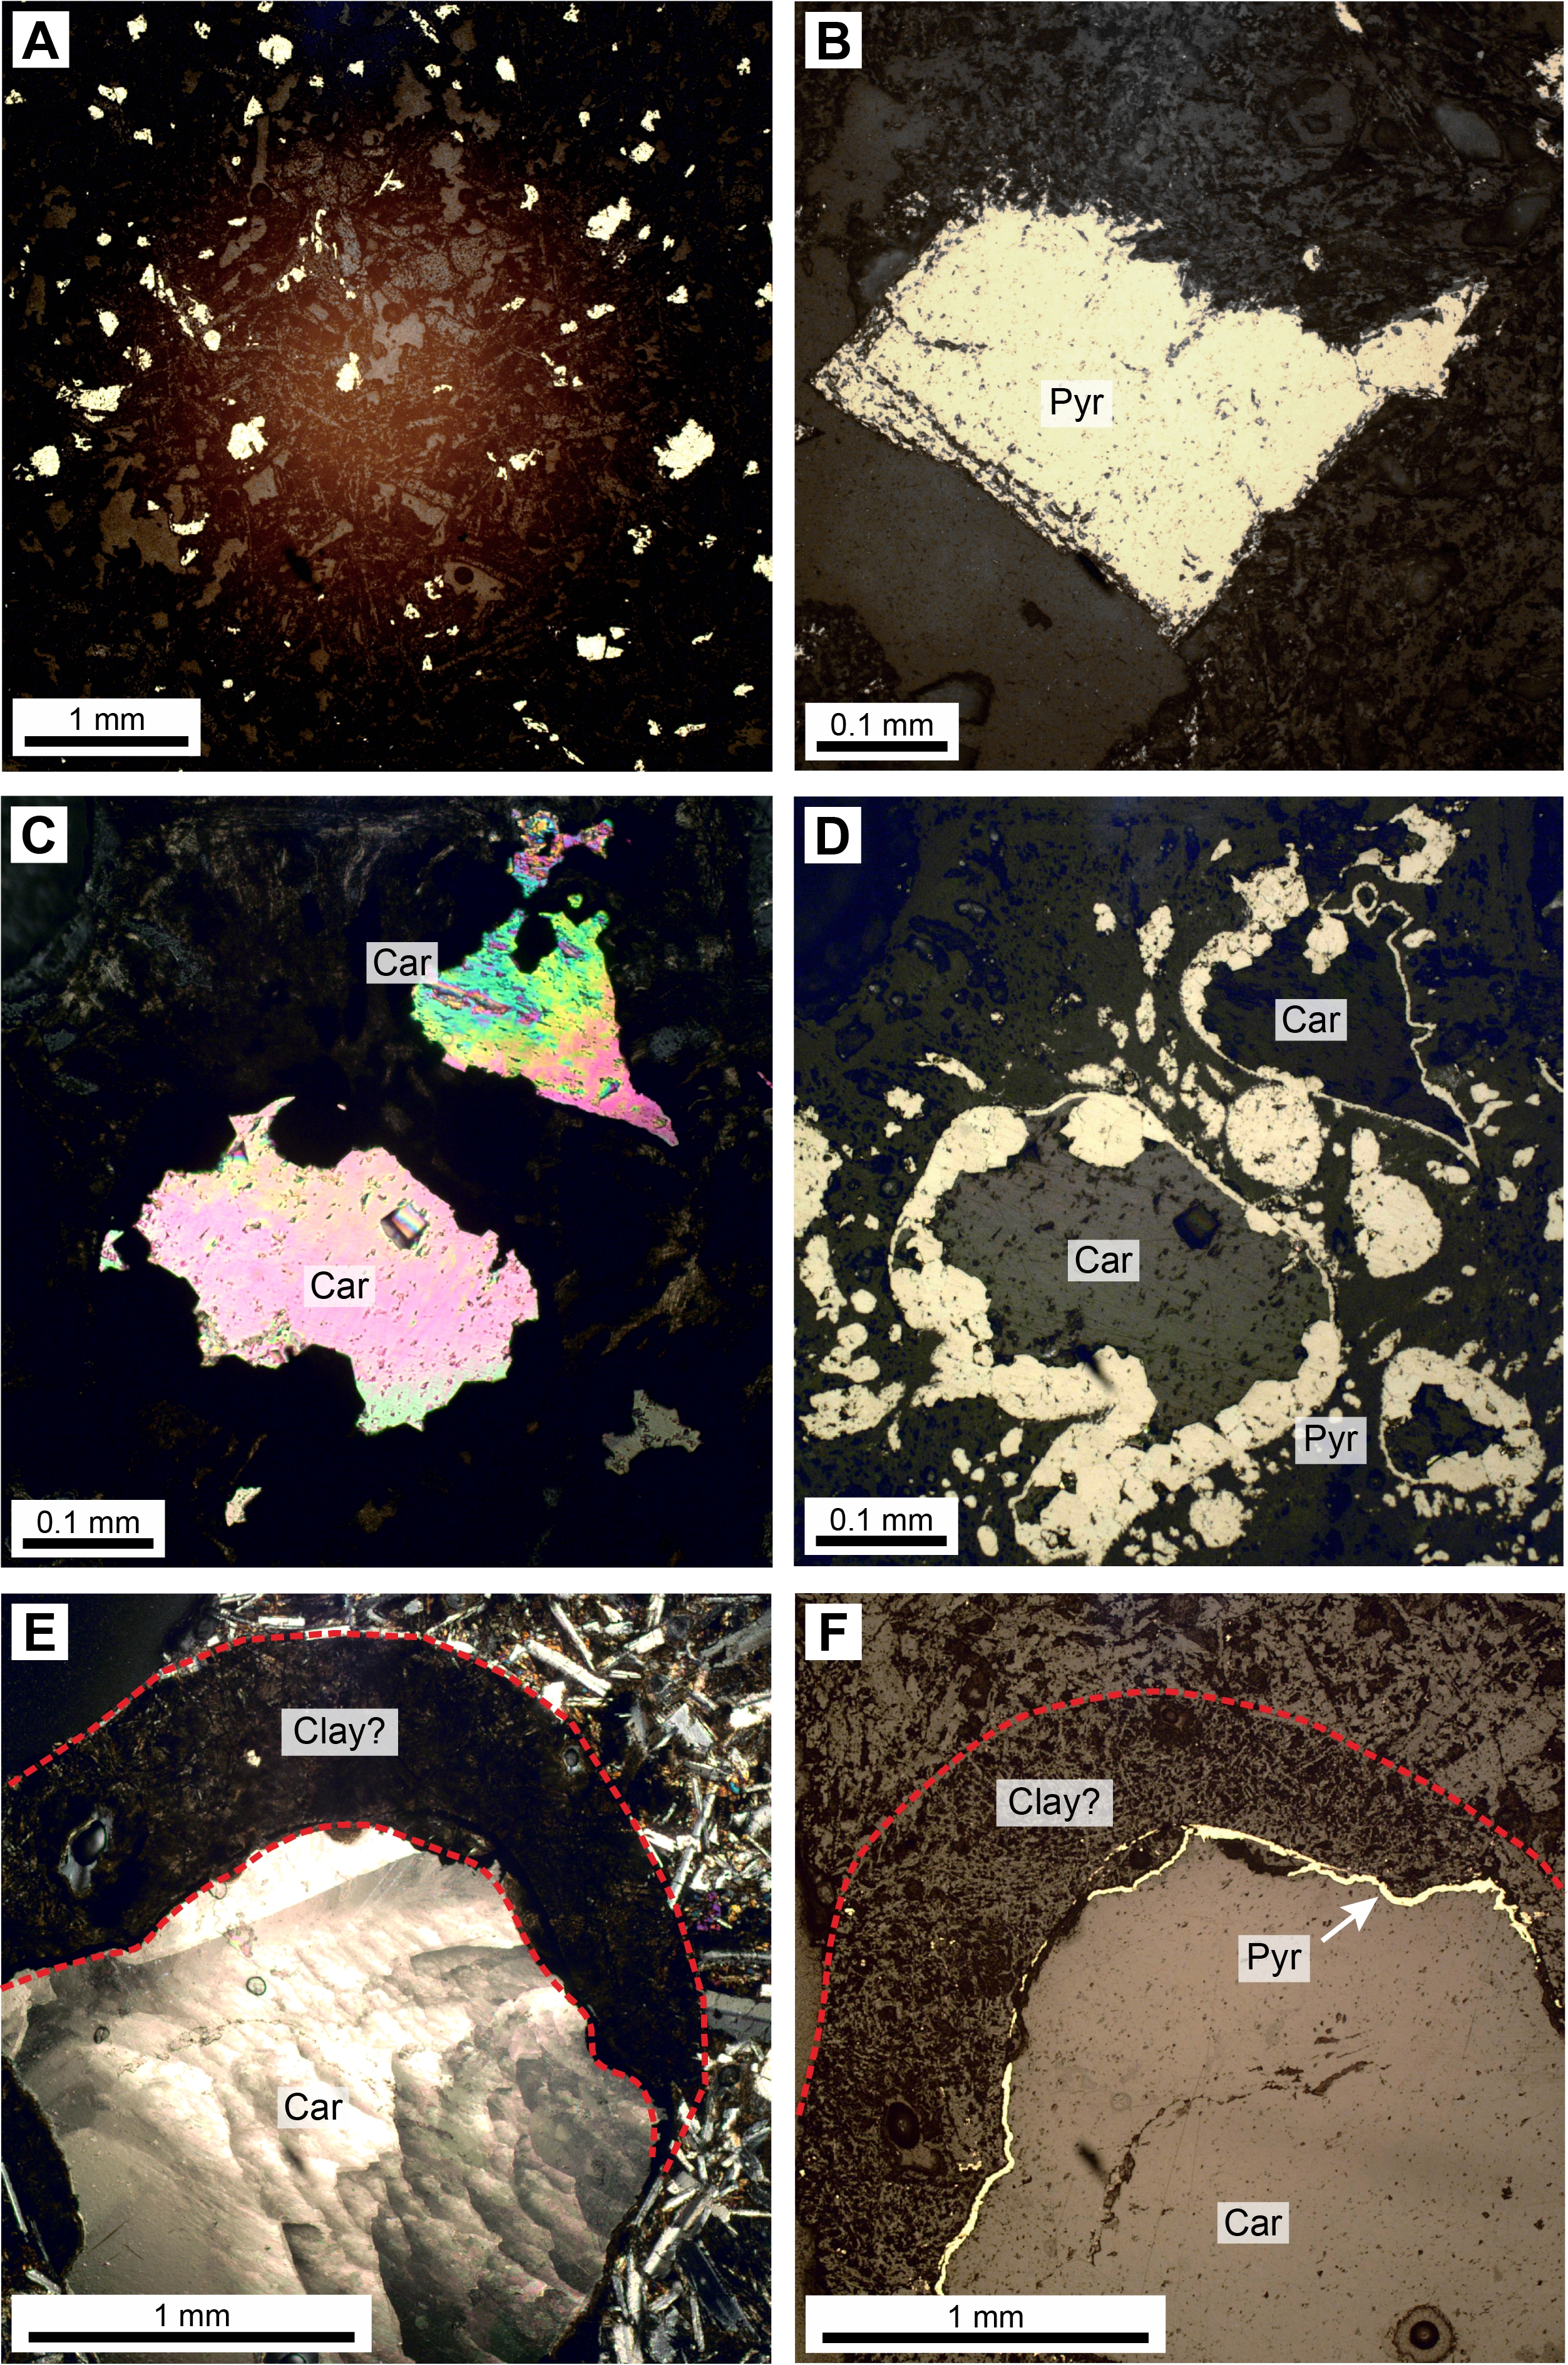
5.4. Alteration and veins
A large variation in alteration degree was observed amongst the recovered sections from different holes. In Holes U1548A–U1548C and in the shallower interval in Hole U1547B, a moderate alteration transitioning to a highly altered top margin is present. In deeper sill intervals in Holes U1547A–U1547E, most sections are slightly to moderately altered. A high degree of alteration occurs in Sections 385-U1547B-45X-1 and 46X-1, 385-U1547C-7R-1 and 9R-2, 385-U1547D-7R-2 through 9R-2 and 14R-1 through 17R-2, and 385-U1547E-8R-1 through 12R-1. The slightly to moderately altered basaltic rock always shows patchy or infilling texture, whereas the highly altered basaltic material always displays patchy or coating textures. Some alteration is fracture controlled as demonstrated by veins or chilled margin halos. Plagioclase crystals from both aphyric and phyric basaltic rocks are slightly to moderately altered to sericite, and clinopyroxene is commonly partially altered to chlorite and secondary magnetite (Figure F17C–F17D). Some clinopyroxene crystals from the highly altered basaltic intervals remain as pseudomorphs that are totally replaced by secondary chlorite or fine-grained magnetite and clay minerals. Pyrite populates the groundmass and alteration halos of chilled margins, and it is generally more abundant in the vesicles of these halos. Occasionally, vesicles are more abundant in alteration rims of chilled margins or at the glass margins. Generally, from the rim to the center of the filled vesicles (Figure F18C–F18F) there are fine-grained clay minerals or sulfide (initial filling), pyrite (second stage of precipitation), and late-stage carbonate (e.g., calcite and dolomite).
Veins are commonly found throughout the basaltic intervals of sills in every hole. The veins are mostly <0.2–2 cm wide with widely ranging but no preferred dipping angles. Different veins are identified as uniform, composite, dendritic, banded, and haloed, and they have vuggy, polycrystalline, or massive textures. Many veins are isolated or occur as single entities, whereas some are branched. There are many haloed veins that have diffuse boundaries or are filled with white carbonate, pyrite, and chlorite from center to rim. Sedimentary veins represent an abundant phenomenon at the two sites.
5.5. Petrographic discussion
The basaltic rocks recovered in the Ringvent holes are mostly aphyric and plagioclase phyric and have moderate to high vesicularity, showing variable degrees of alteration. Plagioclase-clinopyroxene phyric doleritic rock is greenish gray and only appears in the lower part of Hole U1547E (169.2–191.2 mbsf). There is a frequent presence of glassy and chilled margins, injected (fluidized) sediment forming veins, an appearance of peperite, and hyaloclastite as manifestation of variable sediment-magma interaction at different depths as well as highly vesicular sections. Small pyrite crystals (<0.5 mm) are present as vein and vesicle filling as well as groundmass mineral in basalt. This indicates sulfur-rich hydrothermal activity under chemically reduced conditions. Pyrites are closely associated with calcite-filled vesicles, which are partially well preserved (e.g., Section 385-U1547C-34X-1) (Figure F19).
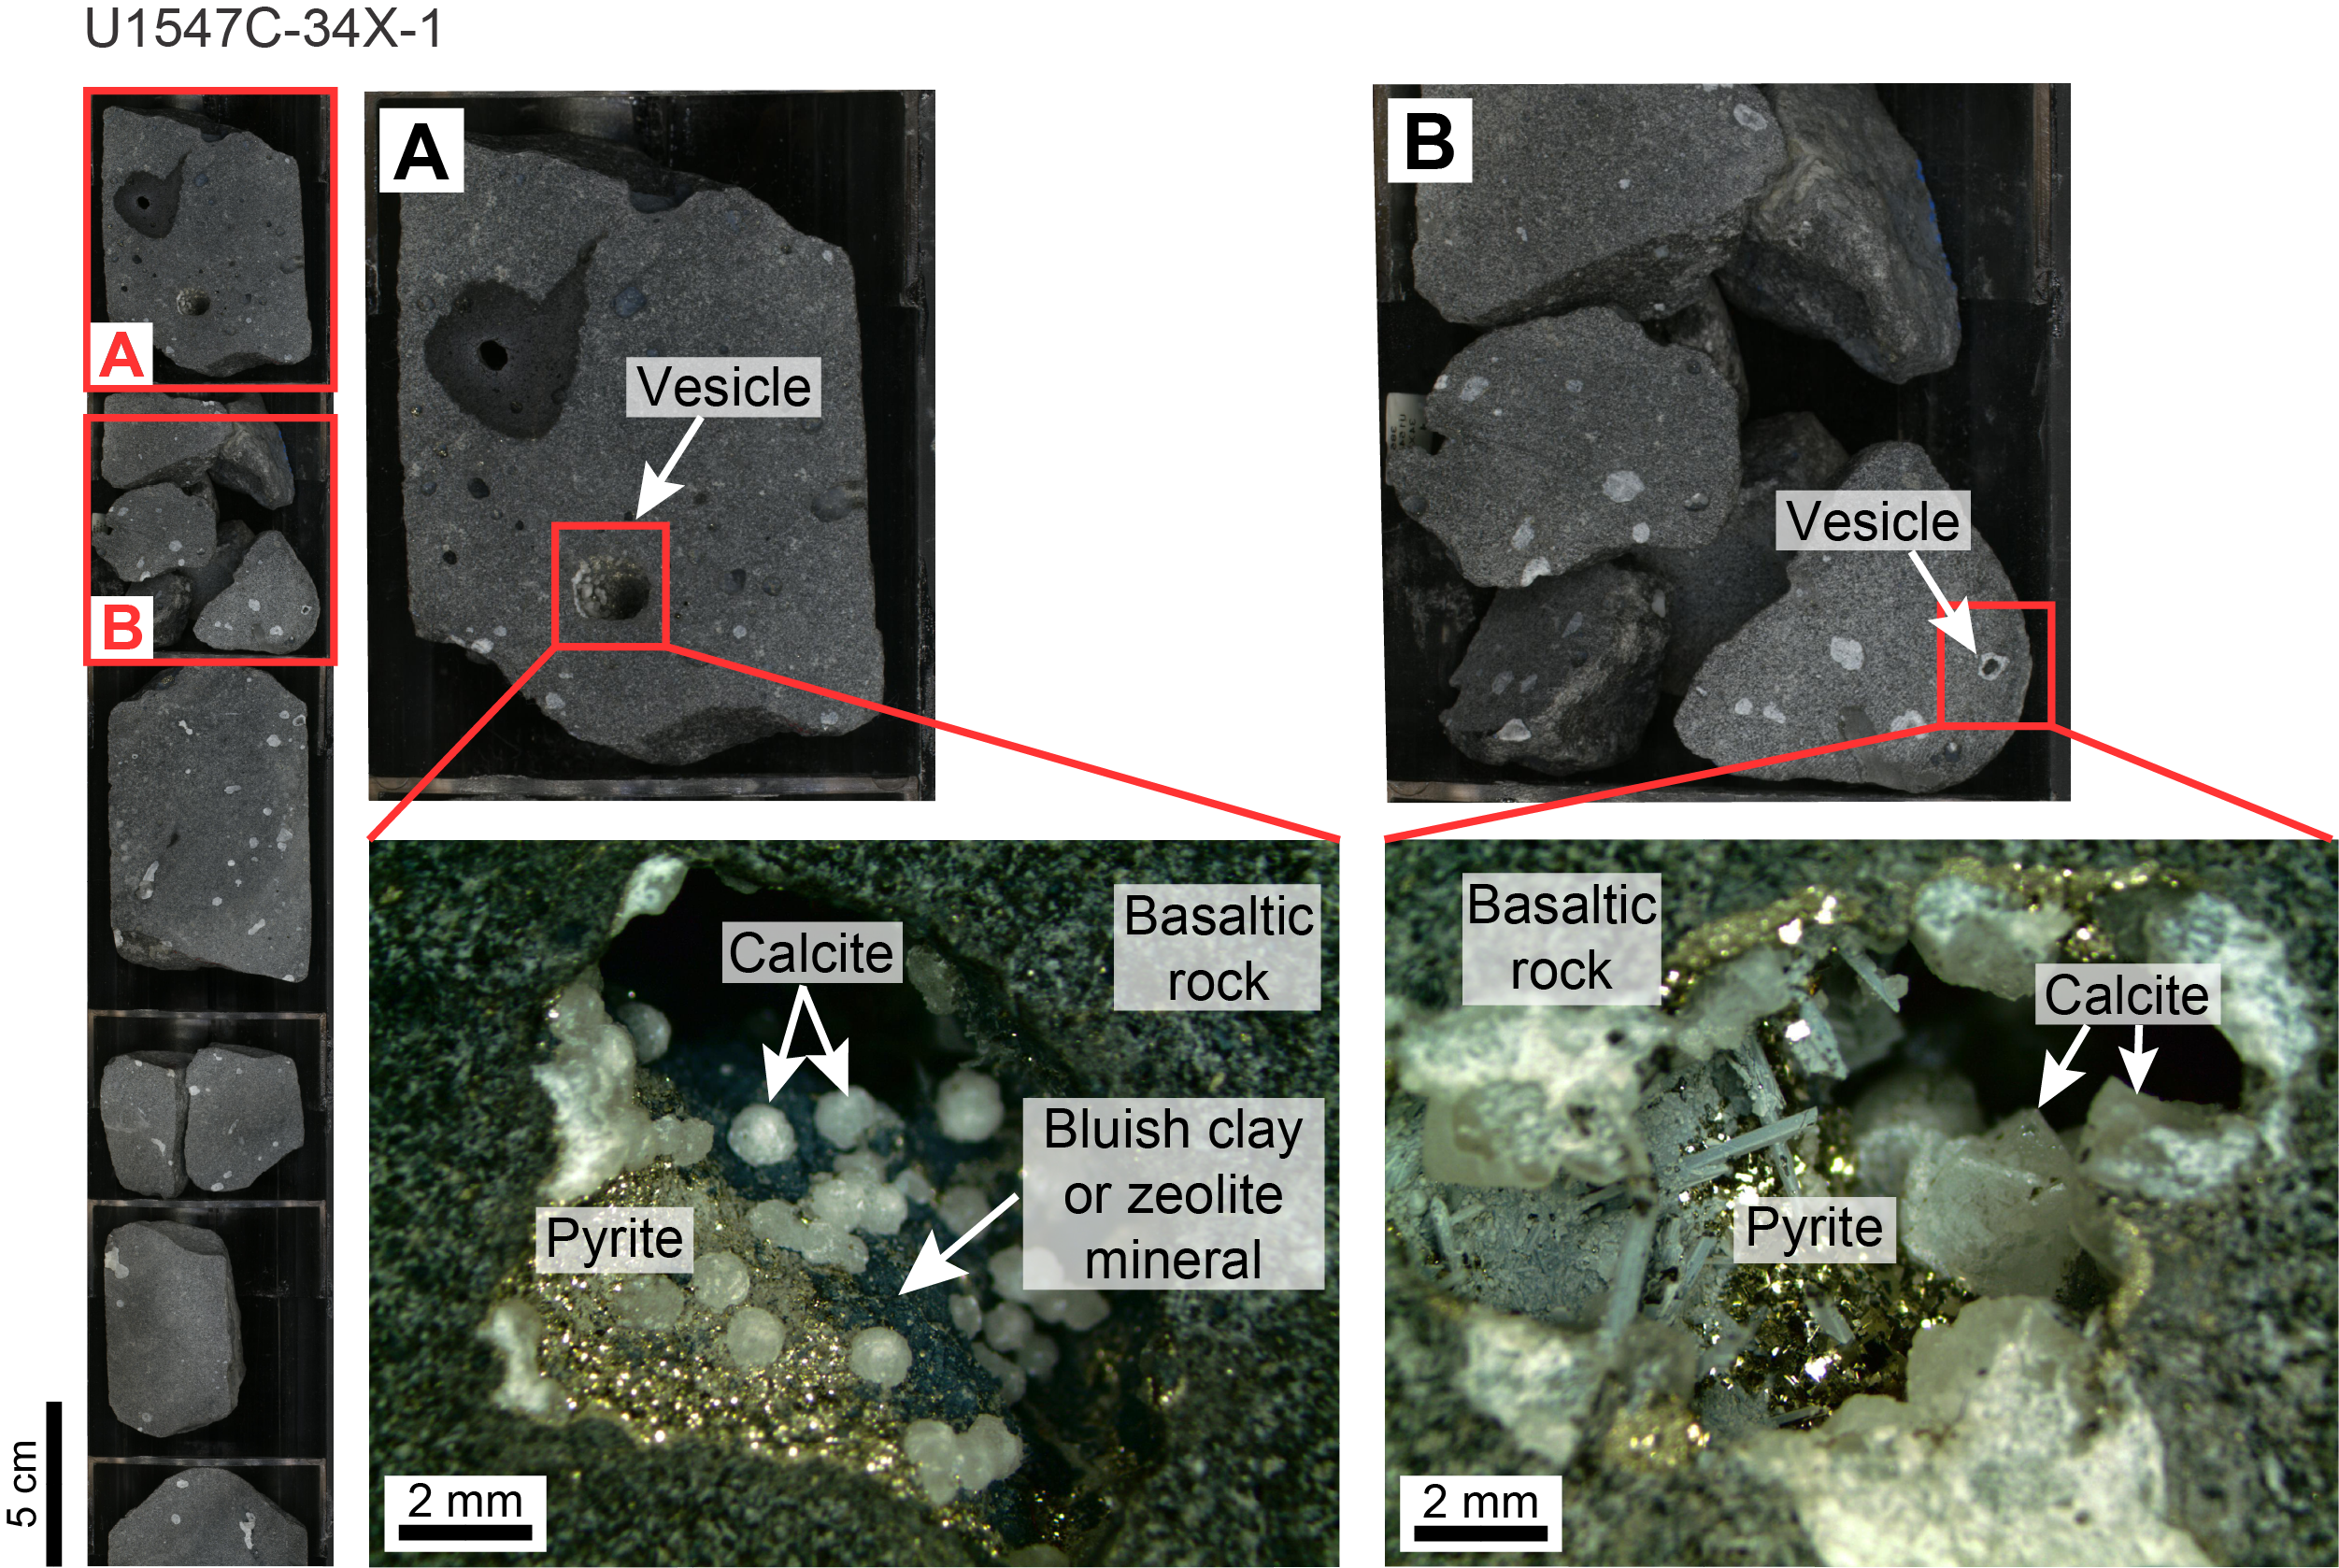
The combined occurrence of sediment-magma mingling and glassy/chilled margins indicates that there was direct contact of the magma with water-rich sediment at shallow depth. Intrusion of the sill at a shallow depth is also supported by the predominance of micro- to cryptocrystalline, often aphyric basaltic texture and the overall high abundance of vesicles, indicating intense degassing under low lithostatic pressure during magma emplacement. Intense brecciation of solidified magma through injection of fluidized sediment may point to a boiling of sediment-hosted (interstitial) water that created significant fluid pressure, fragmenting the quickly cooling magma.
Only in Hole U1548B (top of Section 385-U1548B-11X-3), coring recovered a top contact zone between sediment and underlying sill at Ringvent Sites U1547/U1548. This is in contrast to Site U1546 (see Igneous petrology and alteration in the Site U1546 chapter [Teske et al., 2021c]), where thermally and hydrothermally overprinted sedimentary layers above and below the sills were observed and identified as the contact zone of the sill intrusion. At Ringvent, however, there are many recovered sediment/magma contact zones related to parts seemingly inside the intersected sill bodies. Their geometry and morphology are usually much more incoherent and irregular compared to Site U1546, and these zones are present at many different depths, sometimes indicating a pillow-like geometry (see the VCDs in Core descriptions). Because hyaloclastite and glass margins are mechanically weak zones that occur interstitially between magmas, they are difficult to recover. Therefore, associated sediment was generally not recovered either, resulting in the observation of alteration halos of chilled margins as the most common feature indicating magma-sediment interaction (Figure F14E).
The predominant lack of recovered top contact zones may be due to drilling disturbance, or it may indicate that sediments above the sills were less affected by the sill emplacement, perhaps due to the presence of abundant water and associated efficient heat removal through advection and, consequently, rapid magma cooling with a less visible thermal (baking) effect on the overlying sediment intervals (see Lithostratigraphy). However, recovery of peperite-facies rock, the presence of sediment veins in the basalt that were likely injected at the time of magma cooling, and the appearance of chilled and glassy margins at different intervals indicate direct contact of magma with very wet sediment. In contrast to moderately to highly vesicular basaltic rock recovered from the Ringvent holes at Sites U1547 and U1548, the range of grain sizes is much more variable and wider at northwestern Site U1546 with a strong emphasis on medium- to coarse-grained igneous mineral assemblages (see Igneous petrology and alteration in the Site U1546 chapter [Teske et al., 2021c]). This suggests a slower cooling of the deeper sill body at Site U1546 compared to the shallower Ringvent intrusions.
5.6. Geochemistry
The vast majority of inductively coupled plasma–atomic emission spectroscopy (ICP-AES) analyses (see Inorganic geochemistry in the Expedition 385 methods chapter [Teske et al., 2021a]) obtained from sill material of off-axis Site U1547 (18 of 26 measurements, representing four of the five holes at this site) yielded reliable totals, although one analysis obtained from the Site U1548 sill could not be considered. These are slightly (Hole U1547C and deeper interval in Hole U1547E) to moderately (Holes U1547B, U1547D, and shallower interval in Hole U1547E) altered samples representing almost exclusively aphyric basaltic rock. Just one analyzed sample taken from a depth of 174.89 mbsf in Hole U1547E (interval 20R-1, 28.5–35 cm) represents a porphyritic doleritic rock that shows phenocrysts of plagioclase and clinopyroxene. Overall, the SiO2 and Na2O + K2O compositions at Site U1547 range from 49.3 to 51.2 wt% and from 3.27 to 4.00 wt%, respectively, thus showing a subalkaline basalt chemistry (Figure F20; Table T7). These are low K tholeiitic rocks (K2O contents = 0.14–0.40 wt%) (Table T7), except for one sample in Hole U1547B (K2O contents = 0.59 wt%) that has a medium K calc-alkaline character. Given the generally moderate alteration characterizing these rocks, the potassium variation may have been modified to some extent during rock-fluid interaction. However, based on the less alteration-sensitive FeO*/MgO values of these rocks, their tholeiitic character is mostly corroborated, showing values as high as ~2.0 (Table T7). Notably, both samples from Hole U1547E (FeO*/MgO < 0.9) and four samples from Hole U1547D (FeO*/Mg up to 1.2) indicate a calc-alkaline character at a given SiO2 concentration (Table T7). The Ti-V pattern of these rocks points to a MORB composition (Figure F21). The Mg# varies considerably at Site U1547. Although Holes U1547B–U1547D overlap in their Mg# values, with Hole U1547B having the lowest values at Site U1547 (Mg# as low as 0.48), the two samples from Hole U1547E possess a distinct Mg# of 0.67–0.70 and have the highest values not only among Site U1547 holes but for Expedition 385 in general (Figure F22; Table T7). The Mg# values in Hole U1547E thus suggest a primitive melt composition that was not subject to significant evolution, which is supported by the highest Cr and lowest Sr and Zr concentrations (Figure F22) among Site U1547 igneous rocks (Table T7). In contrast, most samples from Hole U1547B indicate evolved compositions of melts with Mg# < 0.6; that is, they had already undergone some fractionation at the time of solidification (Figure F22; Table T7). Hole U1547C and U1547D rocks narrowly vary around a Mg# of 0.6. The abundances of lithophile elements (e.g., Na, K, Sr) (Figures F20, F22A) and high field strength elements (e.g., Ti, Zr) (Figures F21, F22B) are within the range of the other Guaymas Basin sites drilled. The variation of Mg# across Site U1547 holes is reflected by the variation of Zr content, which systematically increases with decreasing Mg# due to differences in the fractionation degree of the corresponding melts (Figure F22B). In terms of comparison with the other northwestern rift flank off-axis Site U1546, the Sr contents overlap (Figure F22A), and the content of highly incompatible trace element Zr appears to be somewhat higher at a given Mg# at Site U1547 (Figure F22B). The highly incompatible trace element Y is more enriched at Site U1547 than at the southern on- and off-axis rift sites drilled during DSDP Leg 64 (Figure F23). In contrast, it is less enriched at Site U1547 compared to the northern on-axis rift DSDP Site 481 and IODP Site U1550. Therefore, the igneous rocks from off-axis Sites U1547 and U1546 generally fill a compositional gap between the northern and southern rift segments of Guaymas Basin, showing a small overlap with the latter (Figure F23). This distinction is significant, although all Guaymas Basin sites share a similar range of incompatible element ratios (e.g., Zr/Y; Figure F23). As for the other Guaymas Basin sites, the Site U1547 Zr/Y values (Figure F23) are higher and the calc-alkaline character is more pronounced (higher Na2O + K2O) (Figure F20) than at the East Pacific Rise spreading segment that is situated in the Gulf of California mouth. This suggests a significant heterogeneity in magma source compositions from the southernmost to the central (Guaymas Basin) part of the Gulf because the same difference is indicated by the incompatible trace elements Sr and Zr at similar degrees of melt fractionation (Figure F22). These features point to the ubiquitous presence of enriched MORB compositions in Guaymas Basin for both off- and on-axis magmas.
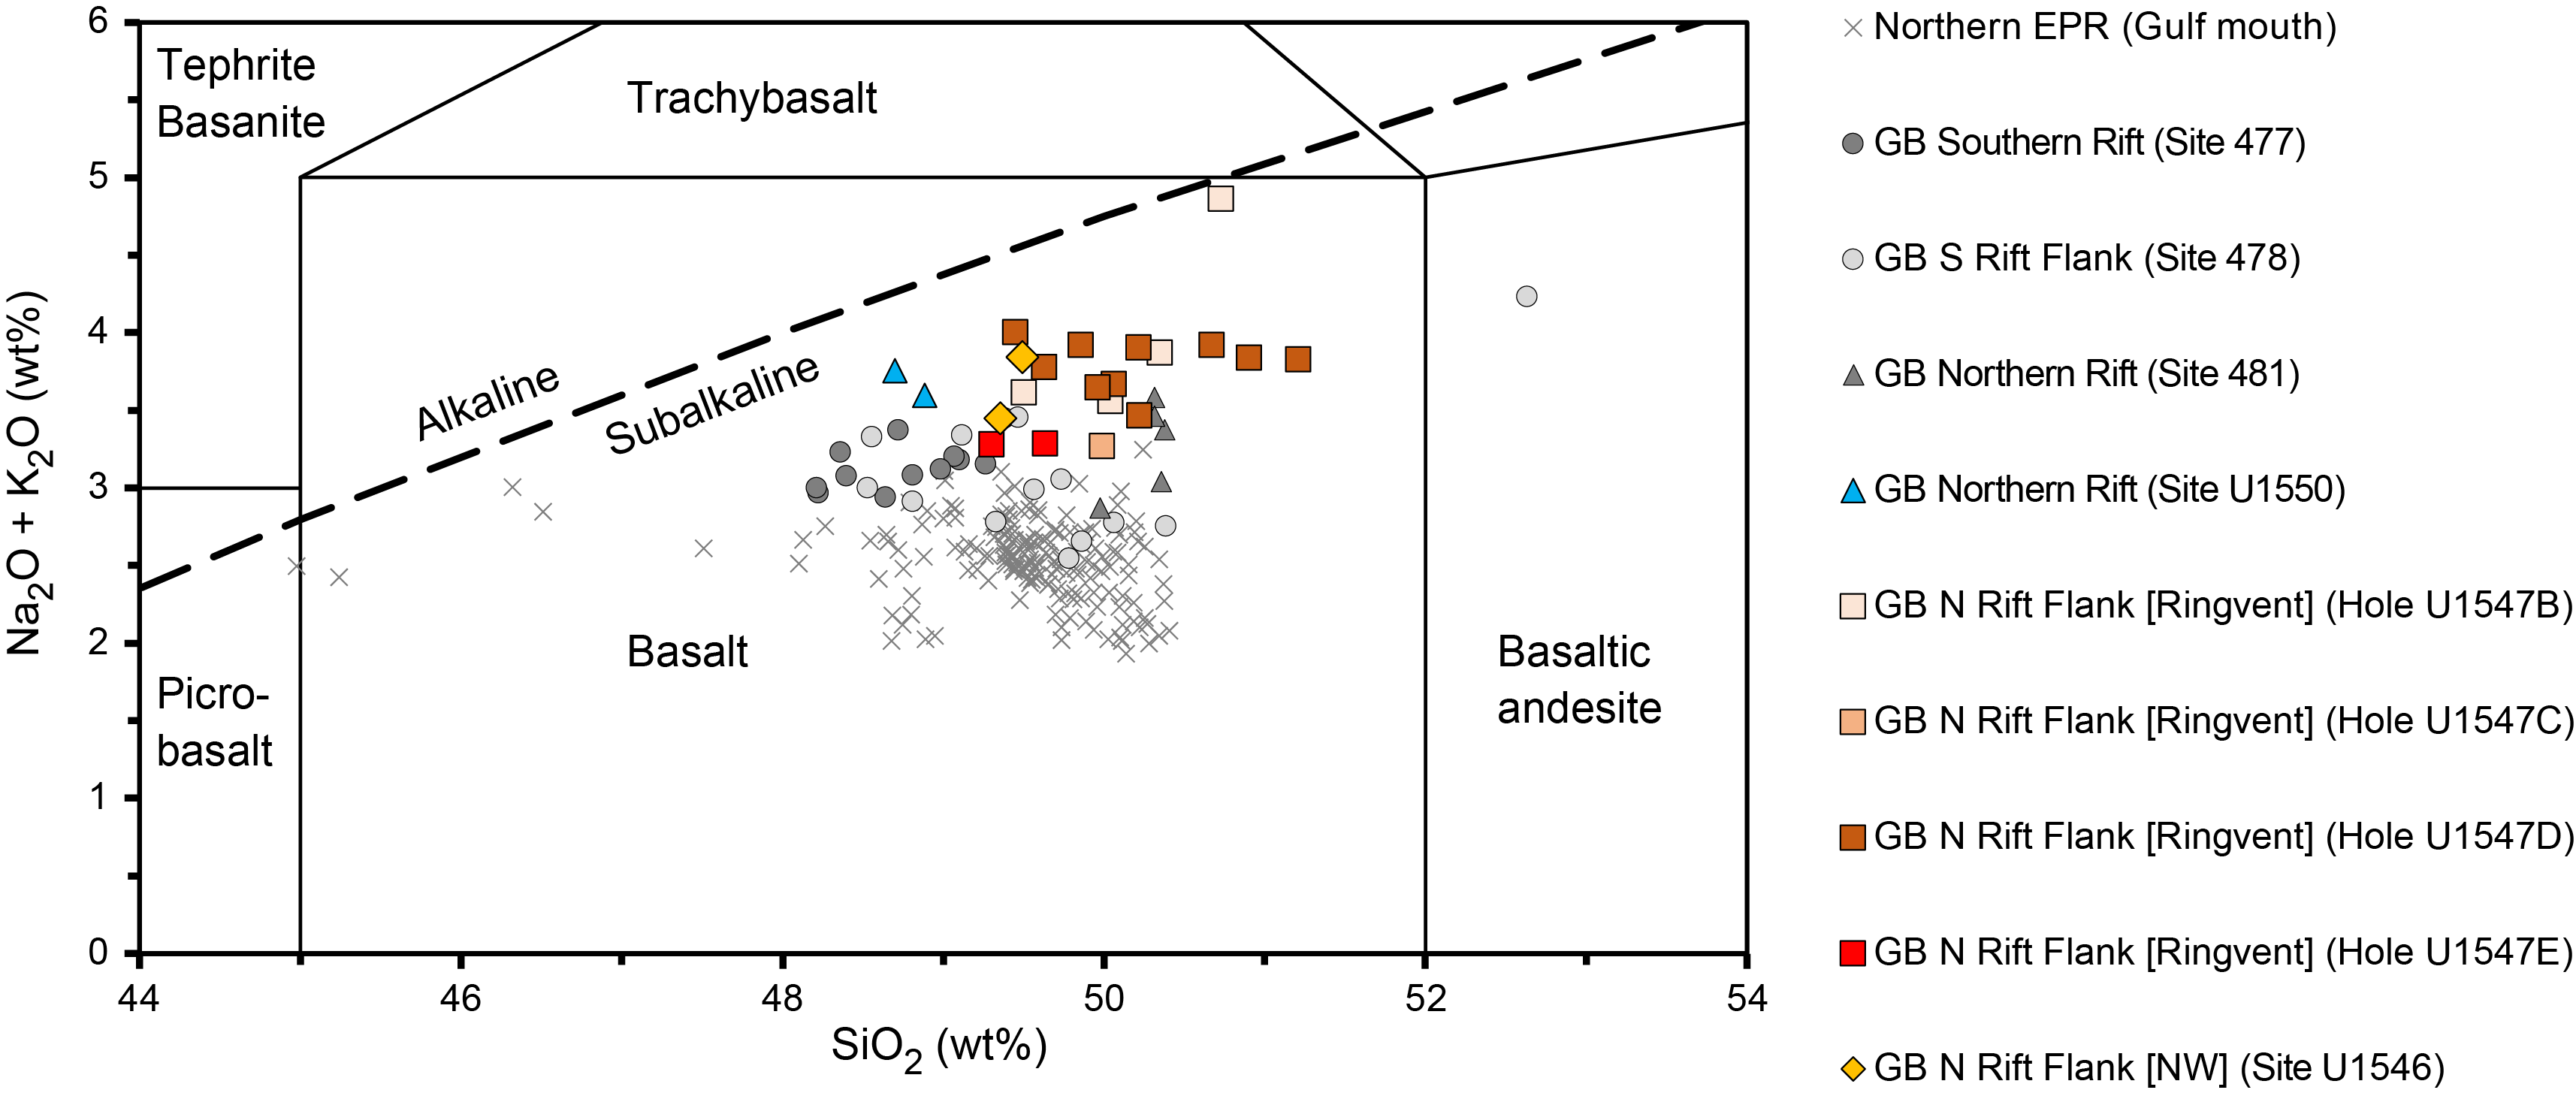
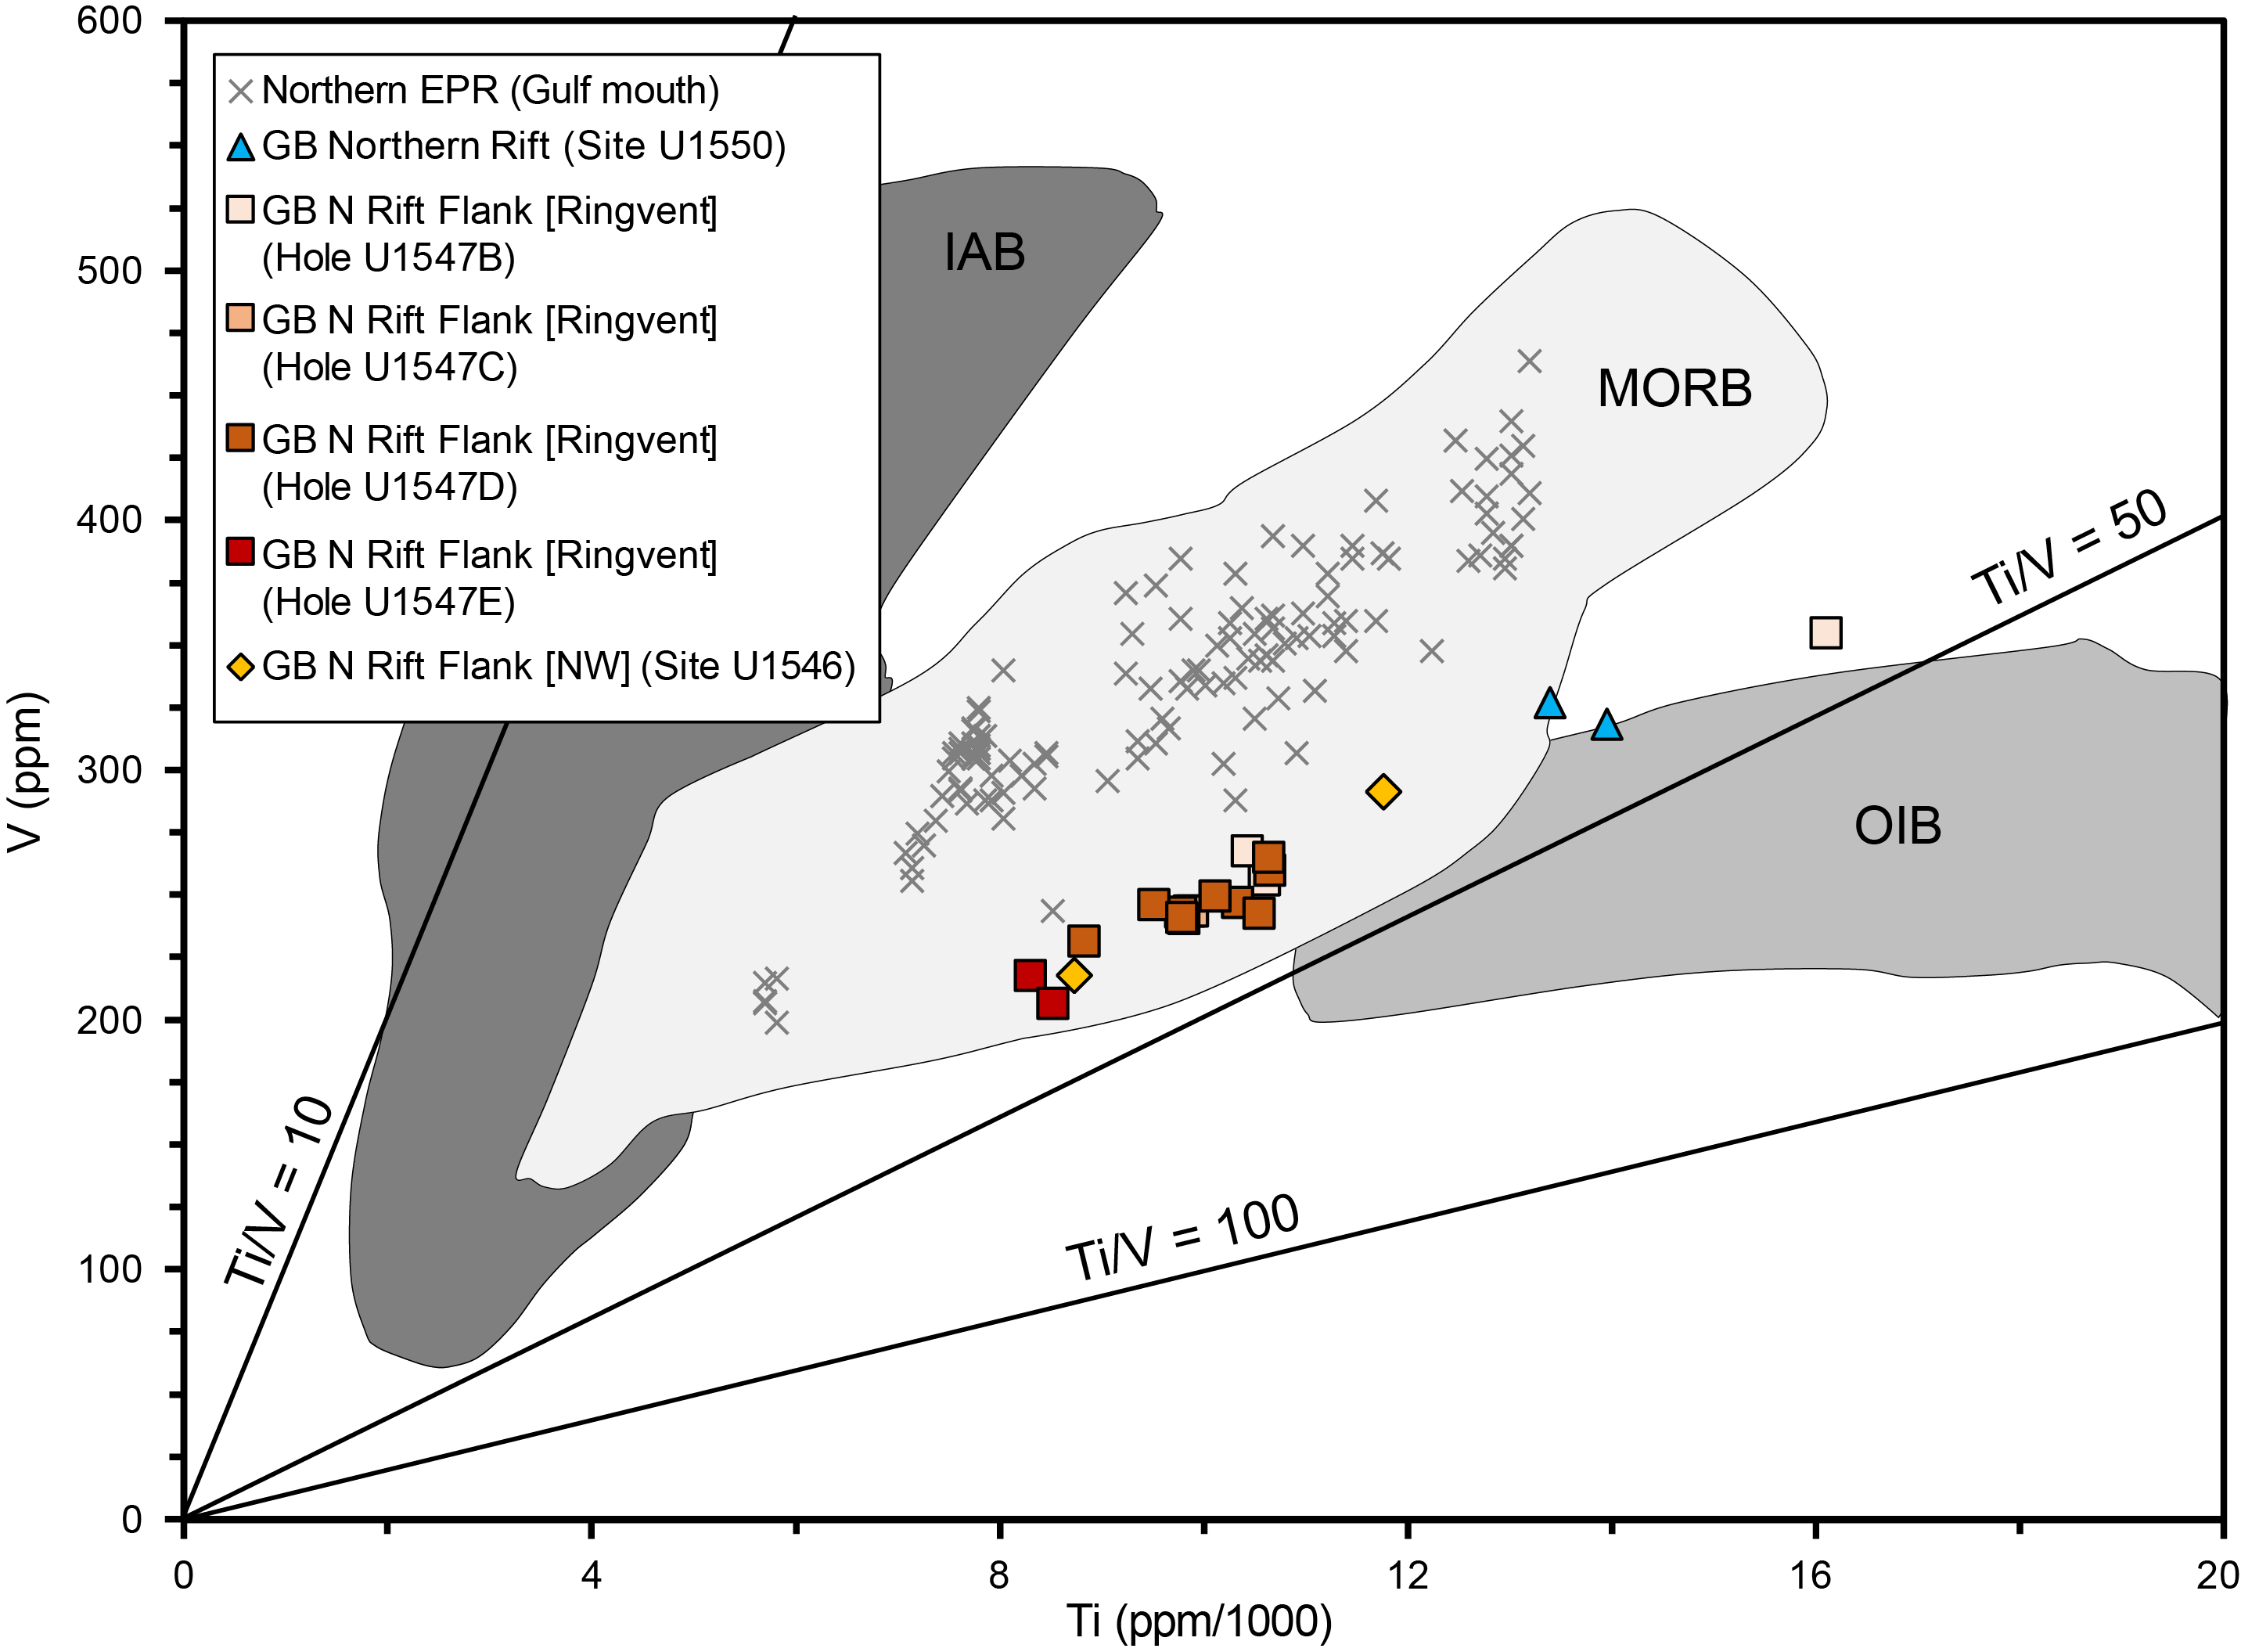
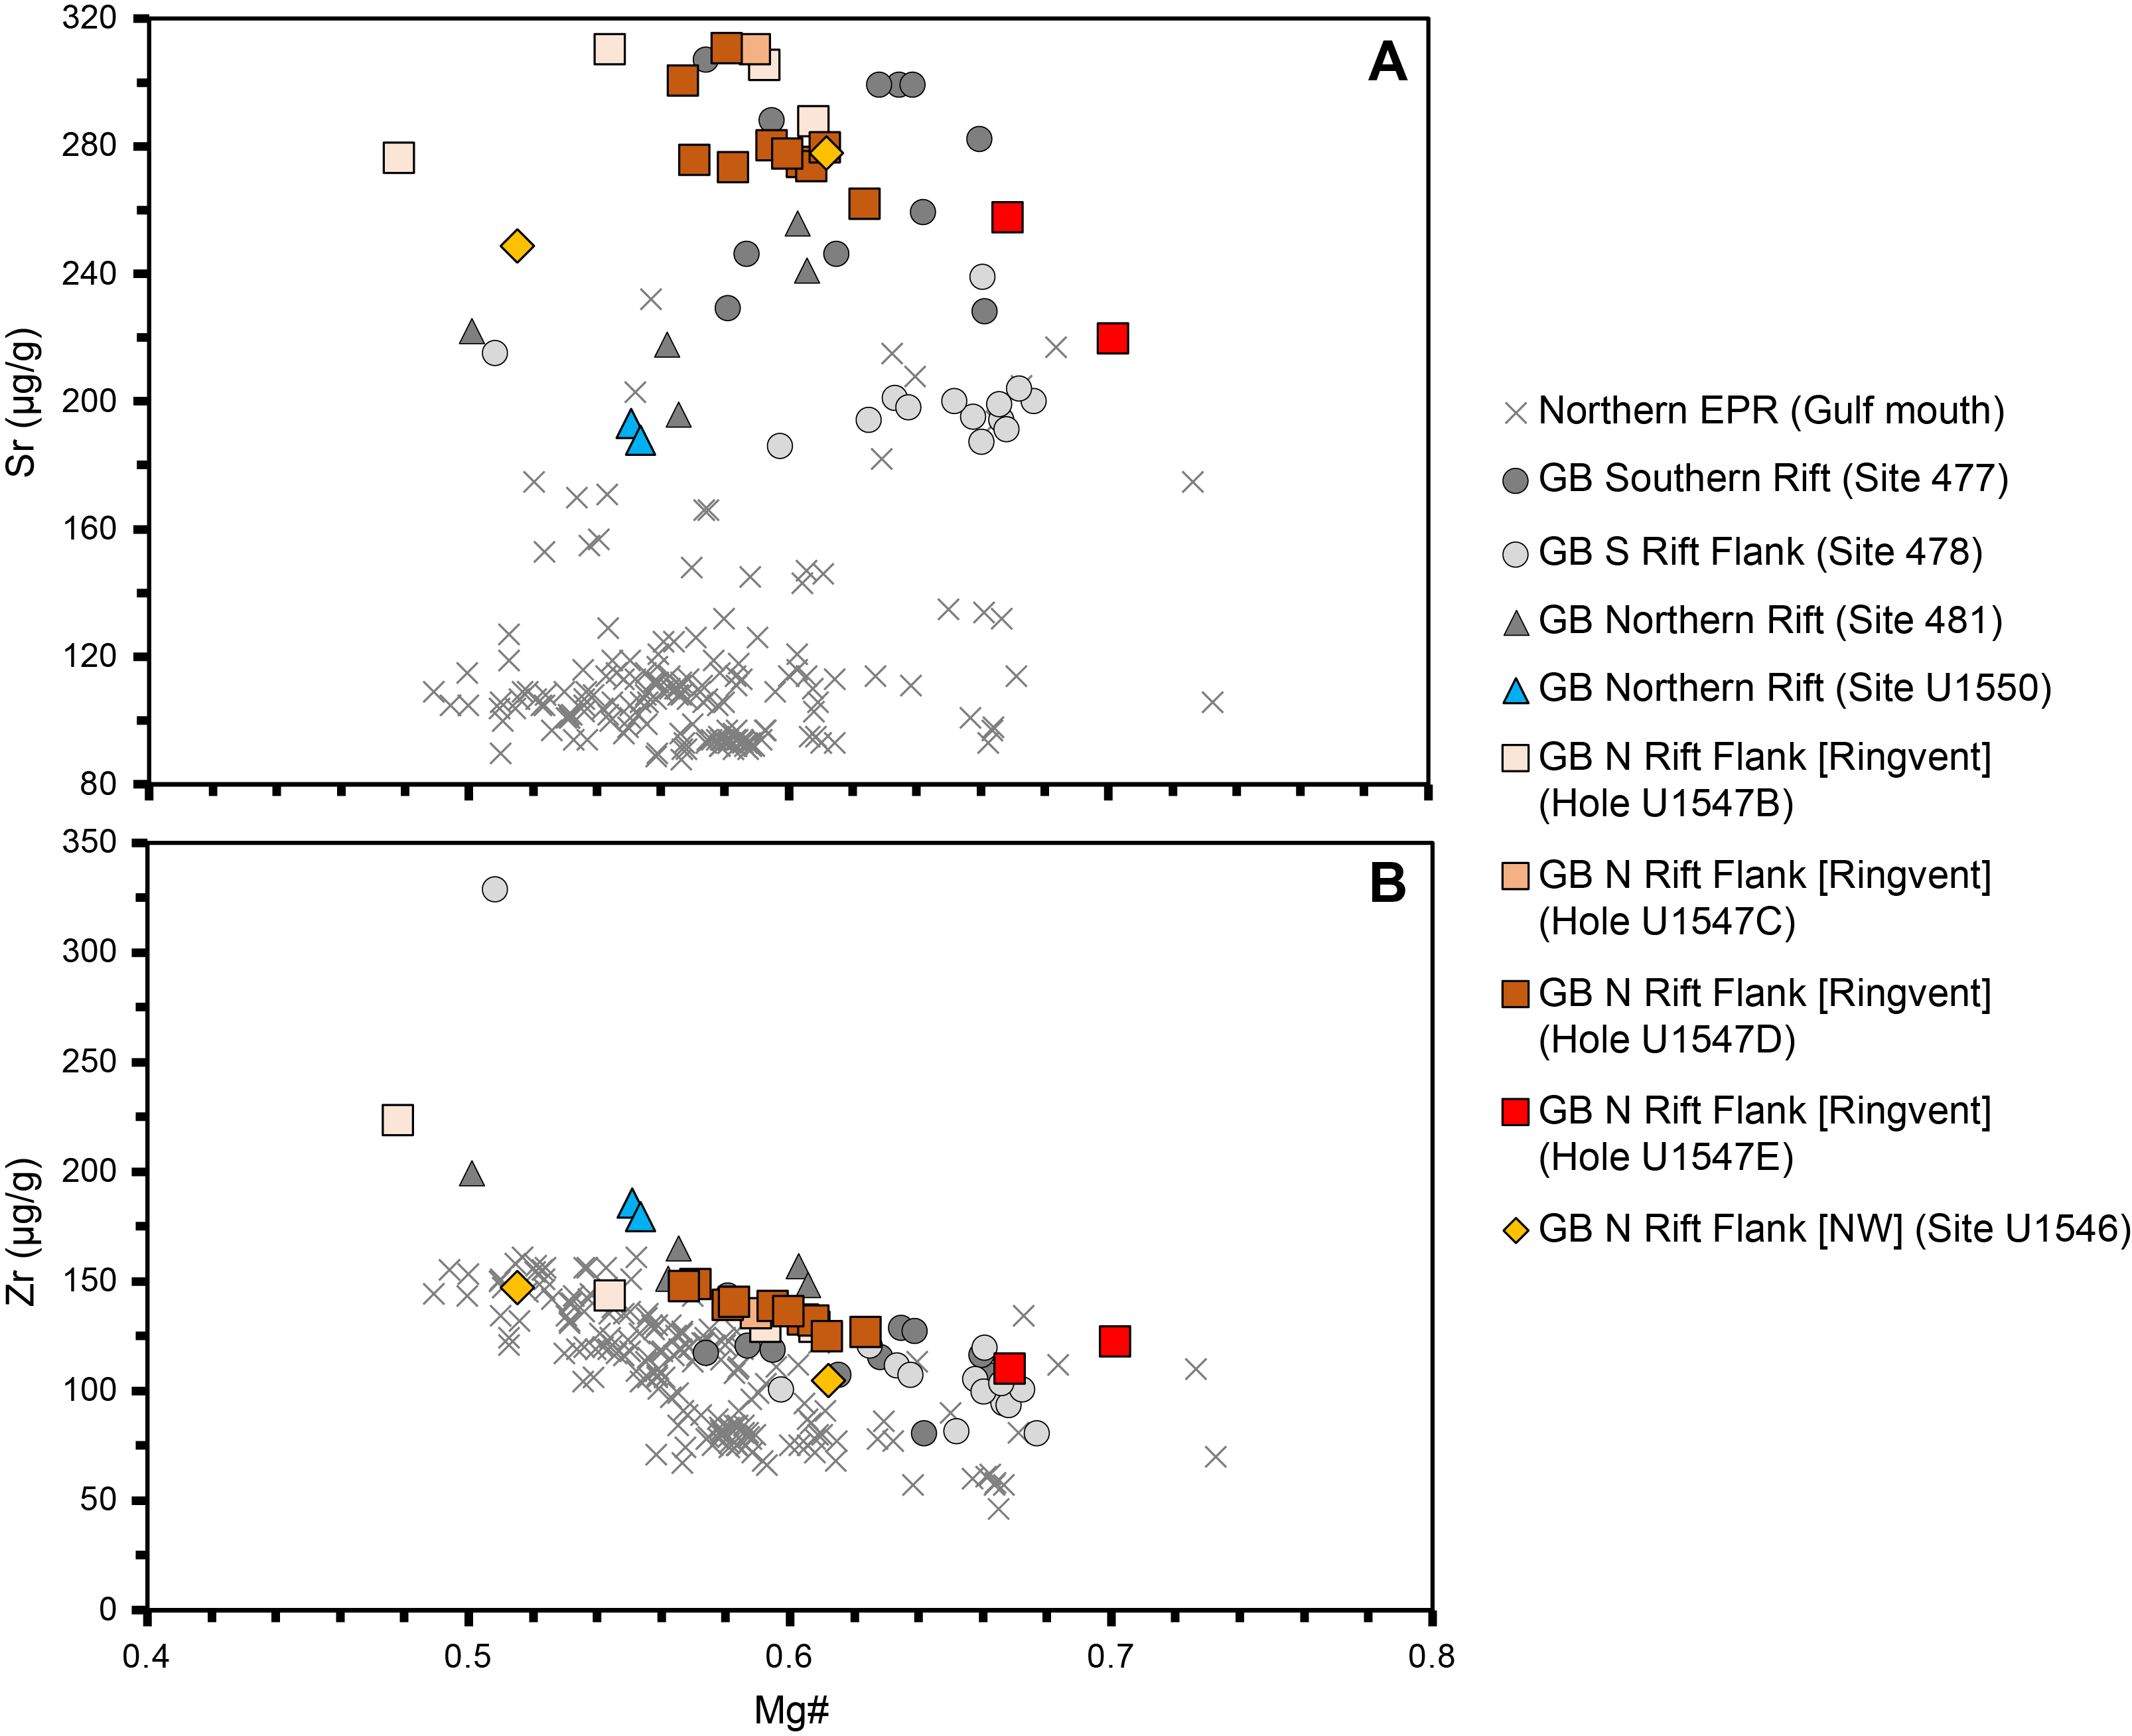
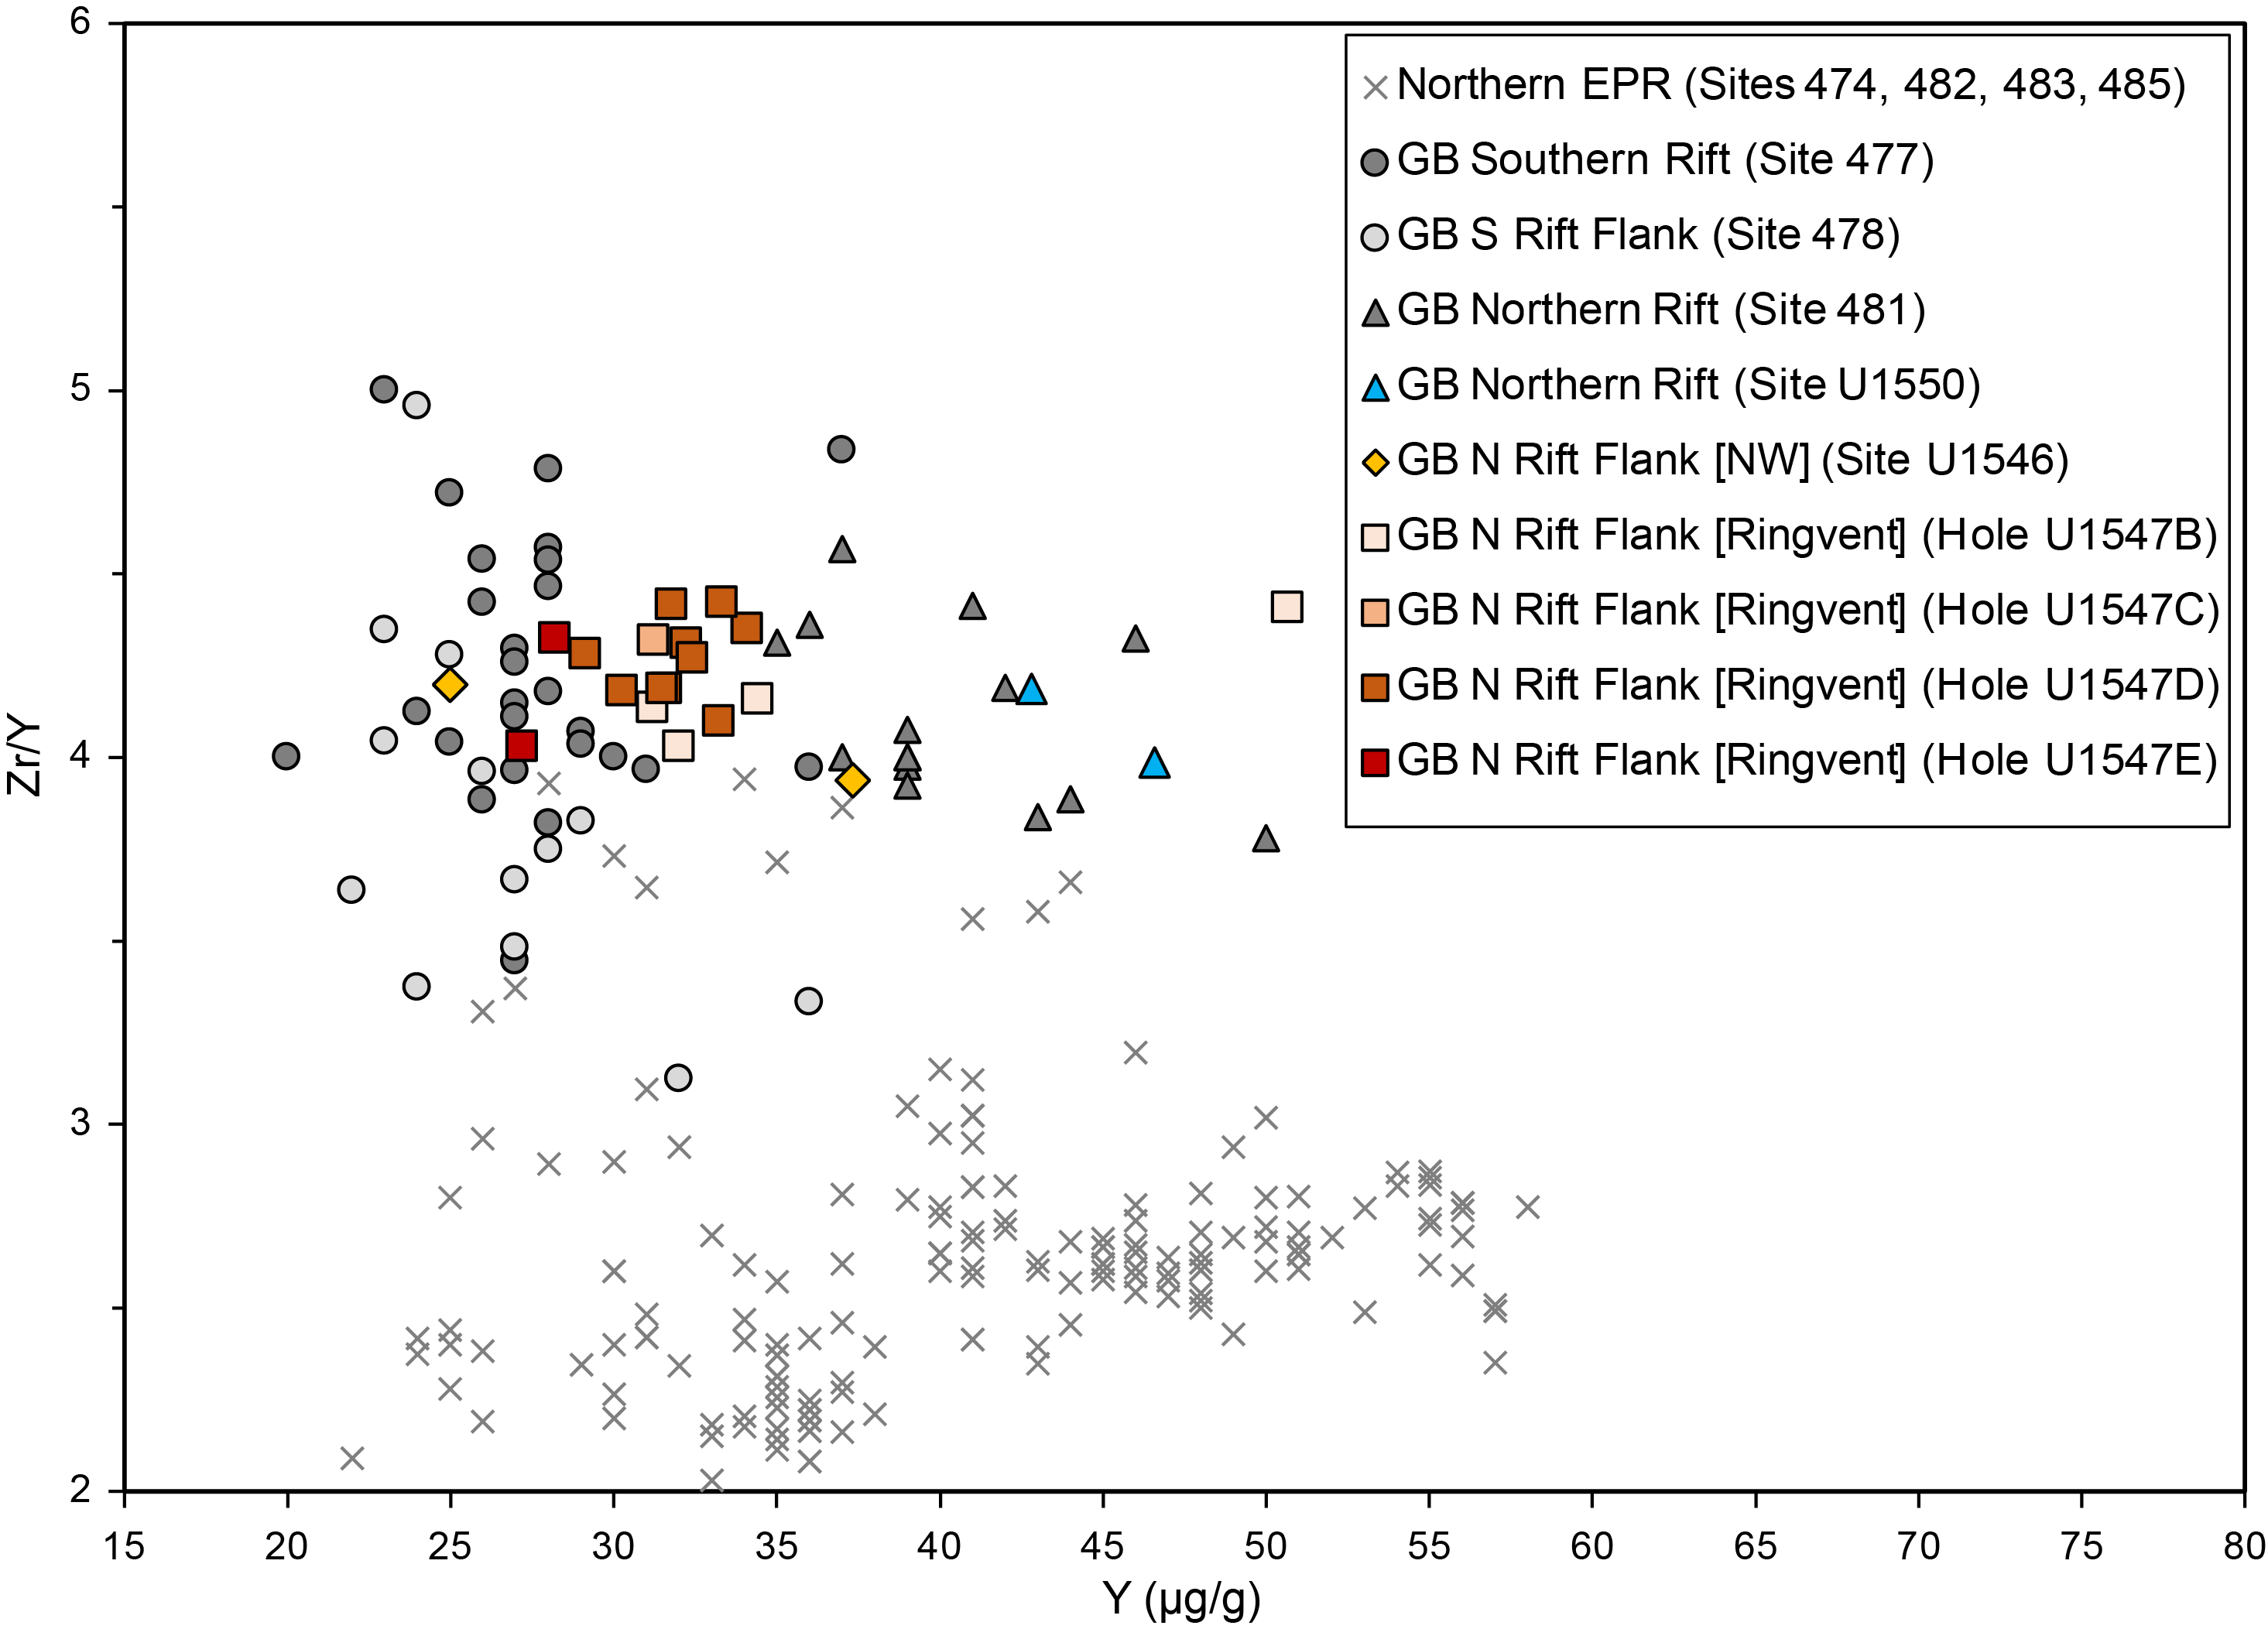
6. Structural geology
This section presents observations from two sites near the Ringvent structure (Teske et al., 2019). Site U1547 is located inside the circular mound of Ringvent, and Site U1548 is situated outside. Holes at both sites penetrated Lithostratigraphic Subunits IA–ID and recovered a sedimentary sequence of diatom ooze, diatom clay, sands, and siliceous claystone as well as variable amounts of hypabyssal mafic igneous rock. As at Site U1546, the strength of the cores differed considerably according to the lithology, so several different methods were employed to measure the structures. For all cores, structures were measured and/or described, where present, from the archive halves of the cores. For igneous rock cores, structures were first observed and measured directly on the surface of the whole-round core pieces before they were split into section halves. These observations guided the placement of the cutting lines so that structures were split as evenly as possible between the working half and the archive half of a given core piece.
For measurements of apparent dip and plunge made on features visible in the archive half of the cores, the strike and dip conventions are as follows: a strike of 270° in borehole coordinates is on the left-hand side margin of the archive half of the core, a strike of 90° in borehole coordinates is on the right-hand side margin of the archive half of the core, and the direction of 180° is perpendicular to the core axis, facing down into the core.
6.1. Sedimentary units
Structural information was sought from sedimentary units in four of the five holes at Site U1547 and all five holes at Site U1548. Hole U1547A has lithologically the most complete section of the sedimentary succession and provided the most opportunity for structural observations of its layers. In Hole U1547B, some sections were removed for microbiological sampling immediately upon retrieval from the core liners and were therefore not available for structural study. Hole U1547C was drilled very close to Hole U1547A to 81.3 mbsf without core recovery from Subunit IA. Holes U1547D and U1547E were drilled ~120 and ~200 m southwest of Hole U1547C, respectively, but still within the Ringvent feature; they were also drilled to 81 m without recovering core, and sampling began in Subunit IC. Holes U1548A and U1548B were positioned farther along the same seismic line, approximately 140 m southwest of the Ringvent mound, and only sampled Subunits IA and IB. Hole U1548C continued this transect very close to Ringvent (~90 m), whereas Holes U1548D and U1548E were drilled ~500 m northwest of Holes U1548A–U1548C.
Bedding and lamination in sediments and sedimentary rocks are similar to those described for Site U1545. No significant folds were observed. Few brittle fractures and faults were observed in the sediments and sedimentary rocks in Hole U1547A during visual inspection of the cores, although in some cases fractures are seen much more easily in the X-ray images than on the cut surfaces of the cores. For example, the X-ray image of Section 385-U1547A-22F-2 clearly reveals a normal fault from 145 to 135 cm (116.7 mbsf) with an apparent dip of 65° down to the left (toward an azimuth of 270° in borehole coordinates) and a ~1.5 cm offset, but this fault is quite difficult to see in the visible light section image from the same depth interval (Figure F24).
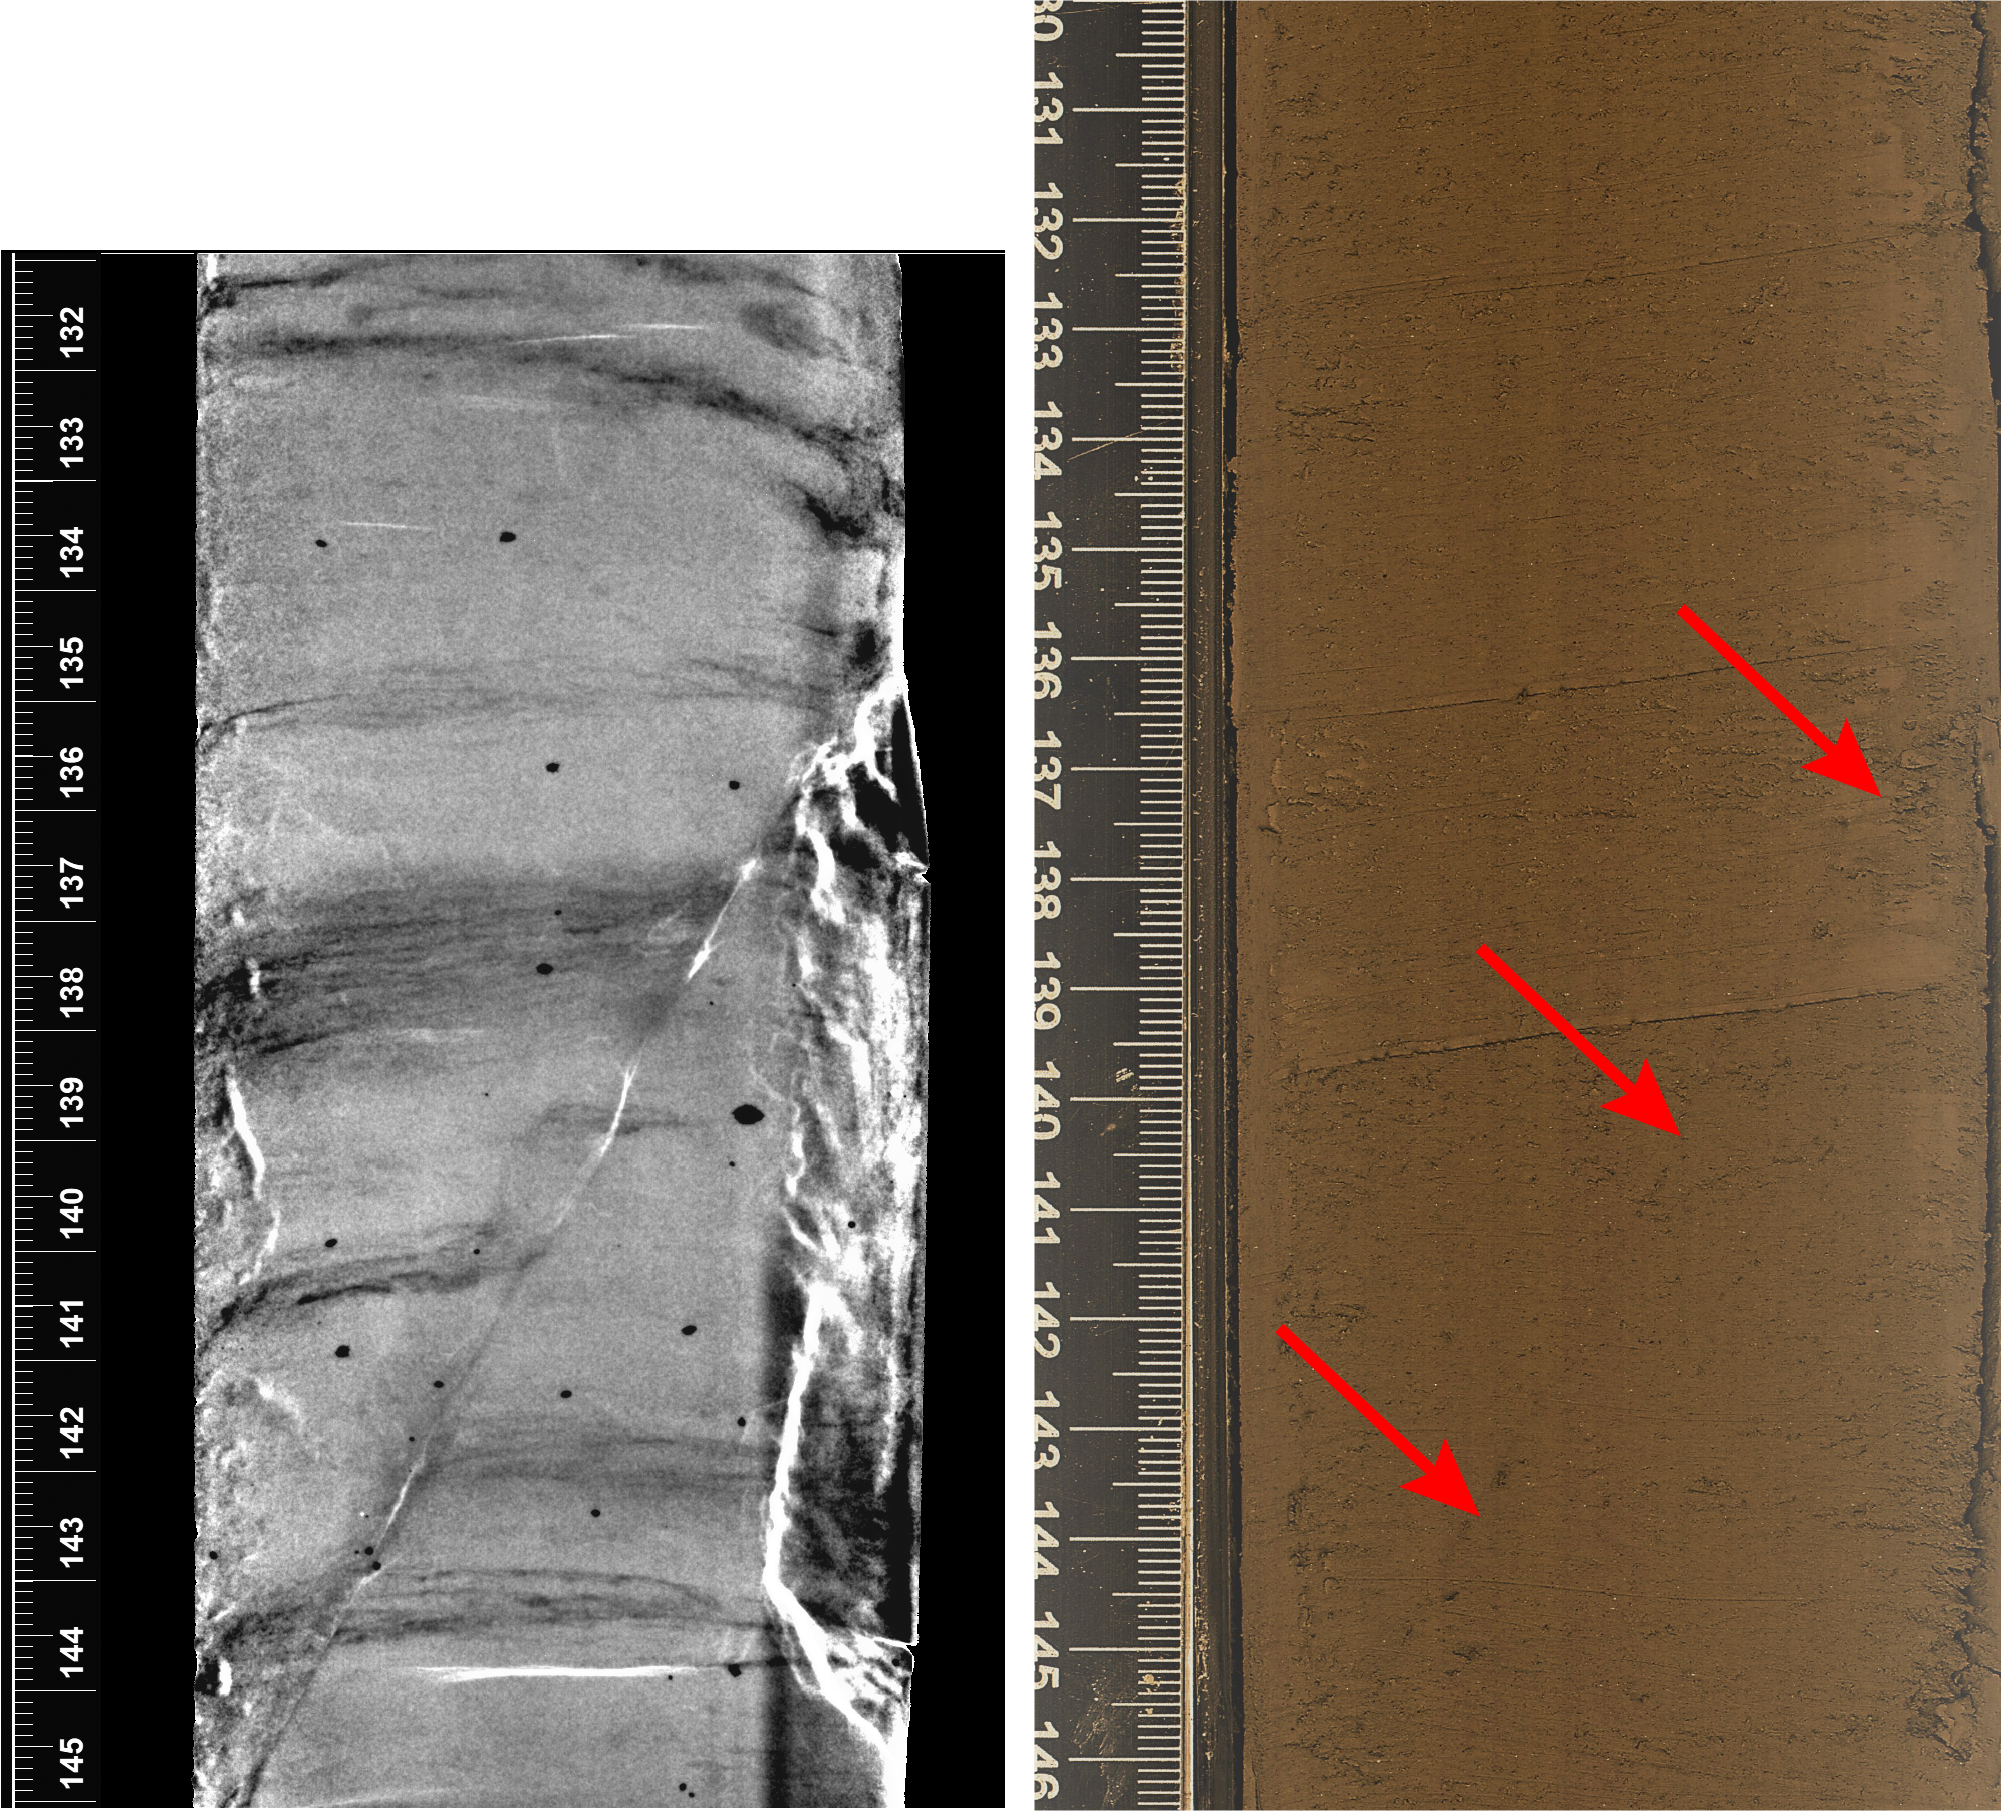
6.2. Igneous units
Mafic igneous rocks of different sill bodies were cored in five holes at Site U1547 (part of Subunit ID) and in three holes at Site U1548 (part of Subunit IB). The most significant thicknesses of variably vesicular basaltic and doleritic rocks were cored in Holes U1547B, U1547D, and U1547E (Table T8). Structural features within the sill rocks are more common in the less vesicular lithologies and include preexisting fractures and mineralized veins, glassy or chilled margins, and rare examples of columnar joints. Preexisting fractures were identified by offset of internal markers in the cores (Figure F25) and by preexisting planar surfaces that were apparent weaknesses exploited to form the breaks caused during coring. These planar surfaces are sometimes coated with calcite or pyrite. If the mineralization was continuous along a planar surface, it was categorized as a mineralized vein, but if a preexisting planar surface had irregular or no mineralization, it was categorized as a fracture plane.
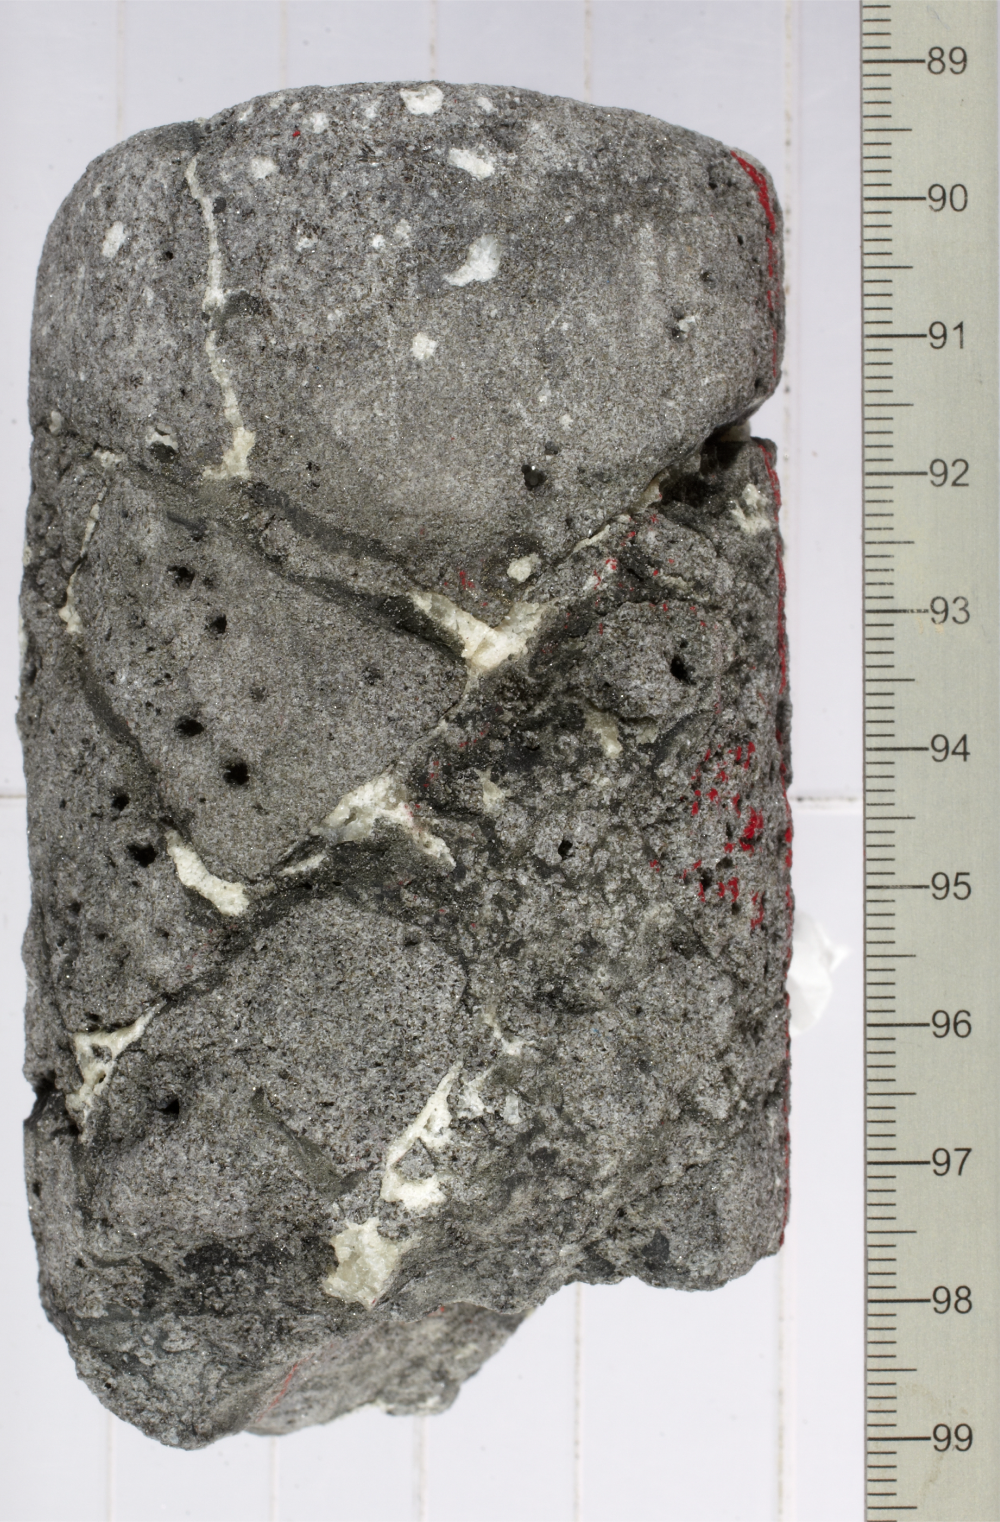
Networks of veins with irregular branching patterns were not measured as planar features. Some of these networks are very complex and show multiple generations of vein fill of different compositions (Figure F26).
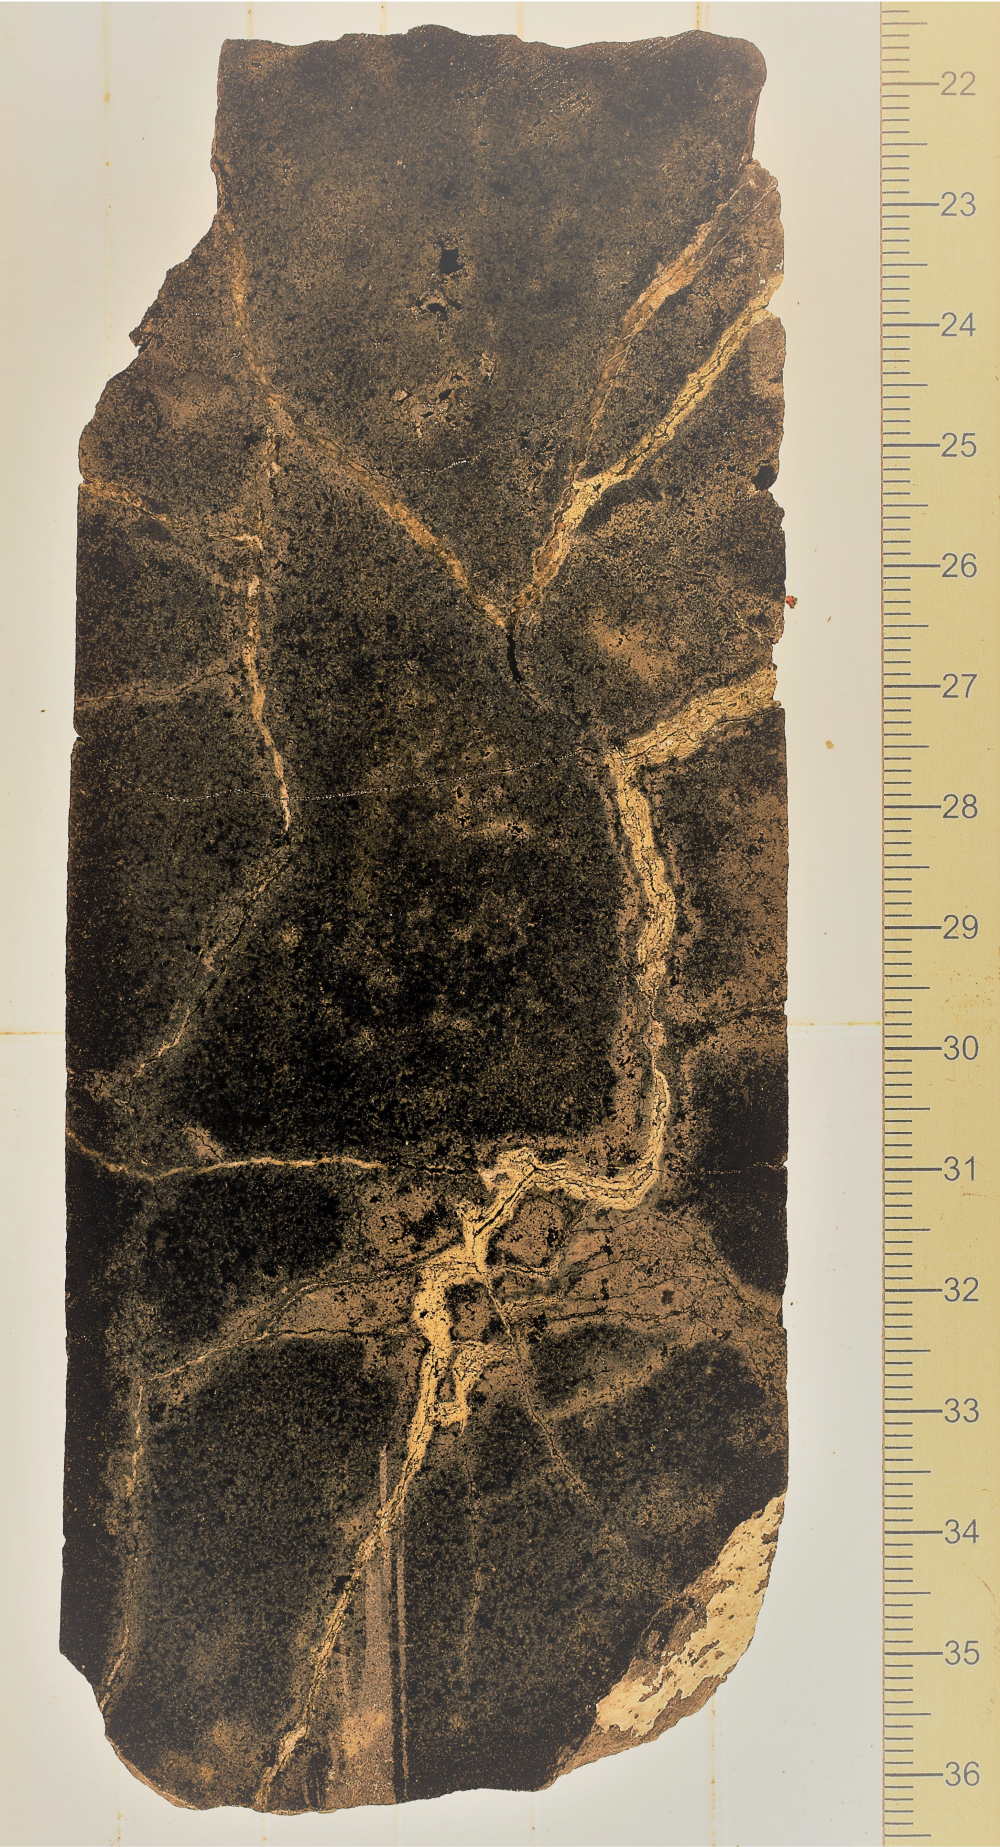
Planar structures (fractures, faults, joints, glassy surfaces, and mineralized veins) were measured on the whole-round pieces of the igneous units in all eight Ringvent-proximal holes before the whole-round core pieces were split. Because the geographic north direction of the cores is not known, only the dip measurements of these structures are reported. No macroscopic shortening or folding of the veins was evident. In the igneous rocks of these sites, various planar features were measured (Table T8).
After measurement of the planar features of the whole-round samples of igneous rocks, they were marked for cutting as described above. Note, however, that if a sample had any external planar faces that met at an angle of about 120°, the preservation of part of a columnar joint was suspected. The angle between the two planar faces was measured. If this confirmed a likely columnar joint fabric, then the sample was marked for cutting parallel to the polygonal cross section (perpendicular to the joint-bounded column axes) so that the archive half and the working half would each contain the evidence for the possible columnar joint segments (Figure F27).
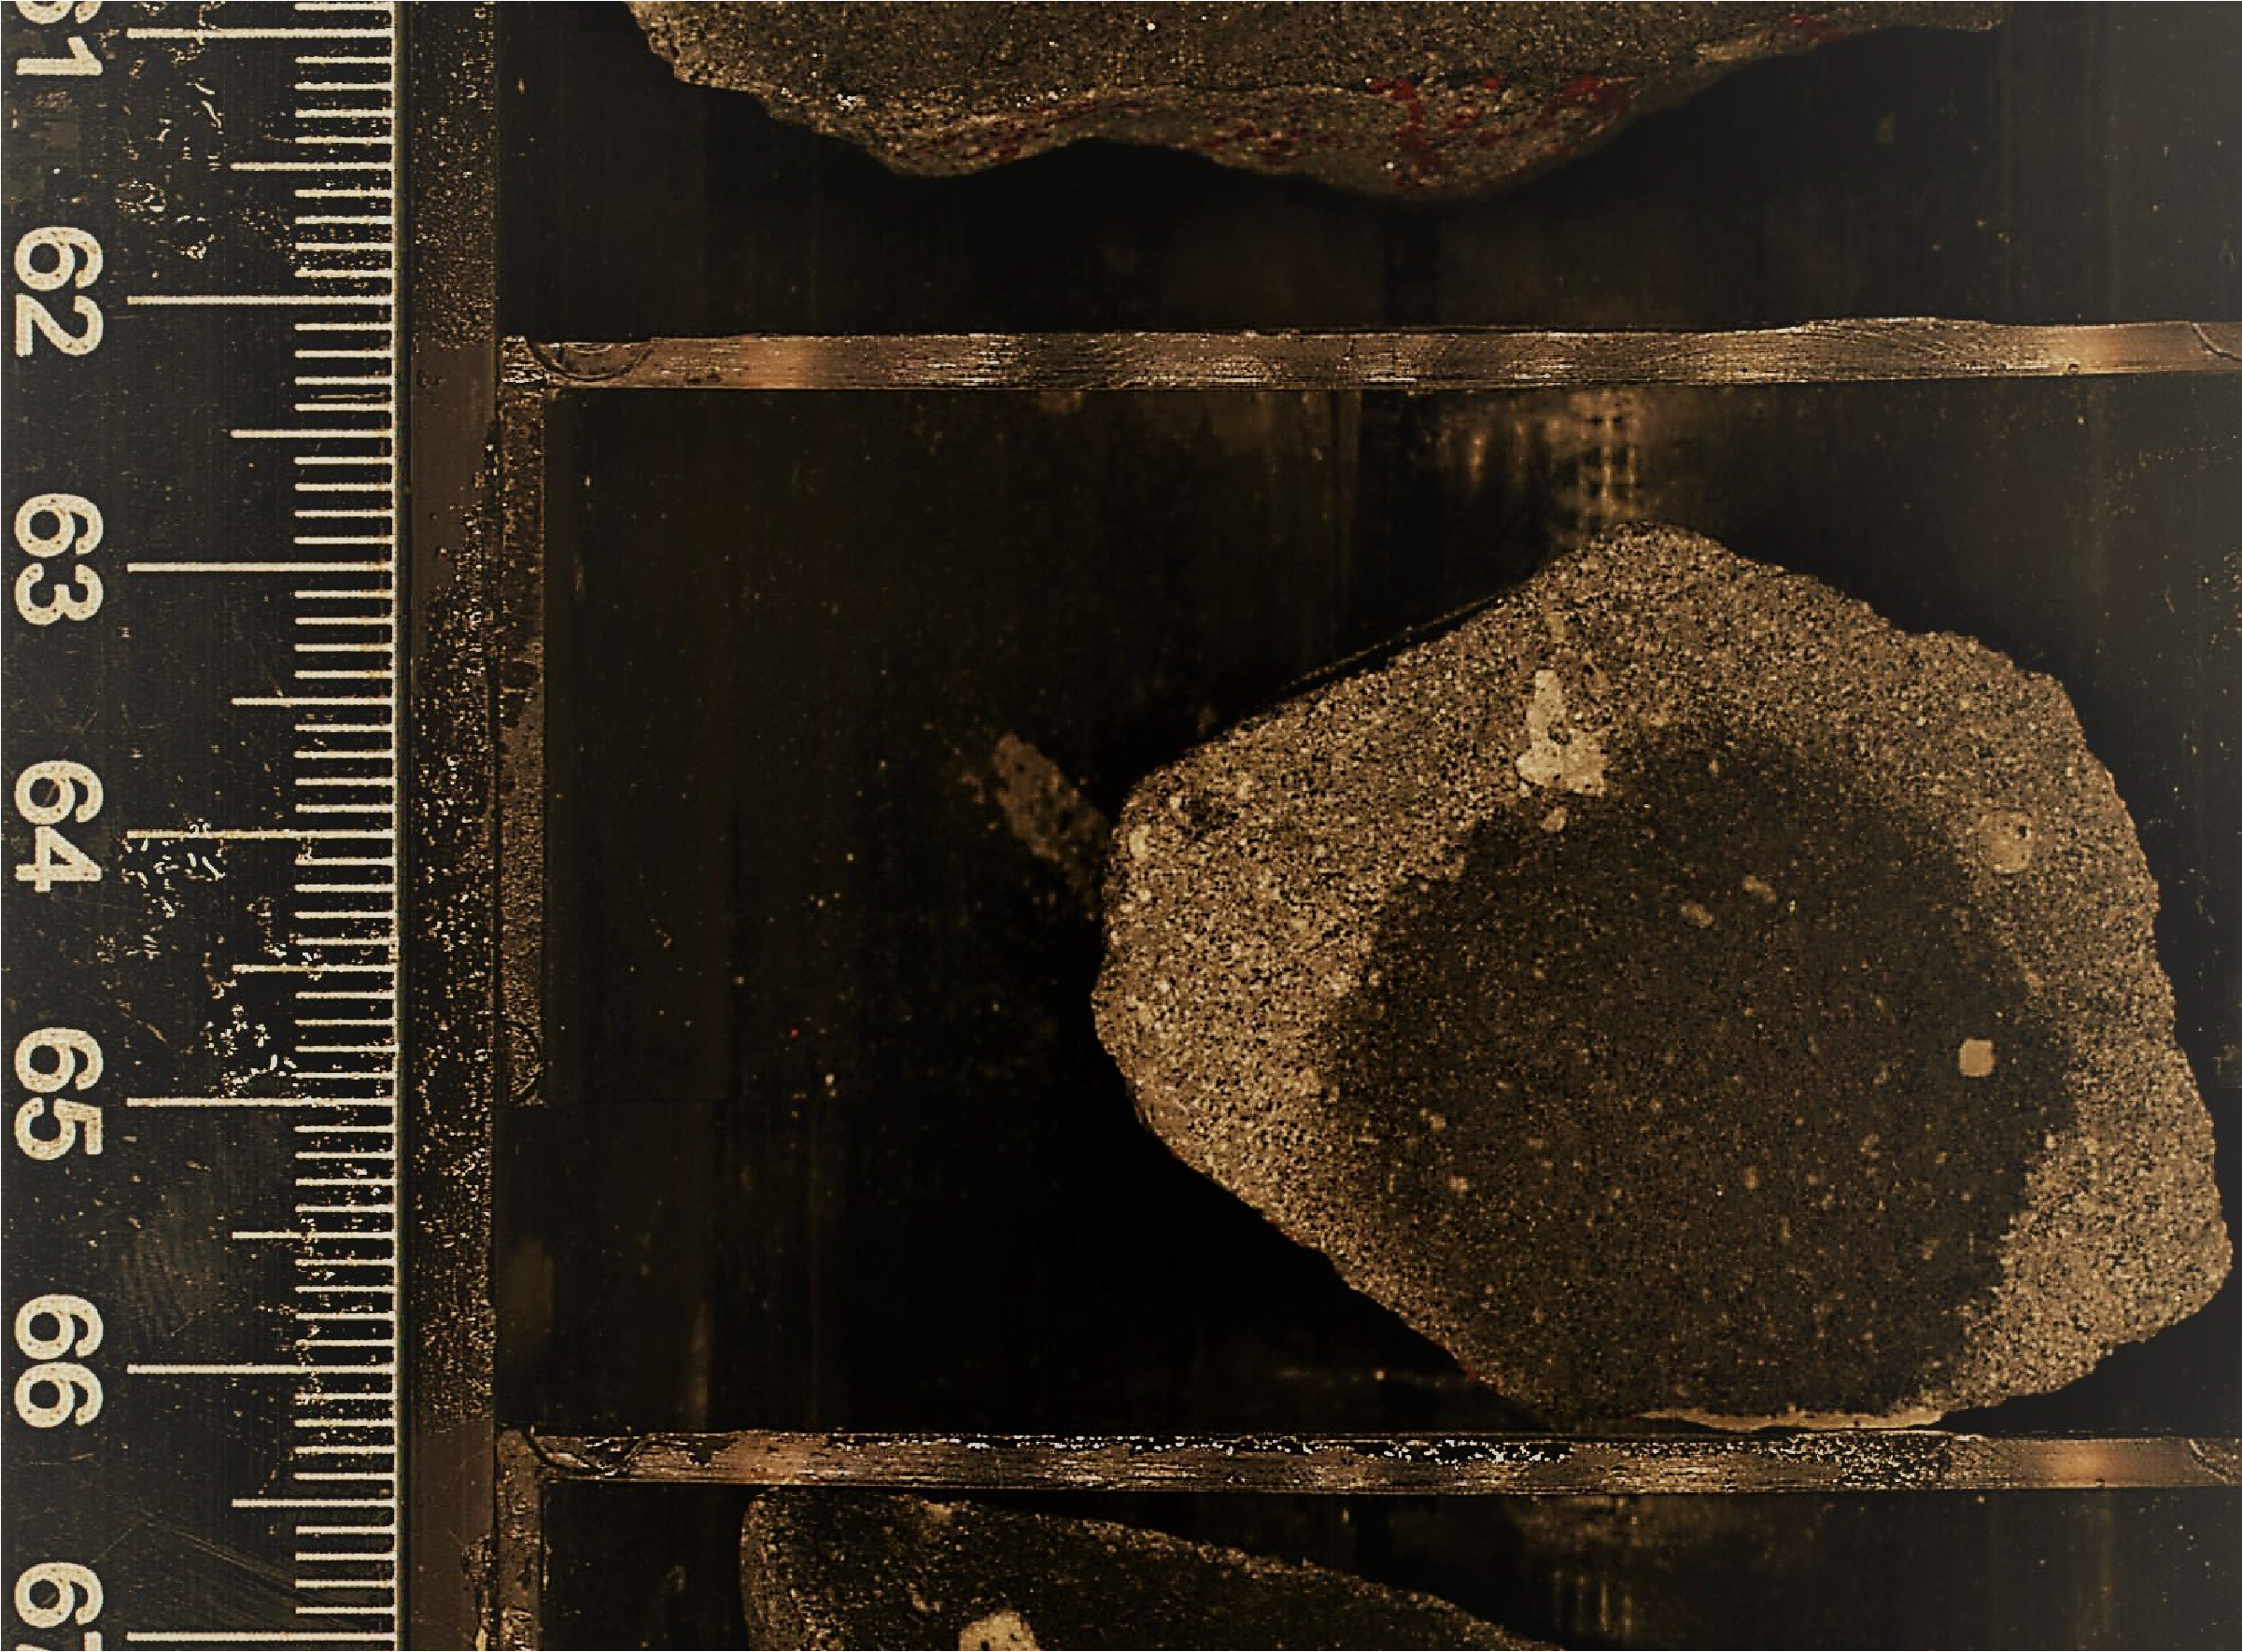
7. Biostratigraphy
Toothpick samples from Holes U1547A–U1547D were taken and analyzed for calcareous nannofossils and marine diatoms. To constrain biostratigraphic events, both spot samples from the working and archive halves of split cores and core catcher samples were taken throughout Hole U1547A (5.18–137.48 mbsf); from interval 385-U1547B-12F-CC (96.54 mbsf) to 29F-3, 60 cm (151.93 mbsf); and from available sediment sections in Holes U1547C and U1547D. Samples were taken from core catchers and the bottom sections of the corresponding cores in Hole U1547A to compare the preservation and abundance in these two types of samples. Toothpick samples from the bottom section of split cores from Hole U1548A were taken for calcareous nannofossil and marine diatom analyses.
Calcareous nannofossils are abundant to common above 43.51 mbsf at Sites U1547 and U1548. At both sites, intervals in which nannofossils are few or barren and intervals in which they are abundant/common alternate from 43.73 to 151.93 mbsf.
Preservation of calcareous nannofossils is good/moderate to poor throughout the entire sedimentary sequence. In general, preservation is good/moderate in samples with abundant or common nannofossils and poor in those with few or rare abundances in Holes U1547A–U1547D and Hole U1548B (Tables T9, T10). No systematic difference in nannofossil preservation was observed between the core catchers and the corresponding core section samples.
In general, marine diatoms are dominant/abundant with good/moderate preservation above ~131.21 mbsf in Hole U1547A and above ~101.15 mbsf in Hole U1547B. Marine diatoms are barren at the sedimentary bottom (above the deepest sill in each hole) of all holes due to diagenetic overprint or hydrothermal alteration (Table T11).
In Hole U1548A, marine diatoms are mostly abundant with moderate preservation above 84.1 mbsf; between 90.9 and 99 mbsf, diatoms are abundant to frequent with poor preservation (Table T10).
No biostratigraphic datum was defined in the generally continuous succession from the Holocene or late to the middle Pleistocene (Tables T12, T13). The occurrence of E. huxleyi at the sedimentary bottom of all holes dates the entire sediment sequence of each hole to younger than 0.29 Ma (Hole U1547A = 0–137 mbsf; Hole U1547B = 96.5–151.93 mbsf; Hole U1547C = 81.57–121.13 mbsf; Hole U1547D = 91.25–101.33 mbsf; Hole U1548A = 0–99 mbsf). This age assignment is consistent with the absence of P. lacunosa (LAD = 0.44 Ma) and F. reinholdii (LAD = 0.62 Ma) in all samples examined. The estimated average sedimentation rate is greater than 524 m/My (>52.4 cm/ky) (Figures F28, F29).
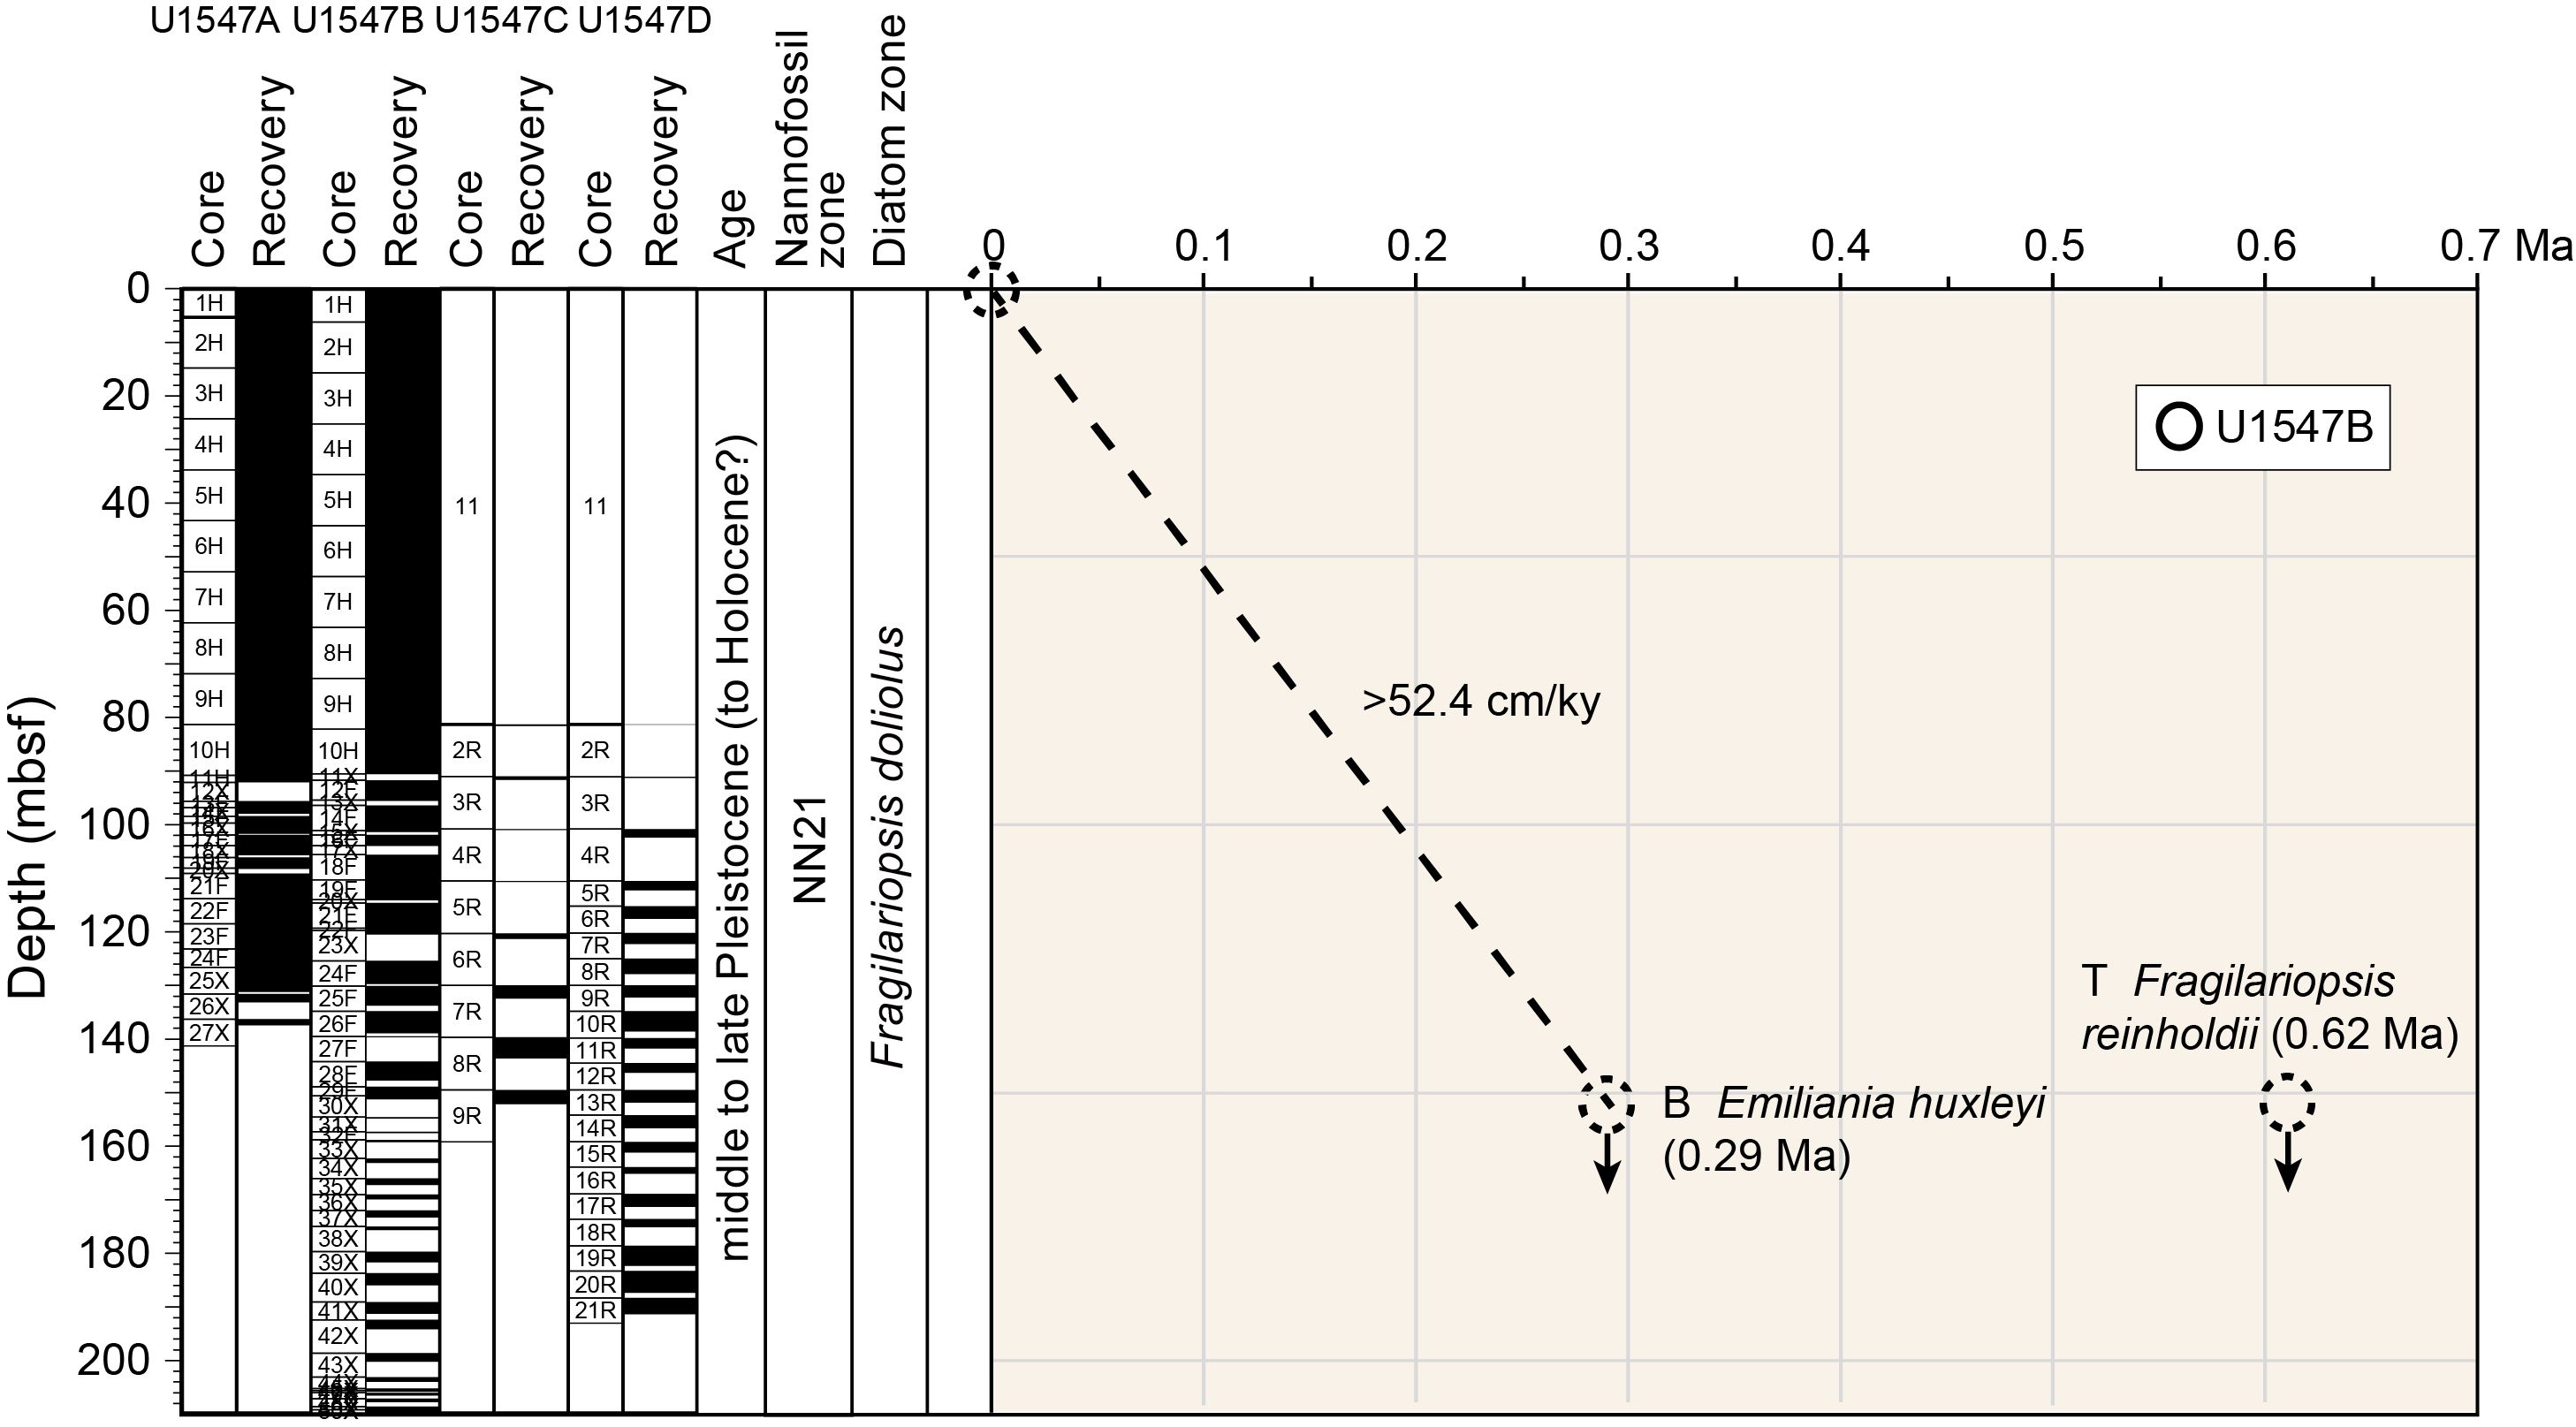
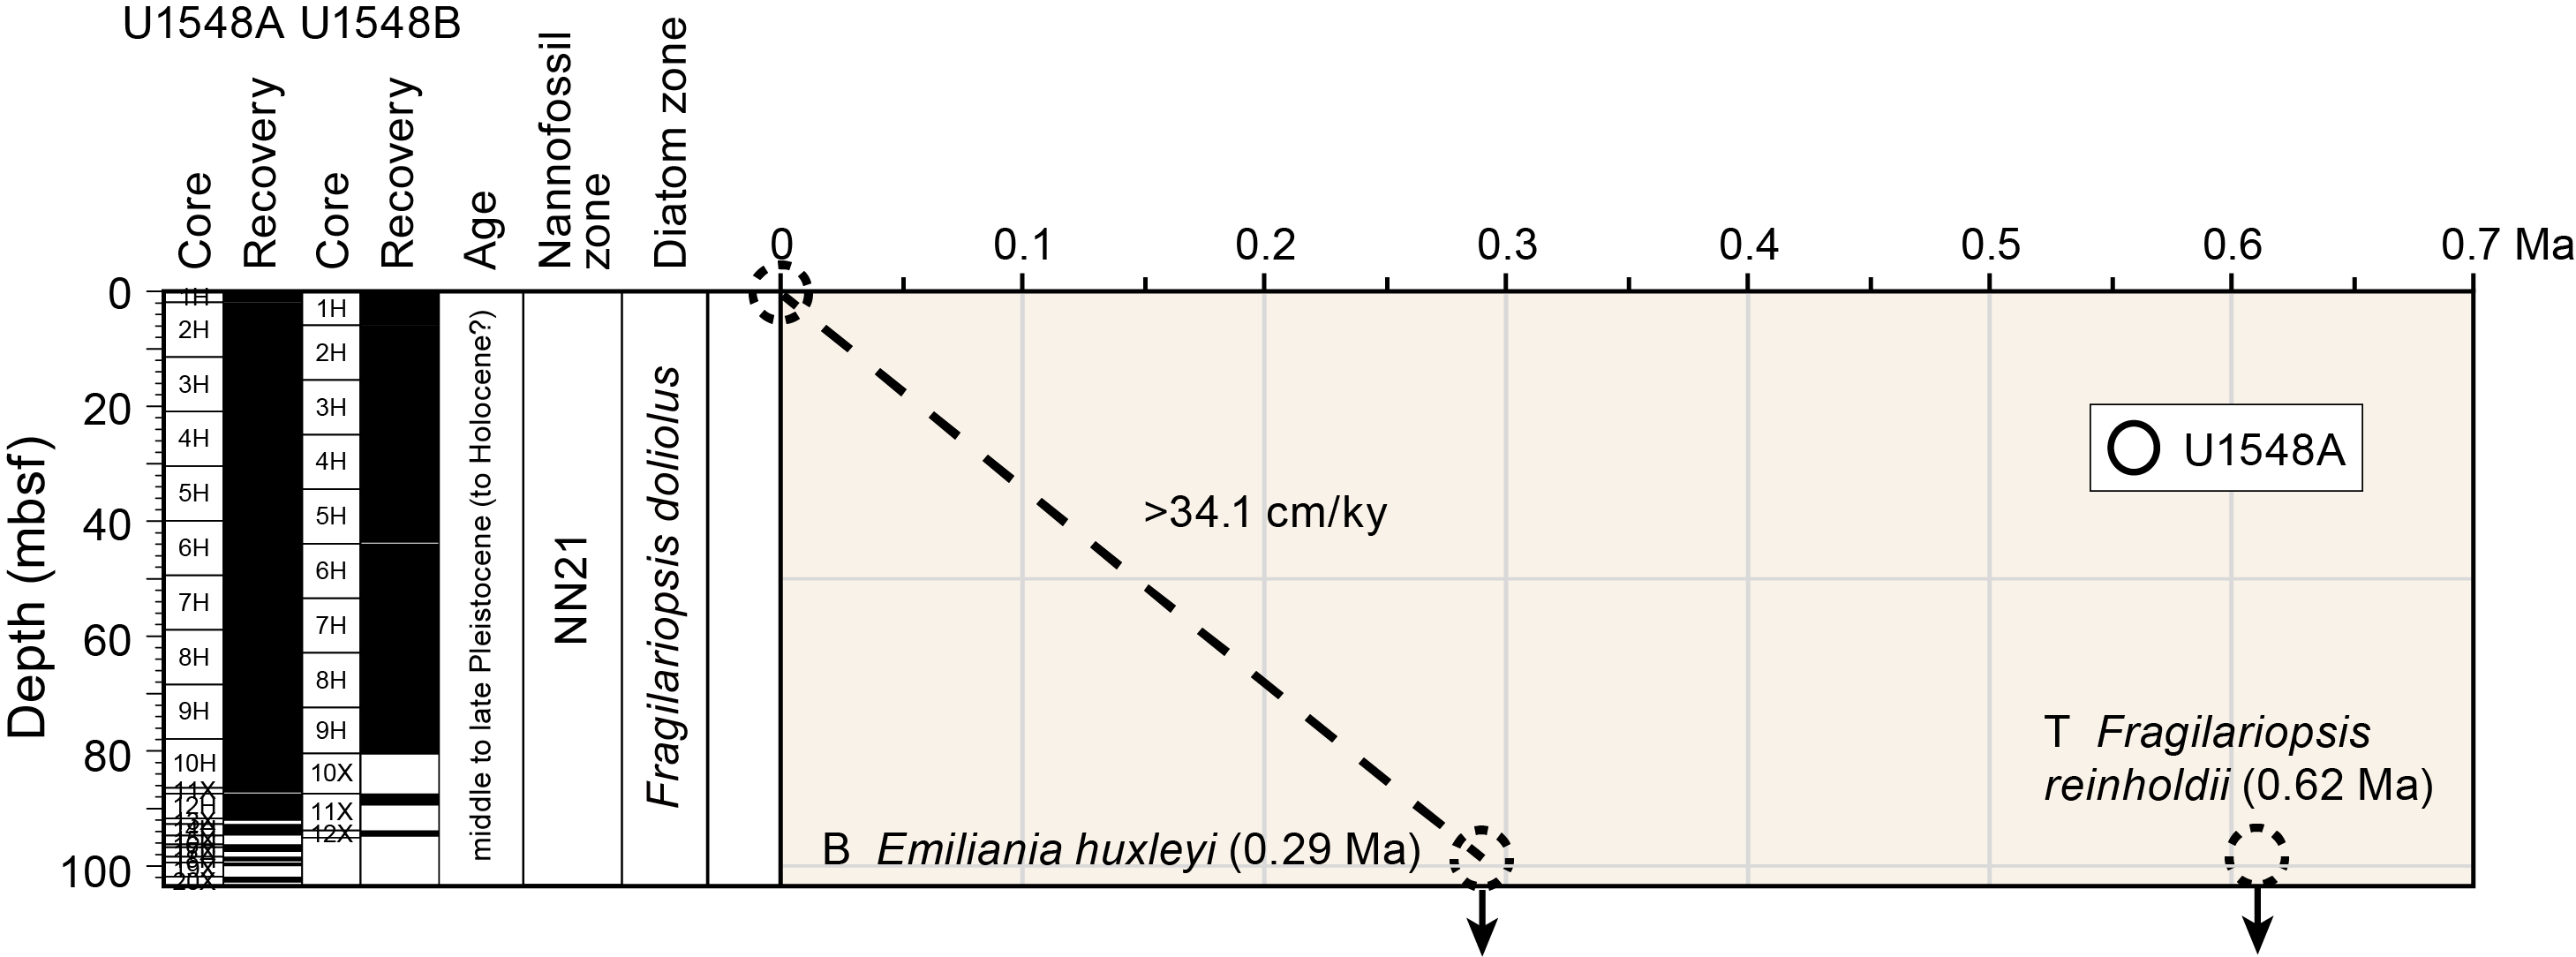
7.1. Calcareous nannofossils
Calcareous nannofossils are abundant to common in the upper part of the sediment succession in Hole U1547A (Cores 1H–5H; 0–43.51 mbsf). This interval is followed by one in which nannofossils are few or barren (Cores 6H–19F; 53.02–109.40 mbsf) except for the abundant occurrences in Sections 14X-CC (97.9 mbsf); 16X-2, 69 cm (101.4 mbsf); and 16X-CC (101.5 mbsf). Nannofossil abundance sharply increases in the lowermost part of Hole U1547A (Cores 21F–27X; 113.51–137 mbsf). The nannofossil abundance in Holes U1547B–U1547D correlates well with Hole U1547A and is similar to Hole U1548A in terms of variation with sample depth (Tables T9, T10).
Calcareous nannofossil preservation is generally good/moderate in samples with abundant or common nannofossils and poor in those with few or rare abundances in Holes U1547A–U1547D and Hole U1548A (Tables T9, T10). The downhole variation pattern in preservation is similar in all of these holes. Degraded preservation is usually associated with signs of dissolution and fragmentation.
There is a ubiquitous occurrence of reworked Cretaceous taxa in all holes at both sites. The origin of reworked nannofossils is uncertain, although possible sources may include eroded Cretaceous outcrops in the Colorado River catchment and Cretaceous chalk deposits underlying the Sierra Madre Occidental mountain range (McDougall and Martínez, 2014). The source of reworking will be analyzed in detail during postexpedition research.
The sediment sequences drilled in Holes U1547A–U1547D and Hole U1548A were assigned to Nannofossil Zone NN21 based on the presence of E. huxleyi throughout the intersected sedimentary sequences in each hole. The first appearance (bottom) of E. huxleyi (0.29 Ma), the nannofossil biostratigraphic datum identified at Sites U1545 and U1546, however, was estimated to occur below the bottom of the drilled sediments in Holes U1547A–U1547D and Hole U1548A (Table T9), indicating an age younger than 0.29 Ma for the entire Holocene or late to middle Pleistocene sediment succession at both Site U1547 and Site U1548.
7.2. Diatoms
In Hole U1547A, diatoms are abundant from the seafloor through Section 385-U1547A-25X-CC (131.21 mbsf) with good to moderate preservation. In Sections 385-U1547A-27X-2 (136.9 mbsf) through 27X-CC (137.48 mbsf), diatoms were not found due to diagenetic alteration in the sediments (Table T11). The first two sections analyzed in Hole U1547B (Table T14), 385-U1547B-12F-CC (95.54 mbsf) and 14F-CC (101.15 mbsf), yielded abundant diatoms with poor/moderate preservation. In Sections 16F-CC (104.31 mbsf) and 18F-CC (110.32 mbsf), diatoms are common. Although more fragments were found, indicating poor preservation, diatoms were identified down to species level. In Sections 21F-CC (119.19 mbsf) through 29F-3 (151.93 mbsf), diatoms were not found.
An overview of identified diatom taxa and their observed preservation in Holes U1547A and U1547B is shown in photomicrograph Plates 2–5 in DIATOMS in Supplementary material.
Both Holes U1547C and U1547D were drilled without core recovery to 81.3 mbsf. Diatoms turned out to be common to rare in Hole U1547C sediments below this depth (Sections 2R-CC [81.6 mbsf] through 6R-CC [121.13 mbsf]), and recovered sediments in Hole U1547D are barren of diatoms (Sections 3R-CC [91.25 mbsf] and 4R-1 [101.33 mbsf]) (Table T14) in the ~20–40 m of indurated sediment recovered above the underlying sill in both holes.
In Hole U1548A, diatoms are abundant with moderate preservation from Section 385-U1548A-CC (1.83 mbsf) to Sample 10H-3, 50 cm (81.4 mbsf). In the bottom sediment sections of Hole U1548A, from Sample 12H-3, 50 cm (90.9 mbsf), to Sample 18H-1, 60 cm, diatom preservation is poor (see photomicrograph Plate 9 in DIATOMS in Supplementary material for typical diatom preservation documentation for Expedition 385 drill sites based on photomicrographs taken in Holes U1545A and U1546A). Numerous fragments from thicker-shelled species were observed in smear slides. They were identified down to species level in most cases (Table T14).
At Sites U1547 and U1548, no age-diagnostic diatom species were found, suggesting an age younger than 0.62 Ma, as indicated by the top/LAD of F. reinholdii (Tables T11, T14).
8. Paleomagnetism
Paleomagnetic shipboard measurements consisted of the analysis of the NRM on archive-half sections and discrete samples from Sites U1547 and U1548 to establish a magnetostratigraphy of the Ringvent sites. Representative discrete sediment samples were collected from each APC and HLAPC core from Holes U1547A, U1548A, and U1548C–U1548E (one to two samples per APC core; one sample per HLAPC core) and from the first two XCB cores from Hole U1547A (385-U1547A-16X and 18X). Highly disturbed sediments in other XCB cores (see Lithostratigraphy) prevented us from collecting suitable shipboard samples for paleomagnetic measurements. NRM measurements were conducted on igneous rock cores from Holes U1547B–U1547E, U1548A, and U1548C. No measurements were carried out on sediment sections from Holes U1547B and U1548B because of the absence in the sediment record of magnetic excursions and reversals (see Magnetostratigraphy).
8.1. Archive-half section analysis
8.1.1. Site U1547
Cores from Holes U1547A–U1547E were studied. Hole U1547A contains mainly sediments, whereas the four other holes were dedicated to the study of the occurrence of sill intrusions and associated contact zones to surrounding sediments.
8.1.1.1. Sediments from Hole U1547A
Archive-half sections from Hole U1547A were demagnetized at 5 cm intervals up to 20 mT. With the exception of highly disturbed archive-half sections, all sections in Hole U1547A were analyzed.
In-line AF demagnetization of APC, HLAPC, and XCB archive halves from Hole U1547A (Cores 385-U1547A-1H through 27X) indicate a drilling overprint that is slight for Sections 1H-1 through 5H-5 and becomes stronger for the underlying sediment sections (~40 to ~130 mbsf) (Figure F30A). The drilling overprint was successfully removed by an AF demagnetization treatment of 5–10 mT.
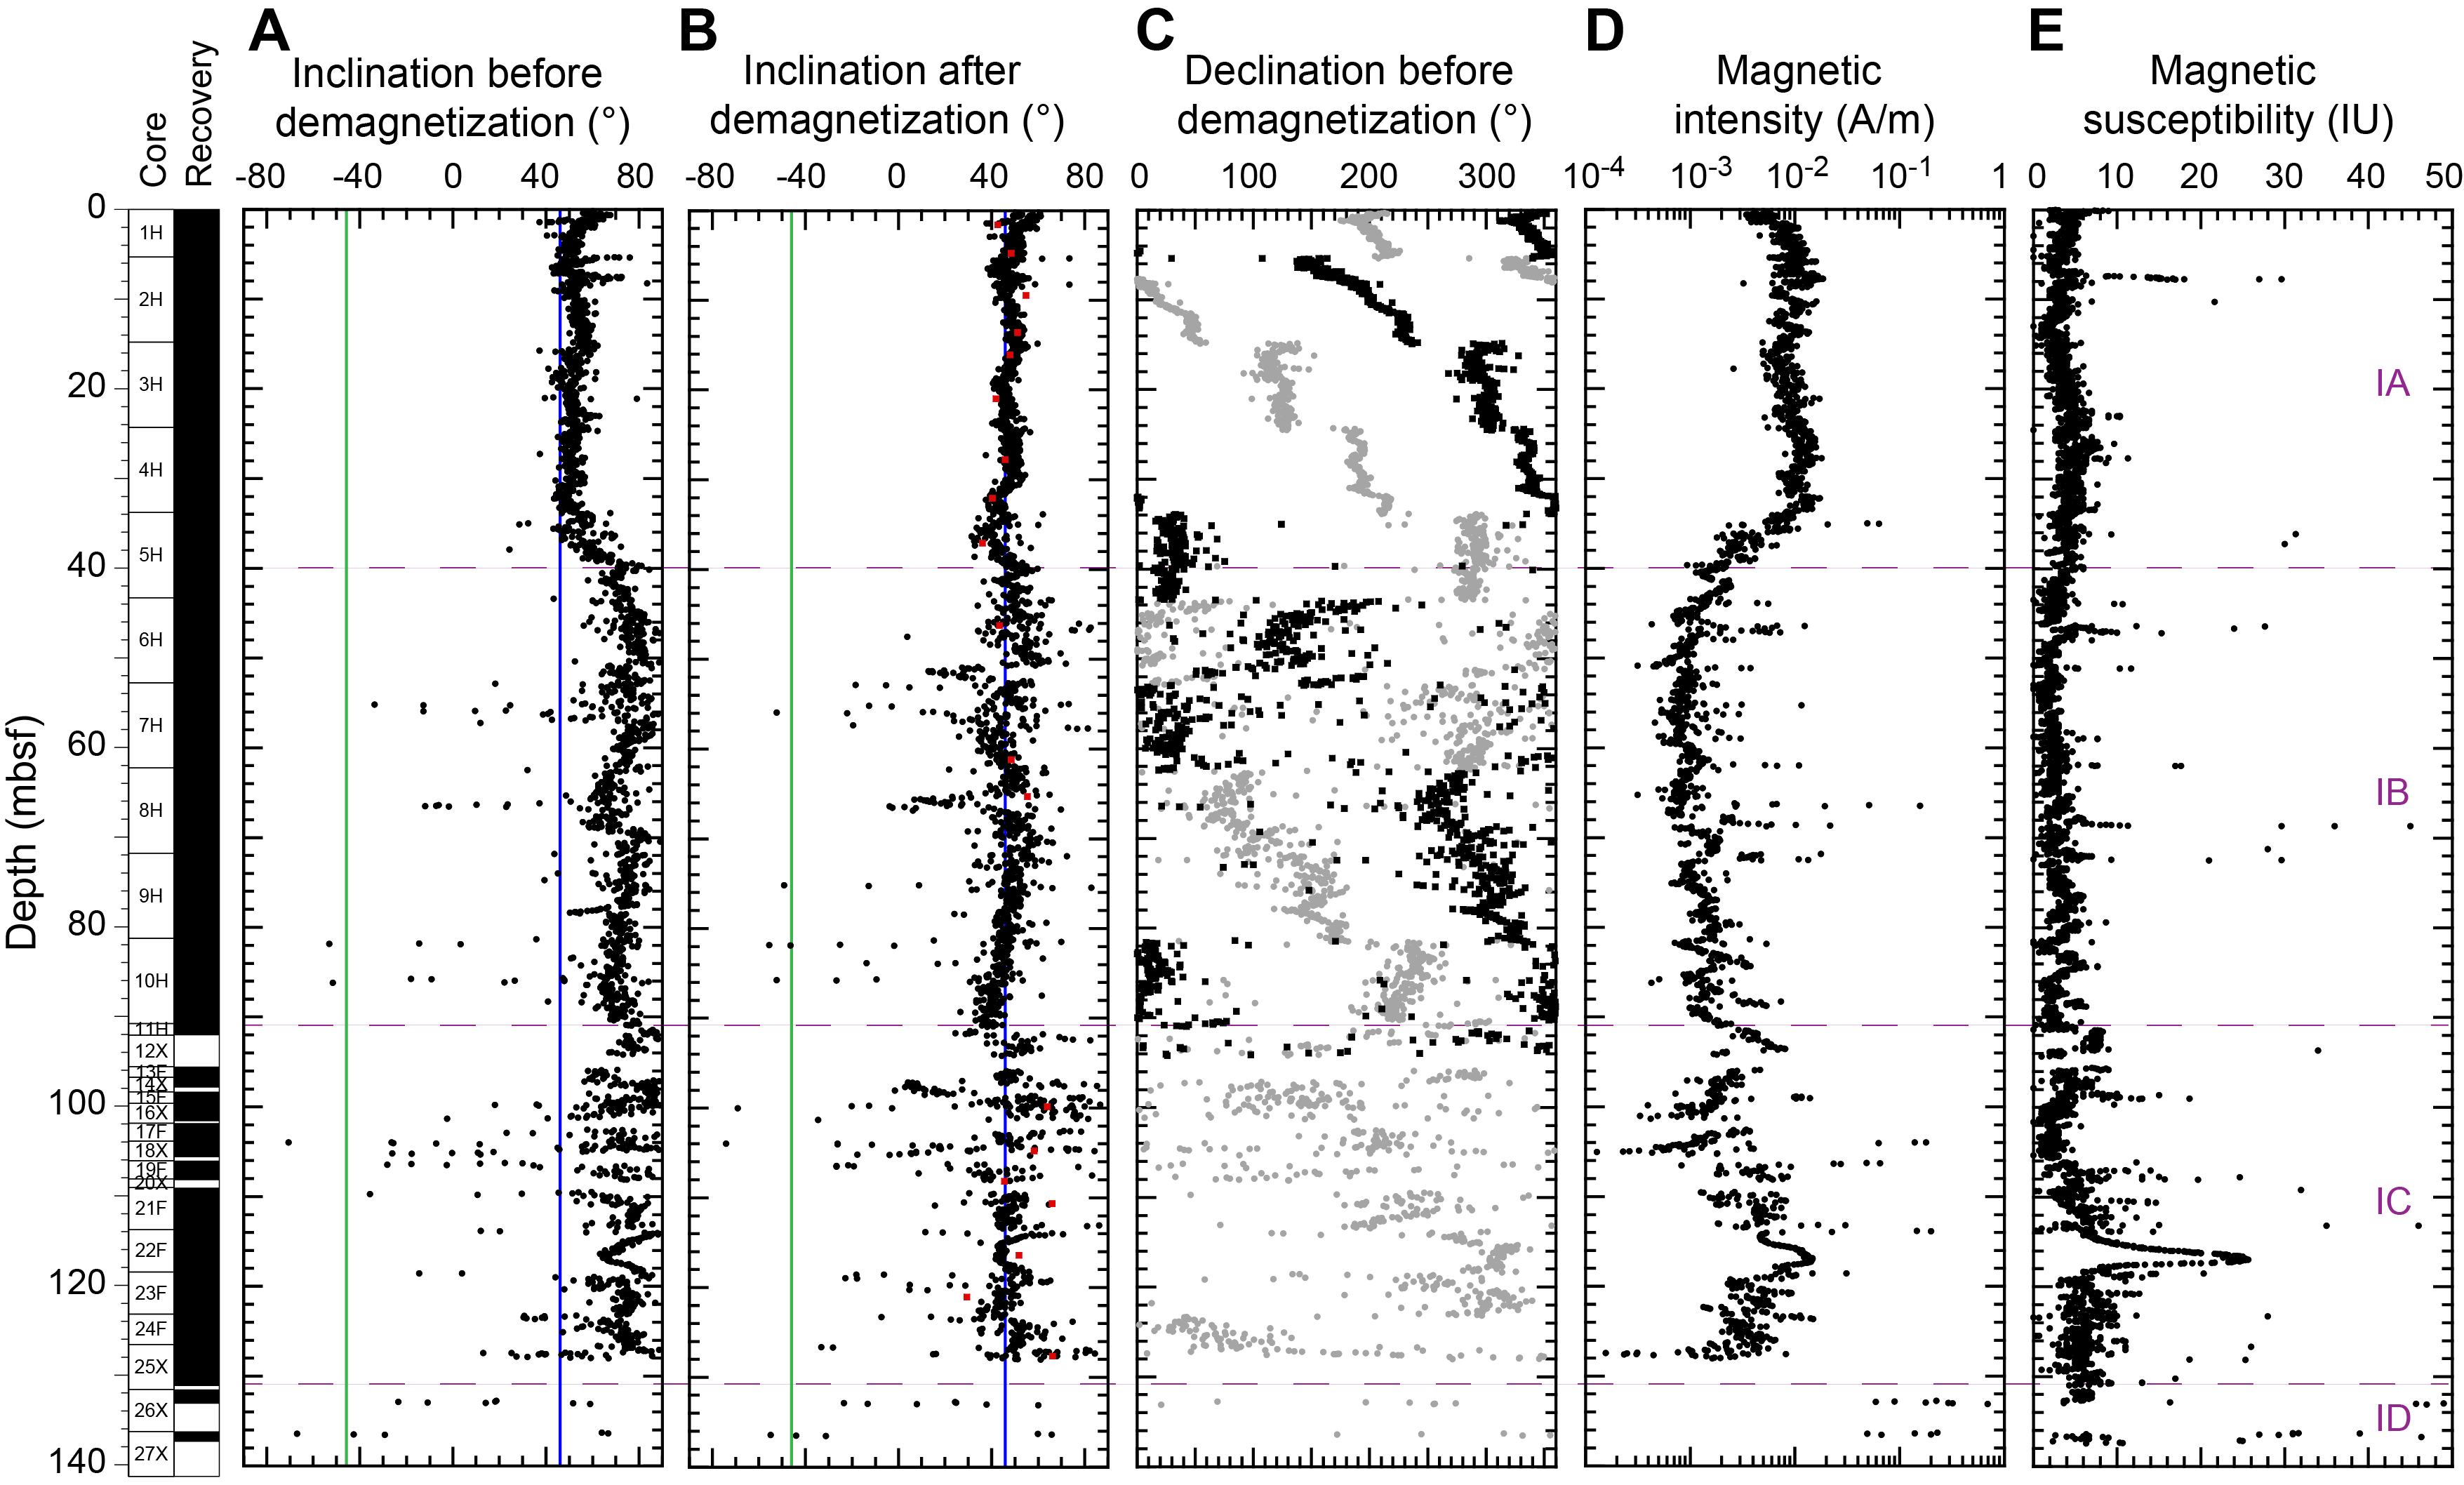
After AF demagnetization at 20 mT, inclination values for all sediment cores cluster around an average value of 46°, which corresponds to the expected GAD inclination value at the latitude of the site (~46.2°) (Figure F30B).
Magnetic intensity (Figure F30D) decreases downhole by an order of magnitude from ~34 to 40 mbsf. Magnetic intensity in the sediments remains low below 40 mbsf (<0.005 A/m), and MS does not exceed 10 instrumental units (IU) (Figure F30E) (see Petrophysics), as previously observed for Sites U1545 and U1546 (see Paleomagnetism in the Site U1545 and Site U1546 chapters [Teske et al., 2021b, 2021c]). Two intervals at 90–95 mbsf (Core 385-U1547A-10H) and 115–120 mbsf (Cores 22F and 23F) show higher magnetic intensity (Figure F30D). These intervals correspond to silty layers (see the VCDs in Core descriptions), suggesting a significant terrigenous supply of magnetic minerals.
8.1.1.2. Igneous rocks from Holes U1547B–U1547E
NRM of igneous archive-half sections with oriented igneous pieces from Holes U1547B–U1547E was measured (Figure F31). No AF demagnetization was conducted because this protocol was demonstrated to not be appropriate for the igneous rocks recovered at Site U1546 (see Paleomagnetism in Site U1546 chapter [Teske et al., 2021c]). Magnetic intensity in Hole U1547B is generally high, up to ~9 A/m (average = ~1.6 A/m), and it is higher in the deeper igneous intervals of the hole (deeper than 200 mbsf). In Hole U1547C, magnetic intensity averages ~0.2 A/m. Magnetic intensity in Holes U1547D and U1547E averages ~1 A/m with maximum values of ~5 A/m. NRM values measured on discrete samples are generally higher than those measured with the SRM on archive-half sections. Magnetic intensity trends are mirrored in the point MS downhole profile (Figure F31). Intervals with higher (lower) magnetic intensity have higher (lower) MS values. In Holes U1547D and U1547E, intervals of lower magnetic intensity and susceptibility (e.g., ~150–158 mbsf in Hole U1547D and ~175–178 mbsf in Hole U1547E) alternate with intervals of higher magnetic intensity and susceptibility.
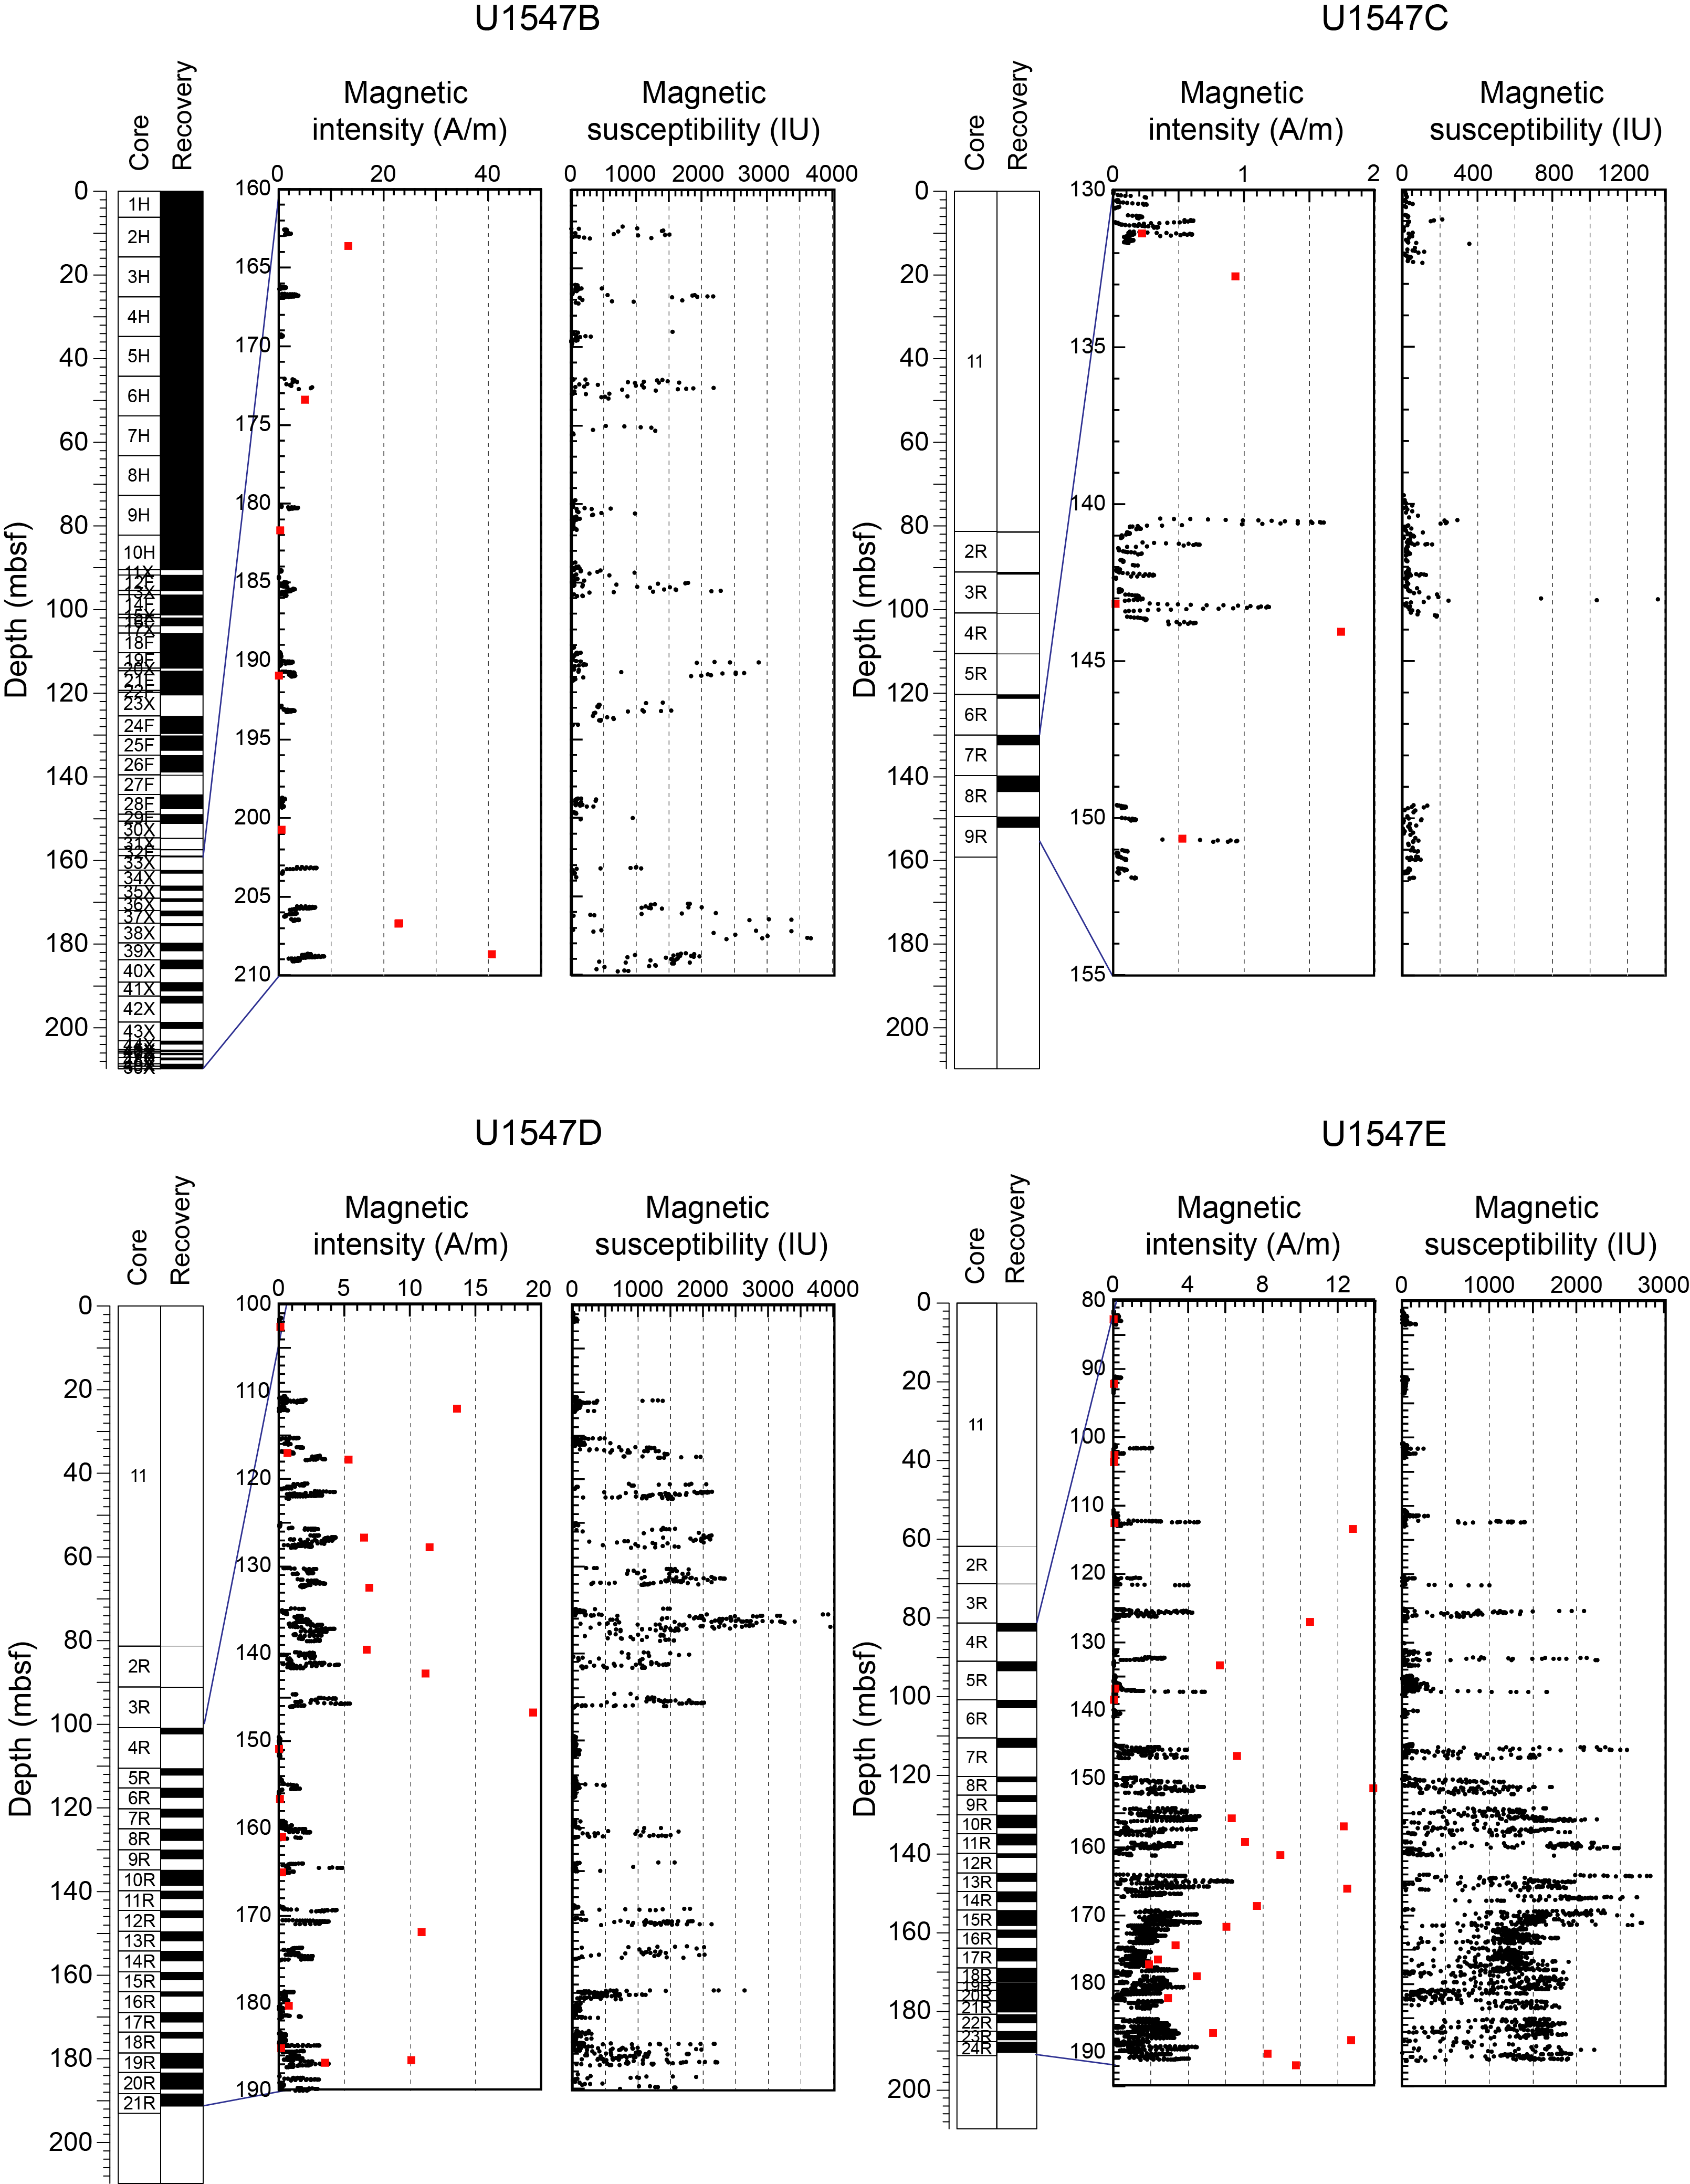
8.1.2. Site U1548
8.1.2.1. Holes U1548A and U1548C
Archive-half sections from Holes U1548A and U1548C were demagnetized at 5 cm intervals up to 20 mT. With the exception of highly disturbed archive-half sections, all sections in Holes U1548A and U1548C were analyzed.
In-line AF demagnetization of APC and HLAPC archive halves from Hole U1548A (Cores 385-U1548A-1H through 18H) indicate a slight drilling overprint for Sections 1H-1 through 5H-5. It becomes stronger for the underlying sediment sections (~40 to ~130 mbsf) (Figure F32A). In Hole U1548C (Cores 385-U1548C-1H through 7H), the drilling overprint becomes apparent from Core 3H downhole (Figure F33A). The drilling overprint was successfully removed by an AF demagnetization treatment of 5–10 mT.
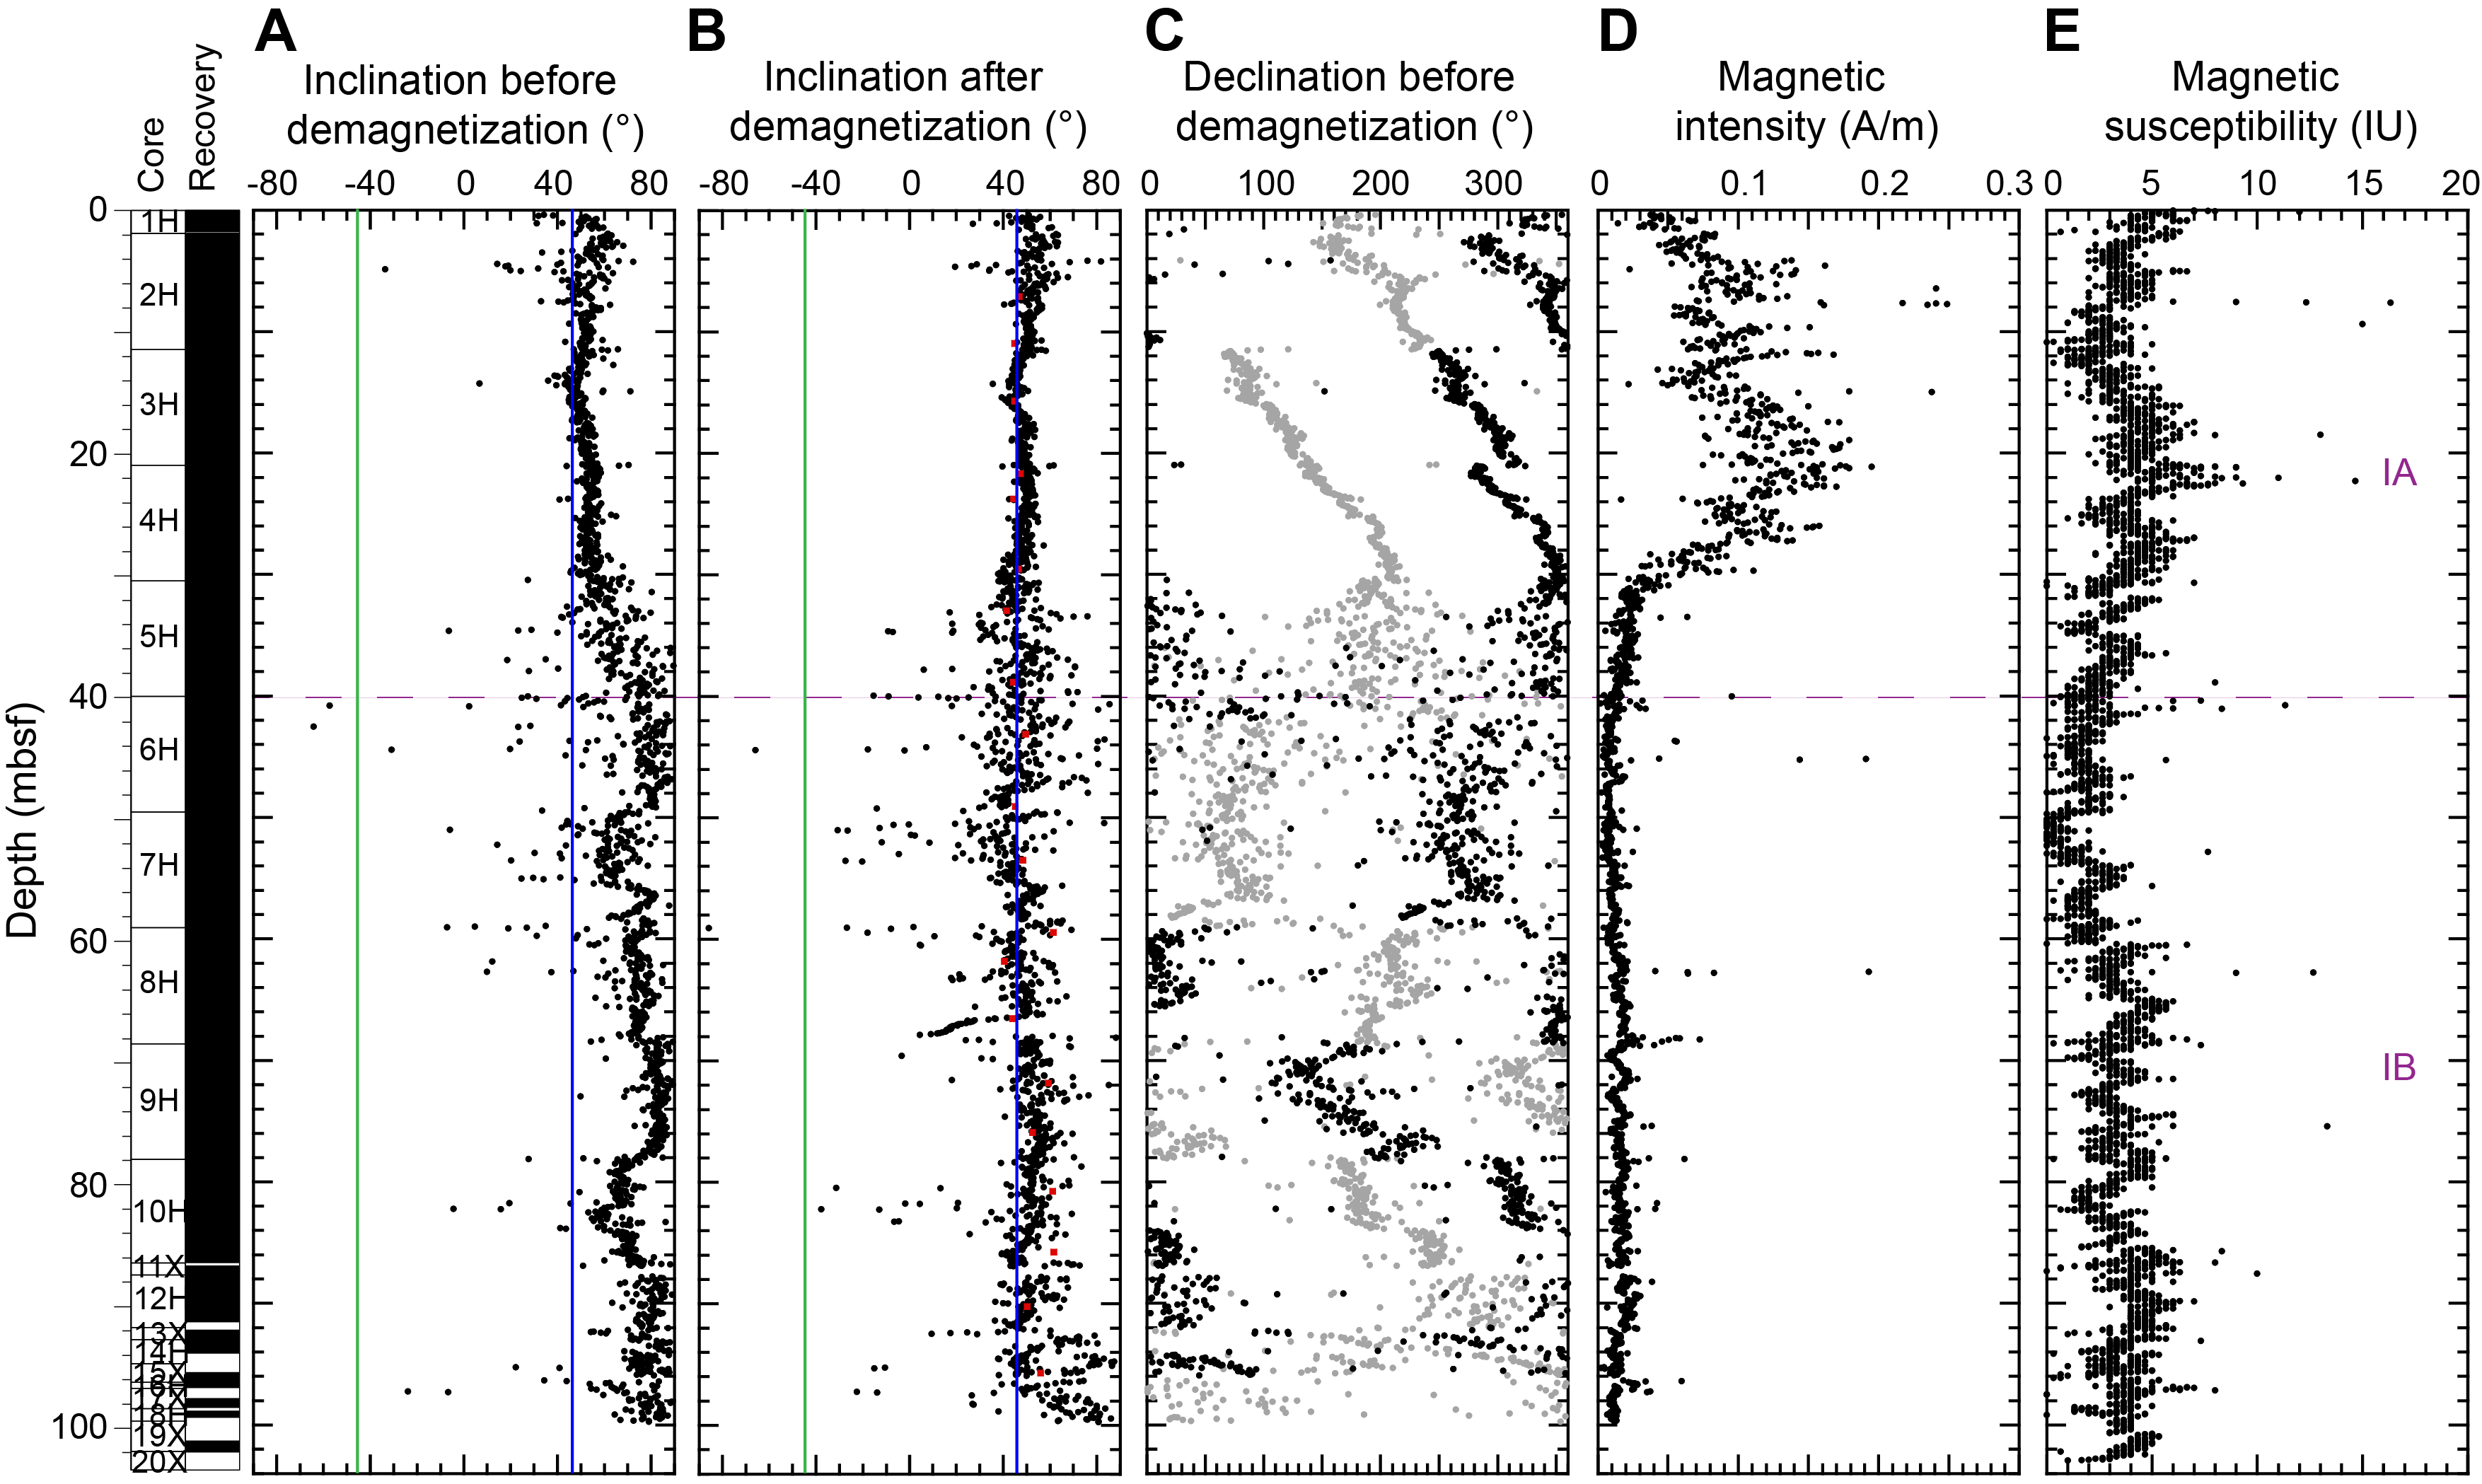

After AF demagnetization at 20 mT, inclination values for all sediment cores in Hole U1548A cluster around an average value of 47°, which corresponds to the expected GAD inclination value at the latitude of the site (~46.2°) (Figure F32B). In Hole U1548C, the mean inclination value is ~40°, which is low compared to Hole U1548A (Figure F33B). This discrepancy can be explained by a more disturbed (negative inclinations) and discontinuous record in Hole U1548C sediments (Figure F33B).
Magnetic intensity in Hole U1548A (Figure F32D) decreases by one order of magnitude between ~26 and ~30 mbsf, similar to observations at Site U1547. Magnetic intensity in the sediments remains low below this depth (<0.005 A/m), and MS does not exceed 10 IU (Figure F32E) (see Petrophysics), as previously observed for Sites U1545 and U1546 (see Paleomagnetism in the Site U1545 and Site U1546 chapters [Teske et al., 2021b, 2021c]). Similar trends are observed in Hole U1548C sediments (Figure F33D). Magnetic intensity decreases by one order of magnitude between ~16 and 18 mbsf and remains <0.03 A/m below 18 mbsf. In contrast to Sites U1545 and U1546, where similar decreases in magnetic intensity are correlated with the SMTZ (see Paleomagnetism and Inorganic geochemistry in the Site U1545 and Site U1546 chapters [Teske et al., 2021b, 2021c]), the magnetic intensity decreases observed in Hole U1548A and U1548C sediments do not correspond to the SMTZ, which is located at ~100 mbsf in Hole U1548A and ~60 mbsf in Hole U1548C (see Inorganic geochemistry).
In Hole U1548C, the top part of a sill intrusion was recovered. NRM is observed up to ~6 A/m, two to three orders of magnitude higher than the sediments (Figure F33D).
8.1.2.2. Holes U1548D and U1548E
Archive-half sections from Holes U1548D and U1548E were demagnetized at 5 cm intervals up to 20 mT. With the exception of the first archive-half section for these two holes, all sections in Holes U1548D and U1548E were analyzed.
In-line AF demagnetization of APC and HLAPC archive halves from Cores 385-U1548D-1H through 13F and 385-U1548E-1H through 12H indicates a slight drilling overprint in Core 8H (from ~72 mbsf) from each hole (Figures F34A, F35A). The drilling overprint was successfully removed by an AF demagnetization treatment of 5–10 mT.
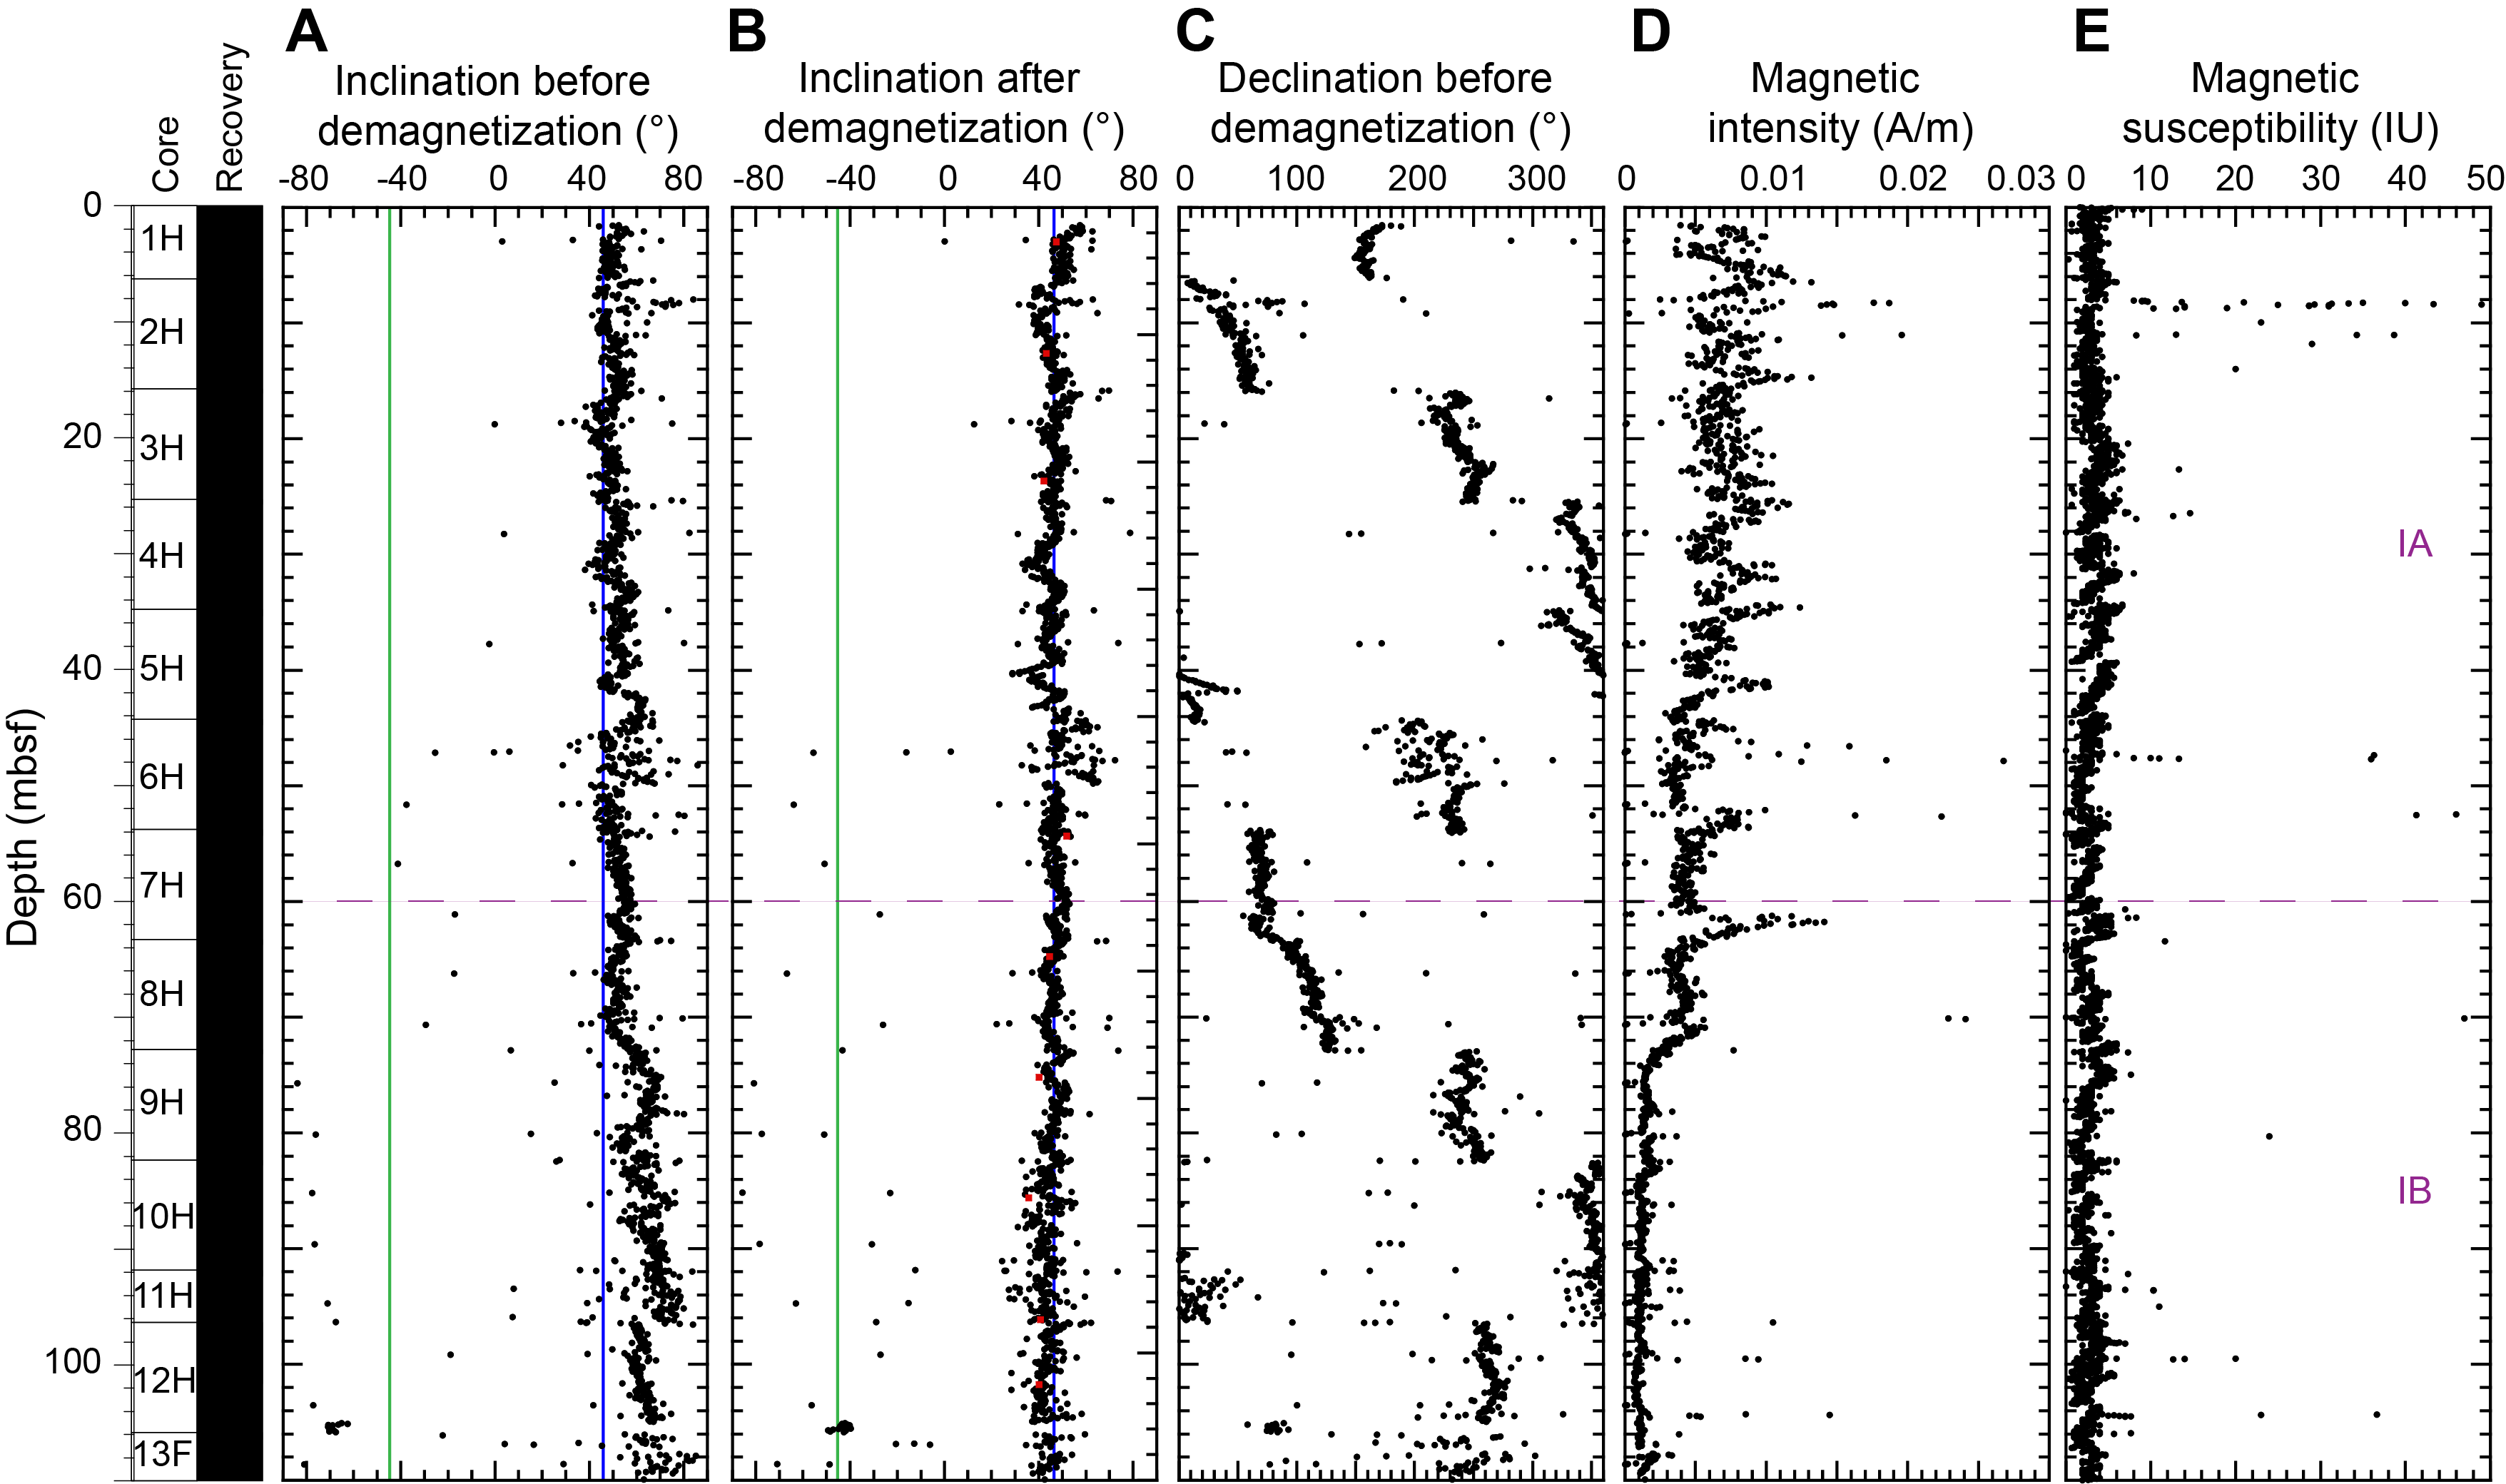
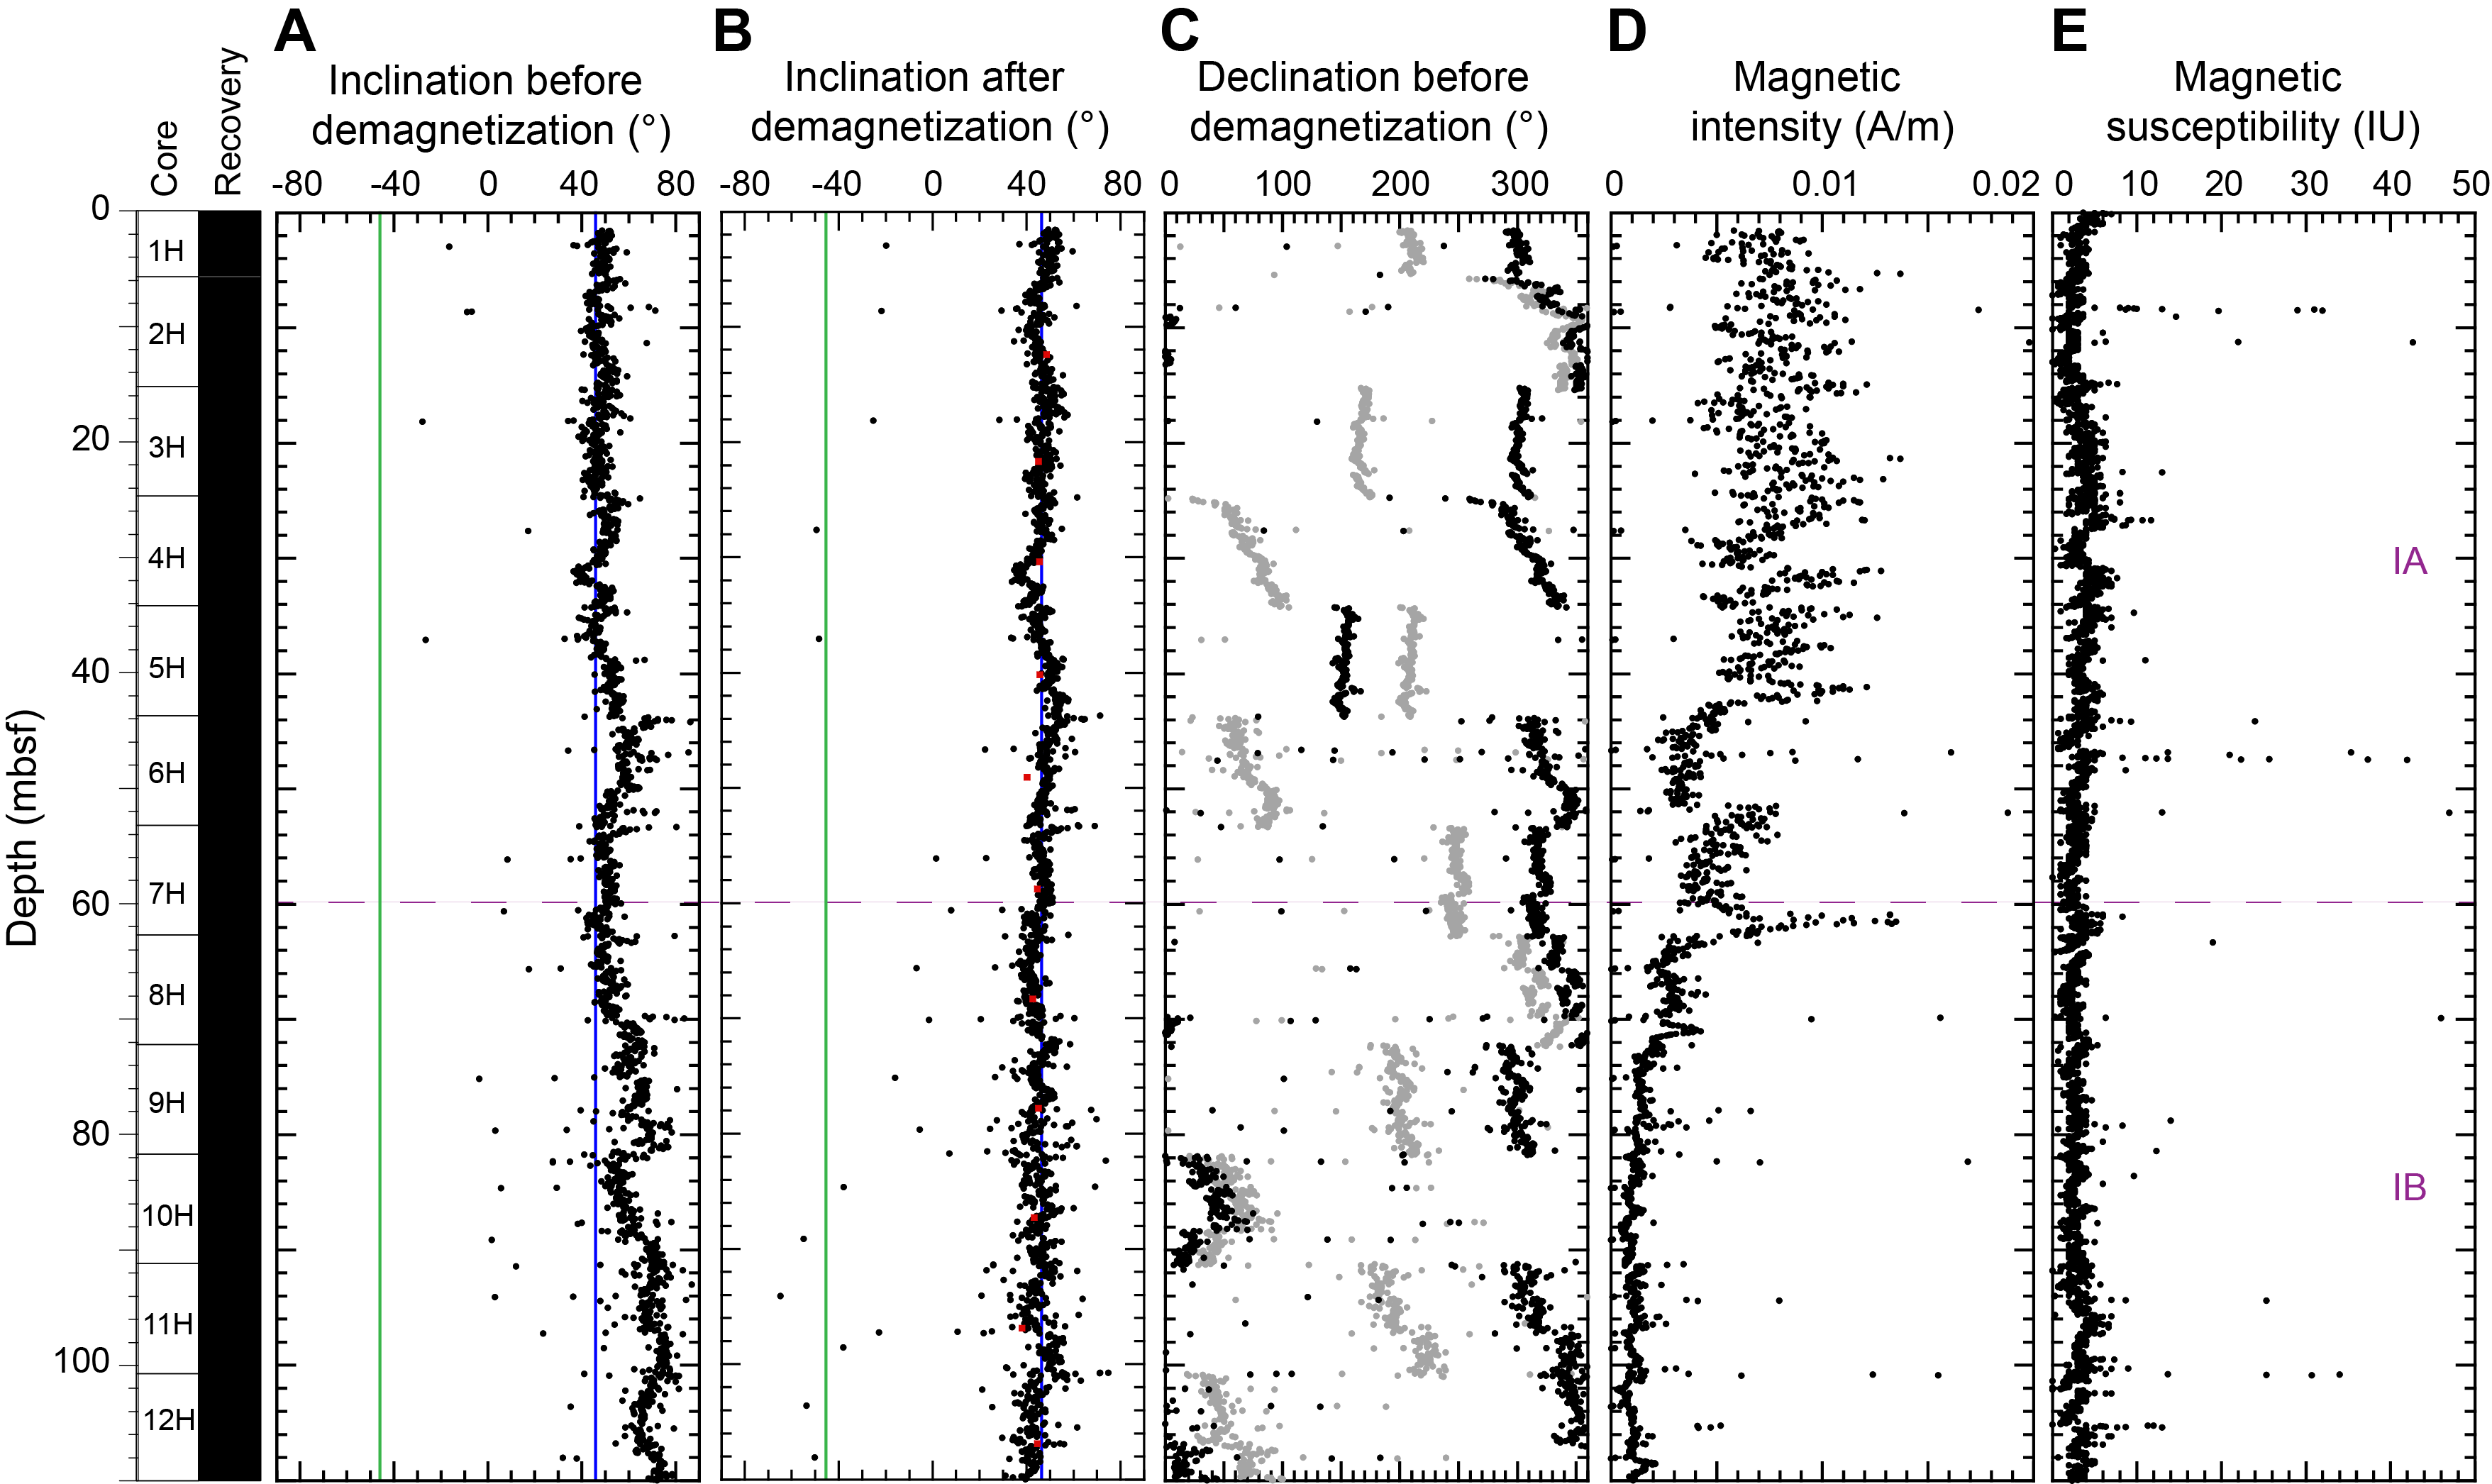
After AF demagnetization at 20 mT, inclination values in Holes U1548D and U1548E cluster around an average value of 43° and 45°, respectively, which is close to the expected GAD inclination value at the latitude of the site (~46.2°) (Figures F34B, F35B).
Magnetic intensity in Hole U1548D (Figure F34D) and Hole U1548E (Figure F35D) decreases at ~72 and ~64 mbsf, respectively, by a factor of 2 compared to the shallowest cores. Magnetic intensity in the sediments remains low below this depth (<0.005 A/m), and MS does not exceed 10 IU (Figures F34E, F35E) (see Petrophysics), as observed at Site U1547 and Sites U1545 and U1546 (see Paleomagnetism in the Site U1545 and Site U1546 chapters [Teske et al., 2021b, 2021c]). The magnetic intensity decrease observed in sediments is close to the SMTZ, which is located at ~76 mbsf in both holes (see Inorganic geochemistry).
8.2. Discrete sample analysis
8.2.1. Holes U1547A, U1548A, and U1548C
Discrete samples were taken from working-half sections from Holes U1547A, U1548A, and U1548C (Cores 385-U1547A-1H through 24F, 385-U1548A-2H through 16H, and 385-U1548C-1H through 7H) at intervals similar to previous sites. Because of the close distance between the holes (~450 m) and the similarity in results, results of these three holes were combined to calculate the remanence statistics presented in this analysis.
A total of fifty-nine 8 cm3 cube samples were analyzed and demagnetized using stepwise-increasing AF to isolate the ChRM direction using principal component analysis (PCA) (Kirschvink, 1980). NRM intensities vary between 4.97 × 10⁻⁴ A/m and 1.80 × 10⁻² A/m and have a mean intensity of 3.66 × 10⁻³ A/m (Table T15). AF demagnetization was done up to 60 mT, at which point the samples had lost more than 90% of their total magnetization (Figure F36B). Representative demagnetization diagrams (Zijderveld, 1967) are shown in Figure F36A. All reported declination and inclination data are shown in the sample coordinate reference frame. However, because cores are free to rotate in the core barrel, only the inclination data are taken into account for interpretation. Two magnetic components can be identified on the demagnetization diagrams in some discrete samples (Figure F36A). The first component was removed by an AF demagnetization treatment of 5–10 mT and corresponds to a drilling overprint. The stable component is found in all samples and points toward the origin. This component is of normal polarity for all analyzed discrete samples. The median destructive field ranges from 3.8 to 24.8 mT with a mean of 11.7 mT, similar to the findings at previous sites. This suggests a magnetic mineral assemblage dominated by low-coercivity (titano)magnetite.
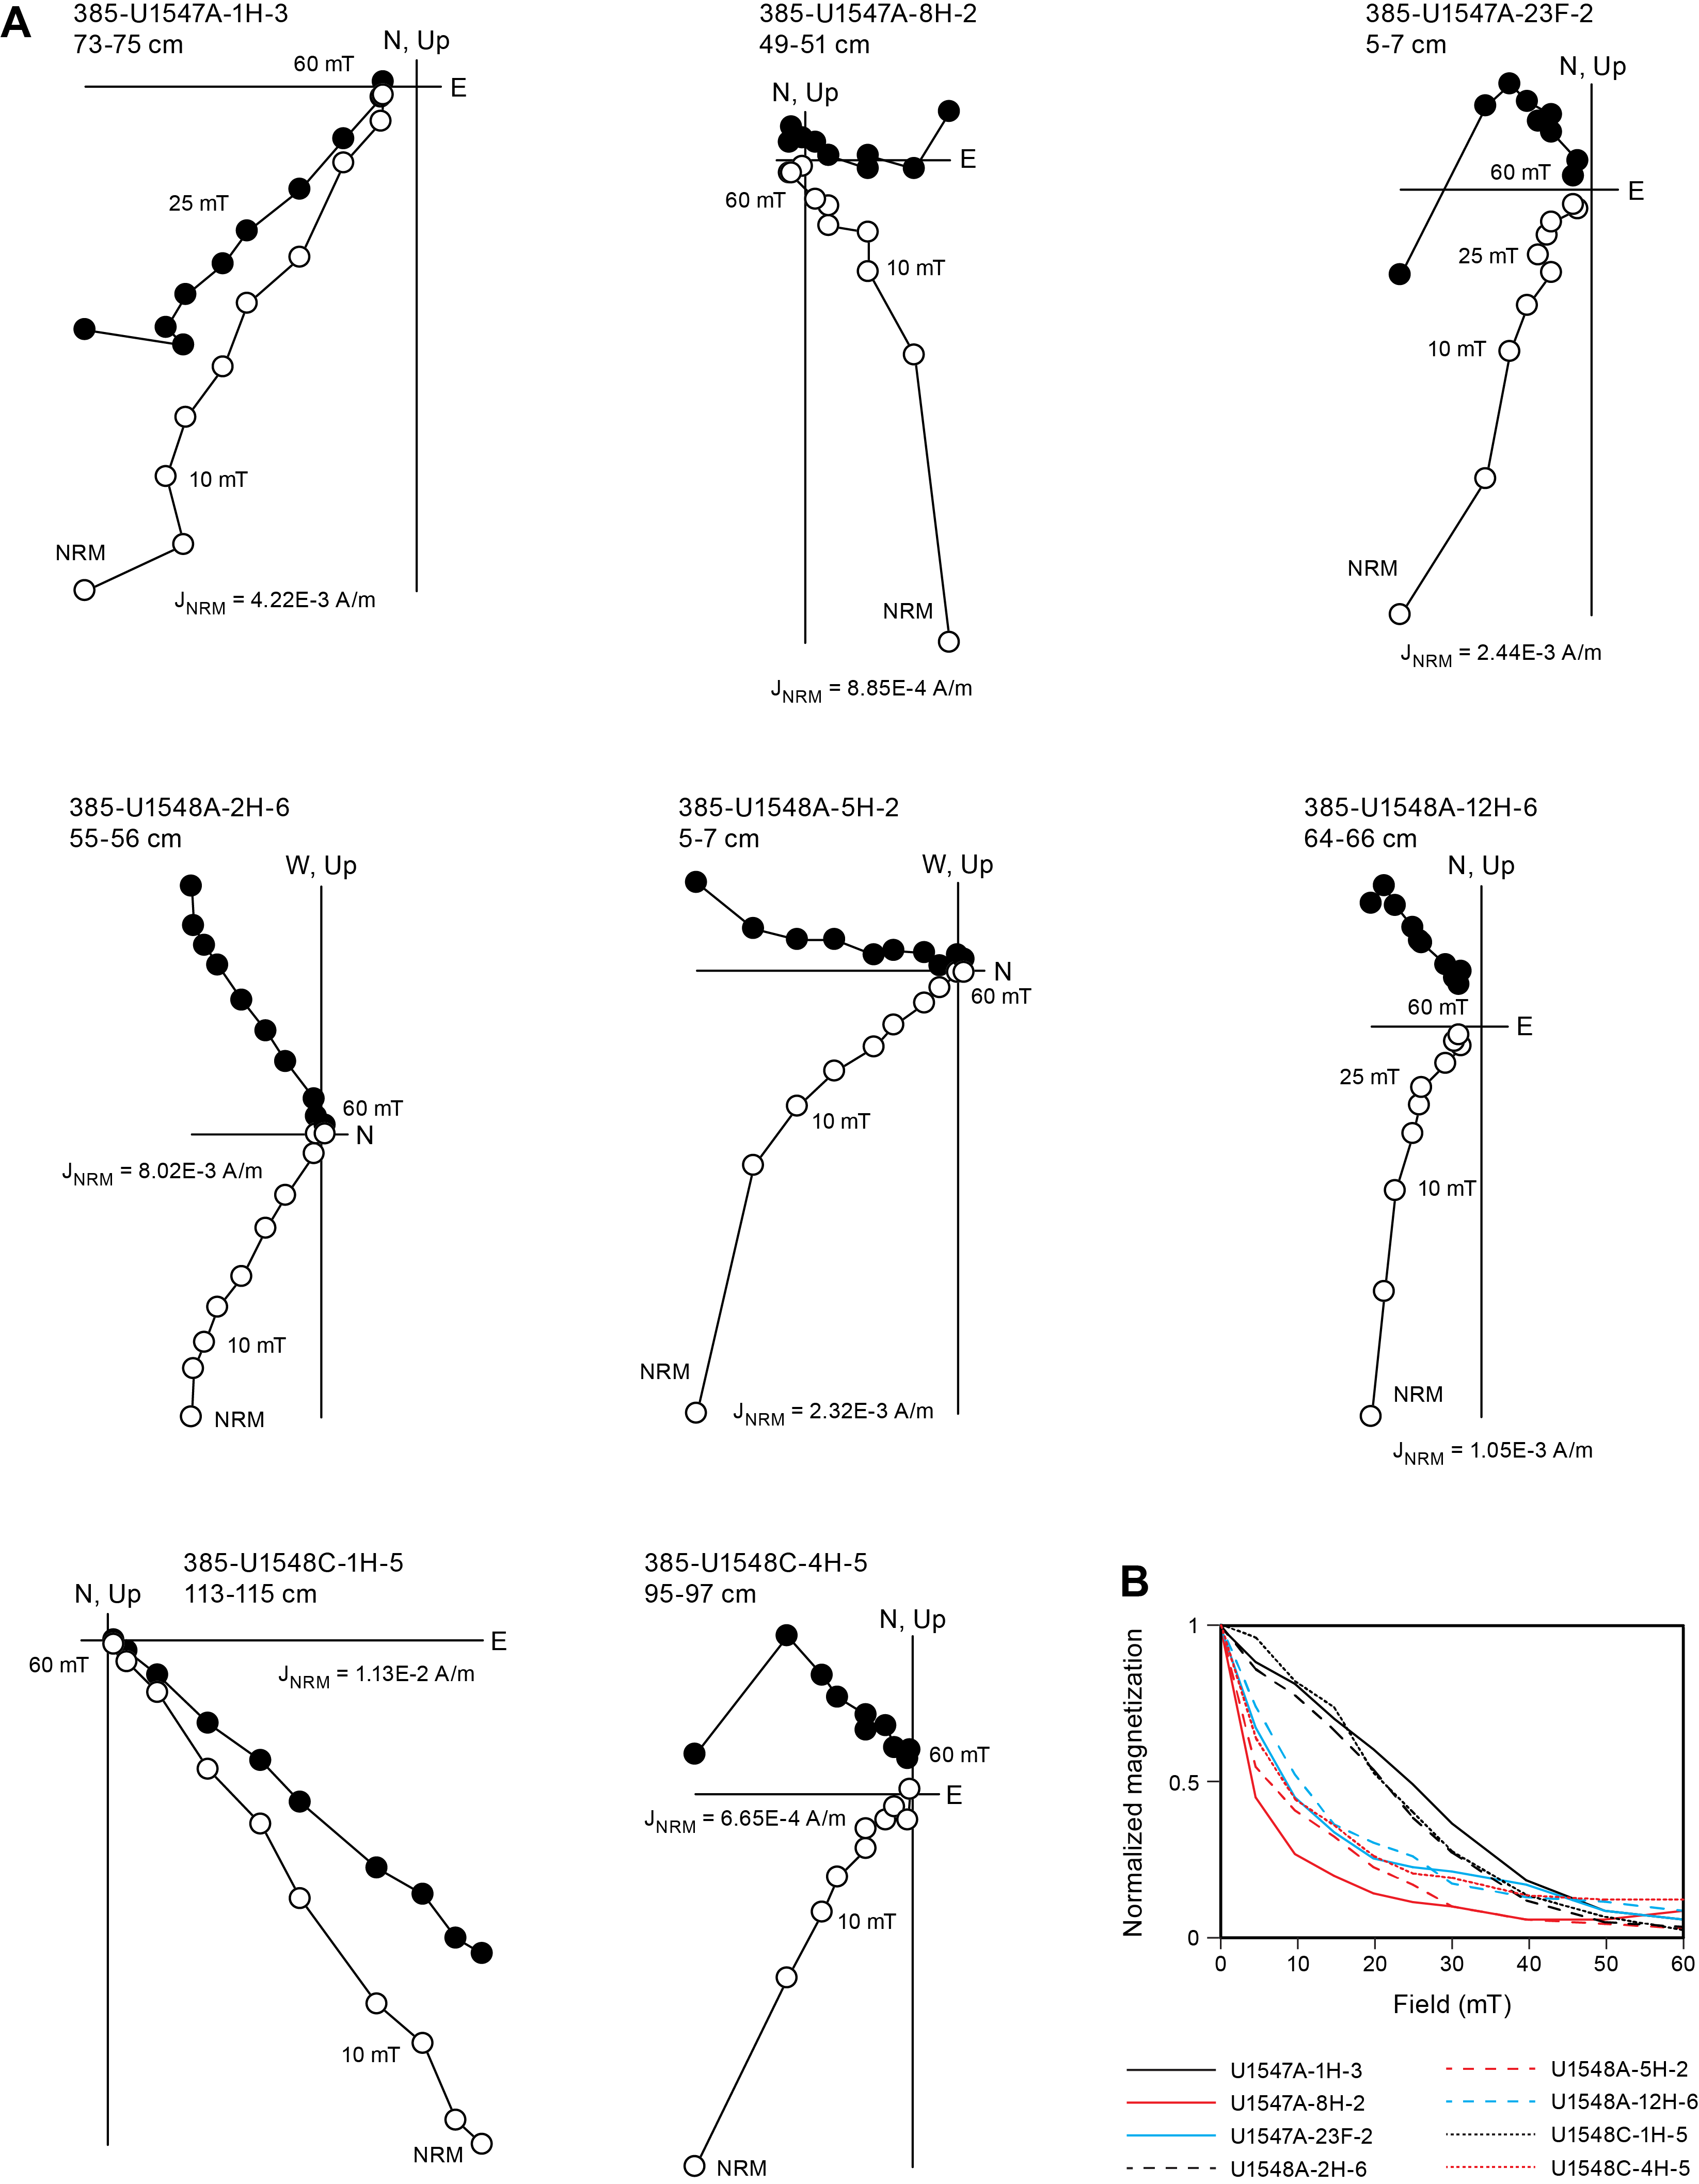
The distribution of the NRM inclinations after AF demagnetization at 20 mT and the ChRM of all discrete samples are shown in Figure F37. The majority of the NRM inclinations are steep, ranging from 21.0° to 84.2° with a mean inclination of 61.9° (Figure F37A). AF demagnetization at 20 mT removed the overprint, resulting in a shallower and more consistent inclination of 41.4° (Figure F37B), similar to the results obtained from archive-half measurements (Figures F30, F32, F33, F34, F35) and similar to discrete sample results from previous sites. After PCA, mean inclinations for the ChRM were calculated using the maximum likelihood method of Arason and Levi (2010) (Table T16). The calculated mean inclination for the ChRM of Holes U1547A–U1548C combined is 49.2°, which is slightly higher than the GAD inclination expected at this location (~46.2°).

8.2.2. Holes U1548D and U1548E
Discrete samples were taken from the working-half sections of Cores 385-U1548D-1H through 13F and 385-U1548E-1H through 12H at intervals of one discrete sample per 9.5 m core. This provided a total of twenty-five 8 cm3 cube samples that were demagnetized using a stepwise-increasing AF to isolate the ChRM direction—the same approach as for the sediments in previous holes.
The mean NRM intensity of all samples is 4.17 × 10⁻³ A/m (Table T15). AF demagnetization removed more than 90% of the total magnetization when applying 60 mT (Figure F38B). Similar to the demagnetization results of previous holes, two magnetic components could be identified on the demagnetization diagrams in discrete samples (Figure F38A). The first component (0–10 mT) corresponds to a drilling overprint, and the stable component (ChRM) goes toward the origin. This component is of normal polarity for all analyzed discrete samples. A mean median destructive field of 17.0 mT suggests a magnetic mineral assemblage dominated by low-coercivity (titano)magnetite.
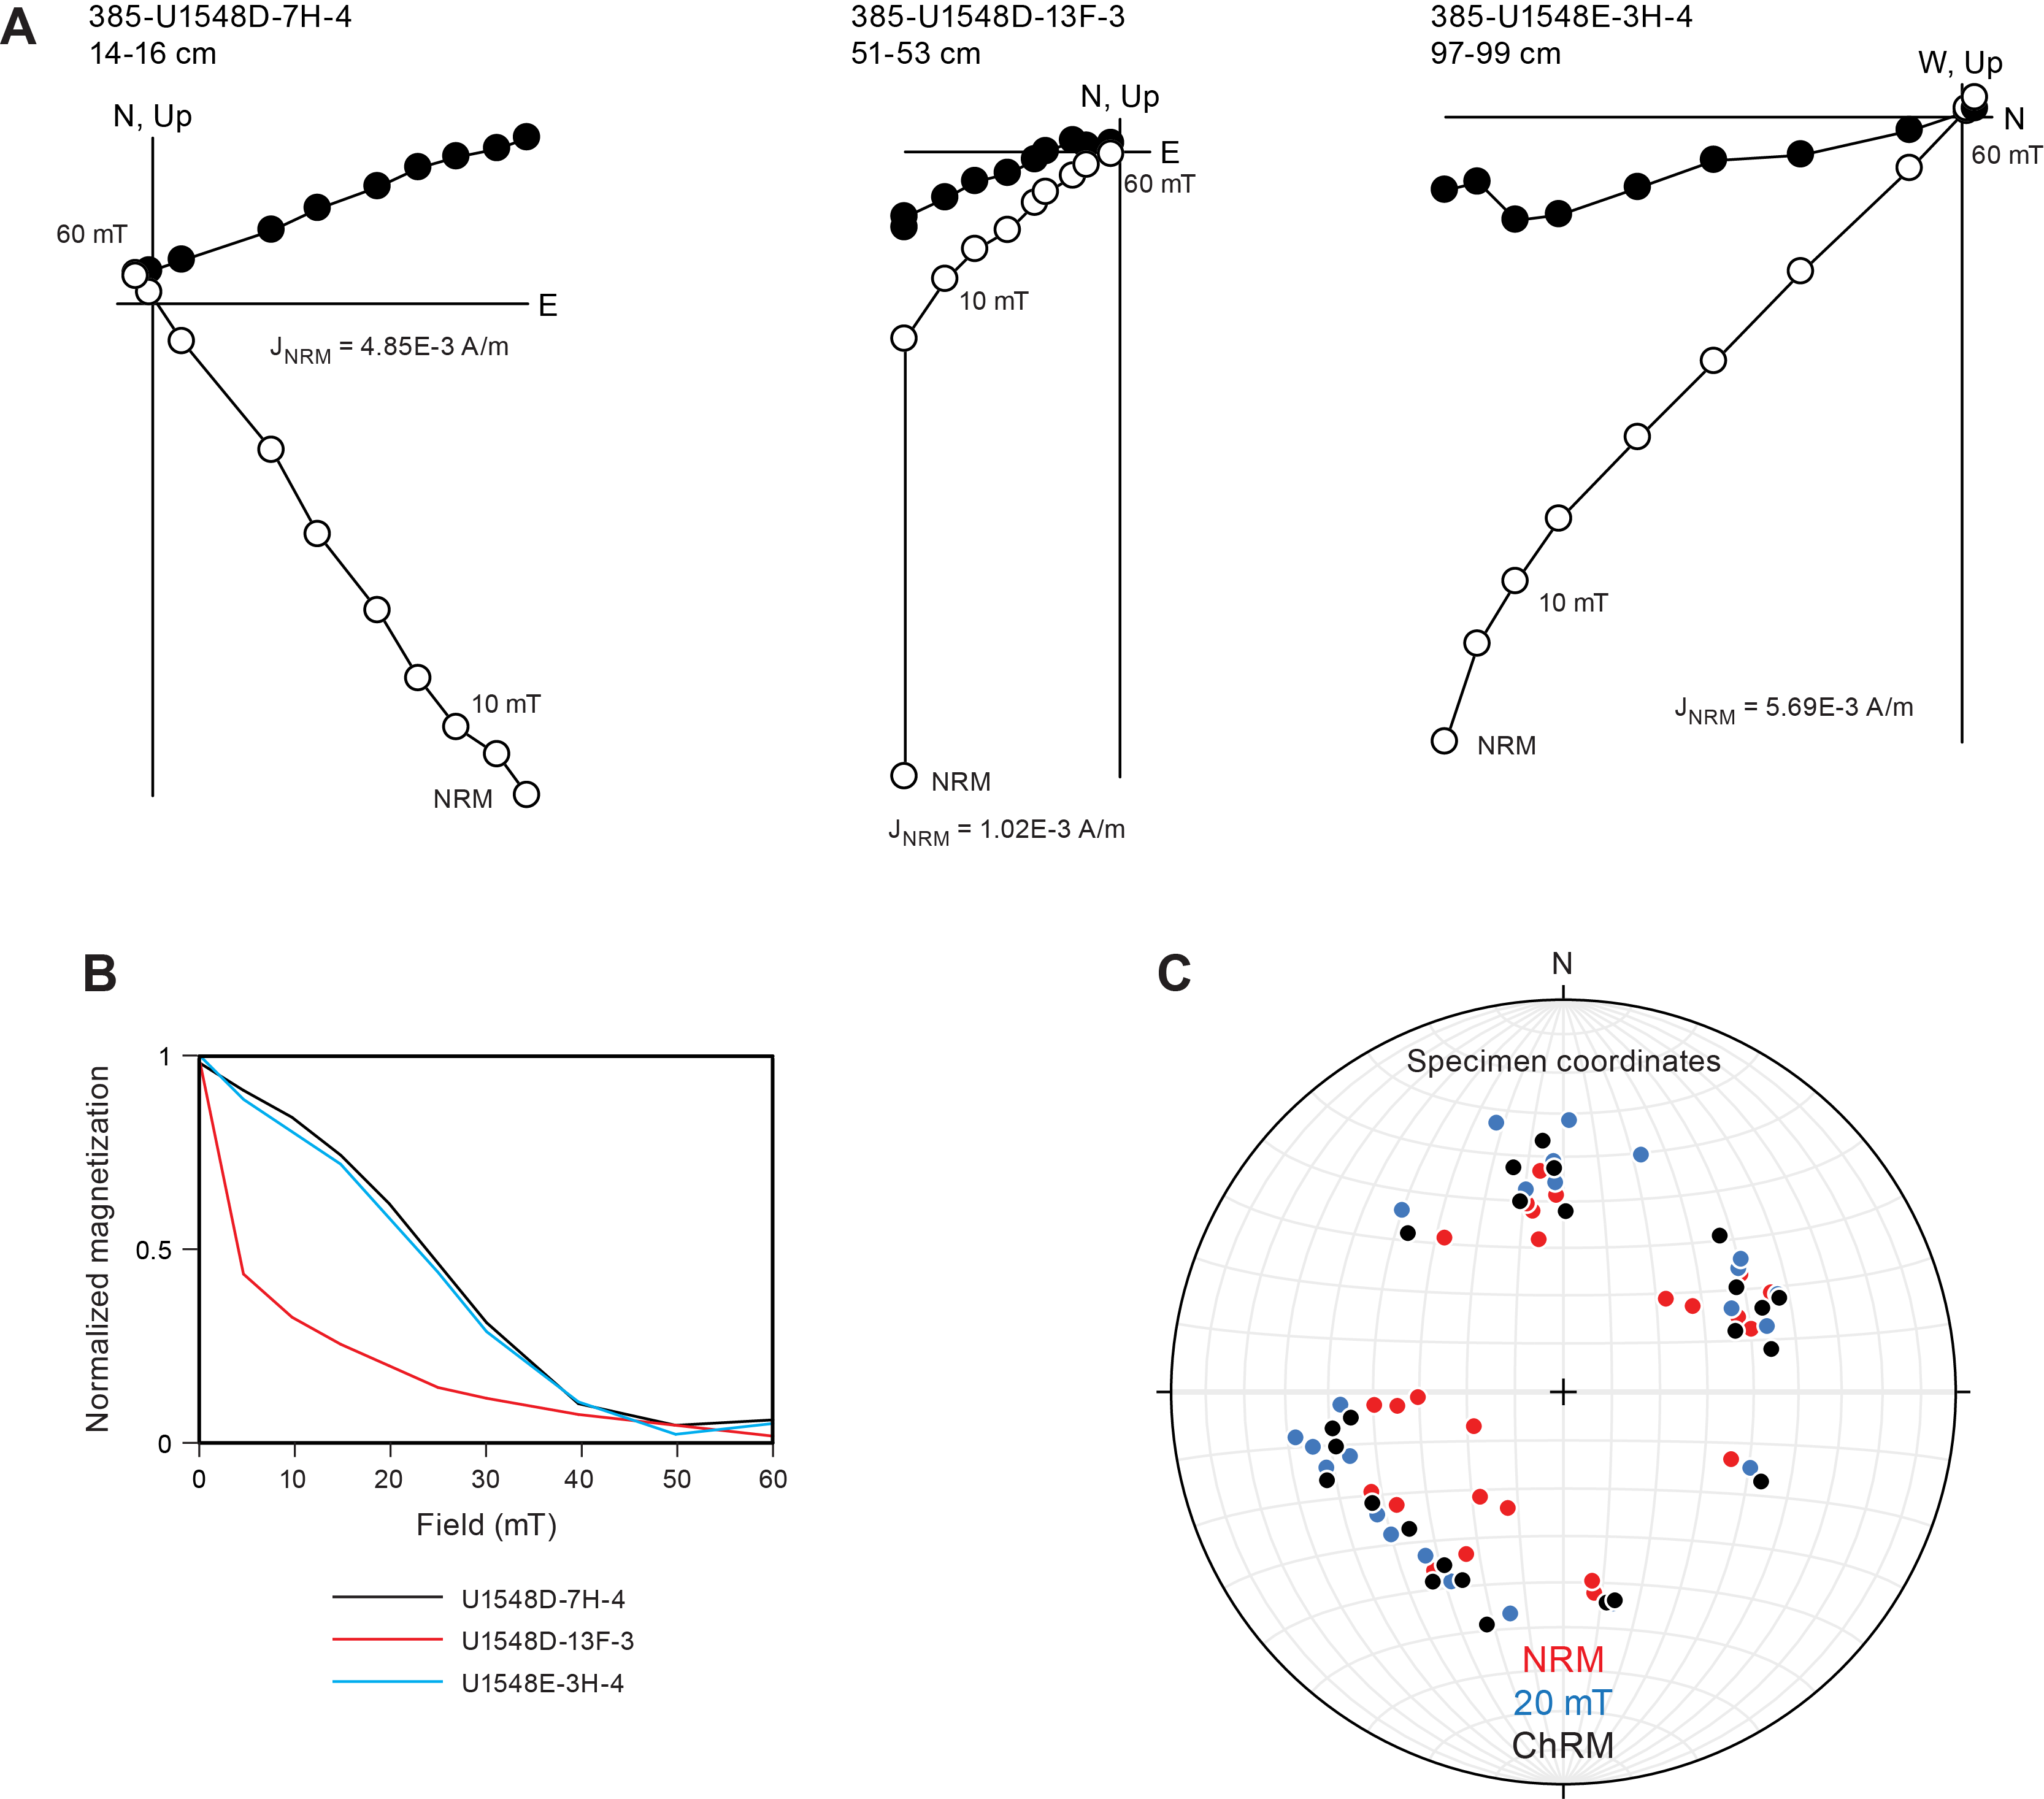
The distributions of the inclinations of the NRM before and after 20 mT AF demagnetization and the ChRM of all discrete samples are shown in Figure F38C. NRM inclinations range from 41.3° to 70.0° with a mean inclination of 51.9° (Table T15). After PCA, the inclinations of the ChRM were analyzed using the maximum likelihood method of Arason and Levi (2010) (Table T16). The resulting mean inclination for the ChRM results is 43.7°, which is slightly lower than the expected GAD inclination at this location (~46.2°).
8.3. Anisotropy of magnetic susceptibility
AMS was measured for all discrete samples from Sites U1547 and U1548 prior to demagnetization to characterize the magnetic fabrics present in the samples. Results for sediments from Holes U1547A, U1548A, and U1548C–U1548E were combined in the core reference frame (Figure F39). Because these results are unoriented, it is not possible to determine whether there is a preferred magnetic lineation in these rocks; therefore, only the inclination of the anisotropy is taken into account. Sedimentary samples taken in these holes show a mixture of oblate, prolate, and triaxial behavior throughout the sampled depths, with the exception of the lowermost 20 m, which show prolate behavior. The Kmax (maximum) principal axes are distributed in the horizontal plane, and the Kmin (minimum) principal axes are oriented perpendicular to the sedimentary bedding.

8.4. Magnetostratigraphy
We used the SRM measurements on archive-half sections from Holes U1547A, U1548A, and U1548C–U1548E to determine the polarity at the Ringvent sites. We based our interpretation of the magnetic polarity on the sign of inclination at the maximum AF demagnetization step (20 mT) (Figures F30, F32, F33, F34, F35). Data from APC and HLAPC cores were used for interpretation of polarity because XCB cores were too disturbed and overprinted to be considered reliable. APC and HLAPC cores show an average positive inclination of ~46° and ~45° for Sites U1547 and U1548, respectively. The detailed discrete sample analysis (Table T15) supports the results obtained from archive-half sections. Therefore, we assigned the cores to the normal Brunhes Chron (C1n; <0.78 Ma), which is in line with the biostratigraphic observations (see Biostratigraphy). No magnetic excursions during Chron C1n were identified, despite previously published paleomagnetic results from DSDP Leg 64 Site 480 that recorded the Mono Lake and Laschamp magnetic polarity excursions at ~29–26 ky before present (BP) and ~51–49 ky BP, respectively (Levi and Karlin, 1989).
9. Inorganic geochemistry
9.1. Interstitial water sampling
Samples were prepared in a nitrogen-filled glove box for Holes U1548C–U1548E; otherwise, they were prepared and squeezed under laboratory atmosphere. Sampling with Rhizons was also performed on the first three cores from Holes U1547A and U1548A. Mudline water was collected from Hole U1547A. Additionally, borehole fluids were sampled in Holes U1547A, U1547B, and U1548B. The chemical composition of the IW and mudline water is listed in Tables T17, T18 (Holes U1548A–U1548C), and T19 (Holes U1548D and U1548E). All profiles are shown in Figures F40, F41, and F42.
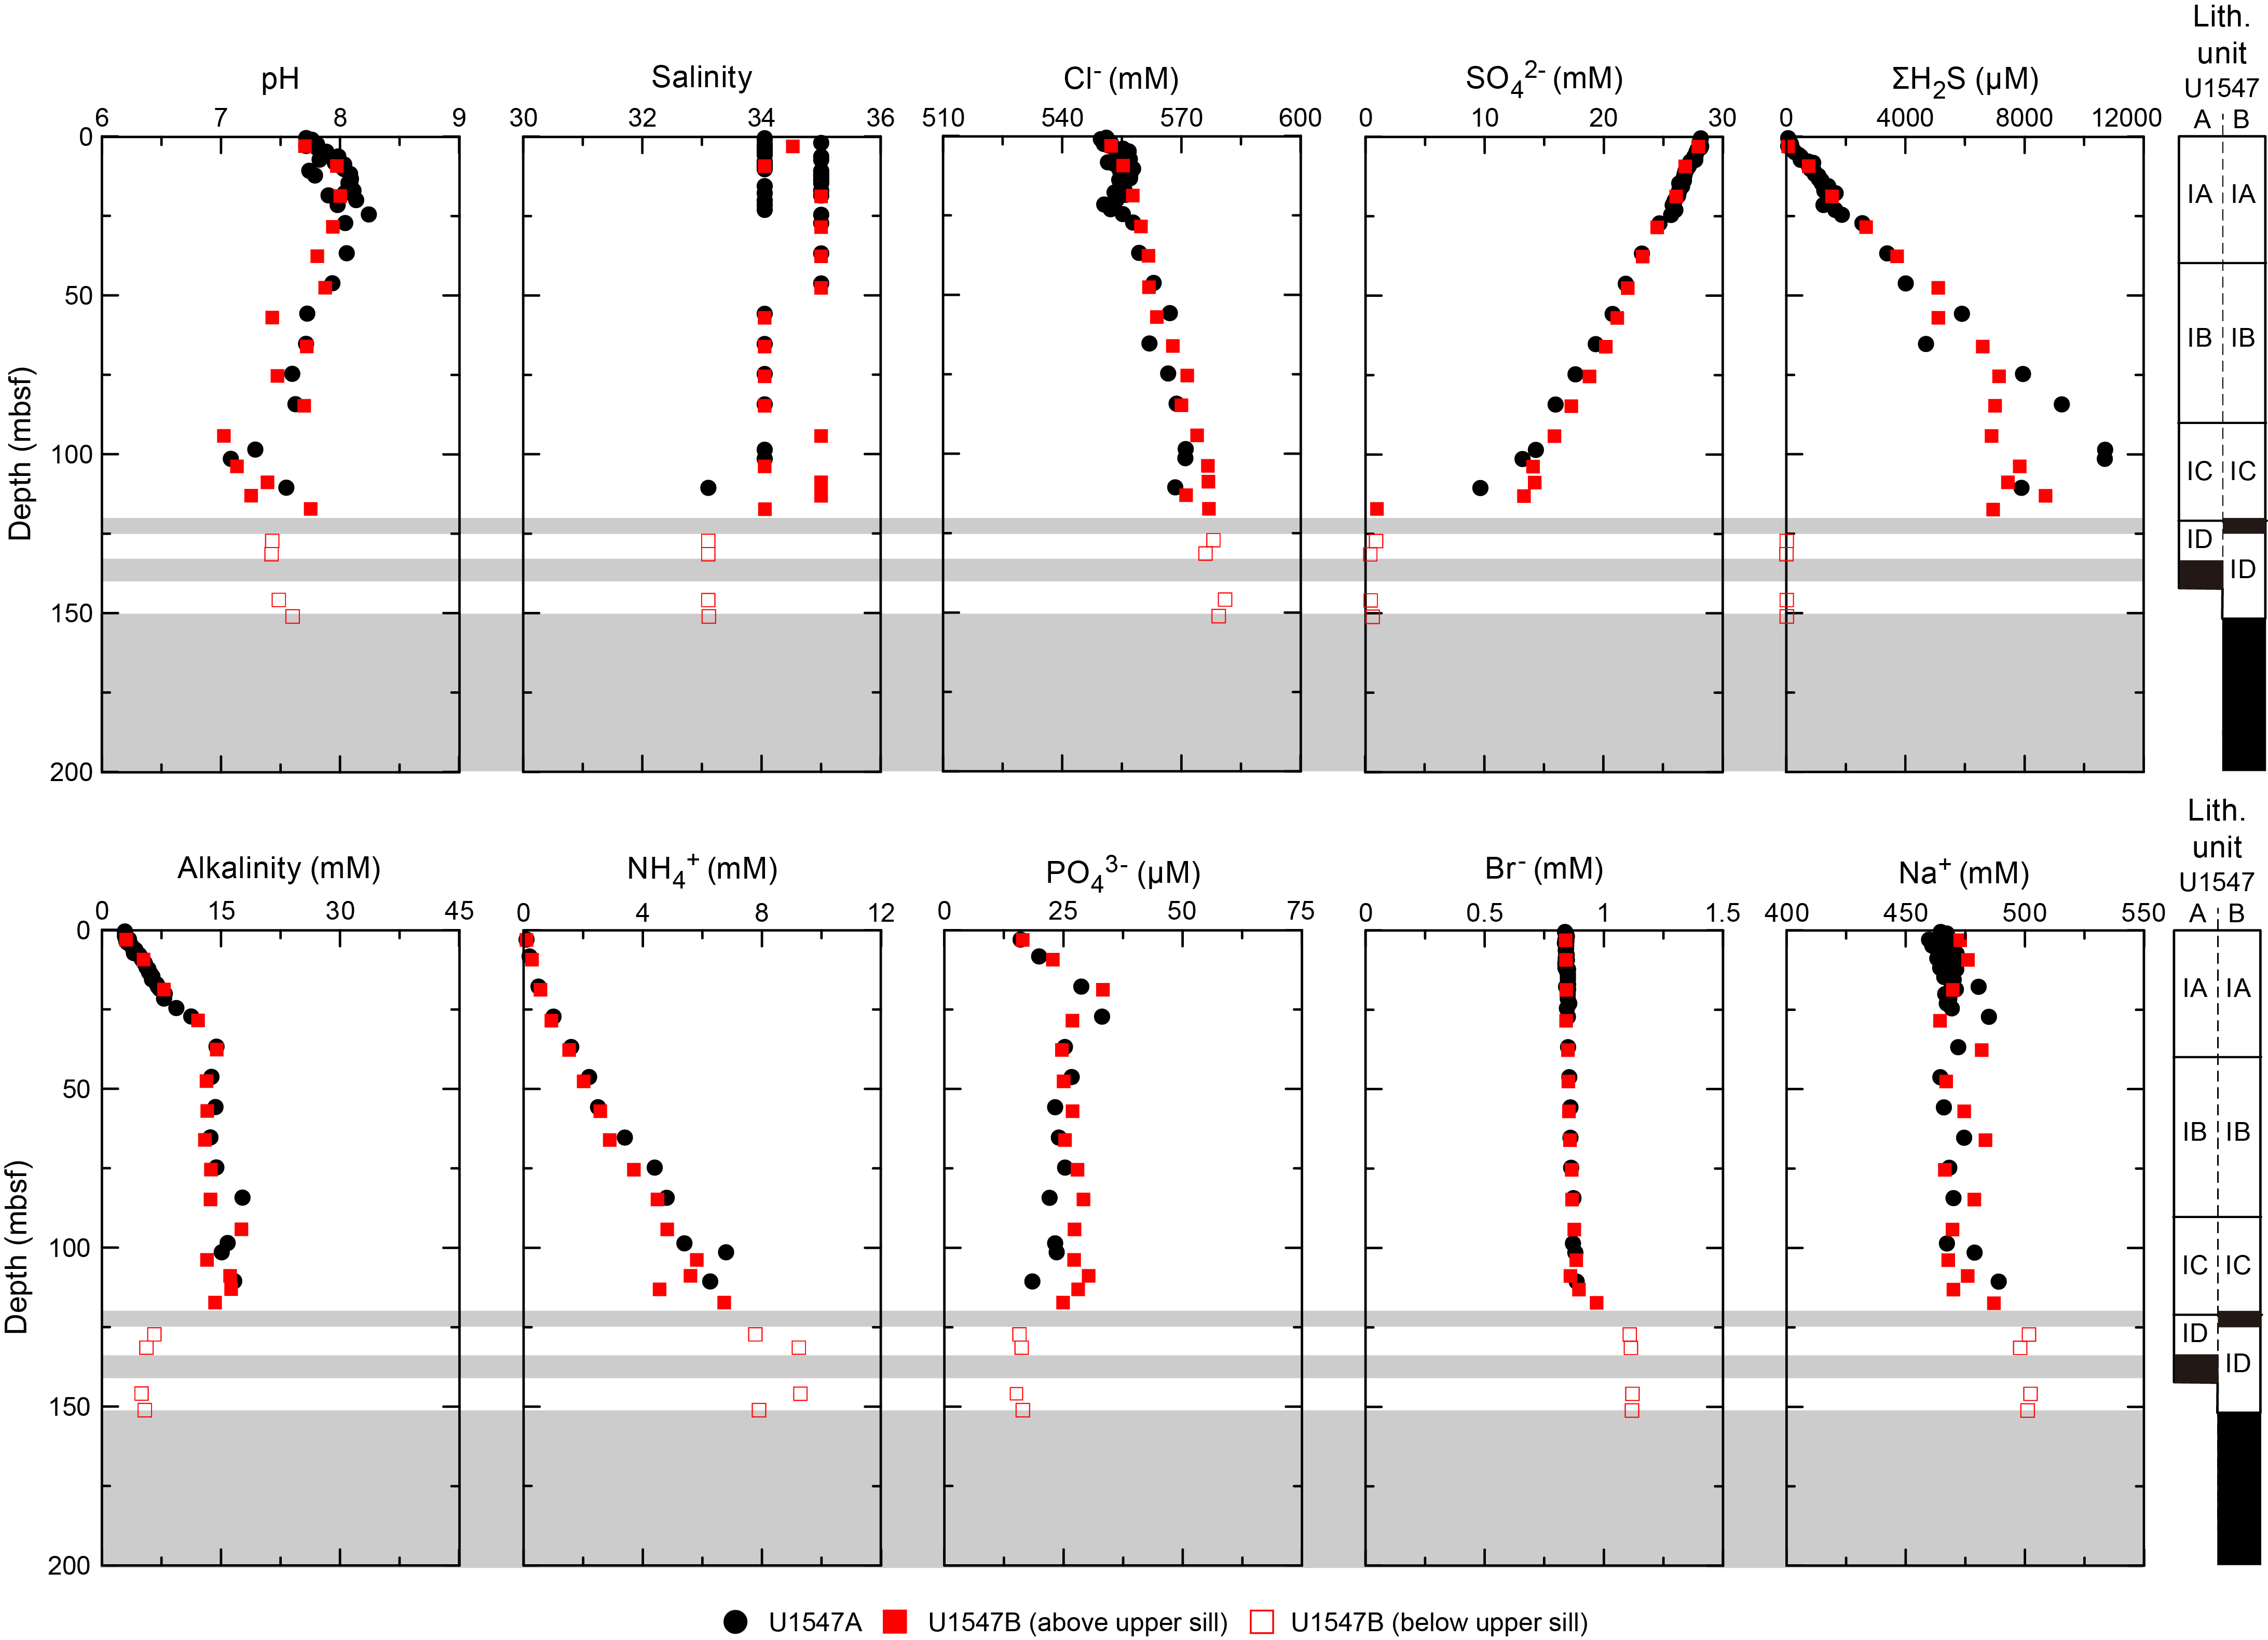
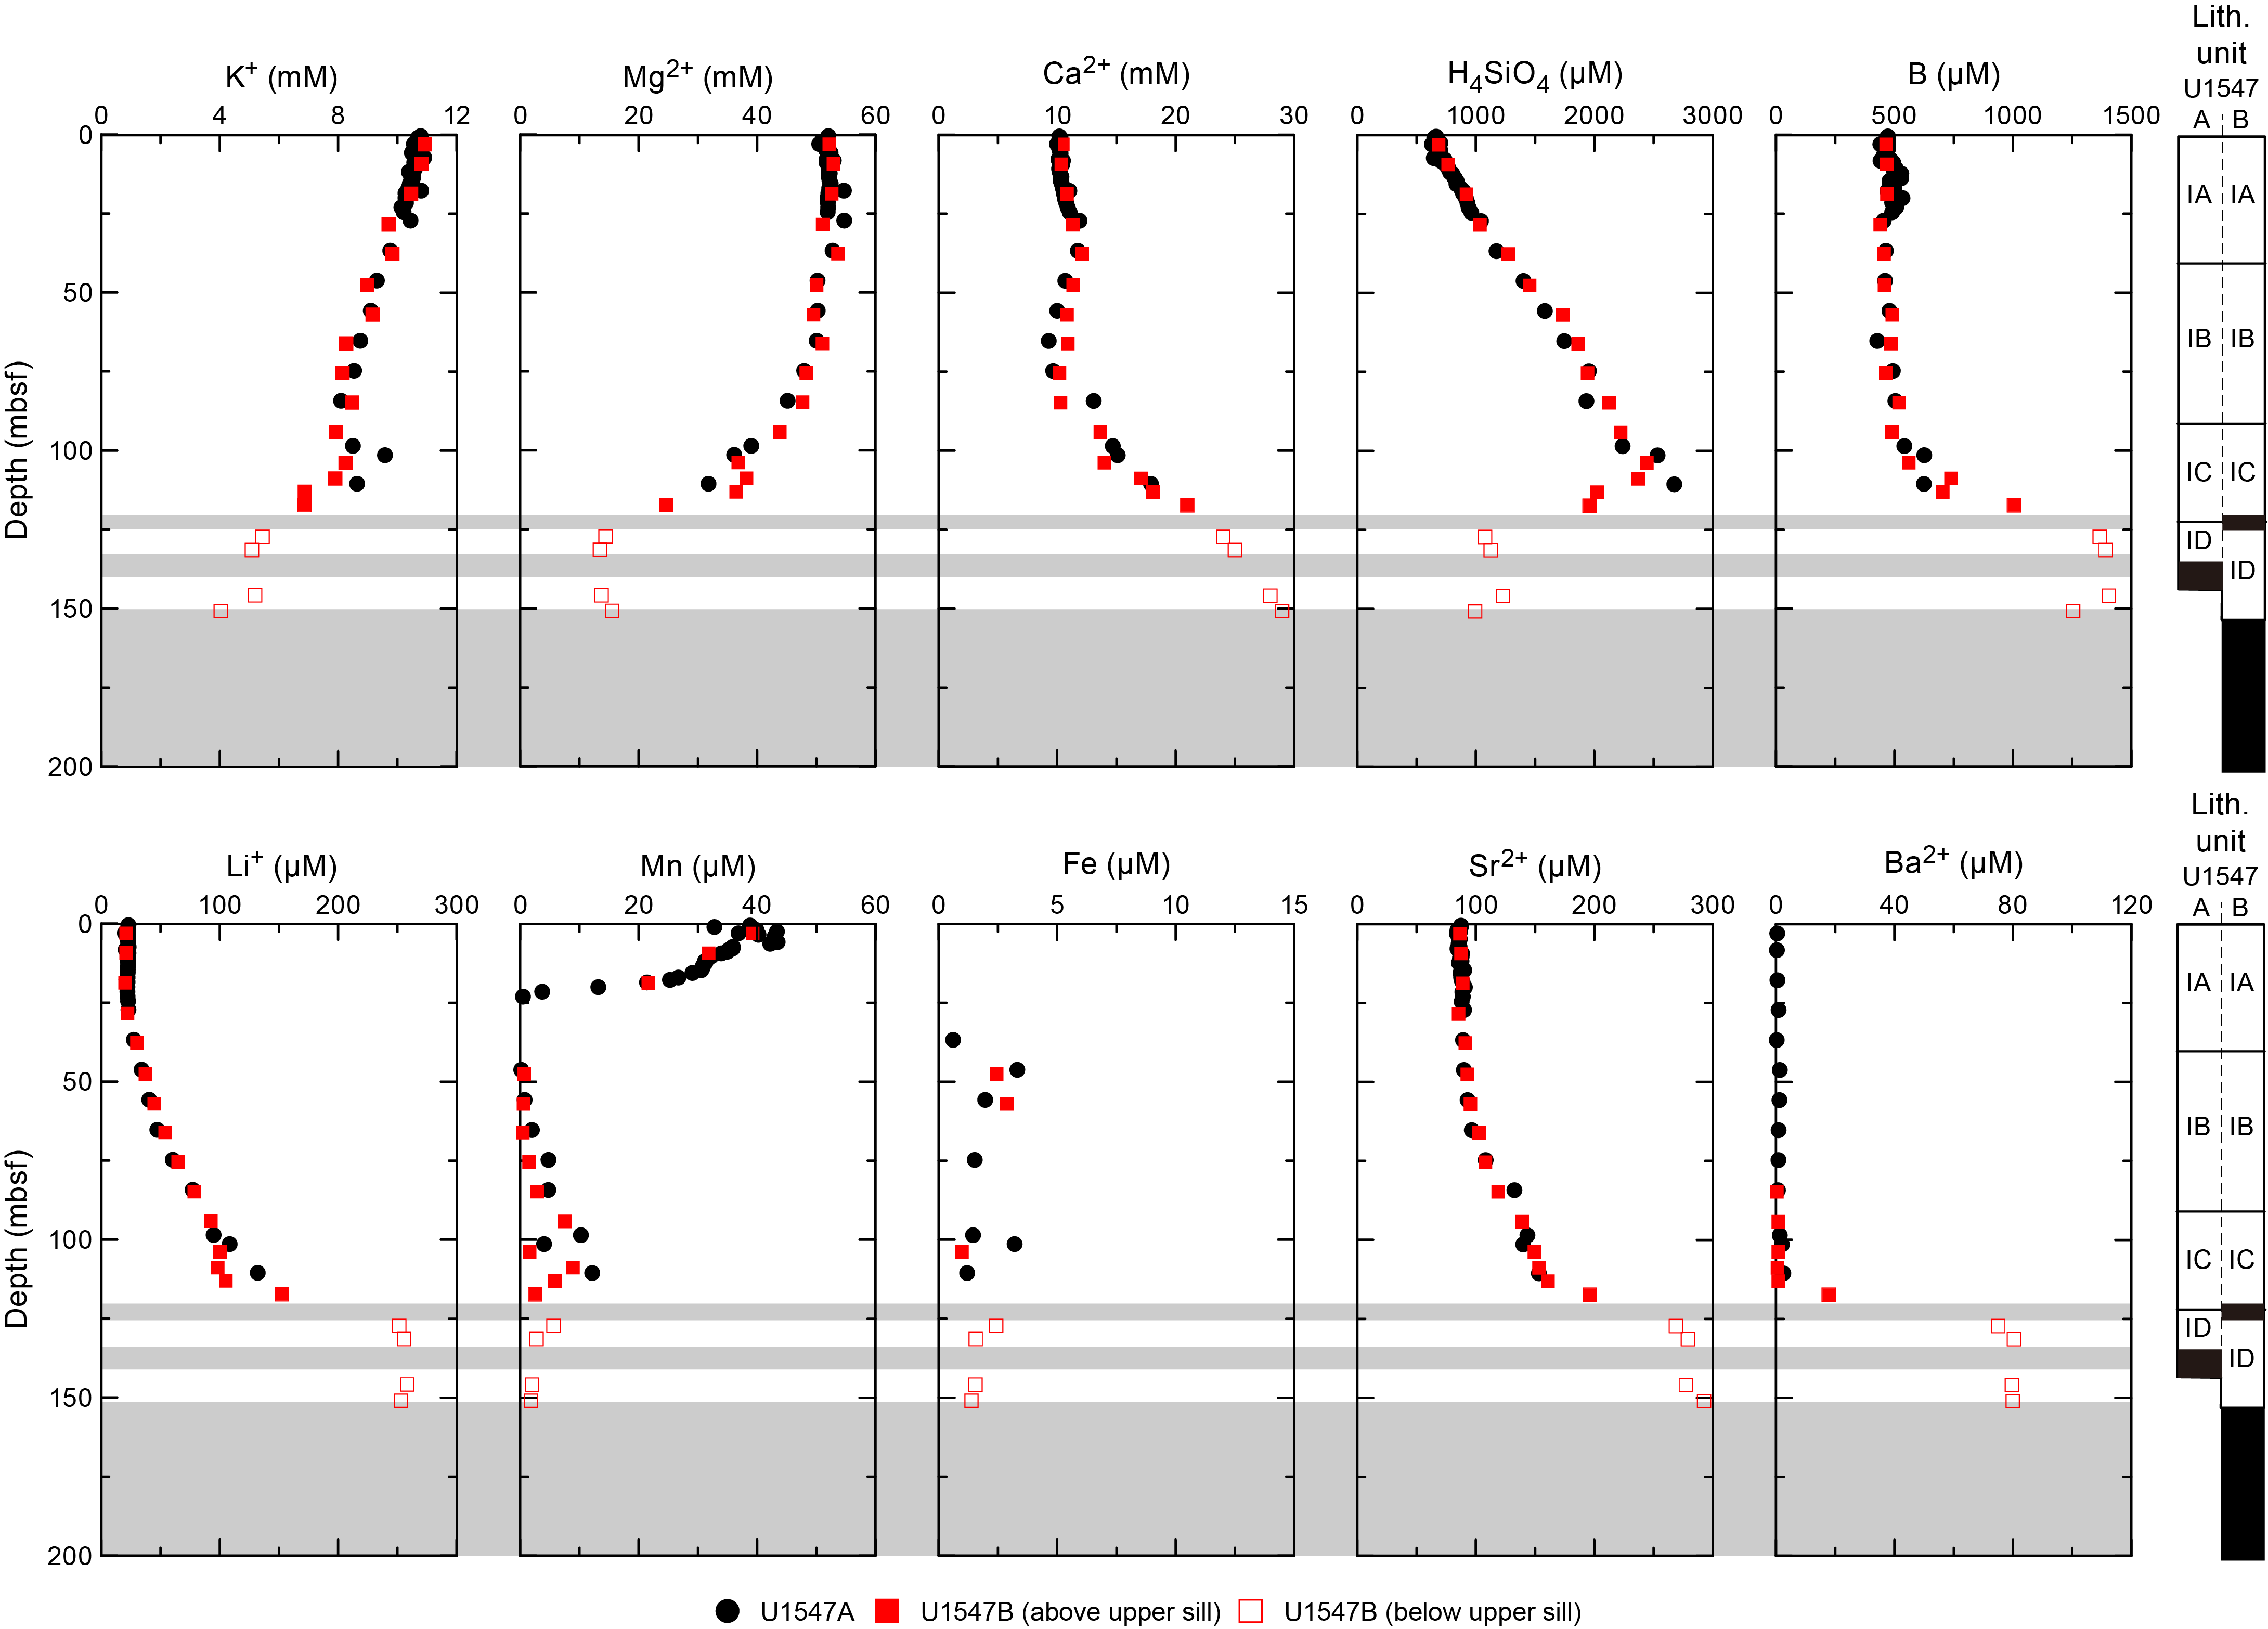
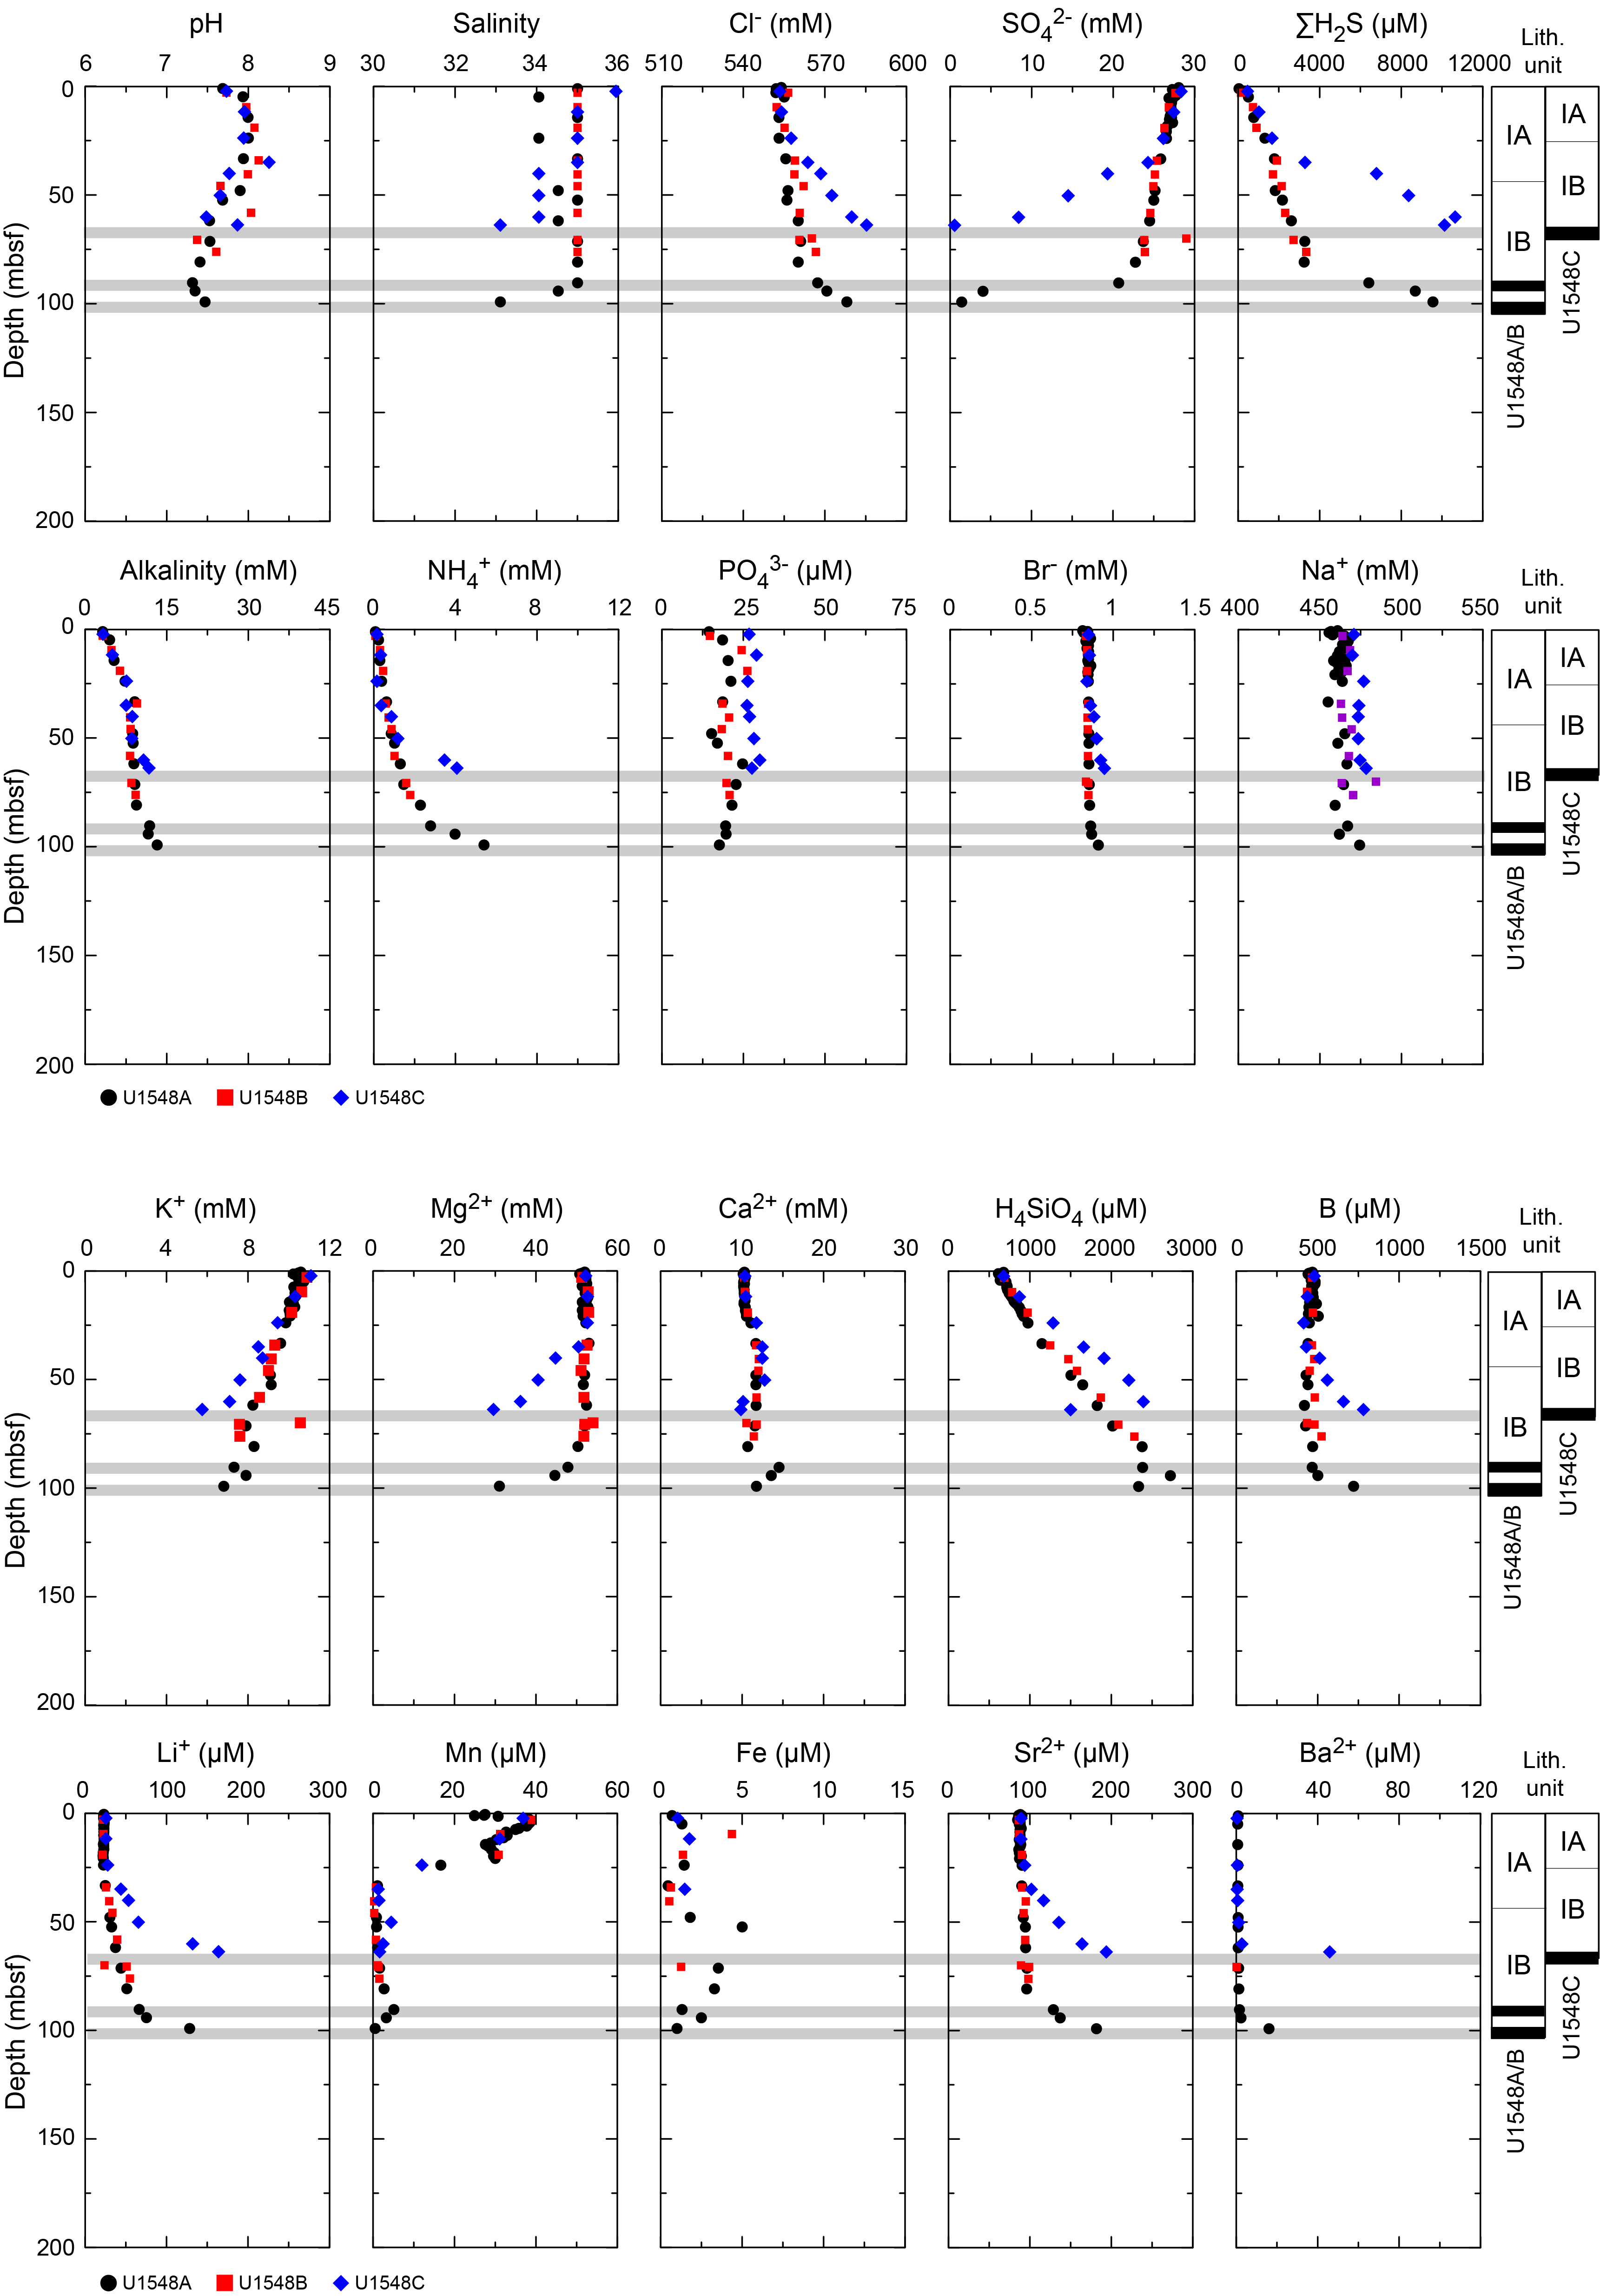
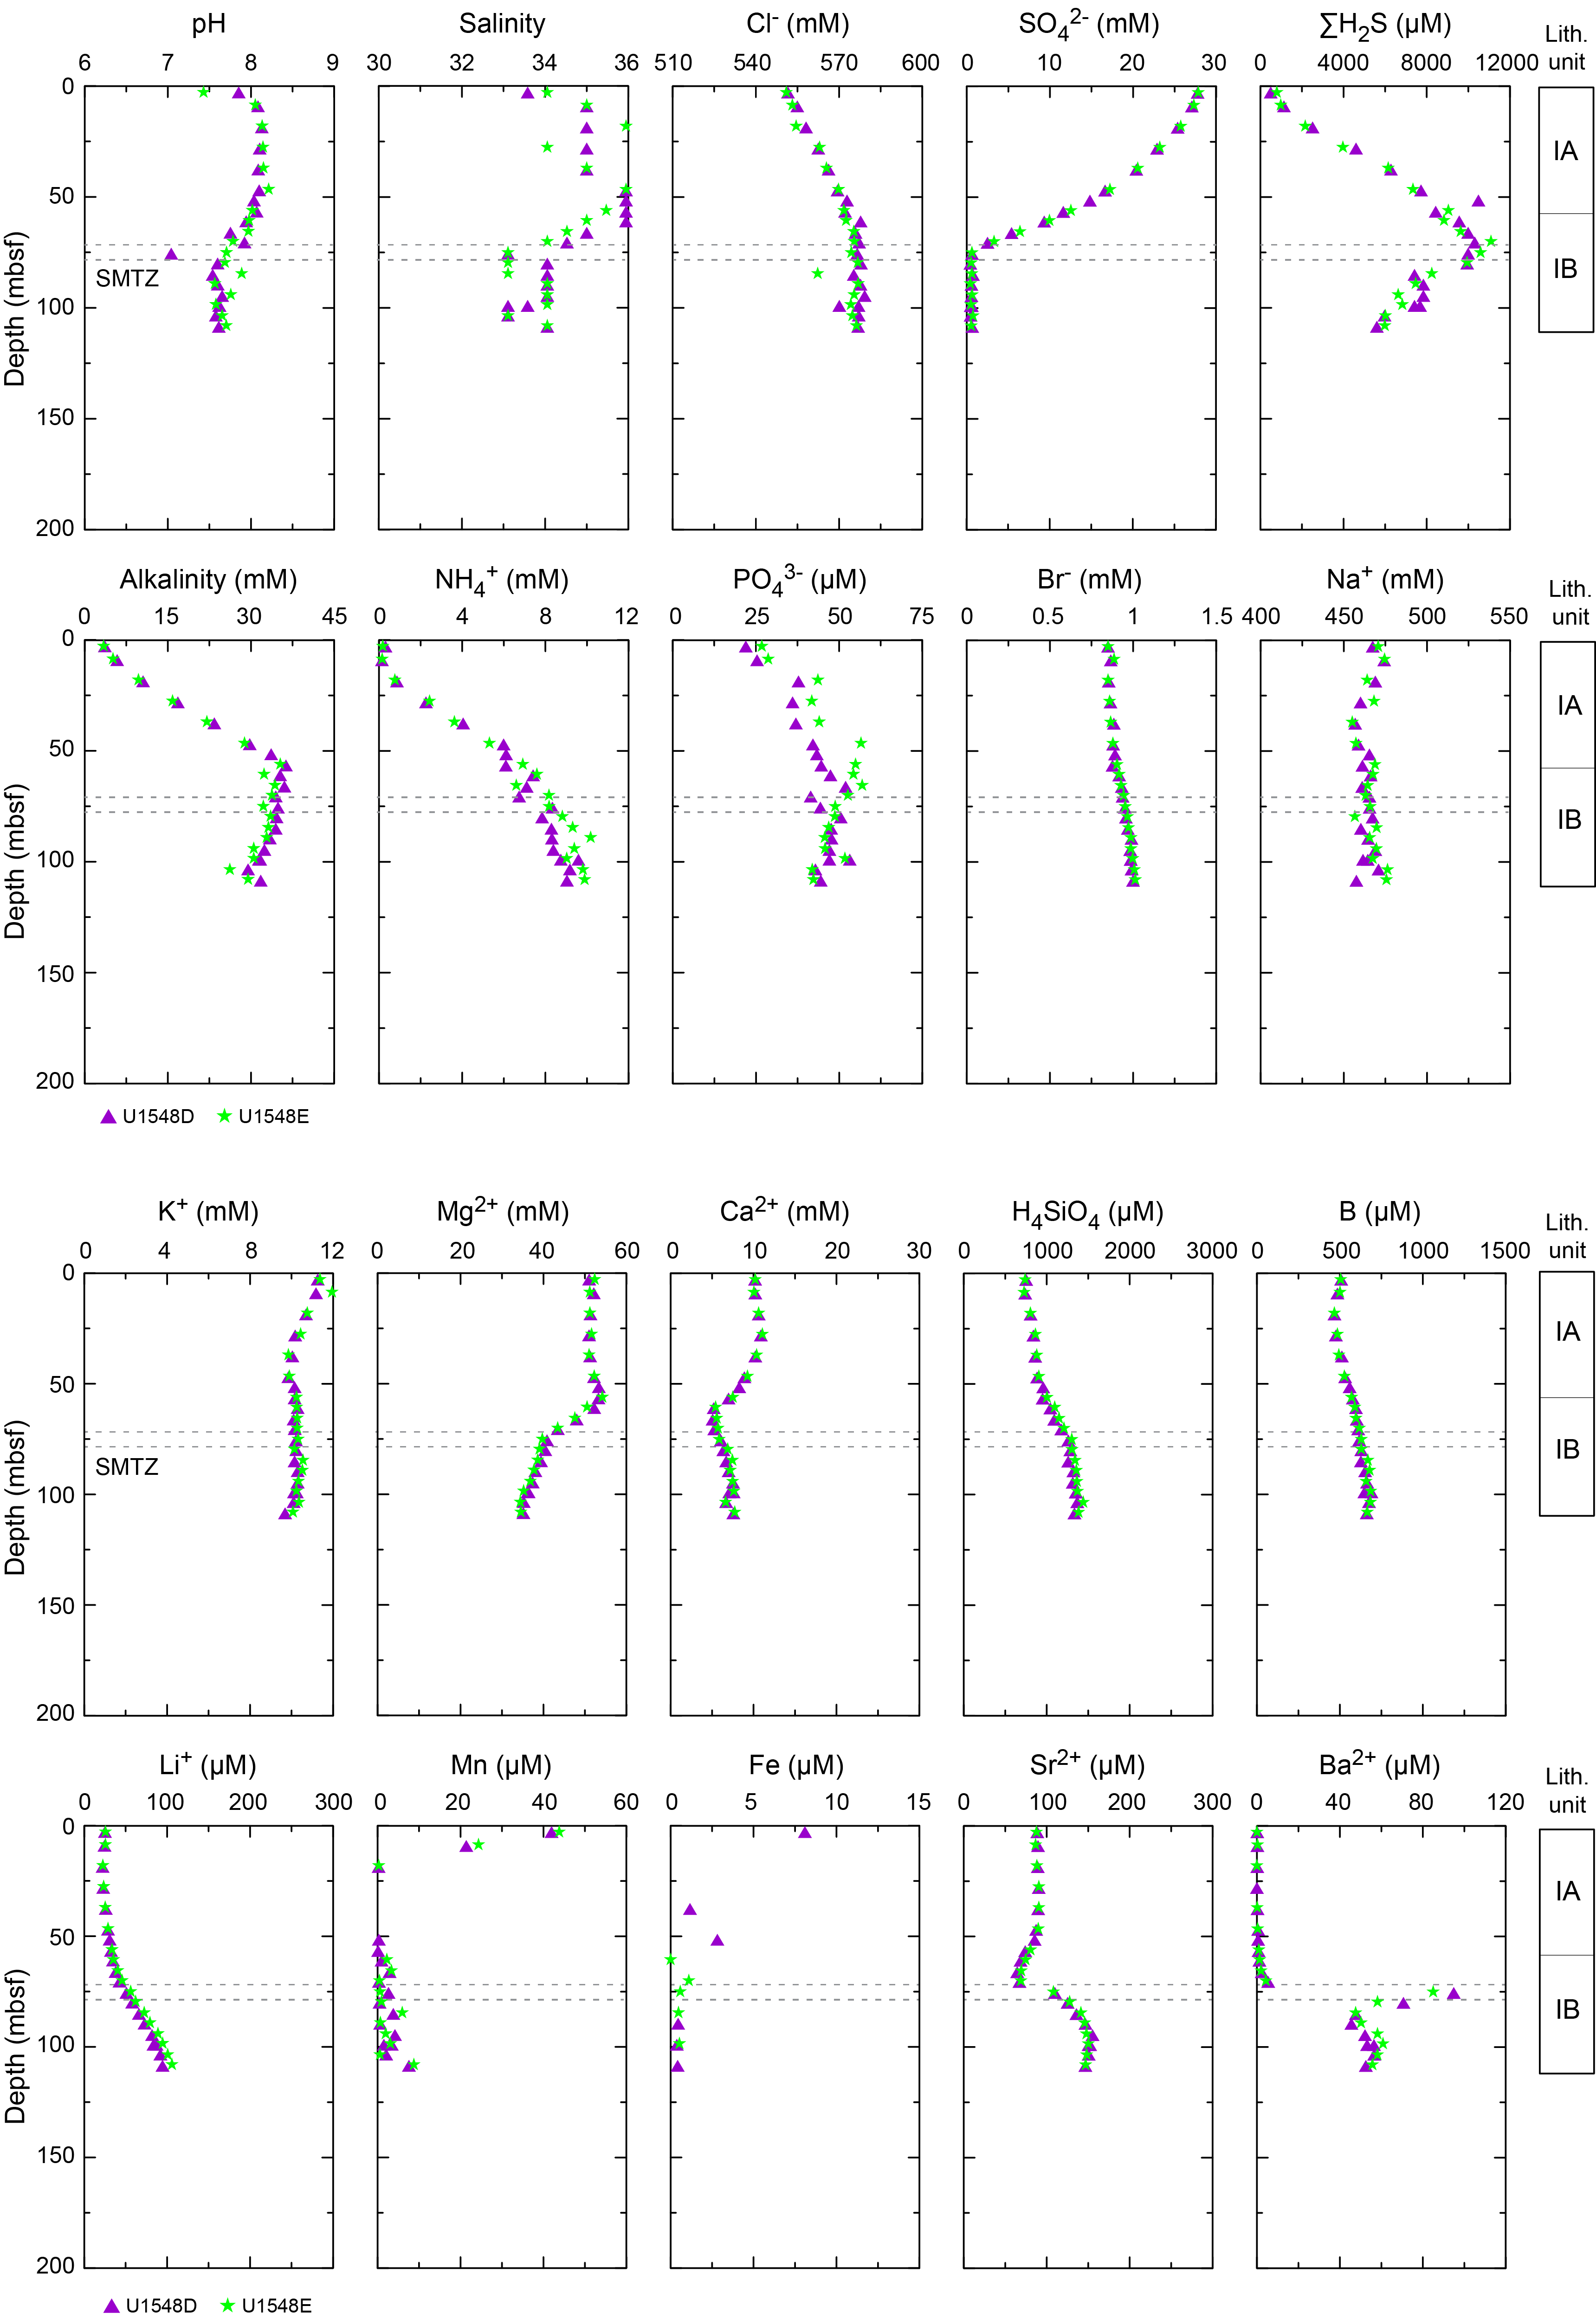
9.2. Interstitial water results from Ringvent
In all Ringvent holes, portions of sill were recovered at different depths (Figure F12; Table T5) (see Lithostratigraphy). A total of 4 m of sill was recovered in U1547A at 133 mbsf. A small, 6 m thick sill was encountered at 120 mbsf in Hole U1547B above a deeper, massive sill (cored thickness = 59 m) at 151 mbsf in the same hole. In Holes U1548A–U1548C, the top of the sill (a few meters) was recovered at 99, 89, and 65 mbsf, respectively. All sills recovered are shown as gray shaded areas in Figures F40 and F41.
9.2.1. pH, salinity, chloride, and sodium
pH values show a maximum of 8.2 at around 25–35 mbsf and gradually decrease to a range of 7.1–7.5 at the bottom of all holes at Site U1547 and Holes U1548A–U1548C. Salinity at both sites ranges between 33 and 36 with a slight decrease above the corresponding sill.
Chloride (Cl−) concentration generally increases with depth at both sites. It varies between 551 and 580 mM at Site U1547 and between 552 and 578 mM in Holes U1548A–U1548C.
Sodium (Na+) concentration shows scattered values between 450 and 480 mM from the seafloor to 100 mbsf at Site U1547 and then increases to 505 mM at the bottom of Hole U1547B (151 mbsf). In Holes U1548A–U1548C, it varies from 455 to 474 mM.
9.2.2. Sulfate, sulfide, alkalinity, ammonium, phosphate, and bromide
Sulfate (SO42−) concentration linearly decreases from seawater concentration (28 mM) at the seafloor to 13 mM at 113 mbsf (Site U1547) (Figure F40), to 20 mM at 90 mbsf (Holes U1548A and U1548B), and to 24 mM at 35 mbsf (Hole U1548C) (Figure F41). From there, sulfate concentration suddenly decreases to <1 mM above the sill/sediment contact both inside the Ringvent structure (Site U1547) and at its outer edge (Holes U1548A–U1548C). Below the upper sill at Hole U1547B, values remain <1 mM (Figure F40). Because the sulfate profiles decrease consistently toward the sill/sediment interface, it is likely that the presence of the sill itself, and not sulfate-consuming microbial methane oxidation, controls sulfate depletion; the disappearance of sulfate at the sill interface might not be biogenic. It follows that the depth of sulfate depletion (at around 120 mbsf at Site U1547, 100 mbsf in Hole U1548A, and 60 mbsf in Hole U1548C) is not an SMTZ in the proper sense and should not be interpreted as such. A sediment-hosted SMTZ is again visible in Holes U1548D and U1548E (see Interstitial water results for Holes U1548D and U1548E; Figure F42).
At Site U1547, sulfide concentration (ΣH2S = S2 + HS− + H2S) linearly increases downhole from the seafloor and reaches a maximum value around 11 mM at 100 mbsf. Below this depth in Hole U1547B, it decreases quickly and has a lower value (≤22 µM) at the sill/sediment interface and below the upper sill. At Site U1548, it shows a linear increase from the seafloor to 80 mbsf in Holes U1548A and U1548B, reaches a concentration of 3.2 mM, and then suddenly increases to 9.5 mM at the sedimentary bottom of Hole U1548A (99 mbsf) directly above the underlying sill. In Hole U1548C, the profile is similar but compressed within shallower depths, showing an increase in sulfide concentration from the seafloor to 25 mbsf, reaching 2 mM, and then increasing suddenly to 10.6 mM above the sill. Alkalinity steadily increases to 14 mM at Site U1547 and 9 mM in Holes U1548A–U1548C within the upper sediments (33–37 mbsf), with little change farther downhole until it increases again by several millimolar just above the sill in Holes U1548A and U1548C. In Hole U1547B, below the upper sill at 120–125 mbsf, alkalinity decreases quickly toward 5 mM.
Phosphate concentration (PO43−) increases from the seafloor to 30 mbsf to a maximum value of 33 µM at Site U1547 and then varies within a narrow range to 120 mbsf before decreasing again below the sill in Hole U1547B. In Holes U1548A–U1548C, phosphate concentration increases to a maximum value of 29 µM between the seafloor and 20 mbsf, and below this depth it varies within a narrow range around 20 µM.
Ammonium (NH4+) concentration continuously increases until the sill is encountered and has a maximum value of ~9 mM in Hole U1547B. In Holes U1548A–U1548C, the trend resembles the alkalinity profile, with a continuous increase to a few meters above the sill and a sharp increase just above the sill, and ammonium reaches values between 4.1 mM in Hole U1548C and 5.4 mM in Hole U1548A.
Bromide (Br−) concentration remains in a narrow range between 0.84 and 0.87 mM until the sill is reached in all holes at Site U1547 and in Holes U1548A–U1548C. Below the upper sill in Hole U1547B, it sharply increases to 1.1 mM.
9.2.3. Calcium, magnesium, potassium, and silica
At Site U1547, dissolved calcium (Ca2+) concentration shows little variation (10–12 mM) from the seafloor to 80 mbsf and then, in Hole U1547B, sharply increases to 18 mM at 127 mbsf and remains constant (~18 mM) farther downhole (Figure F40). Ca2+ concentration in Holes U1548A–U1548C varies within a narrow range from 10 to 12 mM, with the exception of two IW samples between 90 and 94 mbsf in Hole U1548B (13–14 mM) (Figure F41).
At Site U1547, dissolved magnesium (Mg2+) concentration shows a decreasing trend with depth, which is reversed compared to Ca2+, with little variation (50–53 mM) from the seafloor to 80 mbsf and then a decrease toward 14 and 31 mM at 127 and 99 mbsf in Holes U1547B and U1548A, respectively. Below this depth, concentrations remain constant for Hole U1547B. The same trend is observed in Holes U1548A and U1548C, with little variation in the upper part and a sharp decrease at around 40 and 90 mbsf.
Dissolved potassium (K+) concentration linearly decreases from the seafloor to a few meters above the sill intersection (from 11 to 8 mM) in all Site U1547 holes and in Holes U1548A–U1548C and then sharply decreases just above the corresponding sill intrusion to values around 4 mM at the bottom of Hole U1547B.
Dissolved silica (expressed in solution as H4SiO4) linearly increases to a maximum value of around 2600 µM from the seafloor to a few meters above the sill at all Site U1547 holes and in Holes U1548A–U1548C (Figures F40, F41). This increase likely reflects the dissolution of biogenic opal, such as diatom tests and other siliceous microfossils, as temperature increases (Kastner and Gieskes, 1976). Alternatively, hydrothermal fluid-rock interaction may impact the concentration of dissolved silica, too. Its value decreases when approaching the corresponding sill body in Holes U1547B, U1548A, and U1548C. The drop in dissolved silica content corresponds to the gradual transition from opal-A to opal-CT observed in the lower part of Lithostratigraphic Subunit IC, with the boundary to Subunit ID, placed at ~120 (Hole U1547A) and ~130 mbsf (Hole U1547B), marking the beginning of siliceous claystone (see Lithostratigraphy).
9.2.4. Manganese and iron
Manganese (Mn = Mn2+ + Mn4+) is the only measured element that does not exhibit a linear trend in the upper sediment column. Instead, it shows a well-defined peak between 0 and 33 mbsf and reaches a maximum value of 43 µM at 5.8 mbsf in all Site U1547 holes (Figure F40) and in Holes U1548A–U1548C (Figure F41). This result highlights the reduction of manganese oxides during oxidation of organic matter by metal-reducing bacteria in the upper part of the sediment column. Mn concentrations start increasing again below 40 mbsf and reach a peak right above the sill in all holes except Hole U1548B. The concentration of iron (Fe = Fe2+ + Fe3+) shows more disparate values throughout the Site U1547 holes and in Holes U1548A–U1548C; it ranges from below detection limit to 4 µM.
9.2.5. Boron, lithium, strontium, barium
Boron (B; dissolved as borate, B[OH]4−) remains constant around 460 µM in the upper part of all holes at Site U1547 and in Holes U1548A–U1548C and then increases sharply just above the sill to a maximum value of 1400 µM at 146 mbsf at the bottom of Hole U1547B.
From the seafloor to 25 mbsf in all holes at Site U1547 and in Holes U1548A–U1548C, lithium (Li+) and strontium (Sr2+) have nearly constant values around 21 and 90 µM, respectively, that correspond to those of mudline water (Li+ = 20 µM; Sr2+ = 85 µM) obtained from Hole U1547A. Li+ and Sr2+ concentrations slightly increase with depth below 25 mbsf to a few meters above the sill and sharply increase right above the sill to values around 258 and 292 µM, respectively, at Site U1547 (Figure F40), and 128–164 and 182–194 µM, respectively, in Holes U1548A–U1548C (Figure F41).
Barium (Ba2+) concentration is low (<1 µM) from the seafloor to right above the associated sill and then sharply increases to 16 µM in Hole U1548A, 46 µM in Hole U1548C, and 80 µM in Hole U1547B. The depth at which Ba2+ concentration starts to increase at Site U1547 and in Holes U1548A–U1548C is consistent with the intervals where SO42− concentration sharply decreases. In all of these holes, significant offsets of B, Li2+, Sr2+, and Ba2+ concentrations are observed near the corresponding sill contact.
9.3. Borehole fluid sampling
Borehole fluids were collected from four different depths at Sites U1547 and U1548 (Tables T17, T18). Most elements have a value similar to mudline water from Hole U1547A.
9.4. Interstitial water results for Holes U1548D and U1548E
Holes U1548D and U1548E are located around 800–1000 m northwest of Holes U1548A–U1548C. No sill was recovered in these holes. All IW profiles are shown in Figure F42.
9.4.1. pH, salinity, chloride, and sodium
pH values increase in the upper 20 m to 8.1, remain constant to 50 mbsf, decrease to around 7.6 at 80 mbsf, and then remain constant to the bottom of Holes U1548D and U1548E. Salinity increases in the upper 50 m from 34 to 36 and then decreases to 33–34 at 75 mbsf. Chloride (Cl−) concentration generally increases with depth in both holes. It varies from 550 to 577 mM from the seafloor to 70 mbsf and then remains constant downhole. Sodium (Na+) concentration varies between 455 and 476 mM downhole with no significant trend.
9.4.2. Sulfate, sulfide, alkalinity, ammonium, phosphate, and bromide
Sulfate concentration decreases from the seafloor to 76 mbsf in Holes U1548D and U1548E and then remains <1 mM. This decrease in sulfate exhibits a curved profile.
Sulfide concentration (ΣH2S = S2 + HS− + H2S) increases from the seafloor to a maximum value of 10–11 mM at around 76 mbsf in Holes U1548D and U1548E and then decreases downhole to values <6 mM. Thus, the SMTZ is estimated to be at around 76 mbsf in both holes (Figure F42).
Alkalinity increases from the seafloor to 57 mbsf to 36 mM in Holes U1548D and U1548E. Below this depth, alkalinity decreases to values <30 mM.
Phosphate (PO43−) increases between the seafloor and 65 mbsf to values >50 µM and decreases below this depth in Holes U1548D and U1548E. Ammonium (NH4+) concentration continuously increases to the bottom of both holes to a maximum value of ~9 mM, with a slight excursion at around 89 mbsf to 10.2 mM. Bromide (Br−) concentration steadily increases with depth and reaches its maximum value (1.01 mM) at the bottom of Hole U1548E.
9.4.3. Calcium, magnesium, potassium, and silica
Calcium (Ca2+) remains constant in the upper 20 m around 10.2 mM, exhibits a minimum excursion to 5 mM at around 61–66 mbsf, and increases again to values >7 mM at the bottom of Holes U1548D and U1548E. Magnesium (Mg2+) concentration is virtually invariable (50–53 mM) from the seafloor to 61 mbsf in both holes. Below this depth, a decrease to 40 mM occurs in the SMTZ, and a second decrease below the SMTZ reaches 35 mM at the bottom of both holes. Potassium (K+) decreases from 12 to 10 mM from the seafloor to around 50 mbsf and then remains constant. Dissolved silica (expressed in solution as H4SiO4+) increases from the seafloor to the bottom of Holes U1548D and U1548E to values around 1400 µM.
9.4.4. Manganese and iron
Manganese (Mn = Mn2+ + Mn4+) shows a peak between 0 and 20 mbsf and reaches a maximum value of 42–44 µM at around 3 mbsf in both holes. Below this depth, Mn remains <10 µM with no particular trend. The concentration of iron (Fe = Fe2+ + Fe3+) shows more disparate values throughout Holes U1548D and U1548E, ranging from below detection limit to 8 µM.
9.4.5. Boron, lithium, strontium, and barium
Boron (B; dissolved as borate; B[OH]4−) remains constant around 500 µM in the upper 50 m and then increases below this depth to values >680 µM (Figure F42).
From the seafloor to 30 mbsf in Holes U1548D and U1548E, lithium (Li+) and strontium (Sr2+) vary within a narrow range around 21 and 90 µM, respectively. These values correspond to those of mudline water (Li+ = 20 µM; Sr2+ = 85 µM) from Hole U1547A. Below 30 mbsf, Li+ increases to values >100 µM at the bottom of Hole U1548E and Sr2+ decreases toward the SMTZ and increases again below it.
Barium (Ba2+) concentration is low (<1 µM) from the seafloor to the SMTZ and then increases to values around 60 µM with excursions just below the SMTZ to values as high as 94 µM in Hole U1548D.
9.5. Concluding remarks
9.5.1. Ringvent holes
Above the sills, IW profiles show similar trends in all holes from Site U1547 (Figure F40) and in Holes U1548A–U1548C (Figure F41), with slight differences mainly in sulfate, alkalinity, phosphate, and sulfide concentrations. Abrupt changes are observed for many elements in the contact interval with the sill; sulfate sharply decreases over only a few meters, coincident with increases in lithium, barium, boron, strontium, calcium, and sodium and decreases in magnesium, potassium, and dissolved silica. Similar excursions were observed at Sites U1545 and U1546 above the sills (see Figure F27 in the Site U1545 chapter and Figure F33 in the Site U1546 chapter [Teske et al., 2121b, 2021c]). The chemical properties of IW are likely to be influenced by combined biogeochemical processes (hydrocarbon formation and their oxidation, particularly methane) and sediment-fluid interaction associated with the sill intrusion as well as precipitation/dissolution processes, including Opal-A dissolution, authigenic carbonate precipitation, and dolomite formation.
9.5.2. Holes U1548D and U1548E
The IW profiles in Holes U1548D and U1548E are quite different from those of the Ringvent holes because they are located ~800 m northwest of the edge of Ringvent. The SMTZ is well defined at around 76 mbsf with a concave downward decrease in sulfate and a concomitant increase in alkalinity, sulfide, ammonium, and phosphate (Figure F42). In general, values of these organic matter mineralization products are higher in Holes U1548D and U1548E than in the other studied Ringvent holes. The lower concentrations of dissolved silica in Holes U1548D and U1548E near Ringvent compared to the holes located at Ringvent could reflect the lower thermal gradient measured in this area (271°C/km versus 686°–1187°C/km) (see Petrophysics) and thus the lower diagenetic overprint of diatoms at depth.
10. Organic geochemistry
At Sites U1547 and U1548, organic geochemists performed sampling and analysis of gas and solid-phase samples. For all holes, one headspace gas sample was analyzed per 9.5 m core for routine hydrocarbon safety monitoring. Void spaces were measured on the core receiving platform, and void gases were characterized for their hydrocarbon content. The carbon, nitrogen, and sulfur contents of particulate sediment were characterized, and source rock analysis was performed on solid-phase samples. When sampling was focused on microbiology and biogeochemistry objectives, H2 and CO content were measured and gas and solid-phase materials were sampled for shore-based analyses. During igneous rock recovery, whole-round core pieces of rock were incubated in sealed trilaminated foil barrier bags to examine degassing of hydrocarbons.
10.1. Solid-phase carbon, nitrogen, and sulfur contents
Solid-phase sediment samples were analyzed to determine the weight percent of CaCO3, total organic carbon (TOC), total nitrogen (TN), and total sulfur (TS). In Holes U1547A and U1548A, the core description team selected samples from major and minor sedimentary components and some high-resolution sampling occurred in proximity to sill/sediment contacts (Tables T20, T21). In Holes U1547B, U1548B, U1548D, and U1548E, material was subsampled from the community gas (COMGAS) whole-round core (see Organic geochemistry in the Expedition 385 methods chapter [Teske et al., 2021a]) and taken once per 9.5 m advance for correlation to other biogeochemical data to be generated during shore-based analyses. In Holes U1547C, U1547D, and U1547E, igneous rock material was sampled for characterization of CaCO3 and TS contents. Due to offshore analytical problems, sulfur detection was not correct in samples below 61 mbsf in Hole U1548E. Therefore, elemental analyses of samples from Hole U1548E were repeated onshore (see Organic geochemistry in the Expedition 385 methods chapter [Teske et al., 2021a]) (Table T21). The data from all holes at Site U1547, Holes U1548A–U1548C, and Holes U1548D and U1548E are discussed as single profiles below.
At Site U1547, CaCO3 content varies around 5 wt% in the primary lithology of diatom ooze (Figure F43). Subordinate carbonate nodules, micrite-rich layers, and indurated layers have much higher CaCO3 content ranging from ~23 to ~86 wt%. Carbonate was detected in most sill samples, and the CaCO3 content within the sill averages 2.6 wt%. The maximum carbonate content of 12.0 wt% was obtained in Sample 385-U1547C-8R-2 (Piece 2, 13.5–17 cm). A maximum TOC value of 4.1 wt% was observed in the uppermost sample. In the upper 15 m, TOC values decrease to 2.3 wt%. In deeper sediments, they average 1.7 wt% with small variations due to lithology changes and sill proximity. Trace amounts of organic carbon were detected in several sill samples. In these samples, the average TOC value is 0.02 wt%. The maximum TOC value of 0.06 wt% was obtained in Sample 385-U1547E-20R-1 (Piece 6, 28.5–35 cm). Although every effort was made shipboard to reduce contamination, these values should be interpreted with caution, and careful shore-based analyses will be needed to verify them. The average atomic TOC/TN value is 9.4 with only minor fluctuations in the studied interval. These values are indicative of algal photosynthetic biomass as the primary source of organic matter (Meyers, 1994). The TOC/TN values of 22.2 and 13.2 in Samples 385-U1547E-3R-1, 14–15 cm, and 385-U1547A-5H-5, 77–78 cm, are indicative of variable terrestrial organic matter input. No trend in atomic TOC/TN values in relation to sill proximity was observed. In the upper ~110 m, sulfur content increases downhole from 1.2 to 2.5 wt% and then decreases to 0.6 wt% from ~110 to 152 mbsf. Sulfur and TOC contents in the sediments are not correlated but generally show excess sulfur (average TOC/TS value = 1.6) compared to the normal marine trend (Goldhaber and Kaplan, 1974; Berner, 1982).
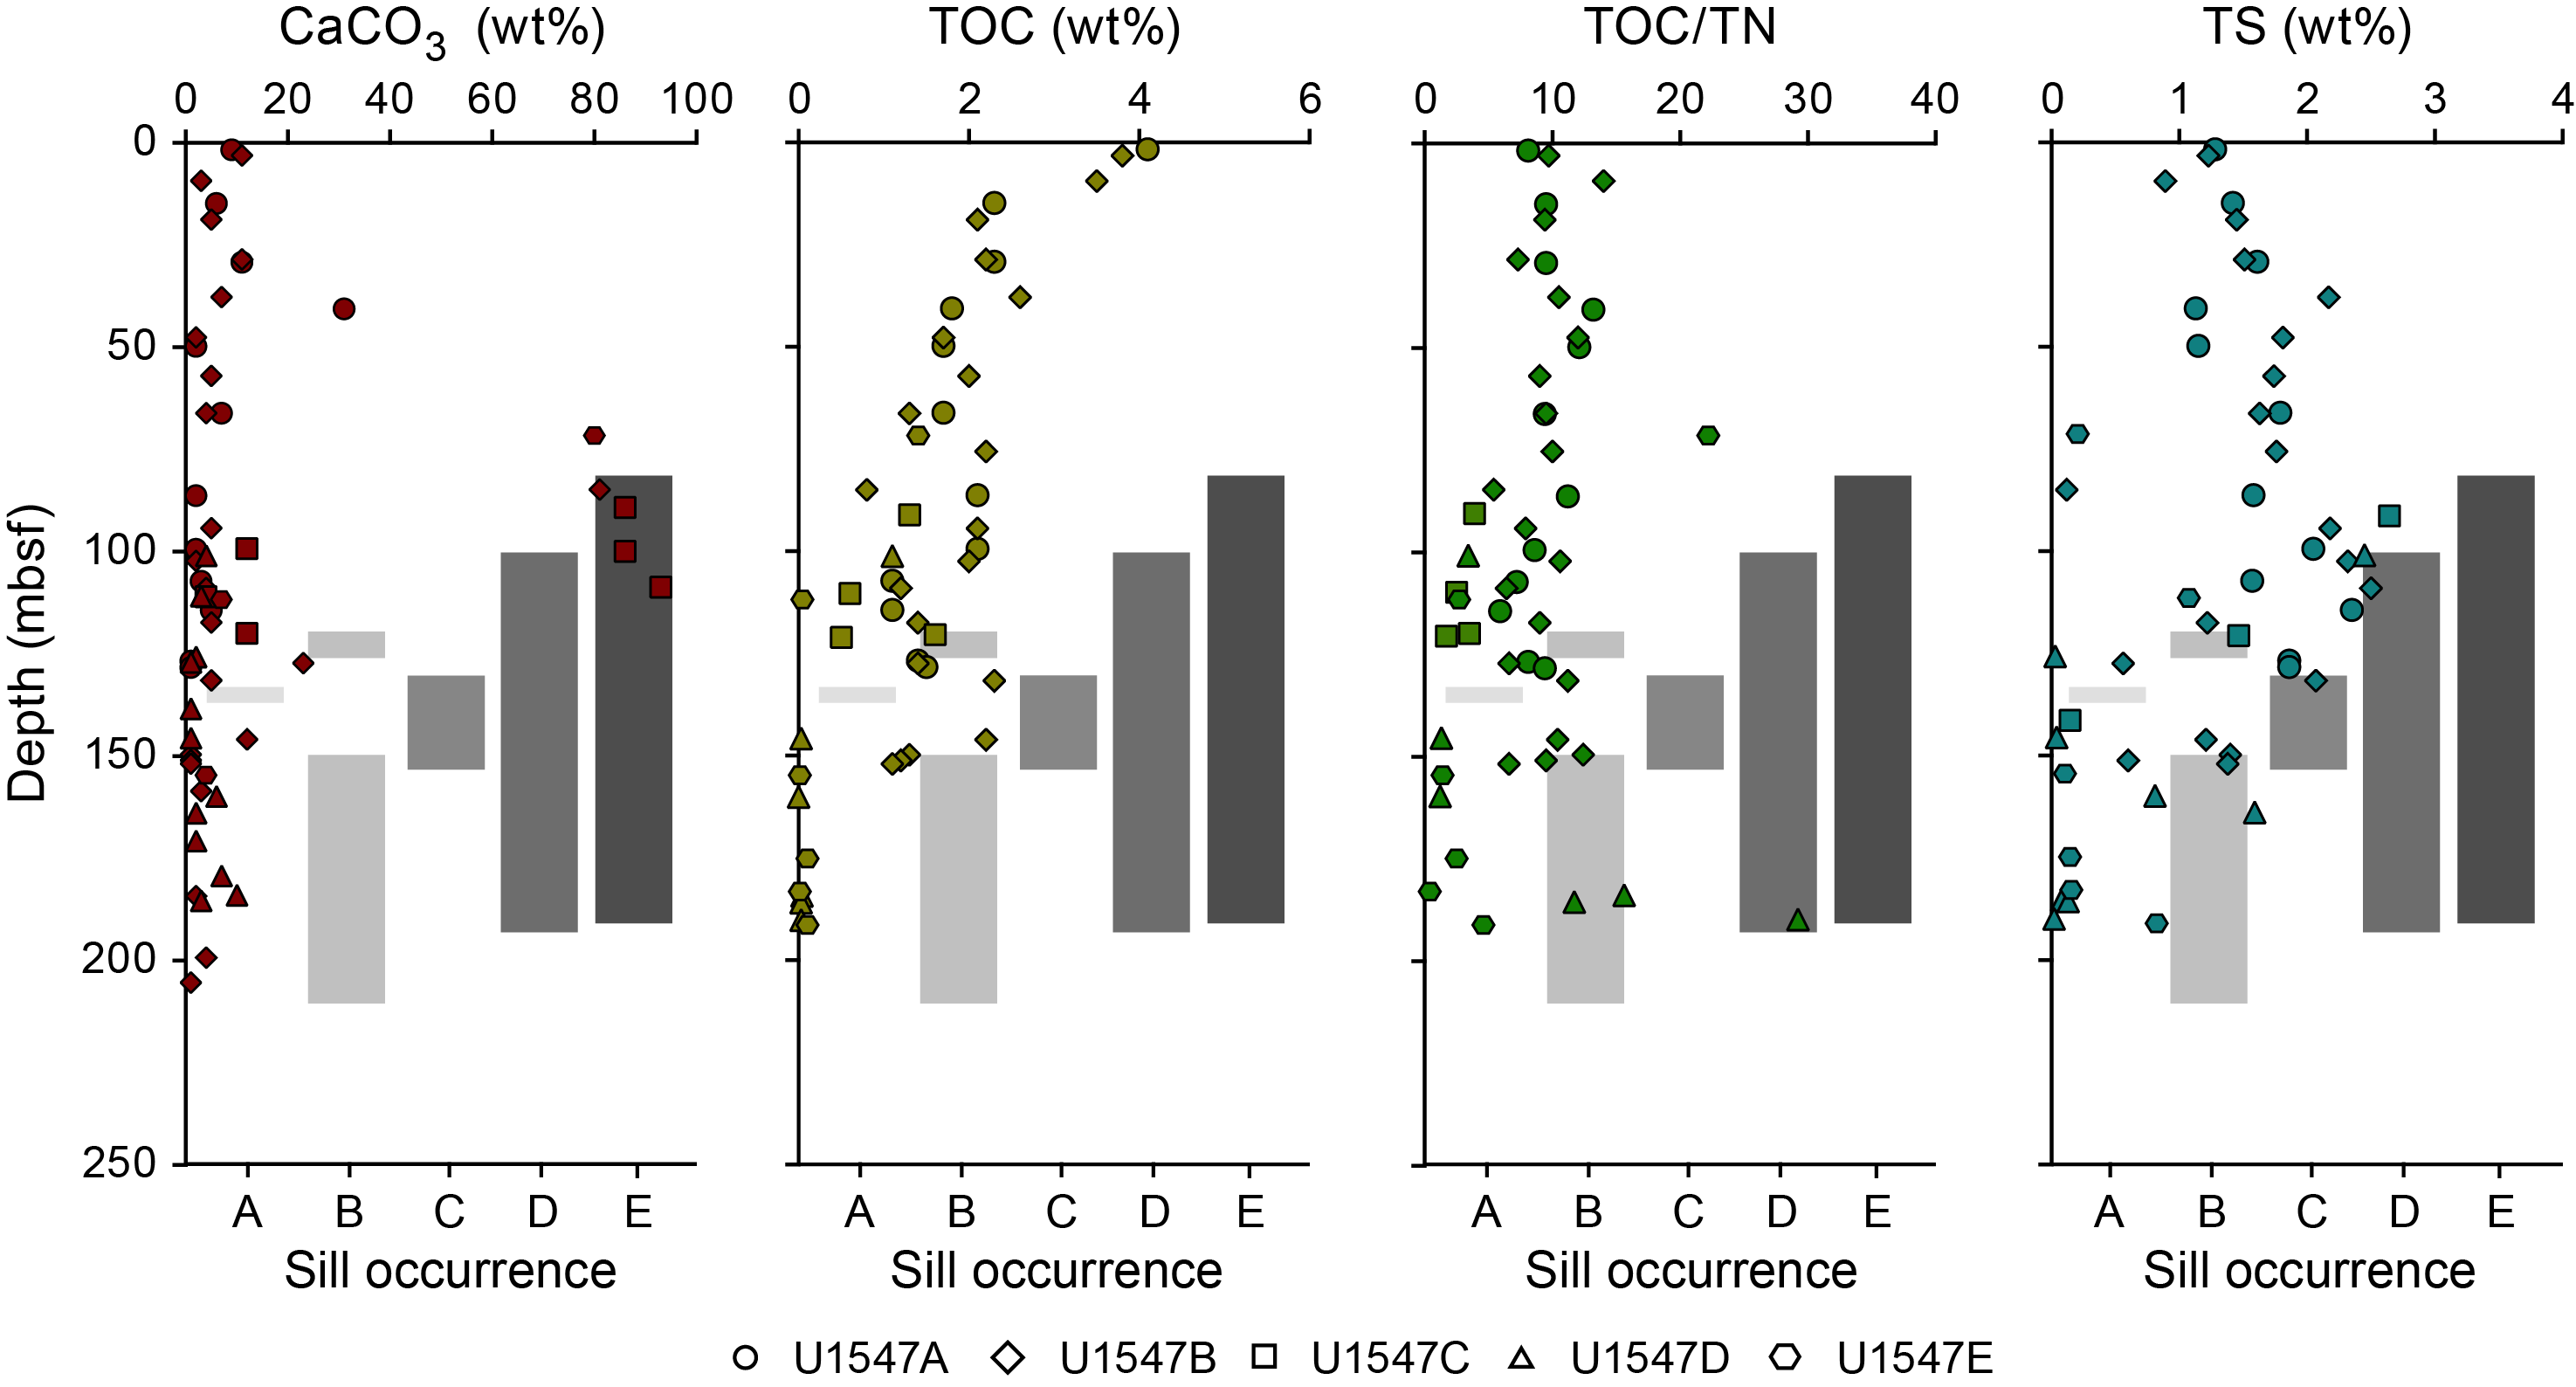
In Holes U1548A–U1548C, trends are similar to those observed at Site U1547 (Figure F44). From 0 to 97 mbsf, CaCO3 content varies between ~1 and ~14 wt% (average = ~6 wt%) with a slight decreasing trend. One micrite-rich sample was analyzed (385-U1548A-6H-6, 8–9 cm) and has a value of 66 wt% CaCO3. TOC values gradually decrease in the uppermost 30 m from ~4.0 to ~2.0 wt%. Below 30 mbsf, values vary slightly around ~2.0 wt% to the bottom of the studied interval. Values of TOC/TN average 10.6 with only minor variations throughout. Exceptions to this are the micrite-rich sample mentioned above (385-U1548A-6H-6, 8–9 cm), which has a TOC/TN value of 31.2, and Sample 385-U1548C-7H-7, 58–59 cm, which has a TOC/TN value of 63.3. TS values generally increase from ~1.0 to ~2.1 over the entire interval. In general, TS content in Hole U1548C is slightly higher than in Holes U1548A and U1548B. Similar to Site U1547, TOC and TS contents are not positively correlated and show excess sulfur (average TOC/TS value = 1.7) compared to the normal marine trend (Goldhaber and Kaplan, 1974; Berner, 1982).
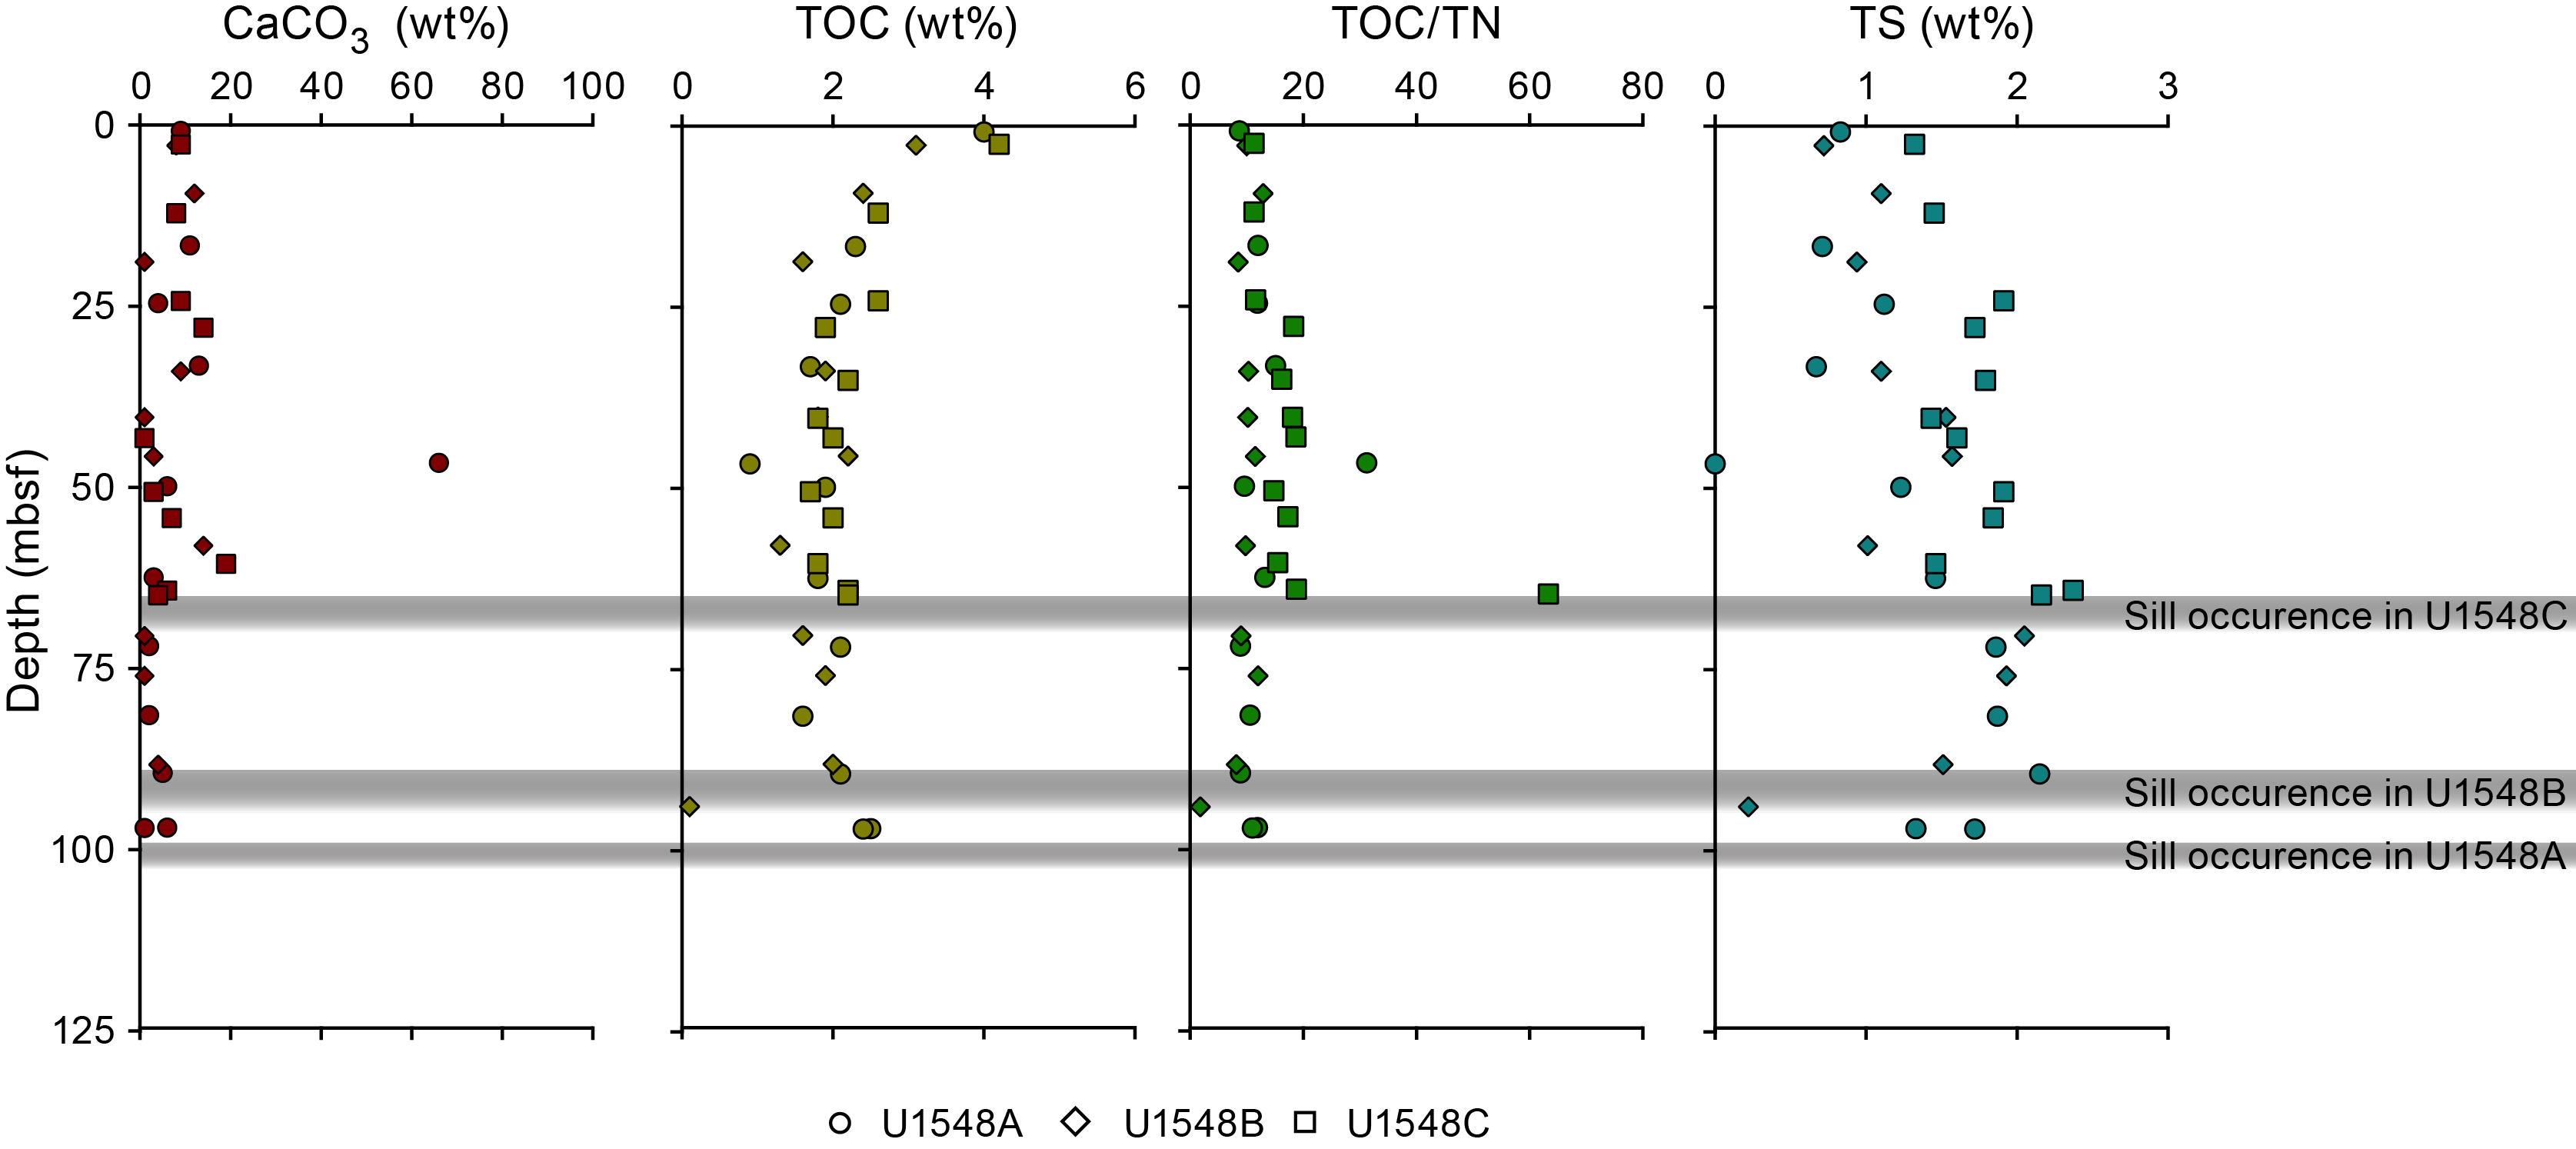
In Holes U1548D and U1548E, the CaCO3 content fluctuates around an average value of 8 wt% without a clear trend downhole (Figure F45). At 103.6 mbsf, a discrepancy is noted between the CaCO3 content close to 0 wt% in Hole U1548D and the maximum CaCO3 content of ~40 wt% in Hole U1548E. The maximum TOC content of ~4.0 wt% in the uppermost samples decreases with depth to ~2.2 wt% by 18.1 mbsf. TOC values remain relatively stable around 2.6 wt% between ~28 and ~51 mbsf. Between 56 and 65 mbsf, TOC values increase, and a local maximum of ~3.9 wt% in Sample 385-U1548D-7H-2, 145–150 cm, is followed by a slight decrease to ~2.0 wt% between 70 and 75 mbsf. From ~79 to ~108 mbsf, TOC values do not show a clear trend and fluctuate around 2.5 wt%. TOC/TN has an average value of ~11 in the uppermost samples of both holes and fluctuates downhole around an average value of 13.8. Slightly higher TOC/TN values are noted between ~56 and ~70 mbsf. These values suggest the organic matter originates mainly from algal biomass with a slight contribution from terrestrial organic matter. Two samples in Hole U1548E (2H-2, 146–151 cm, and 8H-2, 145–150 cm), however, have a TOC/TN value of ~26, which suggests the influence of terrestrial organic matter (Meyers, 1994). In Hole U1548D, the TS content shows a generally increasing trend from 1.3 wt% in the uppermost sample to 1.8 wt% at ~103 mbsf. The TS profile in Hole U1548E is slightly different, showing an increase from ~1.2 wt% in the uppermost sample to a local maximum of ~2.1 wt% at 18 mbsf followed by relatively constant TS content at ~1.6% from 27 to 69 mbsf. From ~94 to ~108 mbsf, TS content is ~1.9 wt%, though a minimum of ~1.1 wt% is observed in the carbonate-rich Sample 385-U1548E-12H-2, 148–153 cm. TS and TOC contents are not correlated in Holes U1548D and U1548E and show excess sulfur (average TOC/TS value = 1.6) compared to the normal marine trend (Goldhaber and Kaplan, 1974; Berner, 1982).
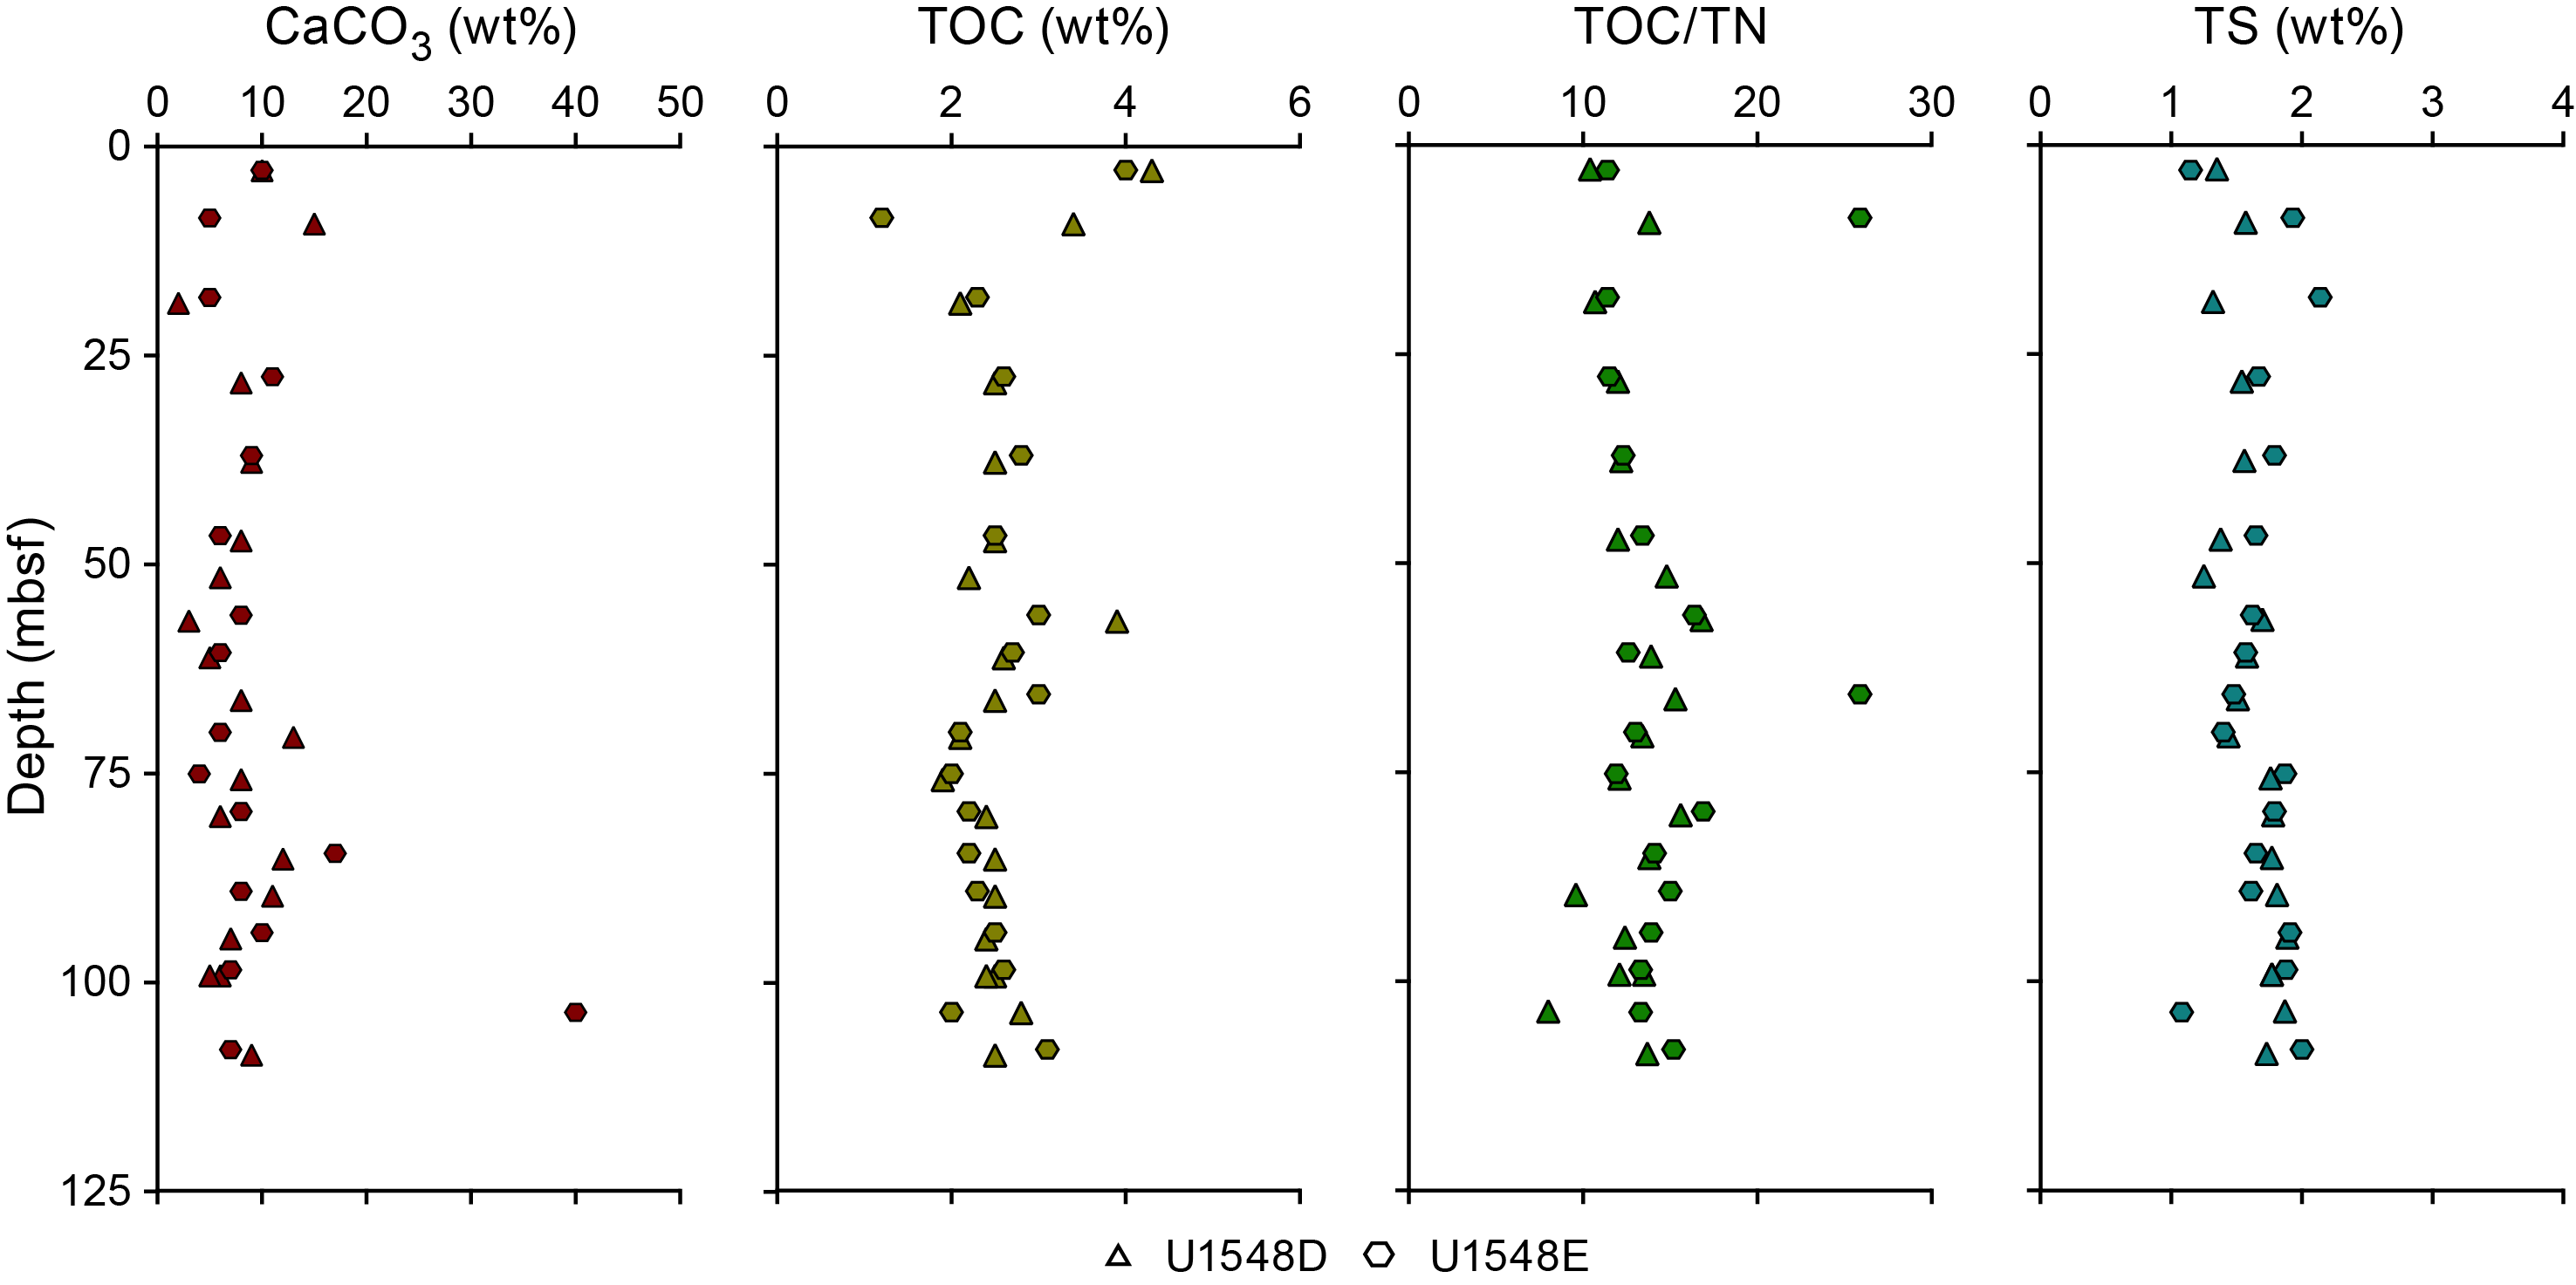
10.2. Source rock analysis
Ten samples from Hole U1547B and six from Hole U1548A were selected for source rock analysis (SRA) (Table T22; Figure F46). These samples were distributed along the sediment column, and four samples are in relative proximity to the sills (385-U1547B-21F-2, 144–151 cm; 29F-1, 91–92 cm; 29F-3, 72–73 cm; and 385-U1548A-16H-1, 80–81 cm). These analyses were performed during a session that experienced gas flow rate problems, leading to decreased accuracy in measurements. These results must therefore be taken with caution.
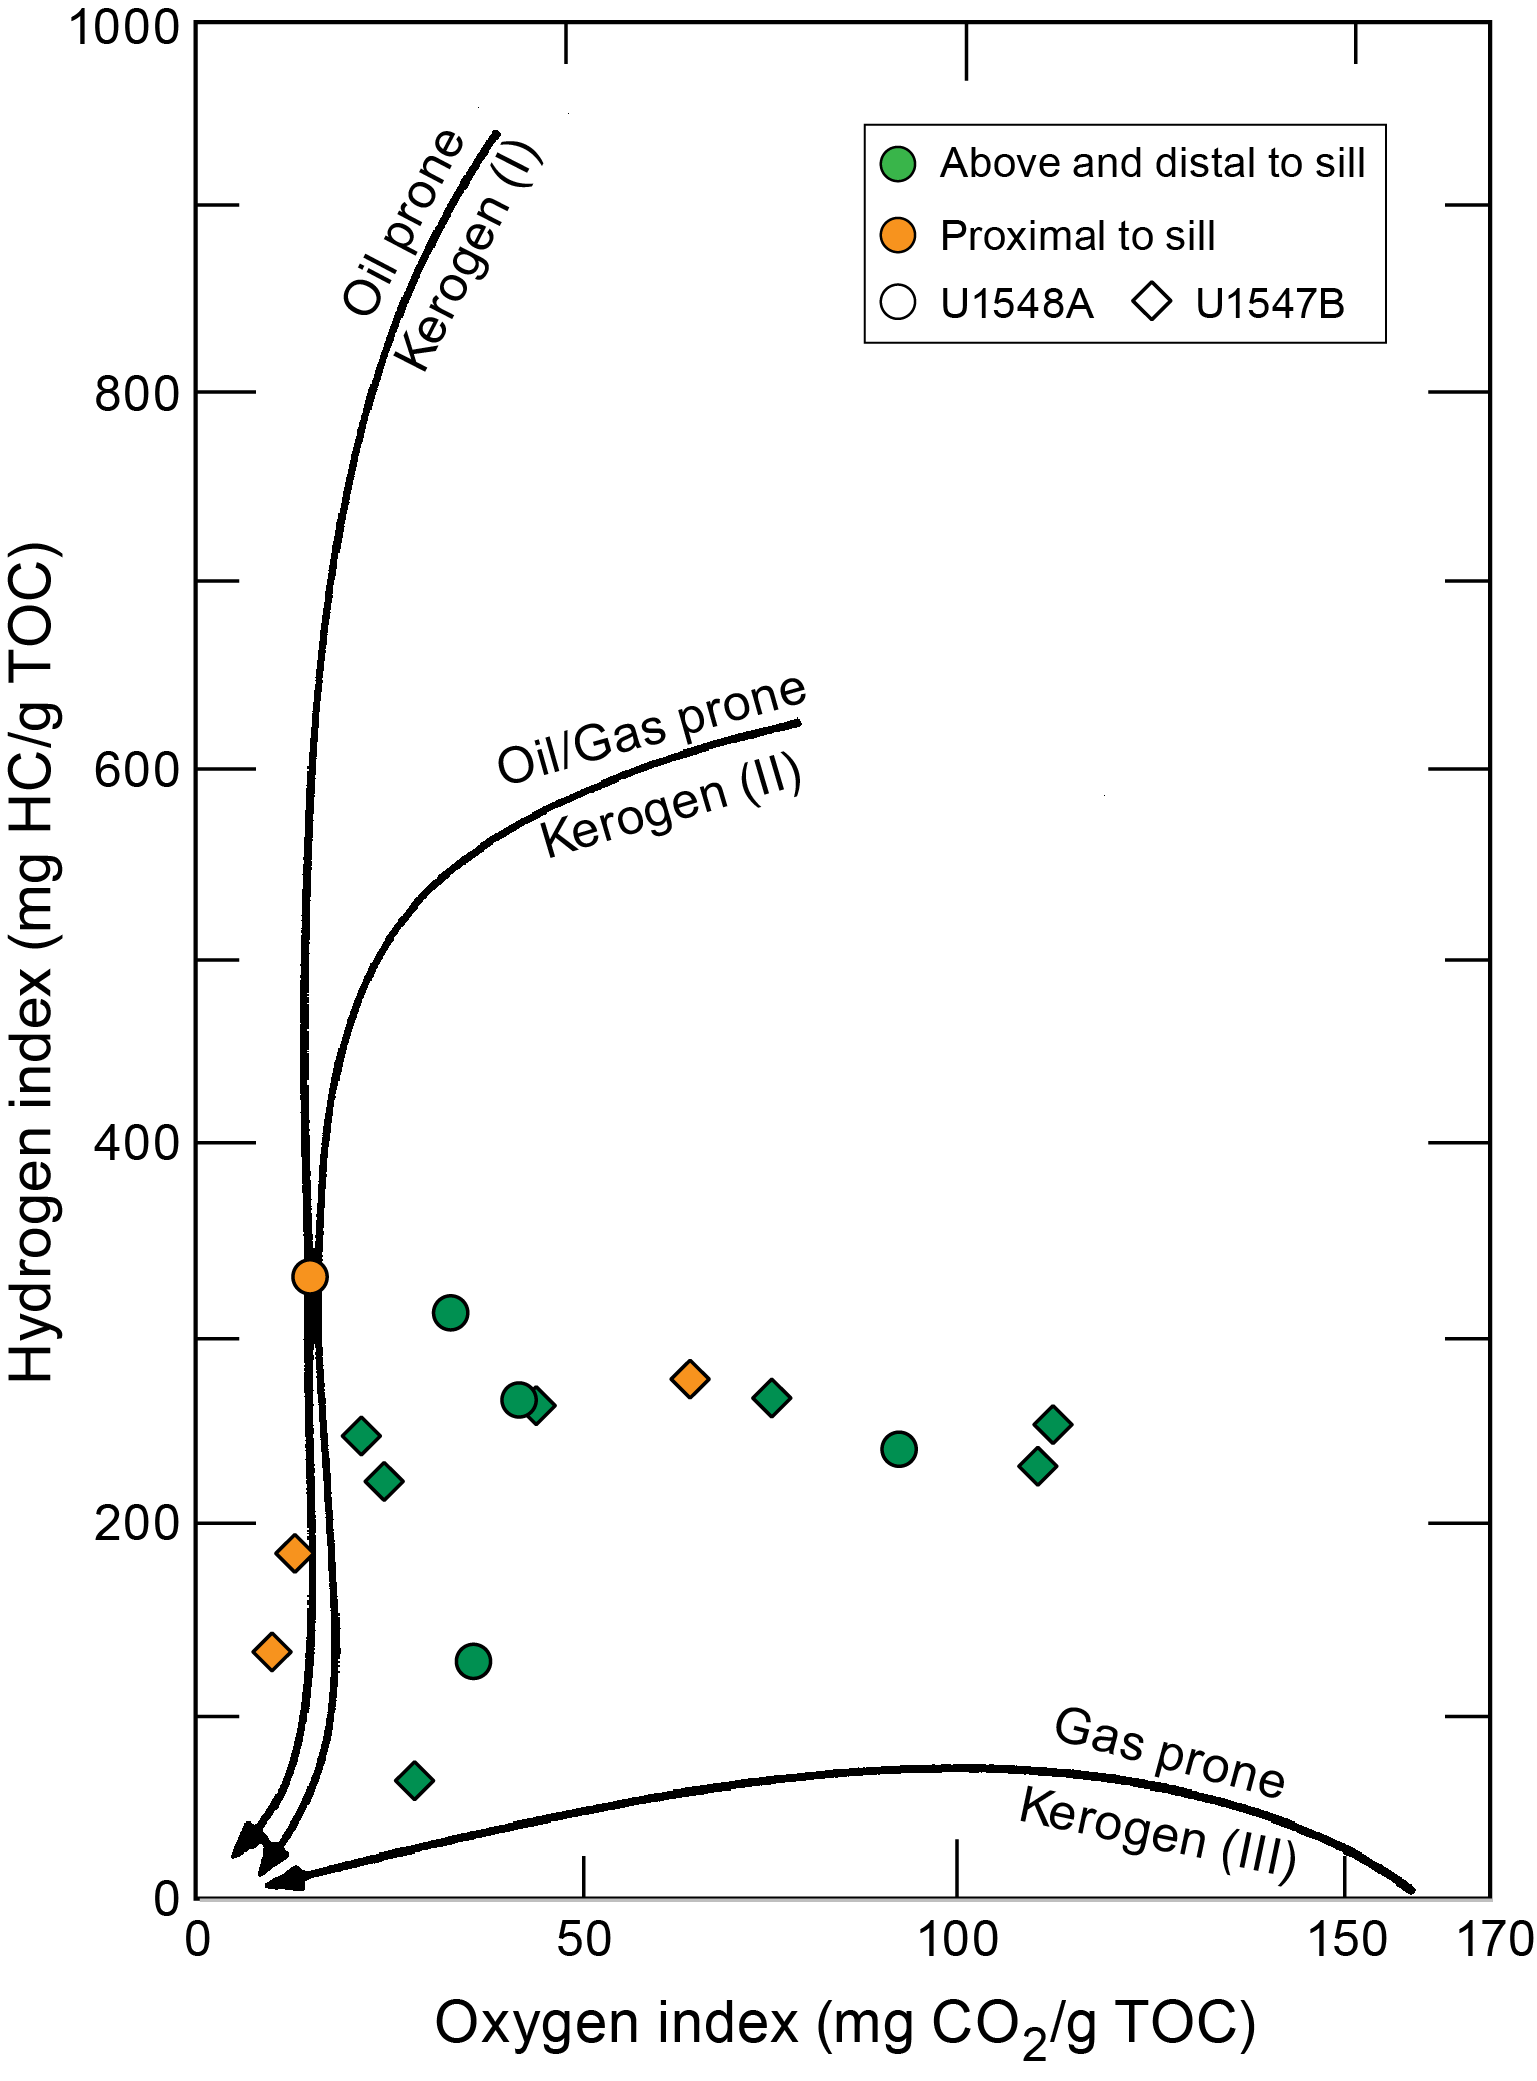
The observed trends observed in Holes U1547B and U1548A are consistent with those observed in Hole U1546A. TOCSRA values of samples distant from the sills vary between 1.8 and 2.6 wt% in Hole U1547B and between 1.4 and 2.7 wt% in Hole U1548A. Hydrogen index (HI) values vary around 250 mg HC/g TOC for most samples in both holes. One sample (385-U1547B-10H-2, 133–140 cm) contrasts with a notably low HI value of 61 mg HC/g TOC. Oxygen index (OI) values decreasing downhole from 90–110 mg CO2/g TOC in the uppermost samples to values lower than 30 mg CO2/g TOC. Tmax values are notably variable between 404° and 440°C and do not show notable trends downhole, which is consistent with the short length of both holes. The average Tmax value of 420°C in both holes indicates that the organic matter is thermally immature. In Hole U1547B, samples at proximity to the sills show increased Tmax values as high as 441°C, indicating thermal maturation up to the oil generating window. A comparable trend is not observed in Hole U1548B.
These trends are reflected in the relationship between HI and OI (Figure F46). Samples distal to the sill are intermediate between Type II and Type III kerogens. Samples located in proximity to the sills tend to show decreased HI and OI values consistent with moderate thermal maturation of the organic matter in these samples.
10.3. Hydrocarbon gases
Headspace samples were taken from each core to monitor C1–C6 hydrocarbons per the standard safety protocol during drilling (Pimmel and Claypool, 2001). At Site U1547, 79 headspace samples were analyzed for their parts per million by volume concentration (Table T23), and then the headspace samples were corrected by sample weight and porosity to determine the molar concentration of dissolved hydrocarbons (Table T24). In addition to the standard sediment headspace samples acquired during sediment recovery, small chips of rock were placed in vials and treated similarly during igneous rock recovery. Both types of samples are referred to as headspace samples in the following discussion.
Dissolved hydrocarbon data from Holes U1547A–U1547E are combined for analysis and discussion (Figure F47). In general, quantities of methane are low (from below detection limit to <5 mM CH4) in sediments, but they increase sharply from >5 to ~123 mM CH4 in the sills. A similar trend was observed in C2–C6 quantities, which are also low in the sediments but occur in greater quantities in the sill. In general, C1/C2 values in the sediment are lower than those in the sill (~10–50), and those in the sill vary slightly around a value of 130. An exception to this is Hole U1547A, where this trend is reversed. Anomalous C1/C2 values, as defined by Pimmel and Claypool (2001), were observed in Holes U1547A, U1547B, and U1547D (Figure F48), but these trends reversed and returned to a normal evolution with depth.
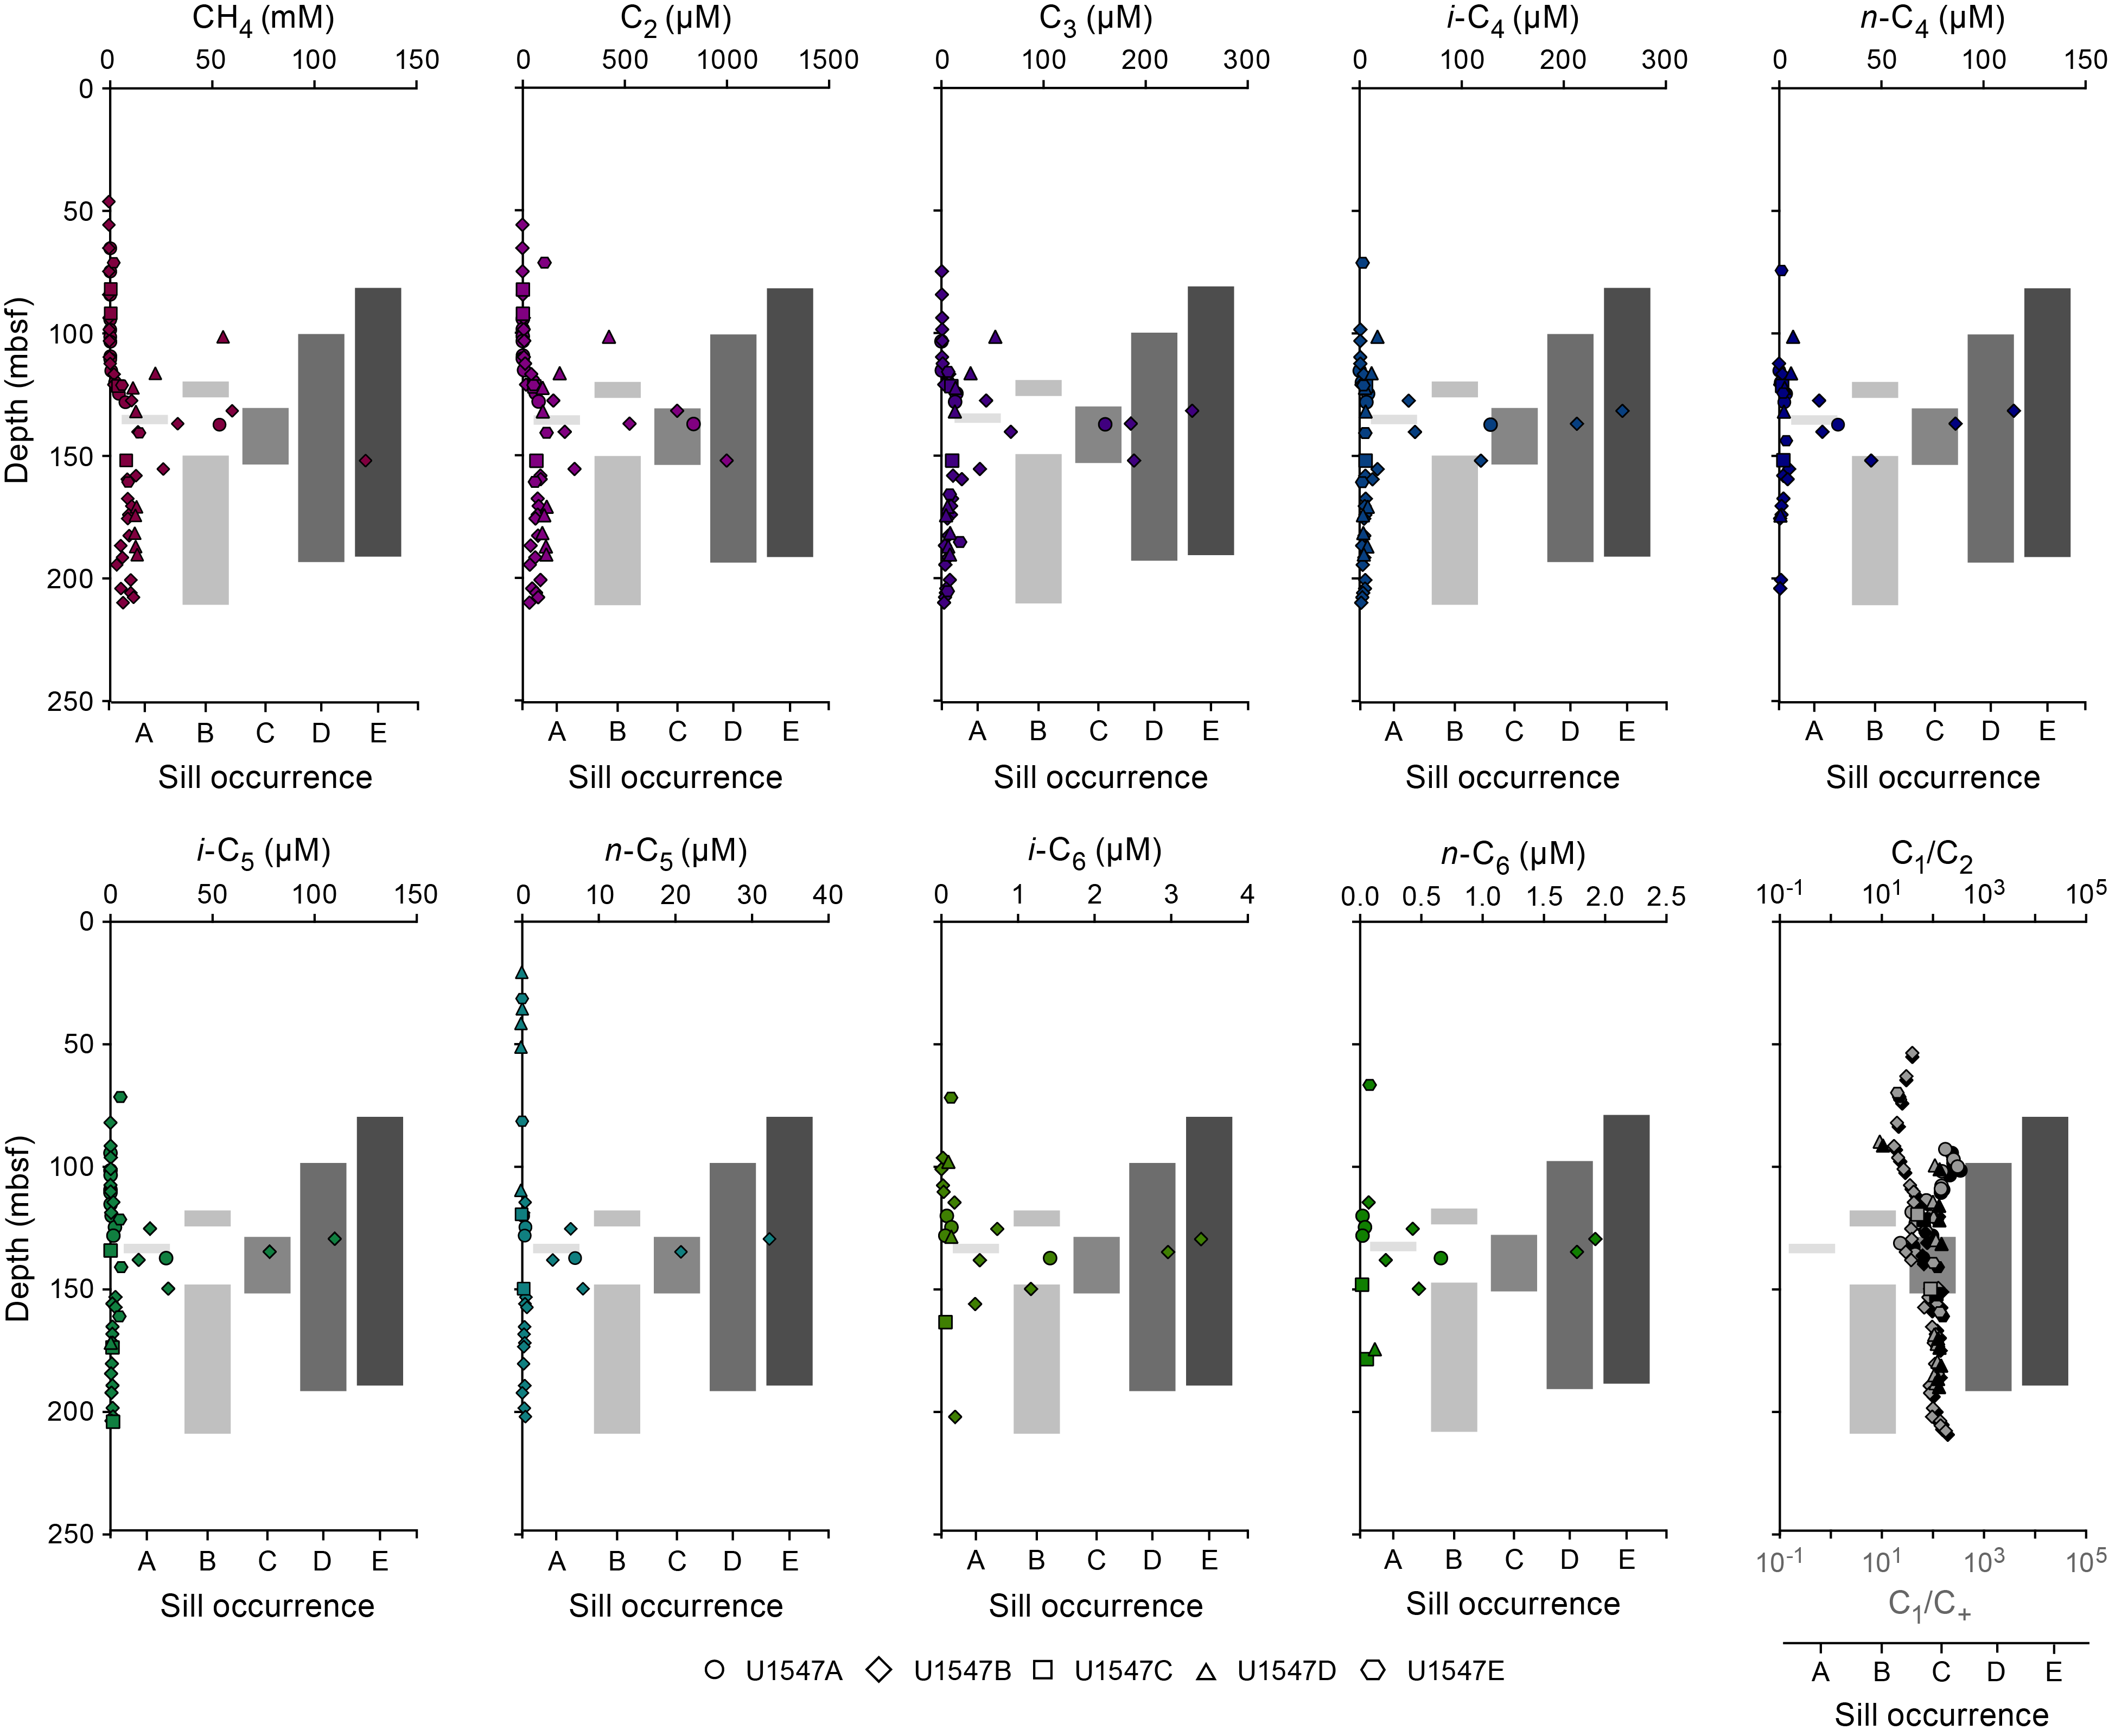
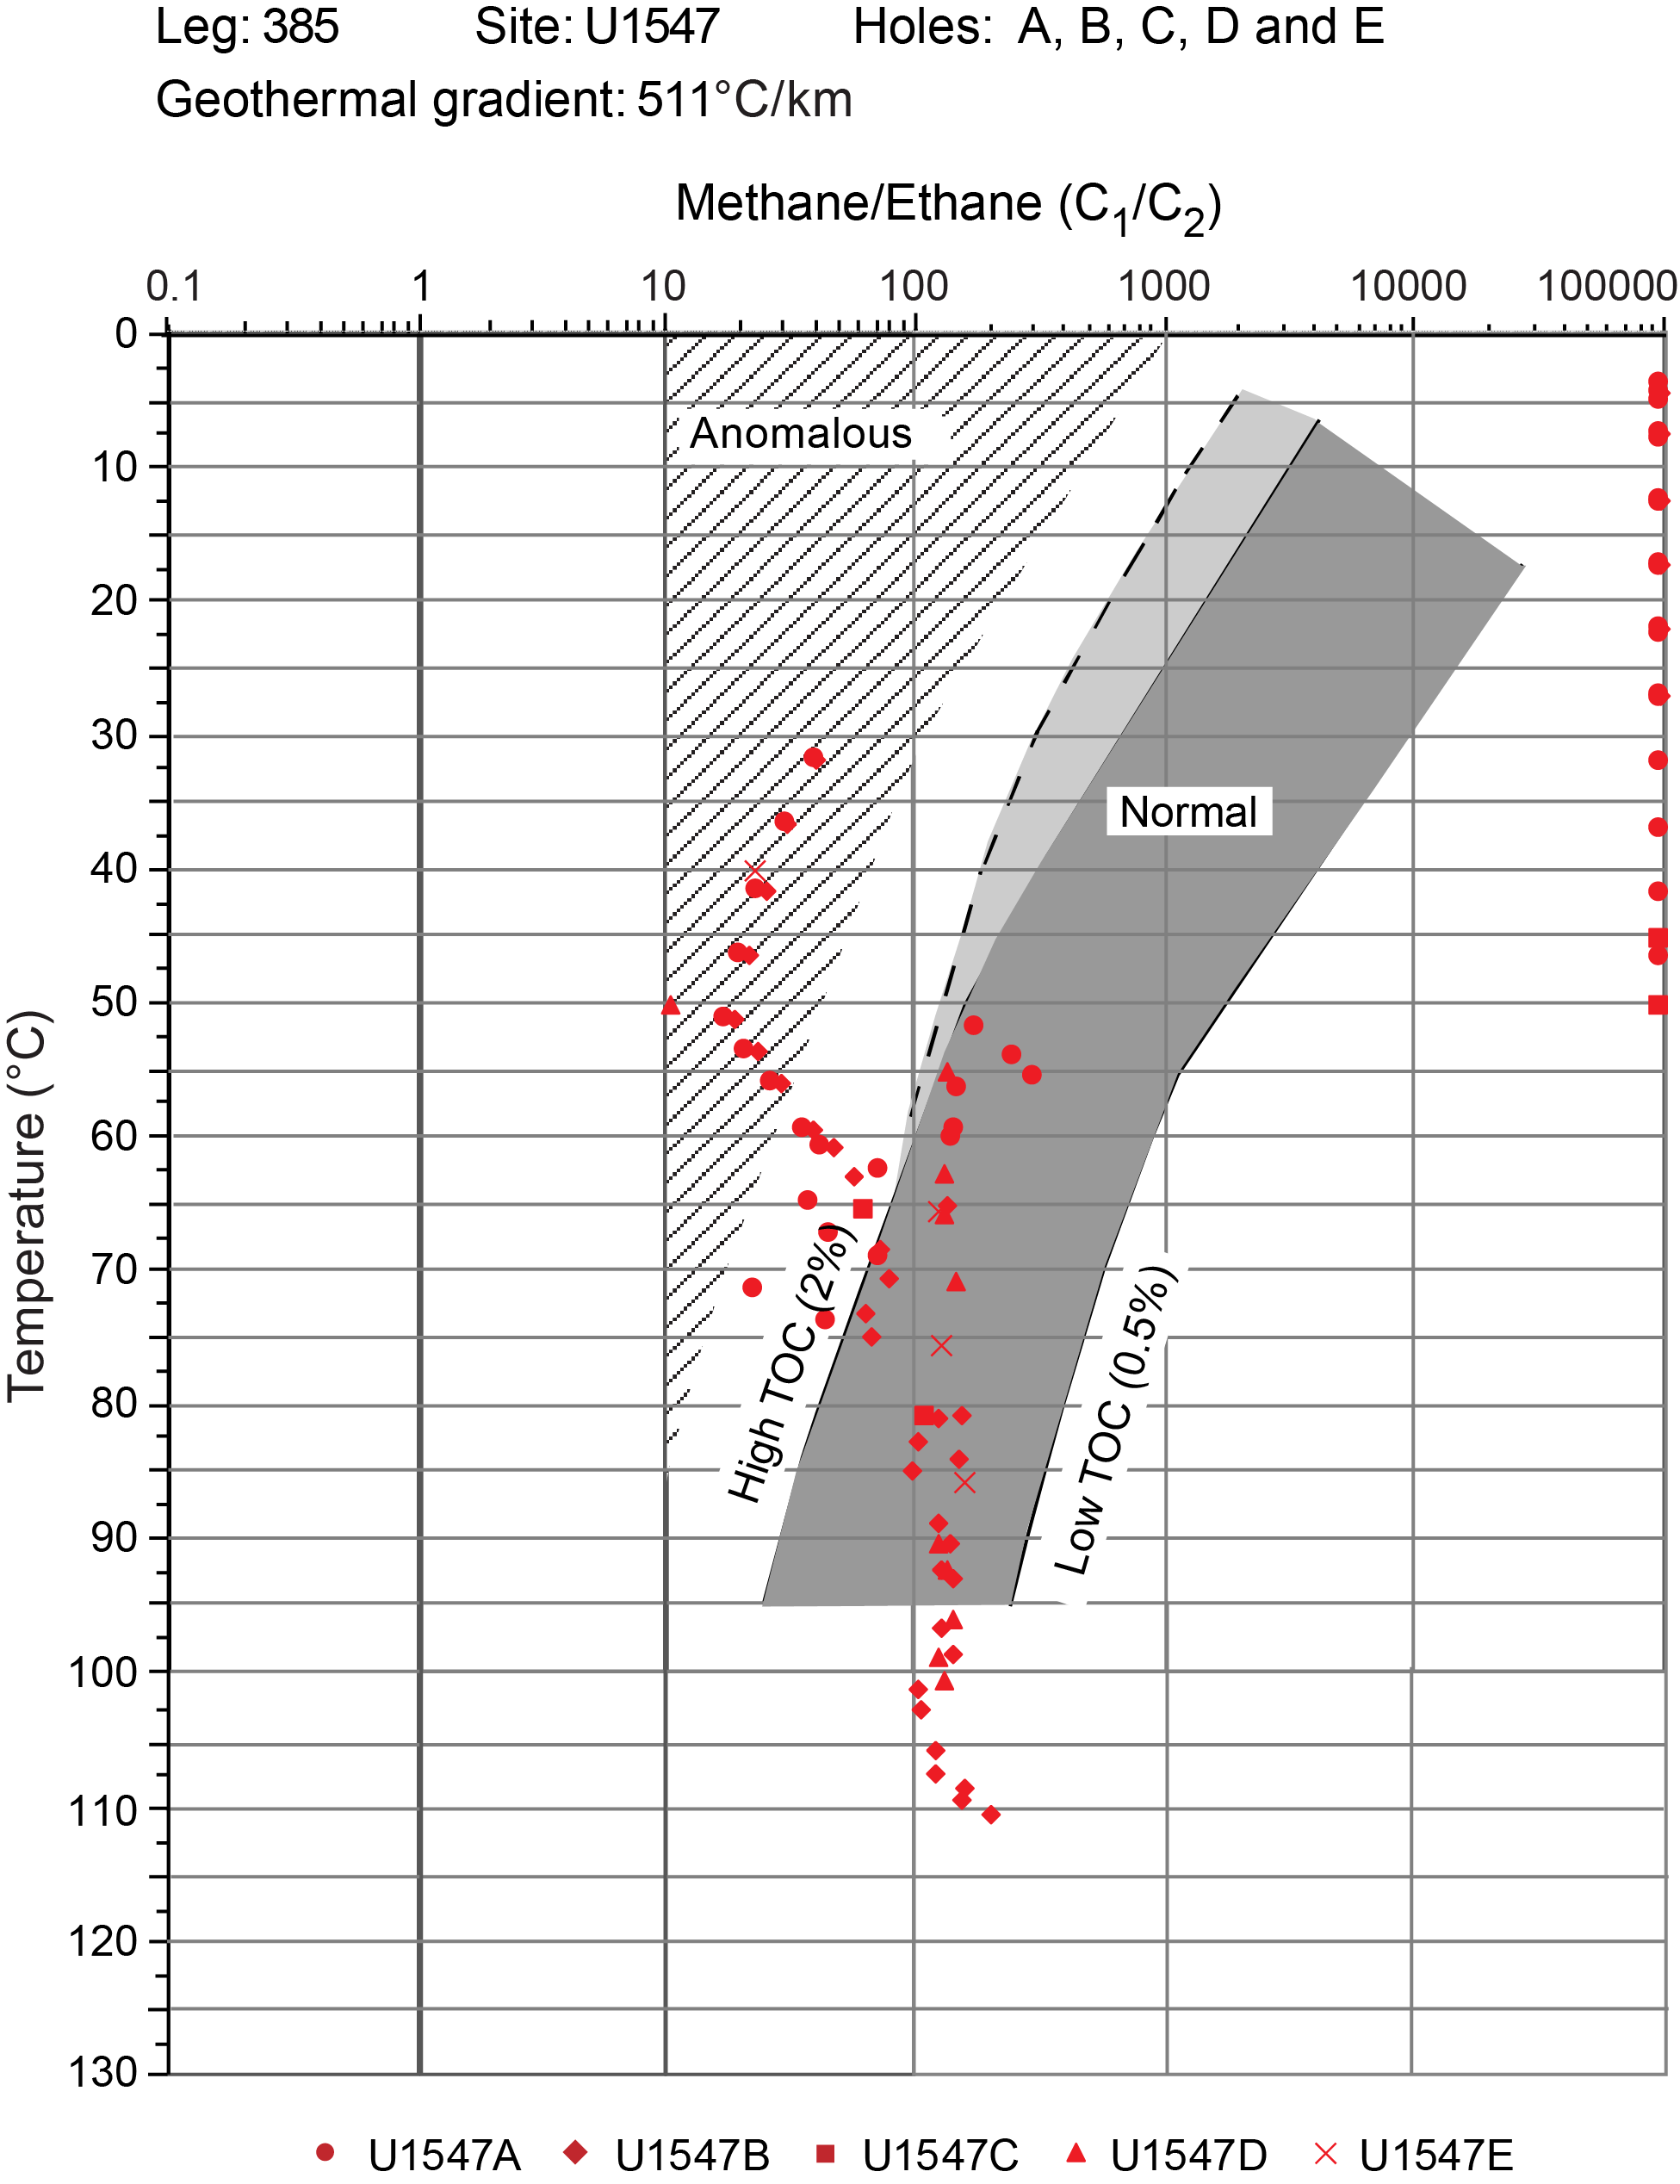
In addition to the headspace measurements described above, 11 void gas samples were taken for Holes U1547A and U1547B when void spaces were observed in the core on the core receiving platform (Table T25). These samples were analyzed to determine the concentrations and values of C1/C2 and C1/C+ (Figure F49). No voids were present in Holes U1547C–U1547E. Void samples are dominated by methane, which is present at levels from ~9 to ~93%. Methane and hydrocarbon data appear to peak at the same depth intervals noted in the headspace samples (near the sill and between the two sills in Hole U1547B), although these depth intervals are less clear in the void gas data set than in the headspace data due to the lower sampling resolution. In general, C1/C2 values also vary slightly around 130.
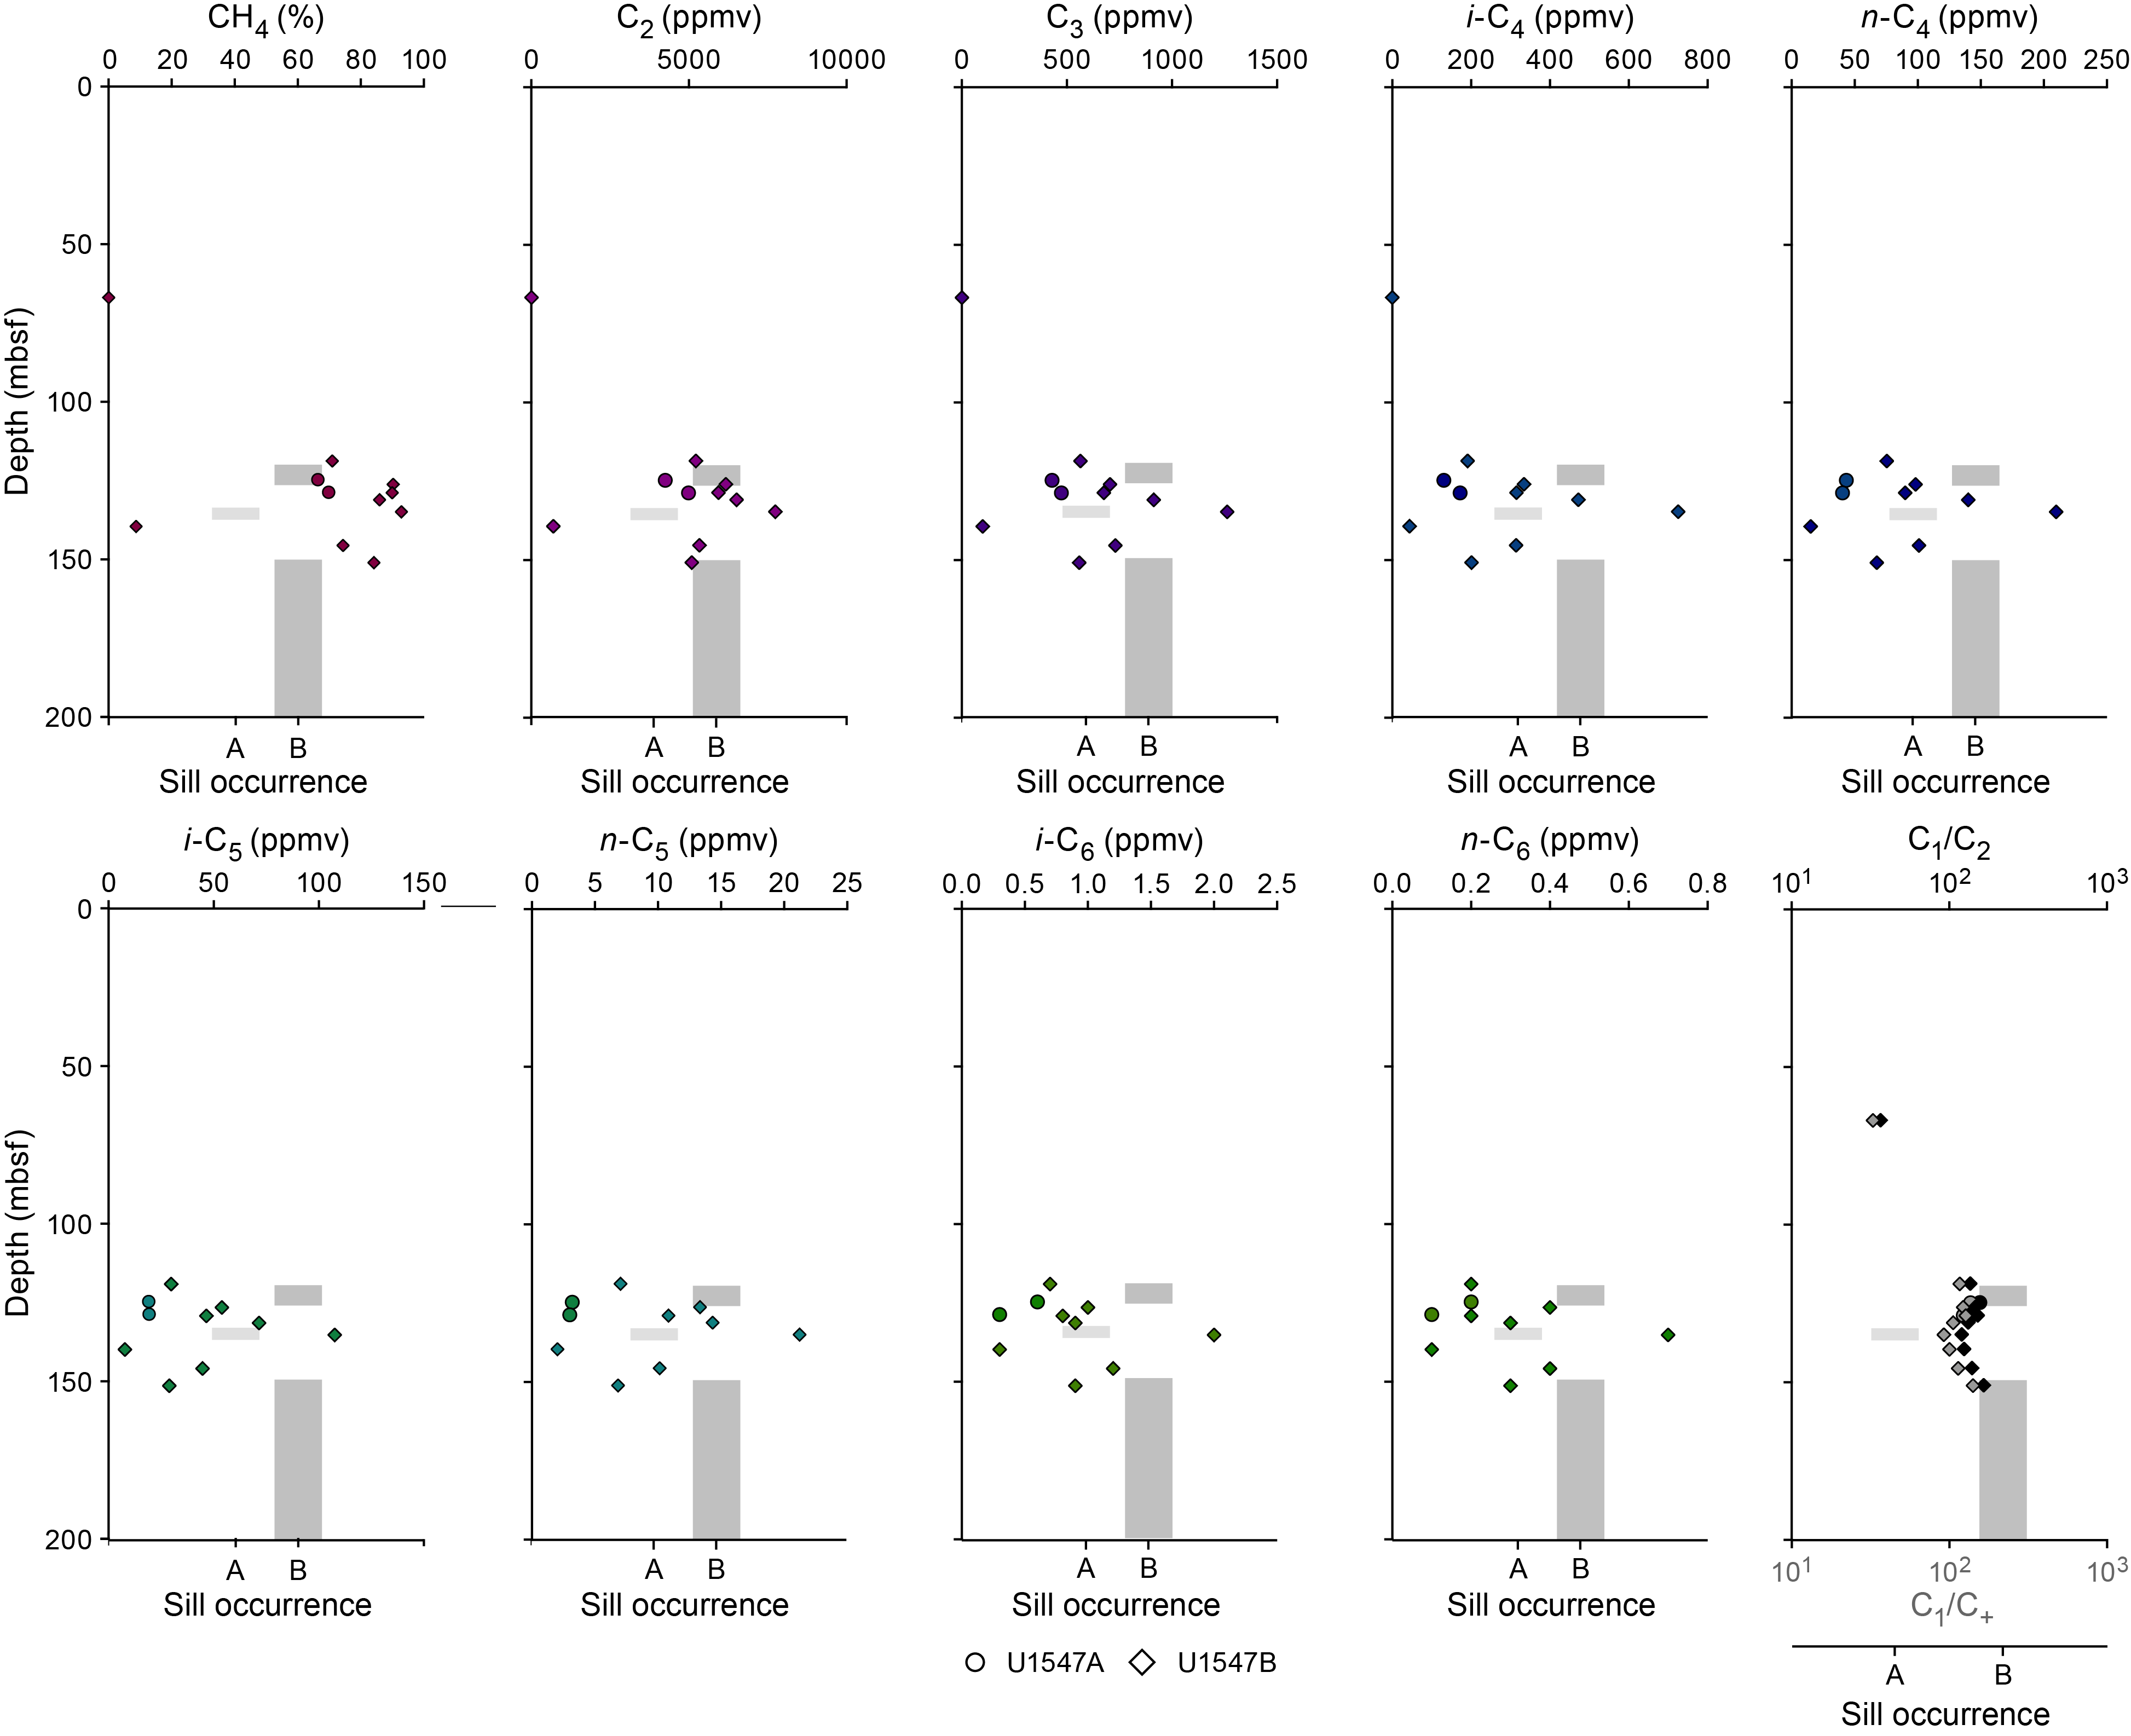
For Hole U1547B APC and HLAPC cores, the lengths of the void spaces within the core liner created by expanding gases were measured immediately after core recovery on the core receiving platform (Table T26; Figure F50). Voids were generally present from 63.7 to 148.9 mbsf, and the amount of void space per meter core increased with depth from 0.41% to a maximum of 36.16%.
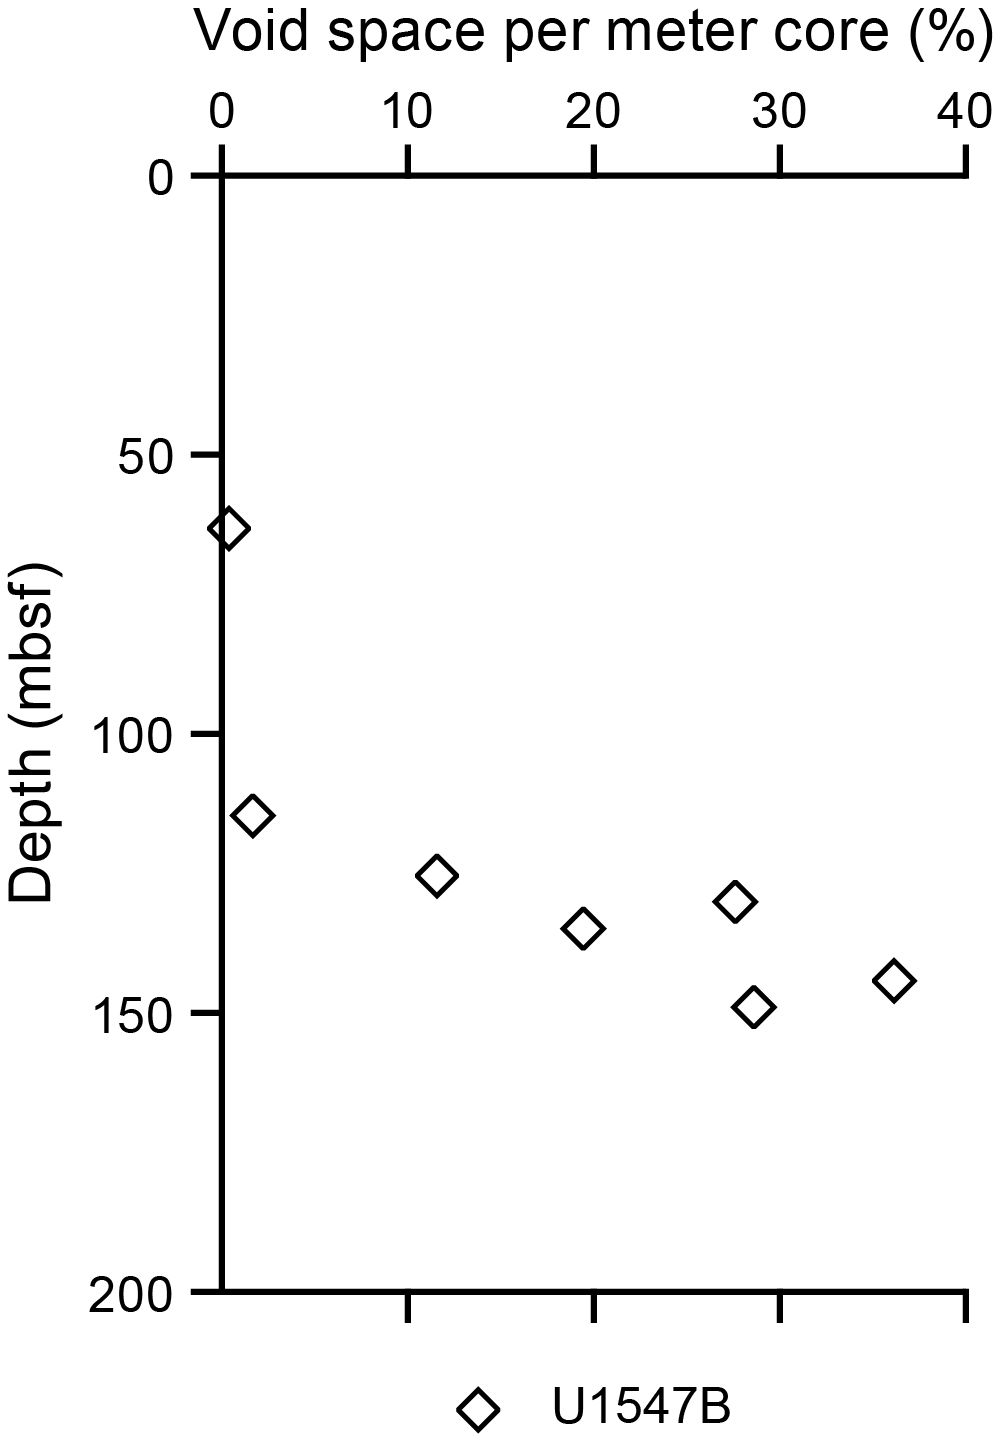
At Site U1548, 79 headspace samples were analyzed for their parts per million by volume concentration (Table T27), and then the headspace samples were corrected by sample weight and porosity to determine the molar concentration of dissolved hydrocarbons (Table T28). As at Site U1547, in addition to the standard sediment headspace samples acquired during sediment recovery, small chips of rock were placed in vials and treated similarly during igneous rock recovery. Both types of samples are treated similarly in the following discussion.
Dissolved hydrocarbon data from Holes U1548A–U1548C are similar and thus combined for discussion here (Figure F51). In general, quantities of methane are low (from below detection limit to <0.5 mM CH4) in sediments, but they increase sharply up to ~15 mM CH4 in the sill. A similar trend was observed in C2–C6 quantities, which are also low in the sediments but appear in greater quantities in the sill. In general, C1/C2 values in the sediment are lower than those in the sill (~55 on average), and those within the sill average at ~120. Anomalous C1/C2 values were observed in Holes U1548A–U1548C (Figure F52), as defined by Pimmel and Claypool (2001), but these trends reversed and returned to the normal region with depth.
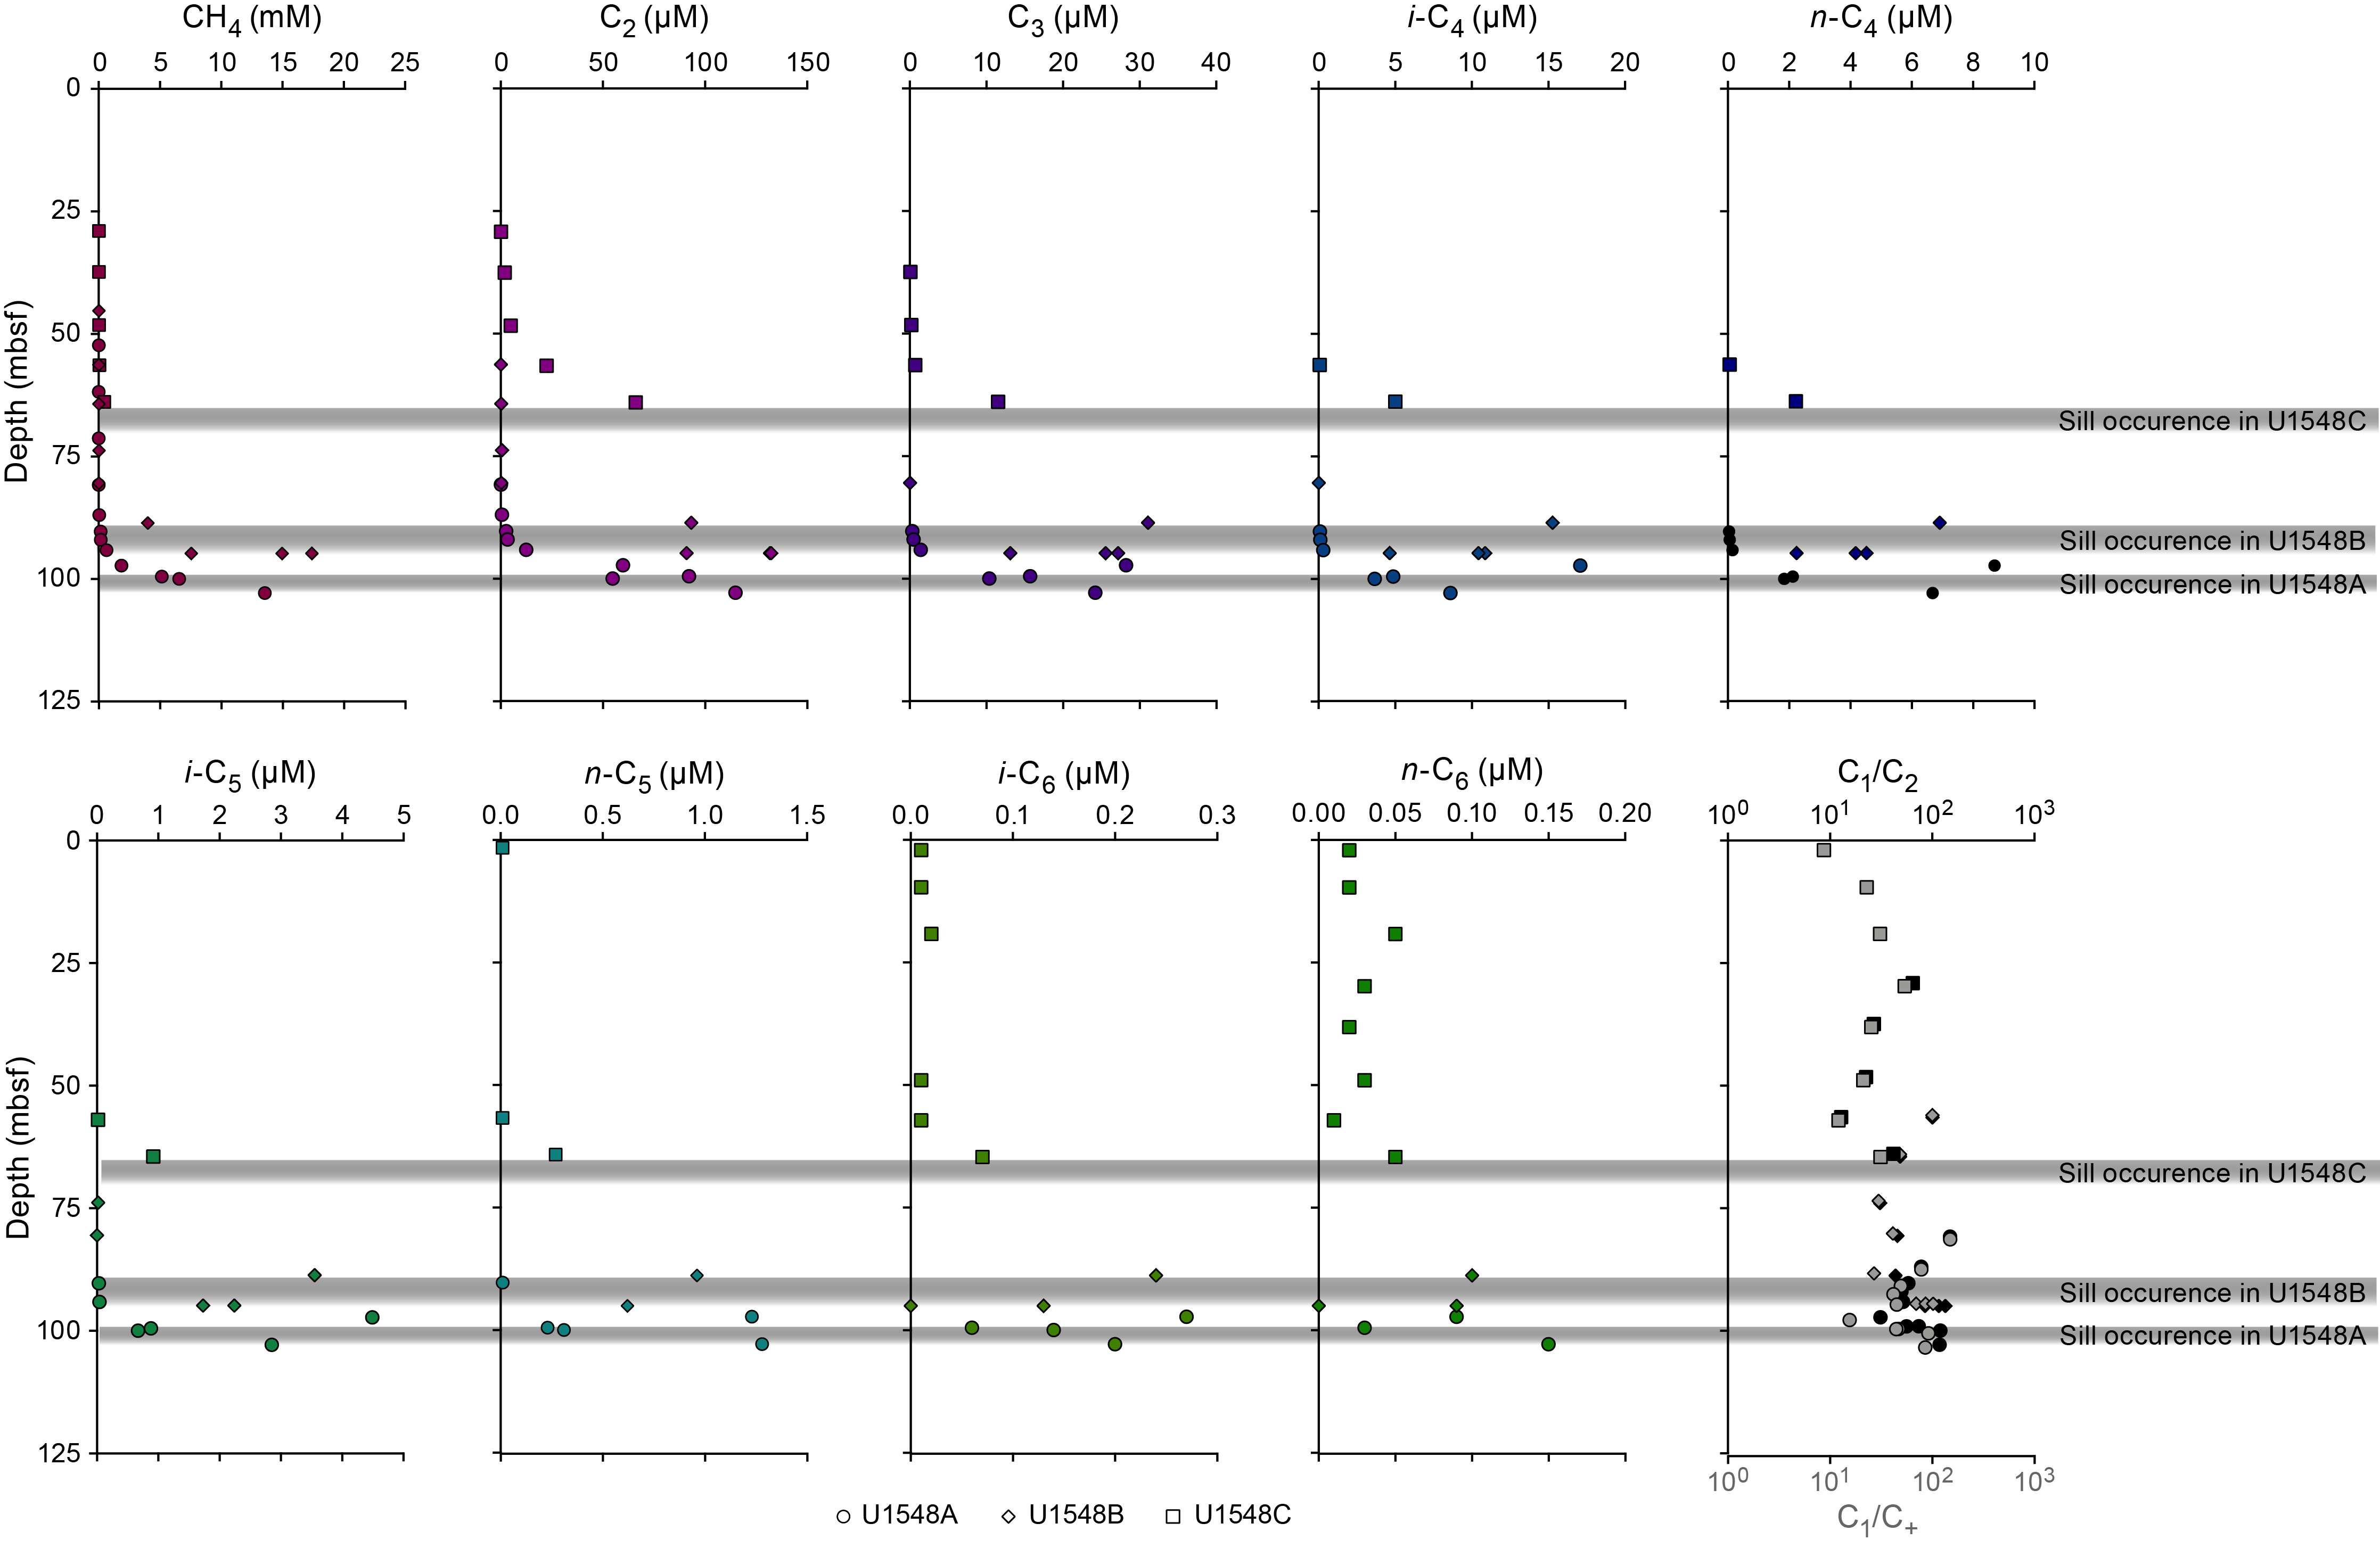
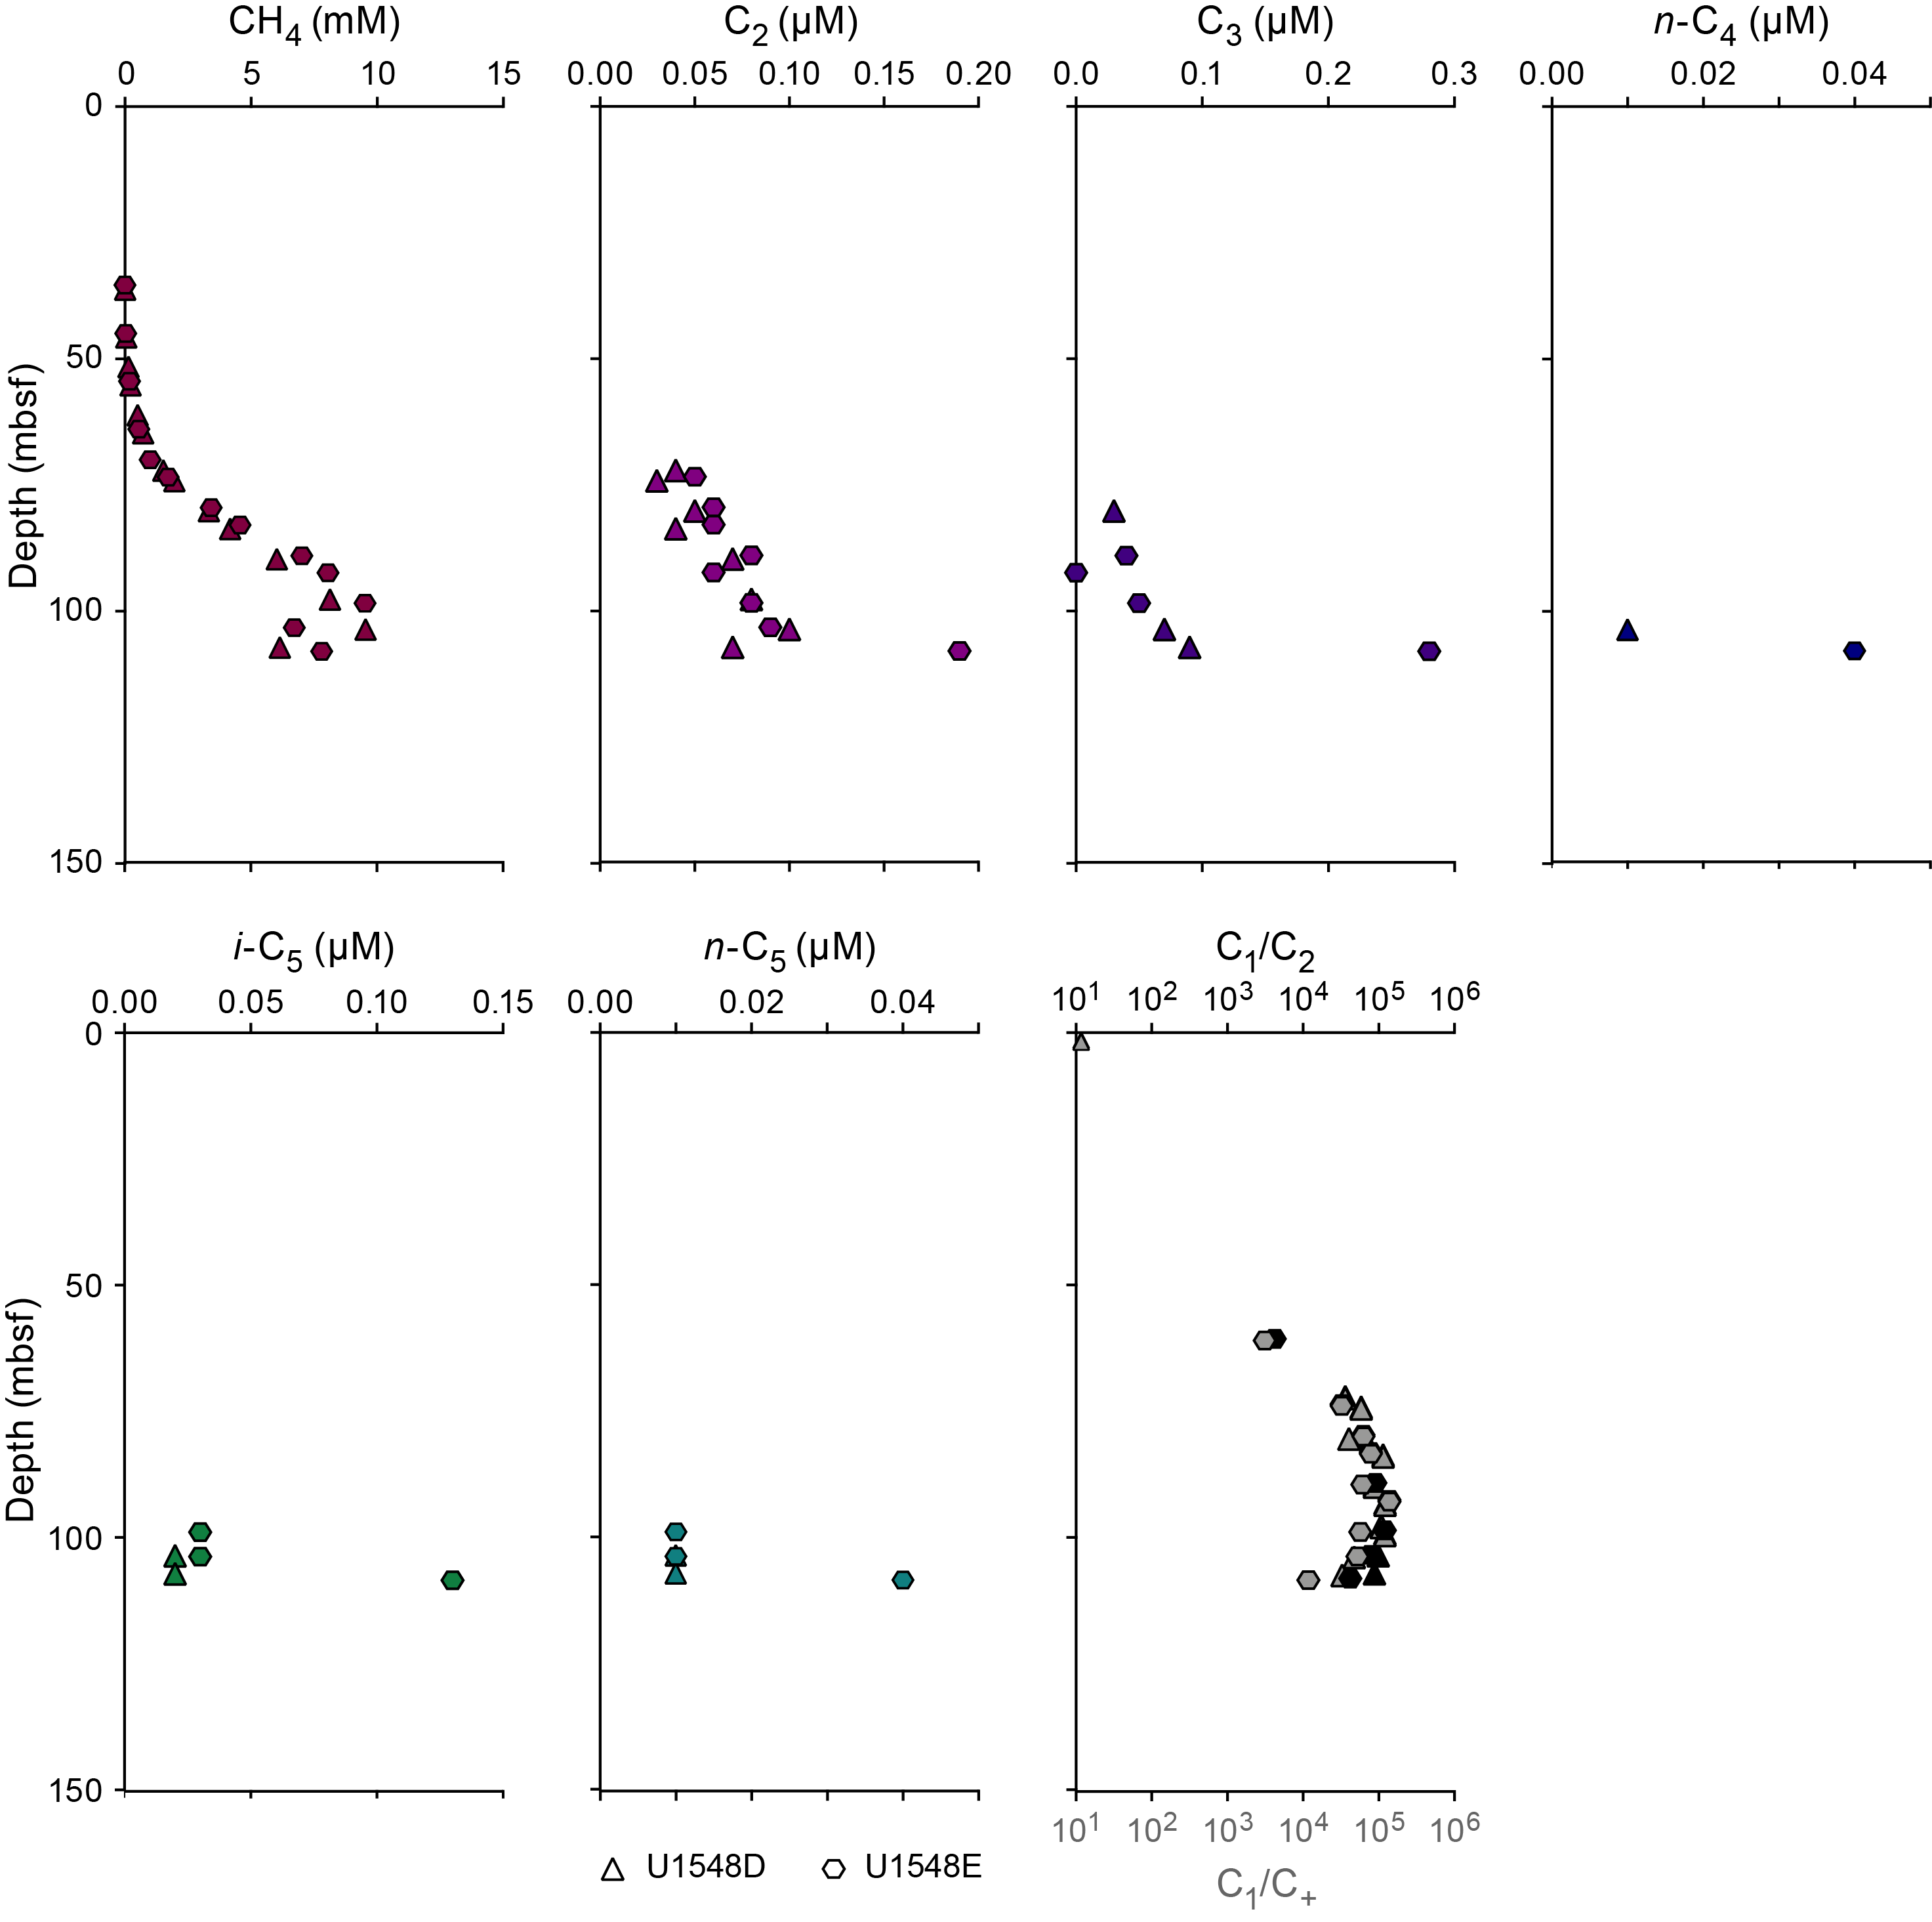
Dissolved hydrocarbon data from Holes U1548D and U1548E are similar and are thus combined for discussion here (Figure F53). Methane concentration is below detection limit from the surface to ~35 mbsf. From here methane concentrations increase from 0.01 mM to 9.5 mM at ~100 mbsf in both holes. Methane concentrations then decrease to values ranging from ~6–7.8 mM at the bottom of both holes. C2–C6 hydrocarbons were detected in very low concentration (>0.3 µM) below ~80 mbsf; in general, they decrease with depth. With the exception of one sample (385-U1548D- 1H-1, 147–152 cm) where a small amount of ethane was detected, no anomalous C1/C2 values, as defined by Pimmel and Claypool (2001), were observed in Holes U1548D and U1548E.

In addition to the headspace measurements described above, six void gas samples were taken for Holes U1548A and U1548B when void spaces were observed in the core on the core receiving platform (Table T29). These samples were analyzed to determine the concentrations and values of C1/C2 and C1/C+. Methane concentrations vary from below detection limit to 4.3%, and higher hydrocarbons were present throughout, but the small number of samples prohibits the detection of trends in these species, so no data plots are presented. Void space length was not monitored in Holes U1548A and U1548B.
10.4. Rock incubations
During igneous rock recovery in Holes U1547B–U1547E, 42 rock samples were incubated to facilitate degassing (see Organic geochemistry in the Expedition 385 methods chapter [Teske et al., 2021a]) for ship-based analyses of hydrocarbon content, H2, and CO (Table T30). Methane and higher hydrocarbons were observed throughout, and the presence and abundance of ethene and propene here is notable in comparison to both sediments from all Expedition 385 sites and the comparable rock incubations from Sites U1548 and U1550 (see Organic geochemistry in the Site U1550 chapter [Teske et al., 2021d]). Within these rock samples, the following pore space concentrations were determined: CH4 ranges from below detection limit to ~138 mM, H2 ranges from below detection limit to ~129 µM, and CO ranges from below detection limit to ~87 µM. No trends with depth are observed in any of these species. The method used to extract these gases and the calculation to estimate their abundances in sill material necessarily produced approximations; therefore, the high variability observed is to be expected. Even so, these data permit the observation that, in each of these holes, the concentration of methane within the sill pore spaces and near the sill–sediment transitions is up to several orders of magnitude higher than that within the overlying sediments.
Igneous rocks were also sampled (n = 9) from Holes U1548A–U1548C for incubation to facilitate degassing (see Organic geochemistry in the Expedition 385 methods chapter [Teske et al., 2021a]) for ship-based analyses of hydrocarbon content, H2, and CO (Table T31). Methane and higher hydrocarbons were observed throughout, and ethene and propene are less abundant here than in igneous rocks at Site U1547. The following pore space concentrations were determined for these samples: CH4 ranges from below detection limit to ~4 to ~36 mM, H2 ranges from below detection limit to ~20 µM, and CO ranges from below detection limit to ~32 µM. As at Site U1547, no trends with depth are observed in any of these species. Even so, these data permit the observation that, in each of these holes, the concentration of methane within the sill and near the sill–sediment transitions is up to several orders of magnitude higher than that within the overlying sediments.
10.5. Hydrogen and carbon monoxide
Headspace samples were taken from each core recovered in Hole U1547B to monitor molecular hydrogen (H2) and carbon monoxide (CO). Duplicate samples were collected from 17 depths next to samples taken for safety gas monitoring of hydrocarbon gases (Table T32). Dissolved H2 and CO were extracted into a defined headspace, the headspace gas was analyzed, and molar concentrations of dissolved H2 and CO were determined (see Organic geochemistry in the Expedition 385 methods chapter [Teske et al., 2021a]). Because of the presence of H2 and CO in the analytical blank, the minimum quantification limits for in situ concentrations of dissolved H2 and CO were 40 and 150 nM, respectively. Concentrations of dissolved H2 are below detection limit to 44.66 mbsf, reach a first maximum of 71 nM at 55.11 mbsf, decrease to below detection limit from 73.15 to 93.11 mbsf, and increase to values as high as 111 nM near the bottom of the hole (Figure F54). In contrast, CO values are high in the upper part of the hole (427 nM at 7.65 mbsf) and decline with depth to below the minimum quantification limit at 55.11 mbsf. Only two values rise above the minimum quantification limit near the bottom of the hole, concurrent with the rise in H2.
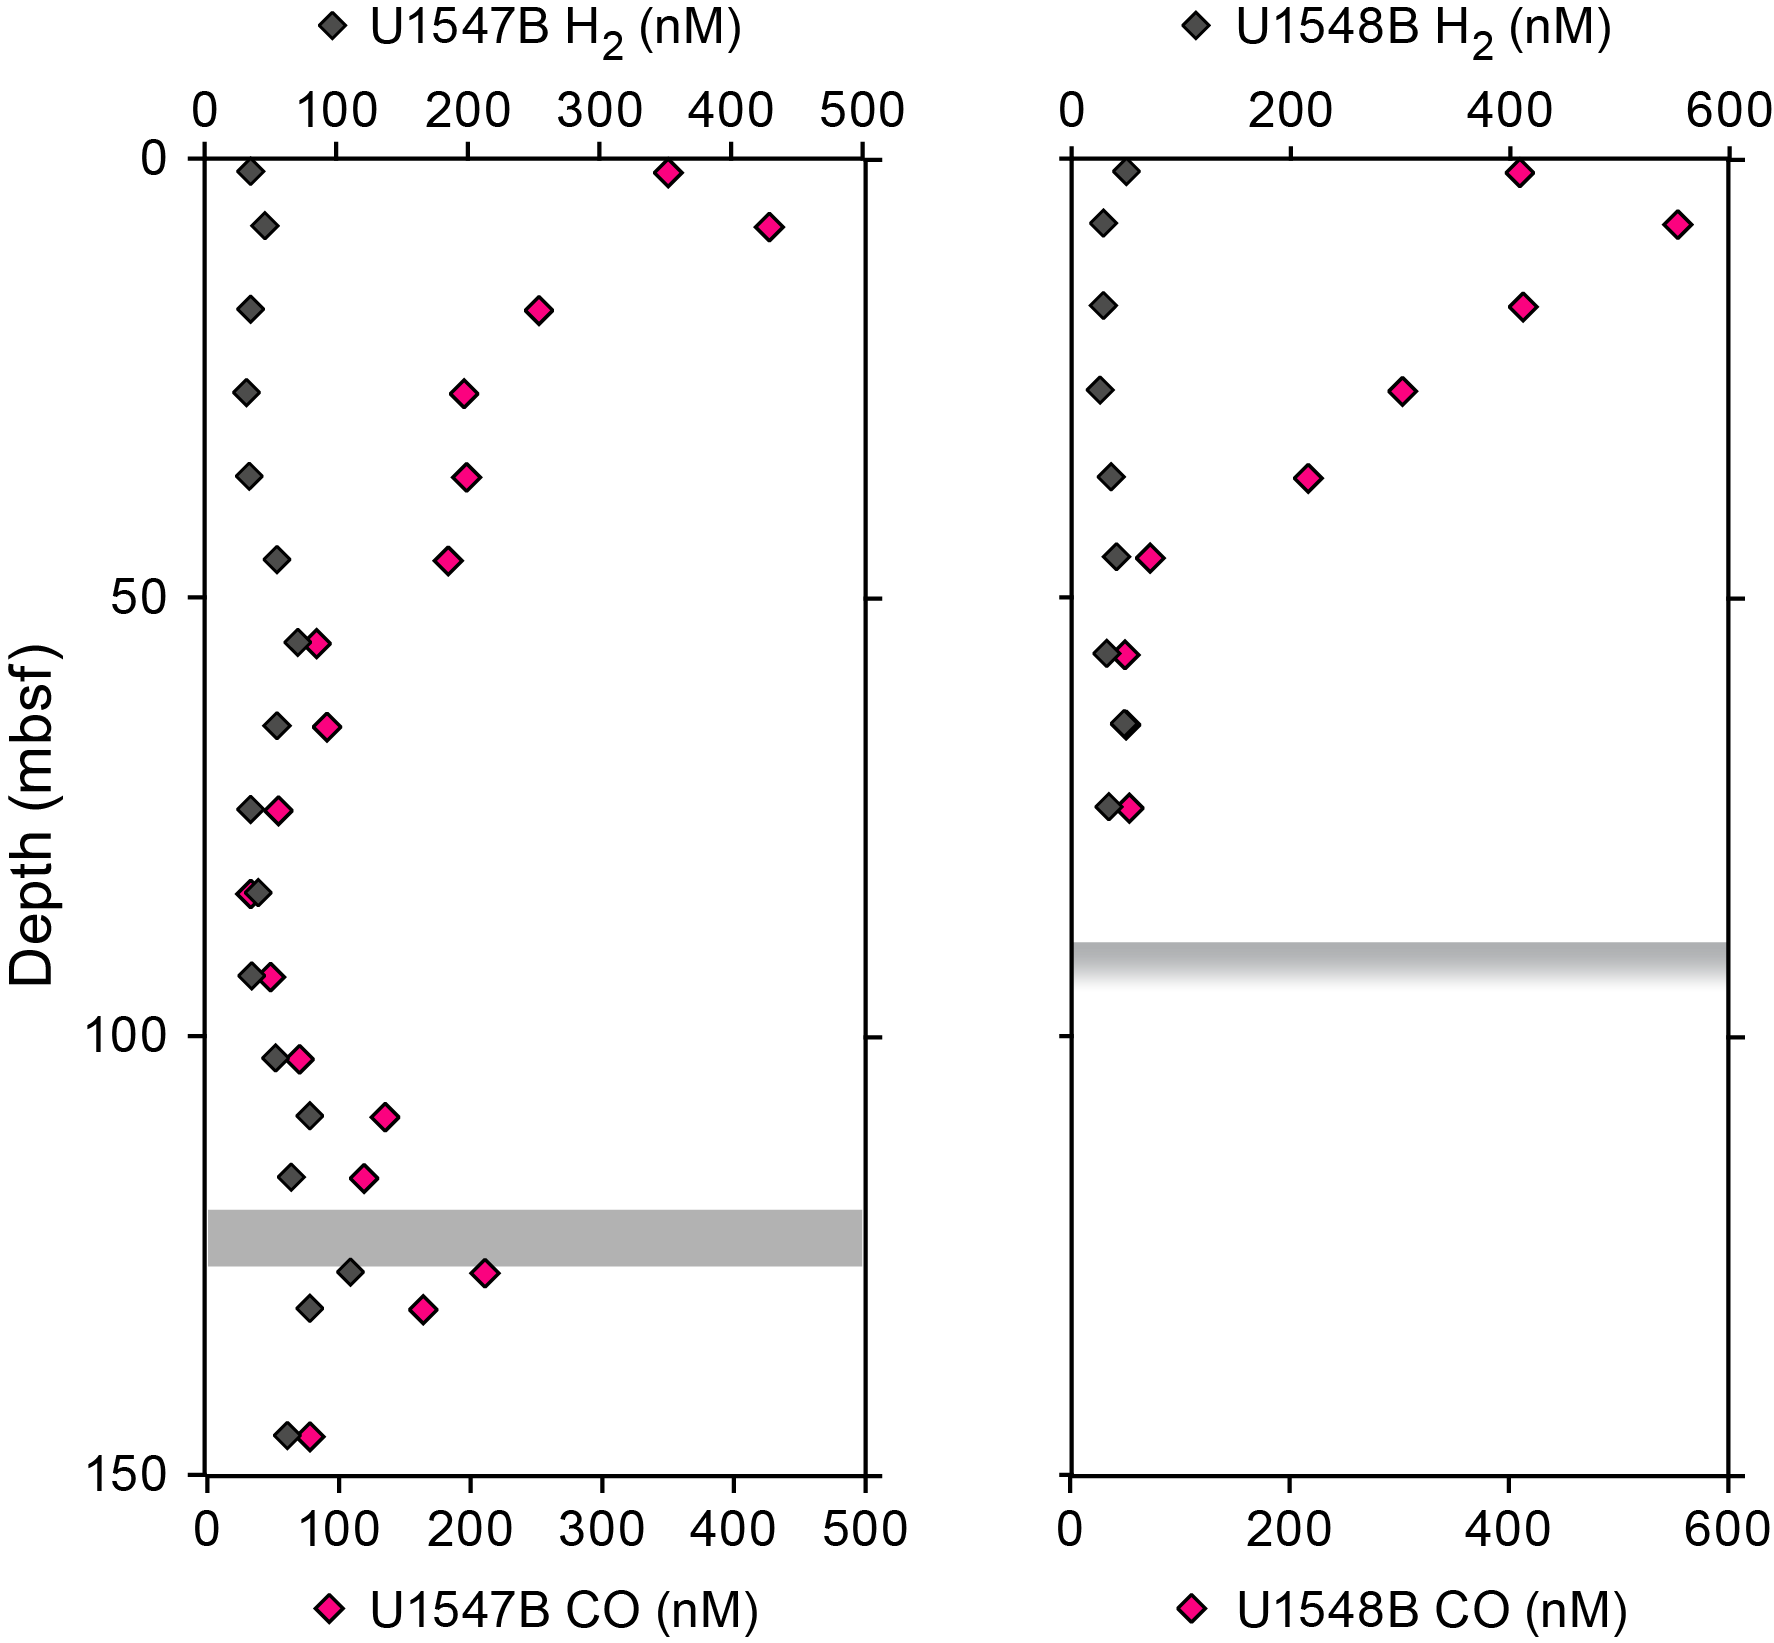
In addition to the headspace measurements described above, we also collected six void gas samples to analyze H2 and CO contents (Table T33). H2 contents ranged between 29 and 159.1 ppmv. In general, H2 content decreases with depth. CO content varies between 33.6 and 48.6 ppmv, and there is no trend with depth.
Headspace samples were also taken from each core recovered in Hole U1548B to monitor molecular hydrogen (H2) and carbon monoxide (CO). Duplicate samples were collected from nine depths next to samples taken for safety gas monitoring of hydrocarbon gases (Table T34). The concentration of dissolved H2 is 50 nM in the uppermost samples and below detection limit for the remainder of the hole (Figure F54). In contrast, CO values are high in the upper part of the hole (554 nM at 7.36 mbsf) and decline with depth to below the minimum quantification limit at 43.35 mbsf.
In addition to the headspace measurements described above, we also collected two void gas samples to analyze H2 and CO contents (Table T35). H2 contents range from 17 to 37.1 ppmv. CO content varies between 37.1 and 87.9 ppmv. No trends in either species are discernible with depth.
11. Microbiology
11.1. Sampling
Sediment cores for microbiological studies were obtained from Holes U1547B, U1548B, and U1548C using the APC, HLAPC, and XCB systems. Generally, the sediment samples covered the steep geothermal and geochemical gradients that are linked to the shallow sill at this location, impacting microbial community composition and diversity (Teske et al., 2019; Ramírez et al., 2020). In addition, a limited number of samples of igneous rock with indications of fluid-rock interaction, such as veins, sediment injections, and amygdules, were taken for microbiological studies from sill material recovered in Holes U1547C (Section 385-U1547C-7R-2), U1547D (Sections 385-U1547D-8R-1, 10R-3, 15R-1, 17R-1, 19R-2, and 21R-1), U1547E (Sections 385-U1547E-5R-1, 10R-1, 15R-2, 17R-3, 19R-2, 20R-1, and 24R-1), U1548A (Section 385-U1548A-20X-1), and U1548B (Sections 385-U1548B-11X-3 and 12X-1). Igneous rock cores were recovered using both the XCB and RCB systems. Detailed curatorial information about all samples (e.g., core, section, interval, and absolute depths of samples) can be retrieved from the Curation and Samples Laboratory Information Management System Online Report (http://web.iodp.tamu.edu/LORE). The collection of subsamples for cell counting, 3-D structural imaging, RNA analyses, and contamination tracing was performed as described in Microbiology in the Expedition 385 methods chapter (Teske et al., 2021a).
On 28 October 2019, it was discovered that the shipboard nitrogen gas contained a significant amount of oxygen (~18%, determined by gas chromatography–thermal conductivity detector [GC-TCD] analysis). Upon this discovery, all the bags containing samples obtained from Holes U1547B–U1547D and Hole U1548B were reflushed with oxygen-free nitrogen from gas cylinders. Additional microbiology rock samples for anaerobic incubation and cultivation experiments were collected from Holes U1547E and U1548C and processed using oxygen-free nitrogen.
Selection of igneous rocks for microbiological sampling from Holes U1547C–U1547E occurred in near real time during coring. Recovered rocks were visually inspected immediately upon recovery in the core splitting room, and those containing mineral- or sediment-filled veins or injected sediment were photographed and then temporarily placed in N2-flushed, gas-tight, trilaminated foil barrier bags (Lin et al., 2010). Similarly, selected rock samples obtained from cores recovered in Holes U1548A and U1548B were placed in gas-tight, trilaminated, foil barrier bags for gas analysis (see Organic geochemistry) after brief nitrogen flushing of the bags. The core section photographs of these bagged whole-round rock sections taken in the core splitting room prior to storage were reviewed after completion of their respective holes, and a subset of these rocks were sampled in an anaerobic chamber to cover the range of fluid-rock interactions observed in Holes U1547C–U1547E, U1548A, and U1548B.
11.2. Microbial cell detection and enumeration
11.2.1. Microbial cell counts
Cell abundance was determined by direct counting with an epifluorescence microscope. For shipboard analysis of sediment, samples (1 cm3) were aseptically taken from Hole U1547B, U1547C, and U1548B sections using tip-cut syringes (or shaved rock material from the interior of rock samples), and selected samples from Holes U1547B (Sections 1H-1, 1H-4, 2H-4, 3H-3, 4H-4, 5H-3, 6H-4, 8H-3, 9H-3, 10H-3, 12F-3, 14F-3, 18F-3, 19F-4, 25F-2, and 28F-2) and U1548B (Sections 1H-1, 1H-4, 2H-4, 3H-3, 4H-6, 5H-6, 7H-3, and 9H-3) were processed using the noncell extraction method described in Microbiology in the Expedition 385 methods chapter (Teske et al., 2021a). Cell abundance was 1.0 × 10⁹ cells/cm3 in seafloor sediment within the perimeter of Ringvent (Site U1547) and 5.4 × 10⁸ cells/cm3 at the outside edge of the circular Ringvent structure (Holes U1548A–U1548C). Below the seafloor, cell abundance was observed to gradually decrease to 1.4 × 10⁶ cells/cm3 at approximately 66 mbsf at Site U1547 and 1.3 × 10⁶ cells/cm3 at approximately 57.5 mbsf in Holes U1548A–U1548C (Figure F55). Cell abundance returned to values within the detection range (>8.0 × 10⁵ cells/cm3) at 168.9 mbsf at Site U1547 (Section 385-U1547B-25F-2), but cells were not identified in any deeper sample.
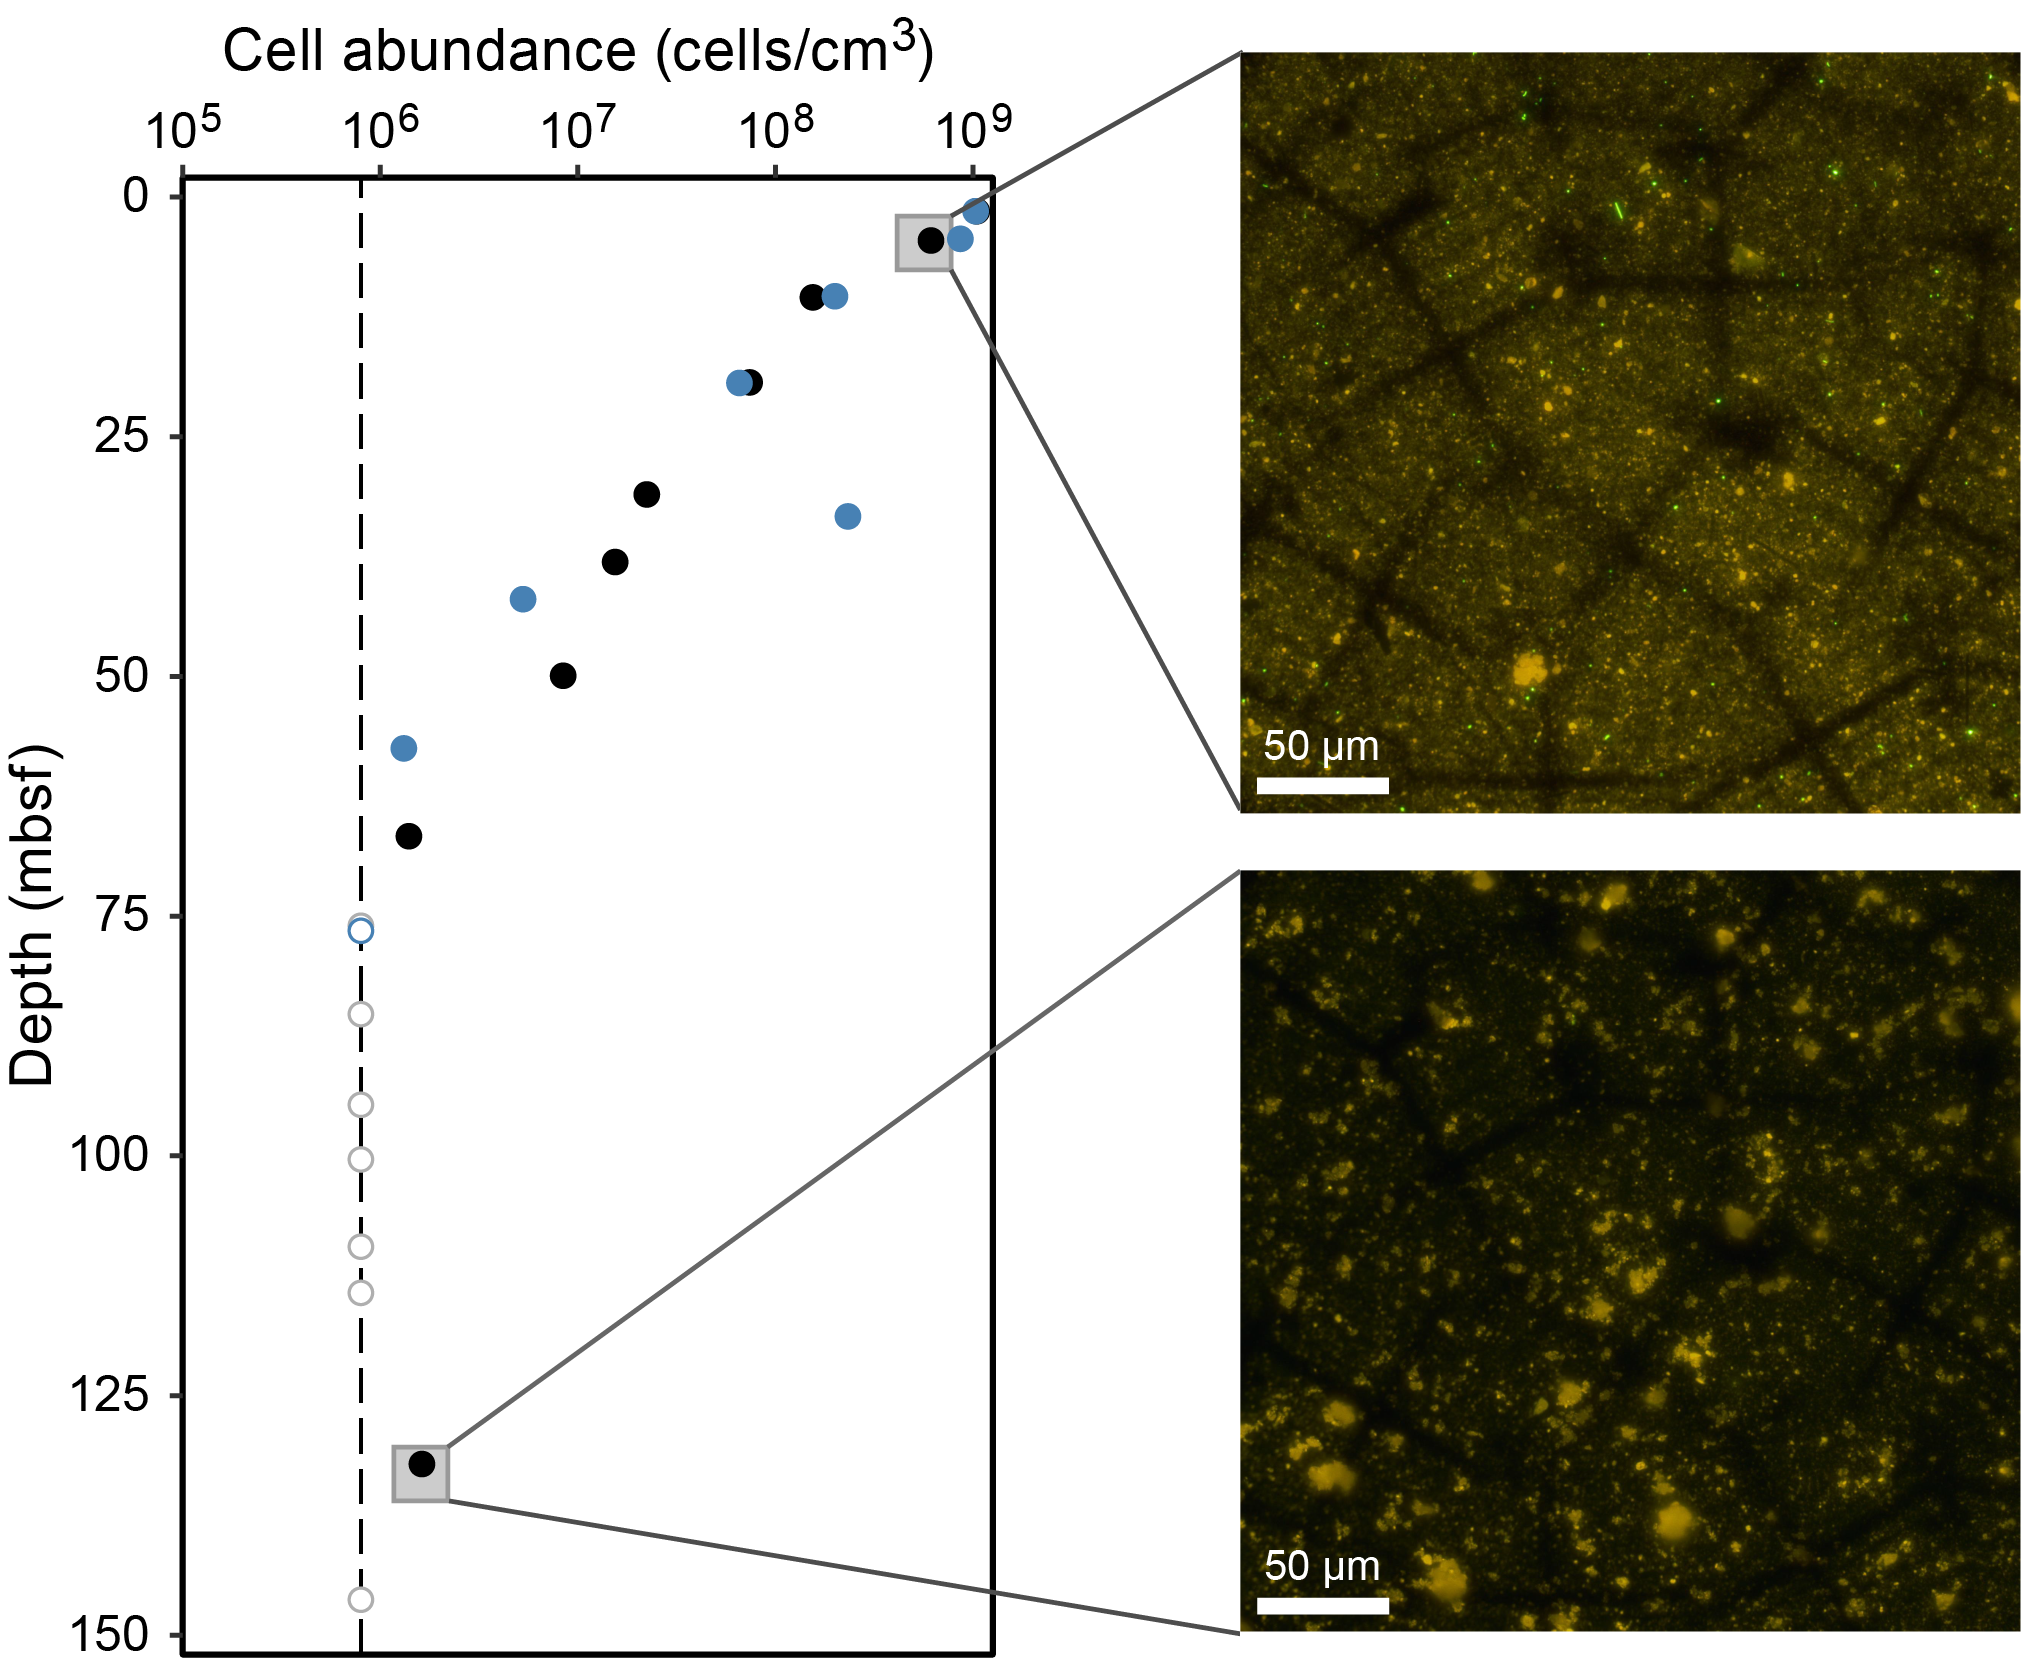
11.2.2. CARD-FISH cell counts of fungi
For catalyzed reporter deposition–fluorescence in situ hybridization (CARD-FISH) cell counts of fungi, ~10 cm3 sediment samples (Sections 385-U1547B-1H-2, 2H-2, 3H-2, 5H-2, 8H-2, 9H-2, and 12F-2 and 385-U1548B-1H-1, 2H-3, 3H-4, 4H-7, 5H-5, 7H-3, and 8H-5) were fixed, washed, and stored as outlined in Microbiology in the Expedition 385 methods chapter (Teske et al., 2021a).
11.2.3. Visualization of fungal cells
For visualizing the 3-D positioning of fungal filaments and yeasts using antibodies to chitin, 10–15 cm3 syringe cores of sediment were collected in Holes U1547B (Sections 385-U1547B-1H-2 and 2H-2) and U1548B (385-U1548B-2H-3 and 3H-4) as described in Microbiology in the Expedition 385 methods chapter (Teske et al., 2021a).
11.3. Microbial activity measurements
11.3.1. Single-cell stable isotope analysis
Whole-round samples from Holes U1547B (Sections 1H-3, 3H-3, 8H-3, 14F-2, and 19F-3) and U1548B (Sections 1H-3, 3H-4, 6H-2, 7H-3, and 8H-6) were immediately stored at ~4°C under anaerobic conditions and incubated on board in preparation for shore-based single-cell stable isotope analysis using nanoscale secondary ion mass spectrometry (NanoSIMS) (see Microbiology in the Expedition 385 methods chapter [Teske et al., 2021a]). Additional whole-round core samples taken in various holes at Sites U1547 (Sections 385-U1547B-4H-3, 9H-3, 18F-2, and 29F-3; 385-U1547D-8R-1, 10R-3, 17R-1, and 19R-2; and 385-U1547E-10R-1, 15R-2, 17R-3, and 19R-2) and U1548 (Sections 385-U1548B-2H-3 and 11X-3 and 385-U1548C-1H-3, 2H-4, 3H-6, 4H-7, 5H-4, 6H-4, and 7H-4) were stored anaerobically at ~4°C for potential shore-based incubations.
11.3.2. Stable isotope bioassays of hydrocarbon degradation
A stable isotope probing experiment was initiated with material from Sections 385-U1547B-1H-2 and 8H-2 and 385-U1548B-2H-3 using 13C-labeled phenanthrene. Working within an anaerobic chamber, a sediment sample volume of 50.6 cm3 was mixed with 455.6 mL of anaerobic artificial seawater. This slurry was transferred in 50 mL portions to nine 100 mL Hungate bottles, and 1.14 mL of phenanthrene (0.1 mg/mL) was added to each bottle. After the headspace was filled with Biomix gas (5% H2:70% N2:25% CO2), the bottles were incubated at room temperature. At timepoint zero (T0) and after 5, 12, and 24 days, half the volume of each replicate bottle was frozen in a 50 mL Falcon tube at −80°C for lipid analyses and the other half was frozen in a second 50 mL Falcon tube at −80°C for RNA extraction in a shore-based laboratory.
11.3.3. Methanogenesis and anaerobic oxidation of methane
Whole-round samples were collected to determine the rates of methanogenesis and anaerobic oxidation of methane from Hole U1547B (Sections 1H-2, 5H-2, 7H-3, 16F-2, 19F-3, 25F-2, and 28F-2). As a comparison, rate samples were taken from Hole U1548B (Sections 1H-1, 4H-1, 5H-1, 7H-1, and 9H-1). After sample collection, ~5 mL volumes of sediment were transferred to modified Hungate tubes in an anaerobic chamber in the microbiology cold room, and triplicate live samples and one killed control were collected for each substrate. In the radiation van, 14C-labeled methane, bicarbonate, acetate, formate, methanol, and methylamine were injected into samples, which were then incubated at different temperatures (20°, 30°, 40°, 50°, and 70°C) for 2 weeks. Before the injection of tracers, control samples were killed by adding 4 mL 2 M NaOH. After incubation, microbial activity for live samples was terminated in the same manner as the killed controls. Fixed samples were stored at room temperature and shipped to shore for further processing.
11.3.4. Sulfate reduction activity
Immediately after core retrieval, 10 cm long whole-round samples were cut from a core section and stored at ~4°C under anaerobic conditions. Sampling depths for Hole U1547B were selected based on the temperature (20°, 30°, 40°, 50°, and 70°C) and geochemical gradients (sulfate–methane transition). Additional samples were collected from the first 20 m of penetration, the mesophilic–thermophilic transition (40°–50°C), and the SMTZ; a total of 12 whole-round cores were sampled in Hole U1547B (Sections 1H-3, 2H-3, 3H-3, 6H-3, 8H-2, 9H-2, 10H-2, 12F-2, 16F-2, 18F-2, 19F-2, and 29F-2; all samples are likely to be compromised by oxygen contamination due to a leak in the shipboard nitrogen gas line). A similar sampling plan was chosen for Hole U1548C, and a total of seven samples were taken according to the temperature increments and the transition of the estimated SMTZ (Sections 1H-2, 2H-3, 3H-5, 4H-7, 5H-3, 6H-3, and 7H-4). All whole-round samples were chopped into small pieces with a sterile ceramic knife in an anaerobic chamber. Approximately 5 cm3 of sediment and 5 mL of sulfate reducer medium (5 mM SO42−; 5 mM HCO3−) (see Microbiology in the Expedition 385 methods chapter [Teske et al., 2021a]) were added to a 20 mL headspace vial and tightly closed with nontoxic blue chlorobutyl rubber stoppers and aluminum crimp caps. Additionally, Sections 385-U1547D-8R-1, 10R-3, 17R-1, and 19R-2, which contain vesicular and veined basaltic rock, were sampled by the entire microbiology team in coordination. Samples from Sections 15R-1 and 21R-1 were processed for high-temperature incubations. After intermediate storage in nitrogen-flushed, gas-tight, trilaminated foil barrier bags, all igneous rock samples outlined above were transferred to an anaerobic glove box and crushed with a sterile chisel and mortar before further processing. To avoid potential contamination, the outermost 0.5 cm of each core was carefully removed by first splitting a core segment into puck-like pieces and then chopping the exterior off each puck to retain only the interior rock pieces that were not exposed to drilling fluid. The rock samples were further processed for 35S radiotracer incubations as described in Methanogenic and sulfate-reducing microbial enrichments and DNA preservation for metagenomic analyses.
Injection of the 35S tracer and incubations were carried out in the dedicated radiation van. Incubation temperatures of 20°, 30°, 40°, 50°, and 70°C were chosen to reflect the approximate in situ temperature gradient of Site U1547 and to capture the transition between meso- and thermophiles. Incubations were terminated after 10 days by adding 15 mL (see Microbiology in the Expedition 385 methods chapter [Teske et al., 2021a]) of 20% (mass/V) zinc acetate solution, and the fixed samples were sent to shore for further analysis. All remaining whole-round samples taken for the purpose of sulfate-reduction activity measurements were also sent to shore for postexpedition processing.
11.4. Bioorthogonal noncanonical amino acid tagging analyses
A bioorthogonal noncanonical amino acid tagging (BONCAT) incubation study was set up using sediment material from Sections 385-U1547B-8H-2 and 385-U1548B-2H-3 according to the protocol described in Microbiology in the Expedition 385 methods chapter (Teske et al., 2021a).
11.5. Cultivation experiments
11.5.1. Cultivation of mesophilic, thermophilic, and hyperthermophilic methanogenic subsurface microorganisms
Sediment samples from Hole U1547B (Table T36) were selected according to in situ temperature ranges for analyses of potential mesophilic, thermophilic, and hyperthermophilic methanogenic populations. Sediment slurries were prepared as described in Microbiology in the Expedition 385 methods chapter (Teske et al., 2021a), used as inoculum, and supplemented with one of the selected carbon substrates.
11.5.2. Methanogenic and sulfate-reducing microbial enrichments and DNA preservation for metagenomic analyses
To investigate how methanogenic and sulfate-reducing microbial community composition may vary with local geochemistry, enrichments of methanogens and sulfate-reducing microorganisms were prepared, in triplicate, from the center of two whole-round cores (Sections 385-U1547B-4H-4 [28 mbsf] and 9H-2 [75 mbsf]) as described in Microbiology in the Expedition 385 methods chapter (Teske et al., 2021a). Enrichments from 28 mbsf were incubated at 30°C, and those from 75 mbsf were incubated at 50°C; these temperatures were similar to measured in situ downhole conditions (see Petrophysics).
Subsamples for shore-based DNA extraction were taken from all whole-round cores collected in Hole U1547B (Sections 3H-2, 4H-4, 6H-3, 9H-2, 16F-2, and 19F-2) and Hole U1548C (Sections 2H-3, 4H-7, and 6H-3) as described in Microbiology in the Expedition 385 methods chapter (Teske et al., 2021a). Enrichments were also set up with samples obtained from Sections 385-U1547D-8R-1 and 17R-1 for sulfate-reducing microorganisms and methanogenic archaea. These sections consist of vesicular and vein-bearing basaltic sill material, respectively. The basaltic rock fragments were chiseled into small millimeter-long pieces and in some cases ground to a powder using sterile tools in an anaerobic chamber. Slurry was created and enriched at 80°C as outlined in Microbiology in the Expedition 385 methods chapter (Teske et al., 2021a).
11.5.3. Cultivation experiments for fungi
For samples collected for fungal studies from Sites U1547 (Sections 385-U1547B-1H-2, 2H-2, 3H-2, 5H-2, 8H-2, 9H-2, 10H-2, 12F-2, 18F-3, 19F-3, and 21F-2 and 385-U1547E-10R-1, 15R-2, 17R-3, and 19R-2) and U1548 (Sections 385-U1548C-1H-2, 2H-2, 5H-3, 7H-5, and 7H-6), two enrichment cultures were initiated by placing 5 mL of sediment each into of two 30 mL Hungate bottles with 15 mL of filtered bottom water, flushing and filling with Biomix gas, and capping and storing at ~4°C. Additional live sediment overlaid with filtered bottom water was stored anaerobically in 250 mL glass bottles filled with Biomix gas and stored at ~4°C. These samples will be used for fungal enrichment experiments in a shore-based laboratory.
12. Petrophysics
Physical properties data for Sites U1547 and U1548 are reported here, starting from the most distal holes to the center of the Ringvent structure (U1548D, U1548E, U1548A, U1548B, U1548C, U1547E, U1547D, U1547A, U1547C, and U1547B). Site U1548 can be regarded as a reference for Site U1547, where igneous bodies were identified in 2-D seismic images (Teske et al., 2018). Physical properties measured on whole-round and split core sections from Holes U1547A–U1547E and U1548A–U1548E were compared with each other and with downhole logging measurements from Hole U1547B for lithostratigraphic characterization and correlation between core description, logging data, and preexpedition seismic survey profiles. At Sites U1547 and U1548, a total of 31 in situ formation temperature measurements were taken with the APCT-3 and SET2 tools. The resulting geothermal gradients, ranging from ~511°C/km to ~960°C/km, were used along with thermal conductivity measurements to calculate a heat flow that varies between ~520 and ~930 mW/m2 depending on proximity to the Ringvent mound. Conductivity measurements at Site U1548 show values in the sediment layers similar to those at Site U1547. Sites U1548 and U1547 show similar profiles for density, porosity, strength, NGR, MS, and P-wave velocity in the upper 90 m of sediment. Petrophysical variations highlight the main lithostratigraphic changes at Site U1548 through correlated variations in density and NGR values. Mafic sill material recovered from Site U1547 suggests stacked, thick intrusions, and no bottom contact was encountered.
12.1. Data acquisition
Physical properties of recovered cores were measured on whole-round and working- and archive-half sections in the core laboratory for all holes at Sites U1547 and U1548 (U1548A–U1548E and U1547A–U1547E) (see Tables T17 and T18 in the Expedition 385 methods chapter [Teske et al., 2021a]). Measurements from Site U1548 are used as a reference for Site U1547, where one or more underlying sills are thought to host a still-active seafloor hydrothermal system (Teske et al., 2018).
Downhole logging of Hole U1547B was done using a modified triple combo tool. The MSS was removed from the standard triple combo configuration to shorten the tool string, enabling more coverage of the hole by the other tools (see Table T18 in the Expedition 385 methods chapter [Teske et al., 2021a]). Logging operations were terminated prematurely after Hole U1547B showed signs of collapsing, thus preventing the deployment of the FMS-sonic tool string. Logging data were recorded on the downward and upward runs of what became the main pass of the triple combo and the last pass of logging operations at Site U1547B. The maximum depth of this main pass is 169 mbsf, and upward-pass recording started at ~166 mbsf (Table T37). We report here only data recorded from the upward pass of the triple combo tool string. This configuration had the EDTC sitting just above the HNGS. The EDTC contains a gamma ray source, and it is possible for the host formation to emit radiation introduced by that source on the second, upward passage of the tool string. However, both tool string passes show similar gamma ray trends, and we therefore report data from the upward HNGS pass, which is the longest and also the most reliable. Table T37 summarizes the logging operations, and Table T38 summarizes the reported measurements and reasons for not reporting other measurements.
12.2. Downhole temperature and thermal conductivity
12.2.1. Downhole temperature
A total of 31 in situ formation temperature measurements were made at Sites U1547 and U1548 using the APCT-3 and SET2 tools (see Petrophysics in the Expedition 385 methods chapter [Teske et al., 2021a]). Measured temperature values in Hole U1547A range from 25.65°C at 24.3 mbsf (Core 4H) to 74.21°C at 124.2 mbsf (Core 24F) (Table T39). Values in Hole U1547B range from 40.97°C at 53.7 mbsf (Core 6H) to 79.72°C at 140.5 mbsf (Core 27F). In Hole U1548A, temperatures range from 26.96°C at 30.4 mbsf (Core 4H) to 62.86°C at 87.4 mbsf (Core 10H). In Hole U1548B, they range from 33.88°C at 34.4 m (Core 4H) to 64.34°C at 73.4 mbsf (Core 9H), and in Hole U1548C, they range from 48.45°C at 36.1 mbsf (Core 4H) to 77.25°C at 64.6 mbsf (Core 8X). These values indicate that temperatures increase with depth along a linear geothermal gradient of 529°C/km for Site U1547 (Figure F56A). At Site U1548, temperature measurements indicate distinct geothermal gradients for each of the Holes U1548A–U1548C and a fourth gradient for Holes U1548D and U1548E. Geothermal gradients for Holes U1548A, U1548B, and U1548C are 646°C/km, 804°C/km, and 958°C/km, respectively (Figure F56D). The slope of the linear fits between thermal resistance and formation temperature (Figure F56C, F56F) indicates a heat flow of 425 mW/m2 at Site U1547, 516 mW/m2 in Hole U1548A, and 646 mW/m2 in Hole U1548B. For Hole U1548C, the average thermal conductivity of the cored lithology column is 0.8 W/(m·K). This conductivity multiplied with the thermal gradient gives a heat flow of 766 mW/m2. Holes U1548D and U1548E show temperature values that range from 12.21°C at 34.8 m (Core 385-U1548D-4H) to 31.27°C at 105.8 mbsf (Core 12H) and from 12.66°C at 34.2 m (Core 385-U1548E-4H) to 28.78°C at 91.2 mbsf (Core 10H). These values indicate that temperature increases with depth along a linear geothermal gradient of 271°C/km (Figure F56D). The slope of the linear fit between thermal resistance and formation temperature indicates a heat flow of 232 mW/m2 for Holes U1548D and U1548E (Figure F56F).
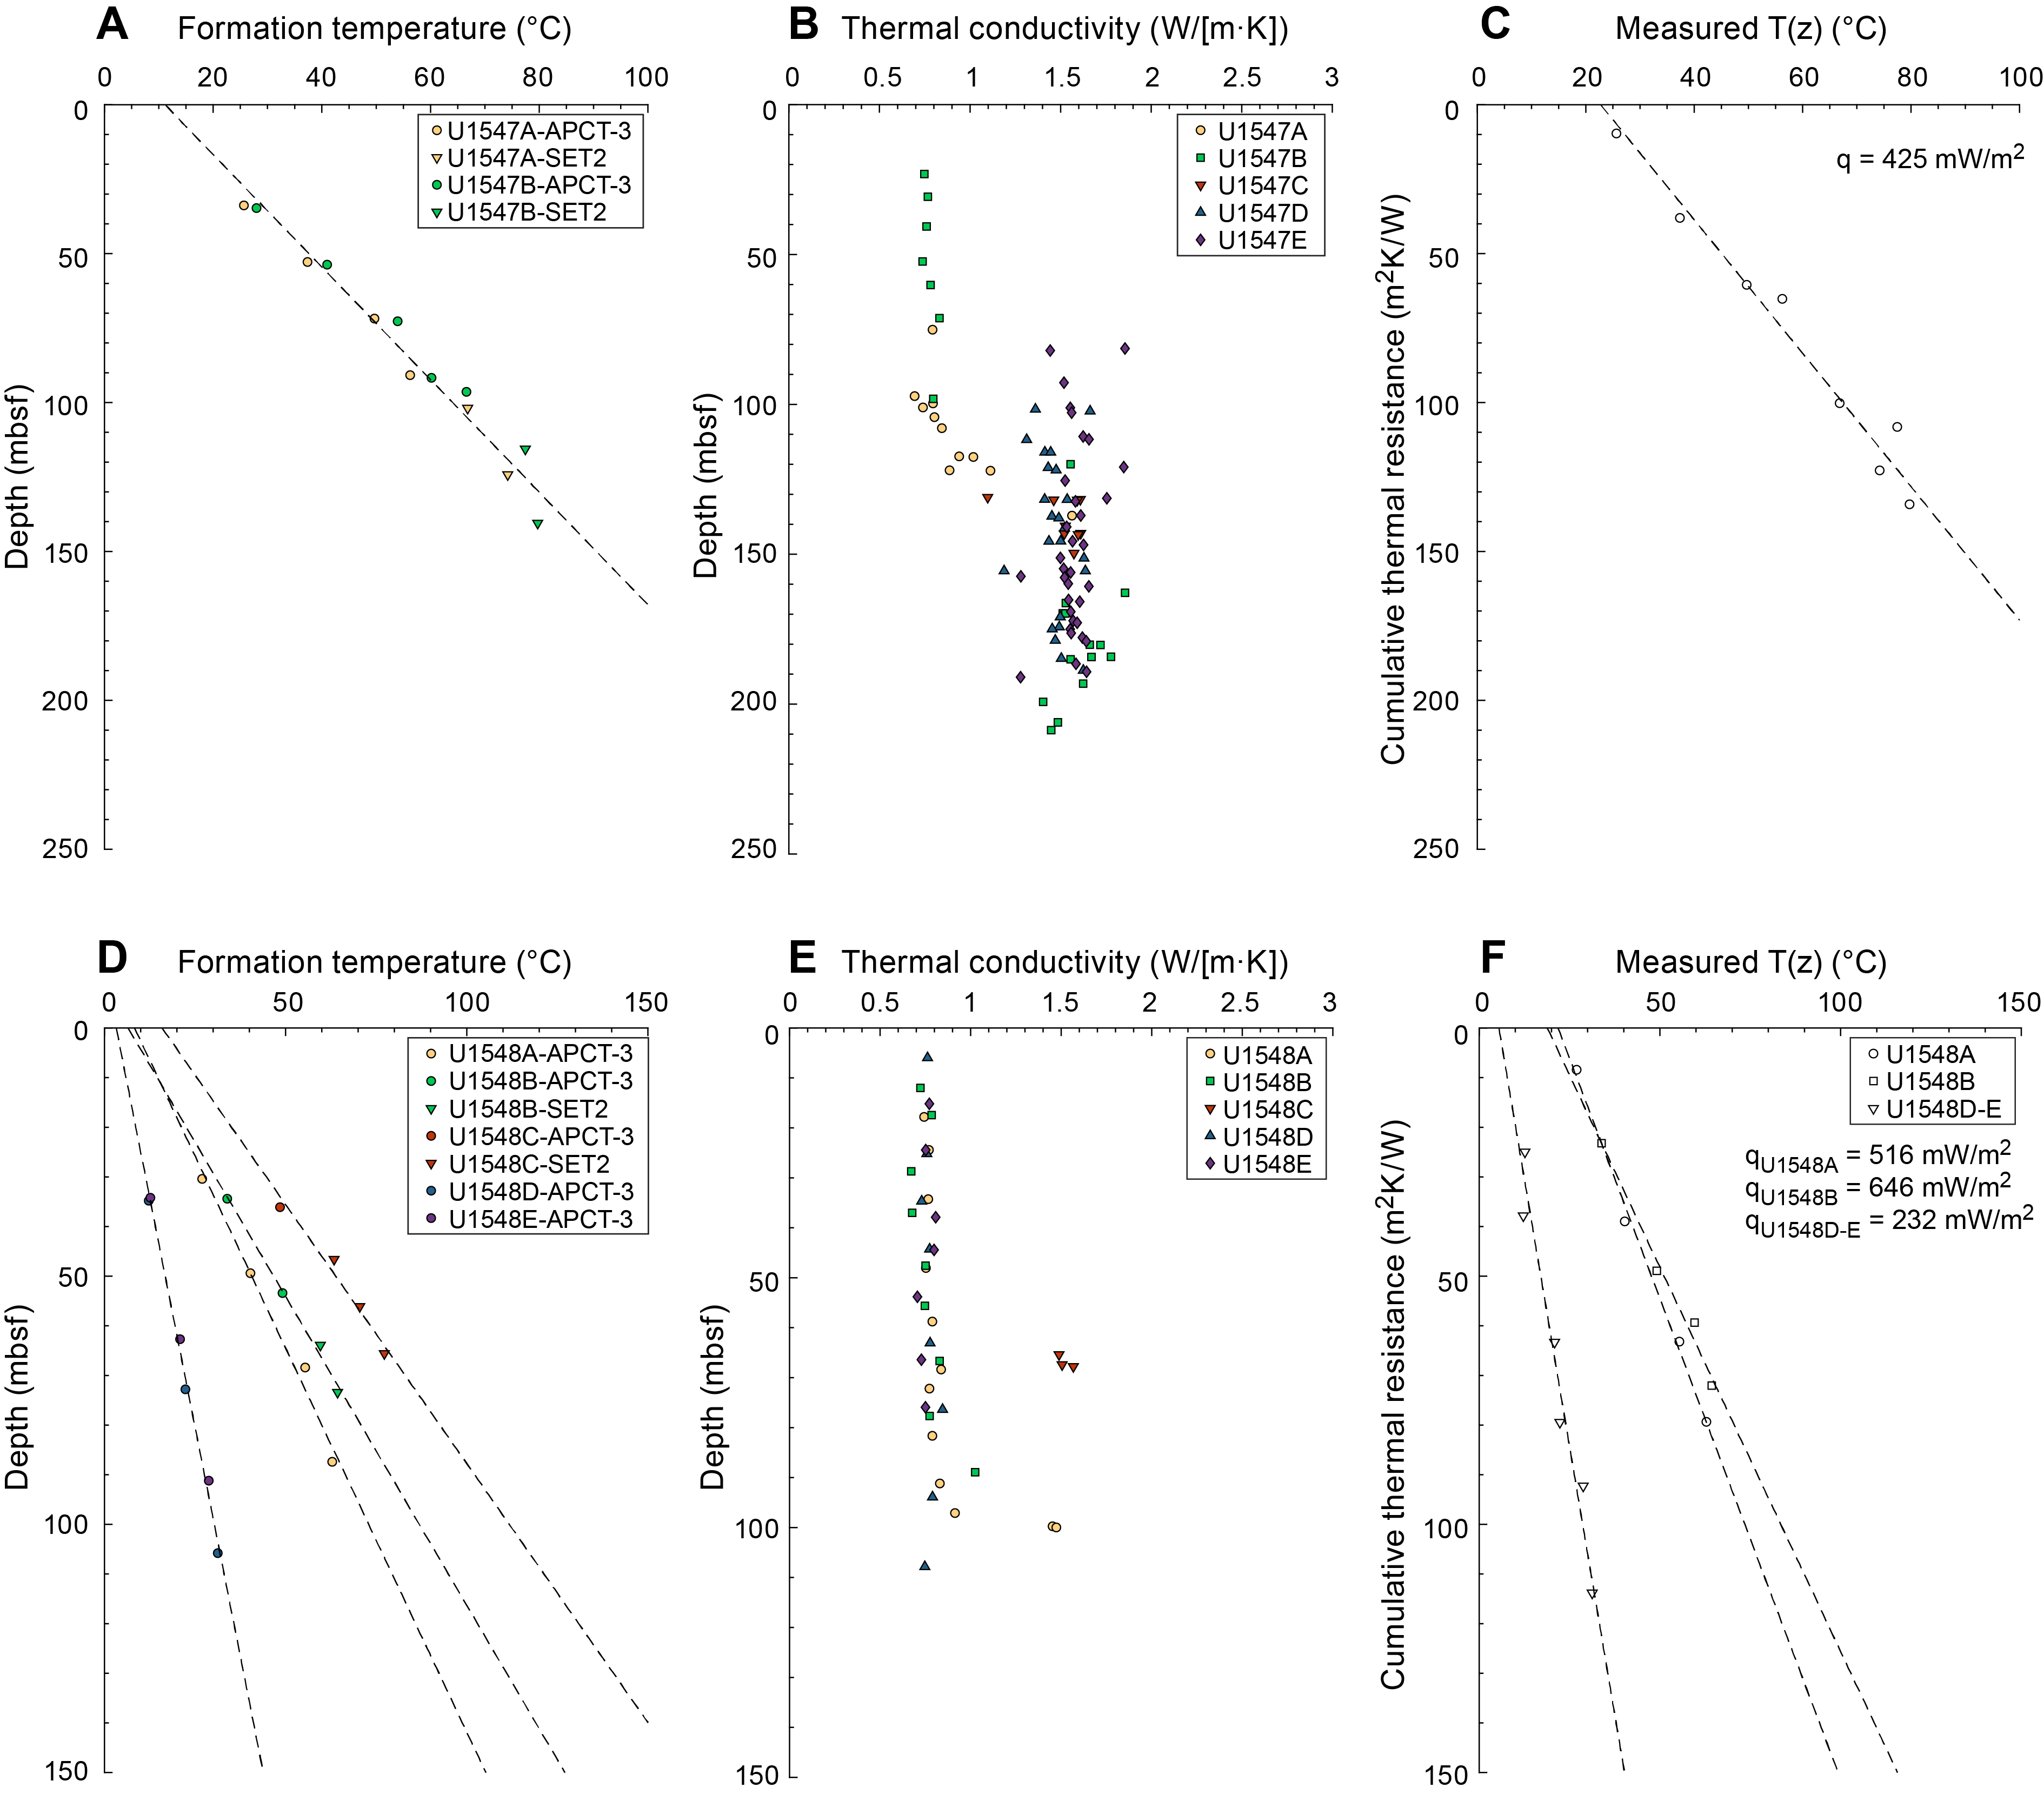
12.2.2. Thermal conductivity
Thermal conductivity varies between ~0.69 and ~1.11 W/(m·K) in sediments from Holes U1547A and U1547B; this transition marks the sediment/sill boundary at ~130 mbsf in Hole U1547A and ~120 mbsf in Hole U1547B (Figure F56B) (see Lithostratigraphy). An increase to a maximum value of 1.86 W/(m·K) was observed below these depths. Hard rock conductivity measurements were made on the igneous sill samples from Holes U1547A–U1547E, yielding a mean thermal conductivity of 1.57 ± 0.11 W/(m·K) (Figure F56B), which falls within the range of the mean reported values for basalts (effusive rocks: 1.5 W/(m·K); PetroMod-database Hantschel and Kauerauf [2009]; see for complement Čermák and Rybach, 1982) and significantly lower than reported mean values for dolerites (intrusive rocks: 2.3 W/[m·K]; PetroMod-database Hantschel and Kauerauf [2009]; see for complement Čermák and Rybach, 1982). Conductivity measurements for Holes U1548A–U1548C show a trend similar to that of sediment values from Site U1547 (Figure F56B, F56E). In addition, three hard rock measurements from Hole U1548C result in a mean conductivity of 1.52 ± 0.01 W/(m·K). Conductivity measurements for Hole U1548D vary between ~0.72 and ~0.85 W/(m·K) (Figure F56E). Because of the similarity to Hole U1548D, no conductivity measurements were made in Hole U1548E (see Lithostratigraphy).
12.3. Density (formation/core and grain)
Density measurements of the sediments from Holes U1548A–U1548E, U1547A, and U1547B show comparable results for the uppermost ~100 m (Figures F57A, F58A). Density values for Holes U1548D and U1548E, the most distal holes from the Ringvent structure, remain linear and almost constant from ~1.17 to ~1.24 g/cm3 from the seafloor to 100 mbsf. Small breaks in the slope are observed in some intervals:
- ~16–40 mbsf: density values increase from ~1.2 to ~1.3 g/cm3.
- ~46–80 mbsf: density values increase from ~1.2 to ~1.35 g/cm3.
- ~84 to ~100 mbsf: density values increase from ~1.22 to ~1.32 g/cm3.
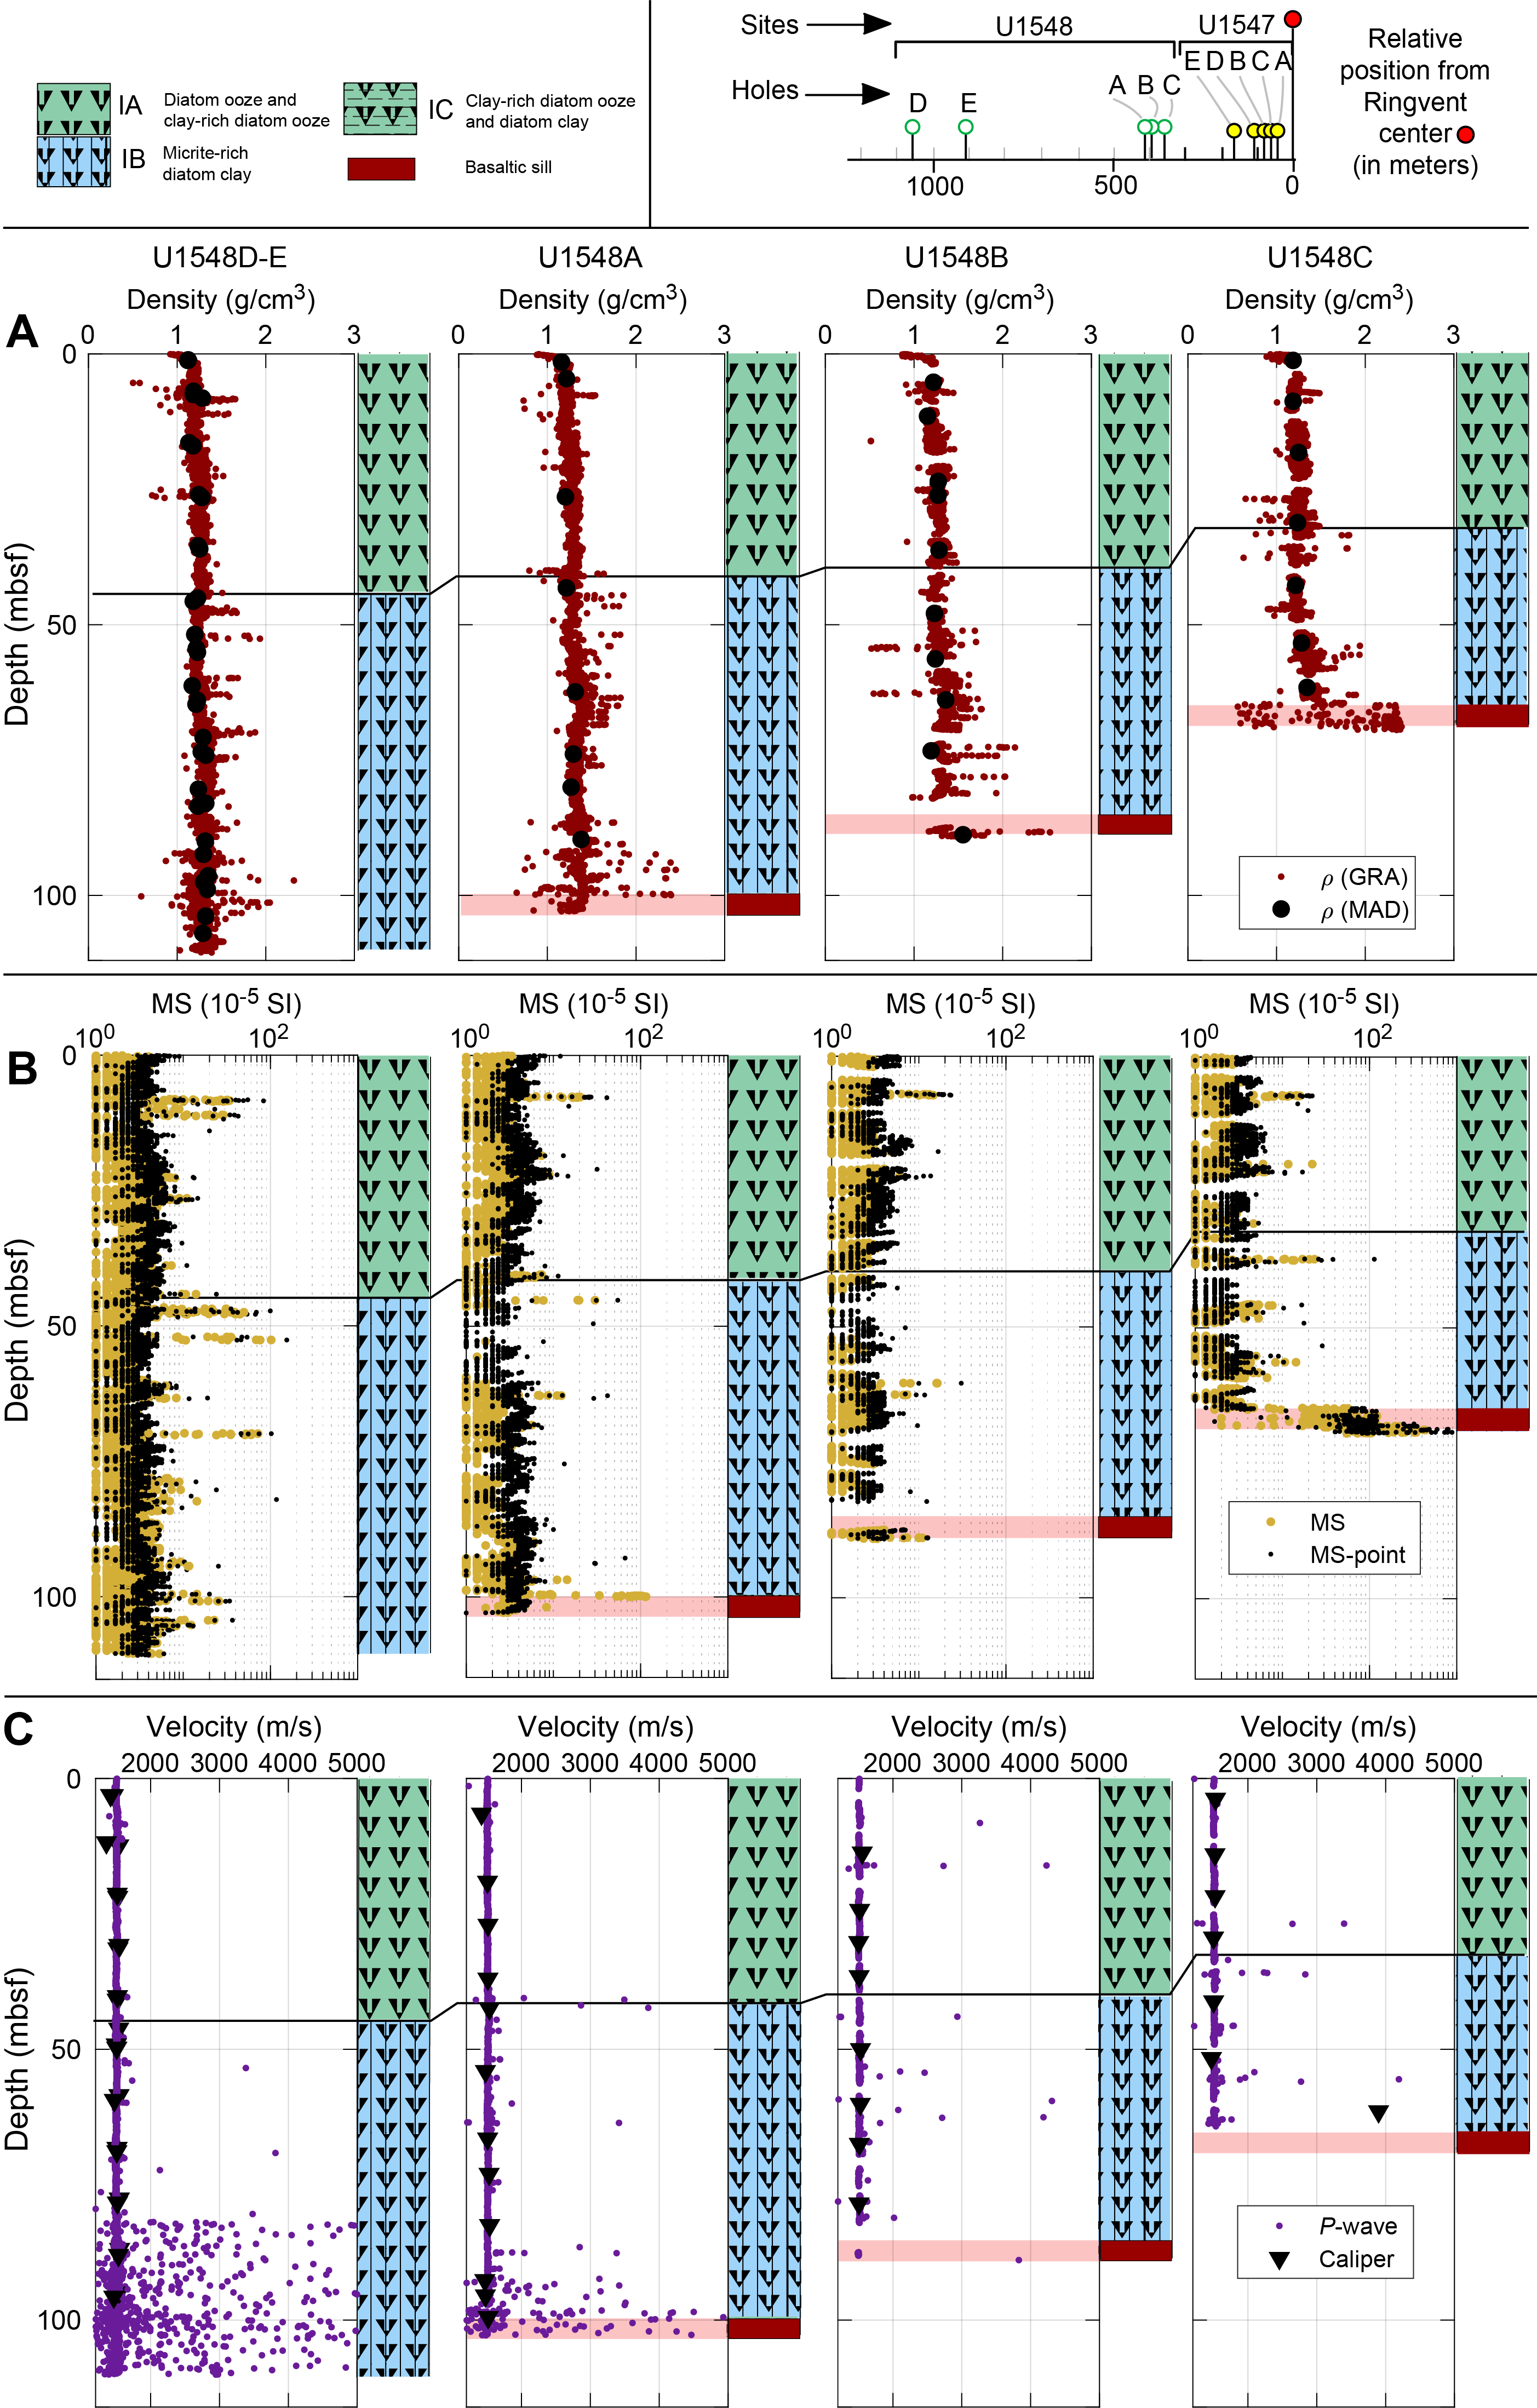
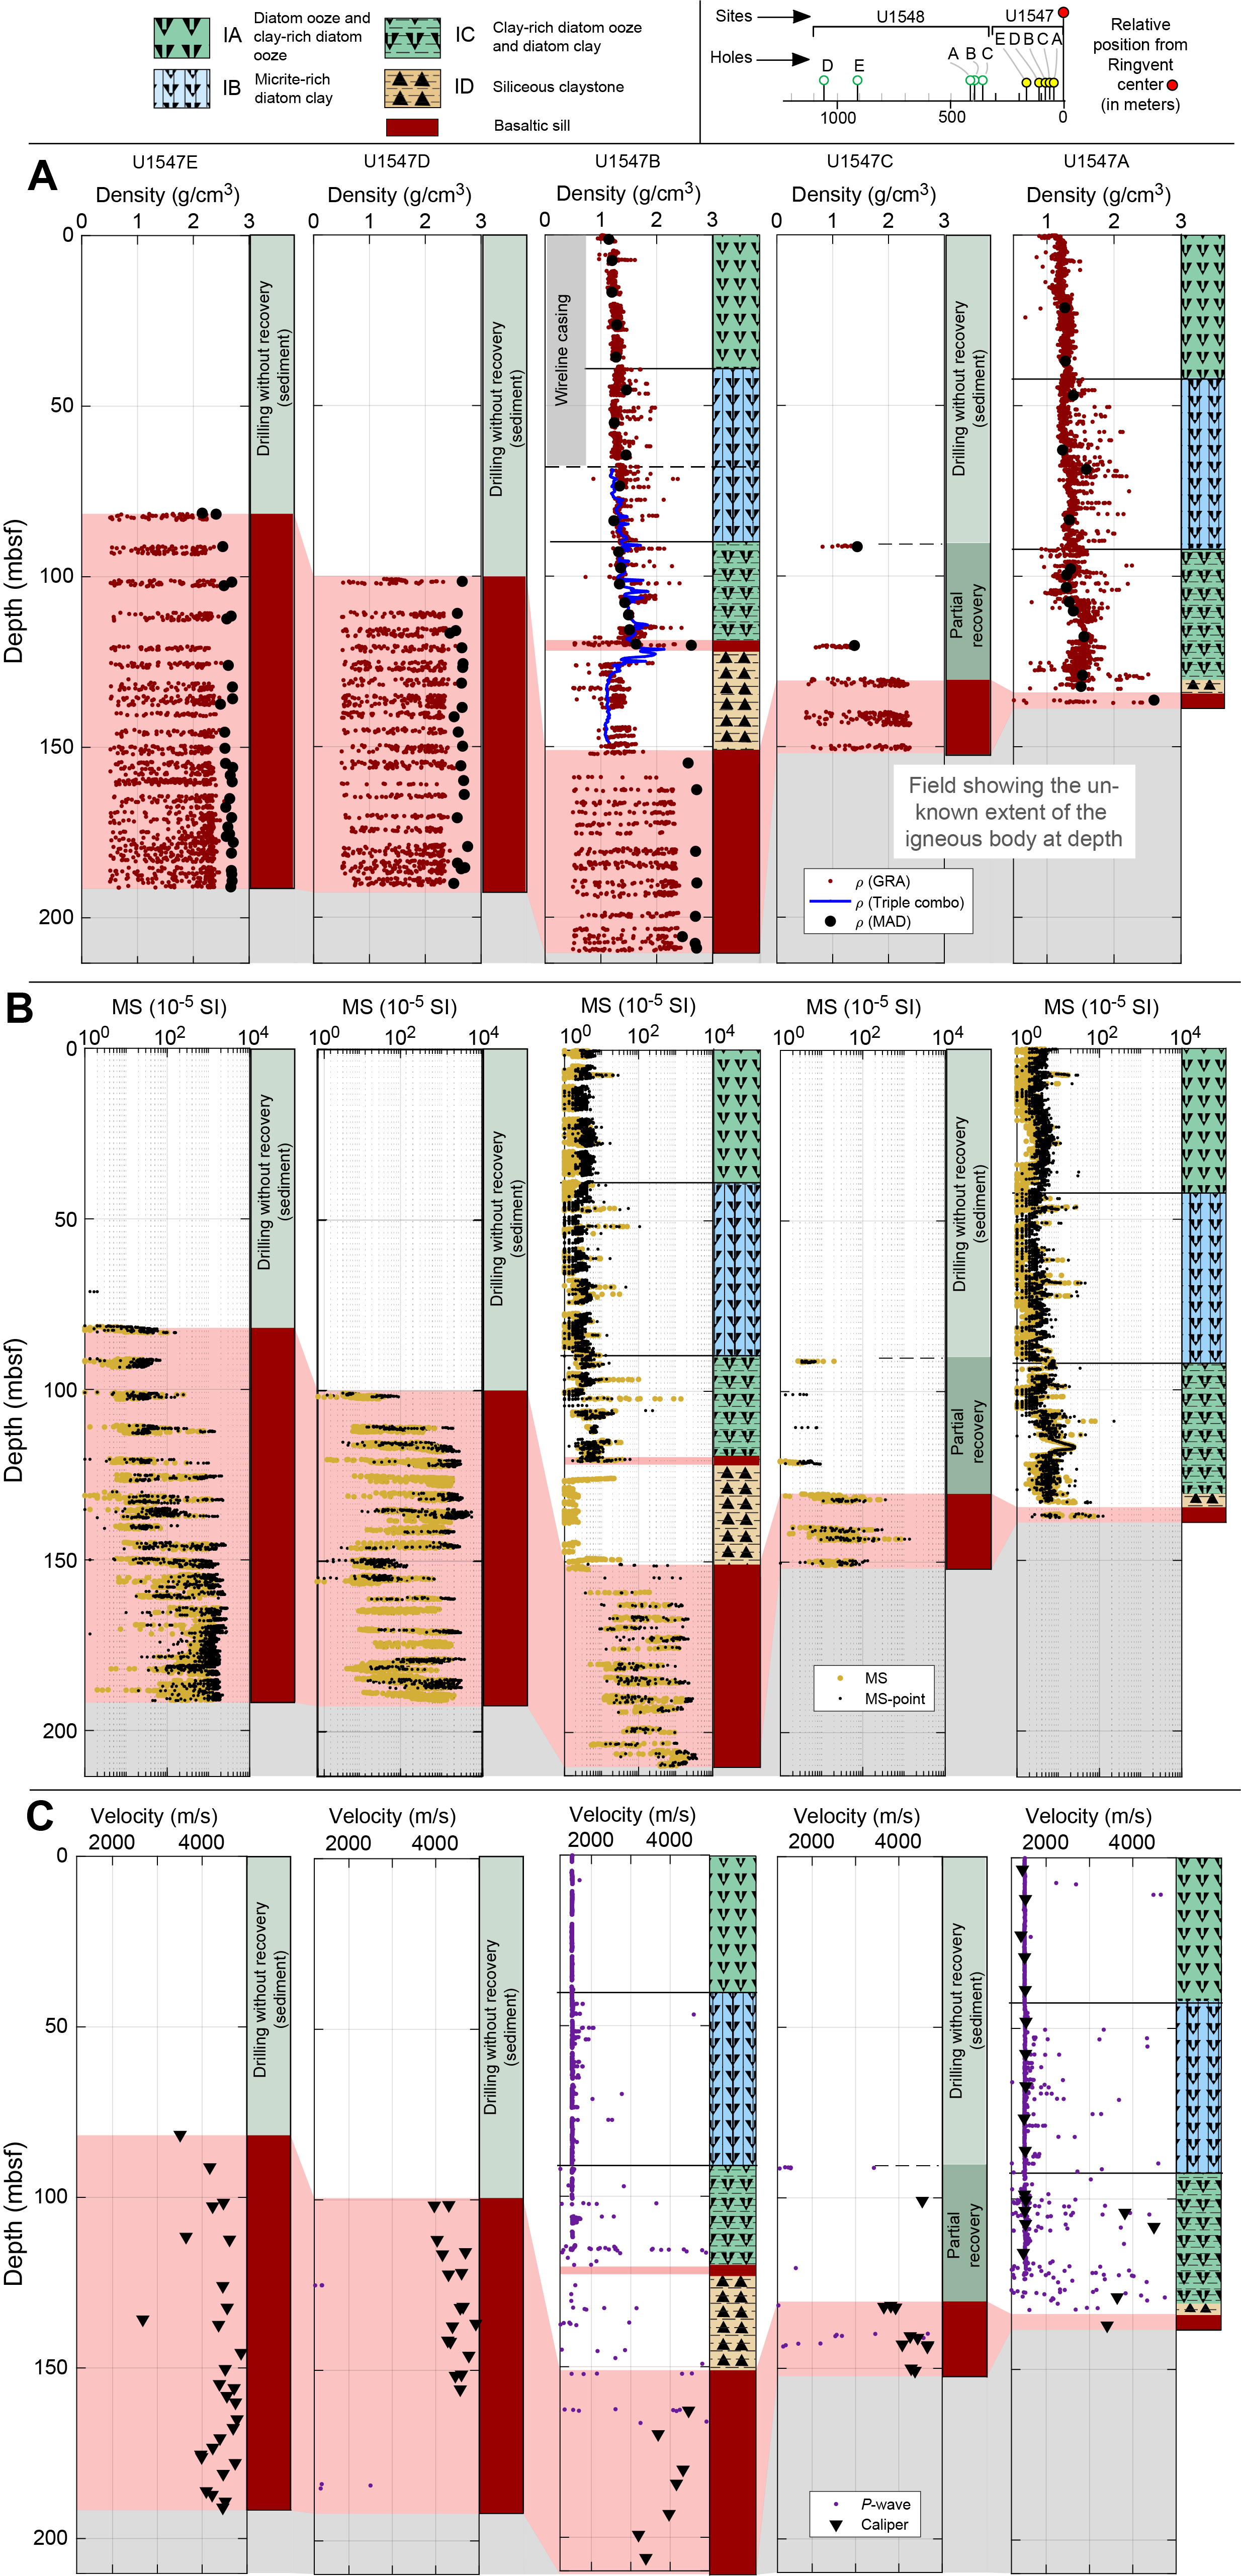
Holes U1548A–U1548C are close to the Ringvent structure. They show slightly greater density values below 60 mbsf and retain the trend defined above. Note that Holes U1548A–U1548C decrease in maximum depth as they approach the Ringvent structure (Figure F57A).
Holes U1547A and U1547B each recovered a thick section of sediments from above the Ringvent sill (more than 120 m) (Figure F58A). Both holes show density variations with depth through the upper sediments that are very similar to variations observed in the sediments outside of Ringvent (Holes U1548A–U1548E) (Figure F57A). Small, almost ~1 m thick cored intervals of sill material were recovered at 132–133 mbsf in Hole U1547A and at 120–121 mbsf in Hole U1547B (Figure F58A). Sediments directly below the sill in Hole U1547B have relatively constant density values of ~1.22 g/cm3 between ~126 and 151 mbsf (Figure F58A). There is a gap in core recovery in Hole U1547B between ~151 and 159 mbsf, but a notable increase in density from ~1.22 to ~1.99 g/cm3 is observed across this depth interval.
All of the igneous rocks recovered at Site U1547 have very similar density values of ~2.44–2.76 g/cm3 (MAD results). In Hole U1547B, a significant decrease in density is observed at 205.7 mbsf (Figure F58A). This decrease corresponds to a transition in igneous texture from moderately vesiculated, massive doleritic to complex commingling of igneous and sediment material suggestive of mixing along fracture pathways (see Igneous petrology and alteration). This interval, Cores 385-U1547B-44X through 46X, also corresponds to a more fine grained, aphyric texture toward the sill portion of the sill/sediment mixture interface, and so the mixed interval may mark a transition between separate sill units. Below this depth, the density of dolerite returns to higher values of 2.71 g/cm3.
12.4. Magnetic susceptibility
MS measured on whole-round sections and section halves show similar trends (see Paleomagnetism). MS values for sediment consistently range from ~0.5 to ~5 SI. Several positive MS anomalies appear to be correlated between sites and holes (Figures F57B, F58B):
- ~7–8 mbsf: an anomaly up to 30 SI is observed in Holes U1548A–U1548E, U1547A, and U1547B.
- ~21–22 mbsf: an anomaly up to 20 SI observed in Hole U1548C is found slightly deeper in Hole U1547B (~27 mbsf).
- A paired anomaly found in Hole U1548 between ~47 and ~45 mbsf is observed at ~47 and ~51.5 mbsf in Holes U1547A and U1547B. An offset of 5–6 m between holes is observed, similar to the offset of a shallower set of anomalies.
- The anomaly at 62.5 mbsf in Holes U1548A, U1548B, U1548D, and U1548E does not match anomalies found at Site U1547. Multiple signals are observed in Holes U1547A–U1547C at ~68.5 and 72.5 mbsf.
Sill intrusions generate large MS signals in every hole in which they are encountered, up to a maximum of 2000 SI. Holes U1547D and U1547E show large variability in measured MS, though with consistently high values (Figure F58B). In Hole U1547D below ~145.6 mbsf, measured MS increases progressively from 13.3 to 1233 SI at ~170.5 mbsf and remains at comparable values to the deepest part of the hole (~190 mbsf). A significant drop in MS is observed between ~179 and ~184.8 mbsf. The MS measured for the sill in Hole U1547C (Figure F58B) is significantly lower than the other large sills found in Holes U1547D and U1547B and has a maximum value of 845 SI at ~143 mbsf.
Finally, a well-defined positive anomaly observed in the Hole U1547A sediments at 115–118.1 mbsf has a maximum MS peak value of 24.3 SI at 117 mbsf. This anomaly is associated with a diatom-rich interval in a clay-rich lithology (see Lithostratigraphy).
12.5. Sonic velocities
P-wave velocities measured with the WRMSL and SHMG caliper show very similar values in the uppermost 100 m of sediments at Sites U1547 and U1548 (~1495–1540 m/s). At both sites, we identified two depth intervals with systematic P-wave velocity variations (Figures F57C, F58C):
- ~0–40 mbsf: P-wave velocities vary around ~1500 m/s (Figures F57C, F58C).
- ~40–80 mbsf: P-wave velocities often show slightly higher values up to 1510–1540 m/s (Figures F57C, F58C). Holes U1548A and U1547A are particularly similar, with an increase in P-wave velocities between ~40 and 45 mbsf from 1510 to 1540 m/s followed by a decrease to 1500 m/s at ~70 mbsf. The same increase and decrease is observed between ~70 and ~80 mbsf.
Values measured between 80 and 110 mbsf in the deepest holes at Site U1548 (U1548D and U1548E) show a depth-increasing scatter in measured P-wave velocity, from ~1450 to >2000 m/s (Figure F57C). This scatter and aberrant values can be attributed to core disruption during recovery (see Petrophysics in the Expedition 385 methods chapter [Teske et al., 2021a]) for detailed explanation). P-wave values measured on the mafic sill material recovered at Site U1547 are consistently high (between ~3840 and 4985 m/s) (Figure F58C).
12.6. Formation natural gamma radiation
Here we compare natural gamma ray radiation (NGR) between Holes U1548A–U1548E (Figure F59A) and U1547A–U1547E (Figure F60A). The NGR of each core is measured in the core laboratory on whole-round sections at a resolution of 10 cm. In addition, downhole logging collected NGR measurements in Hole U1547B with the HNGS tool mounted on the modified triple combo.
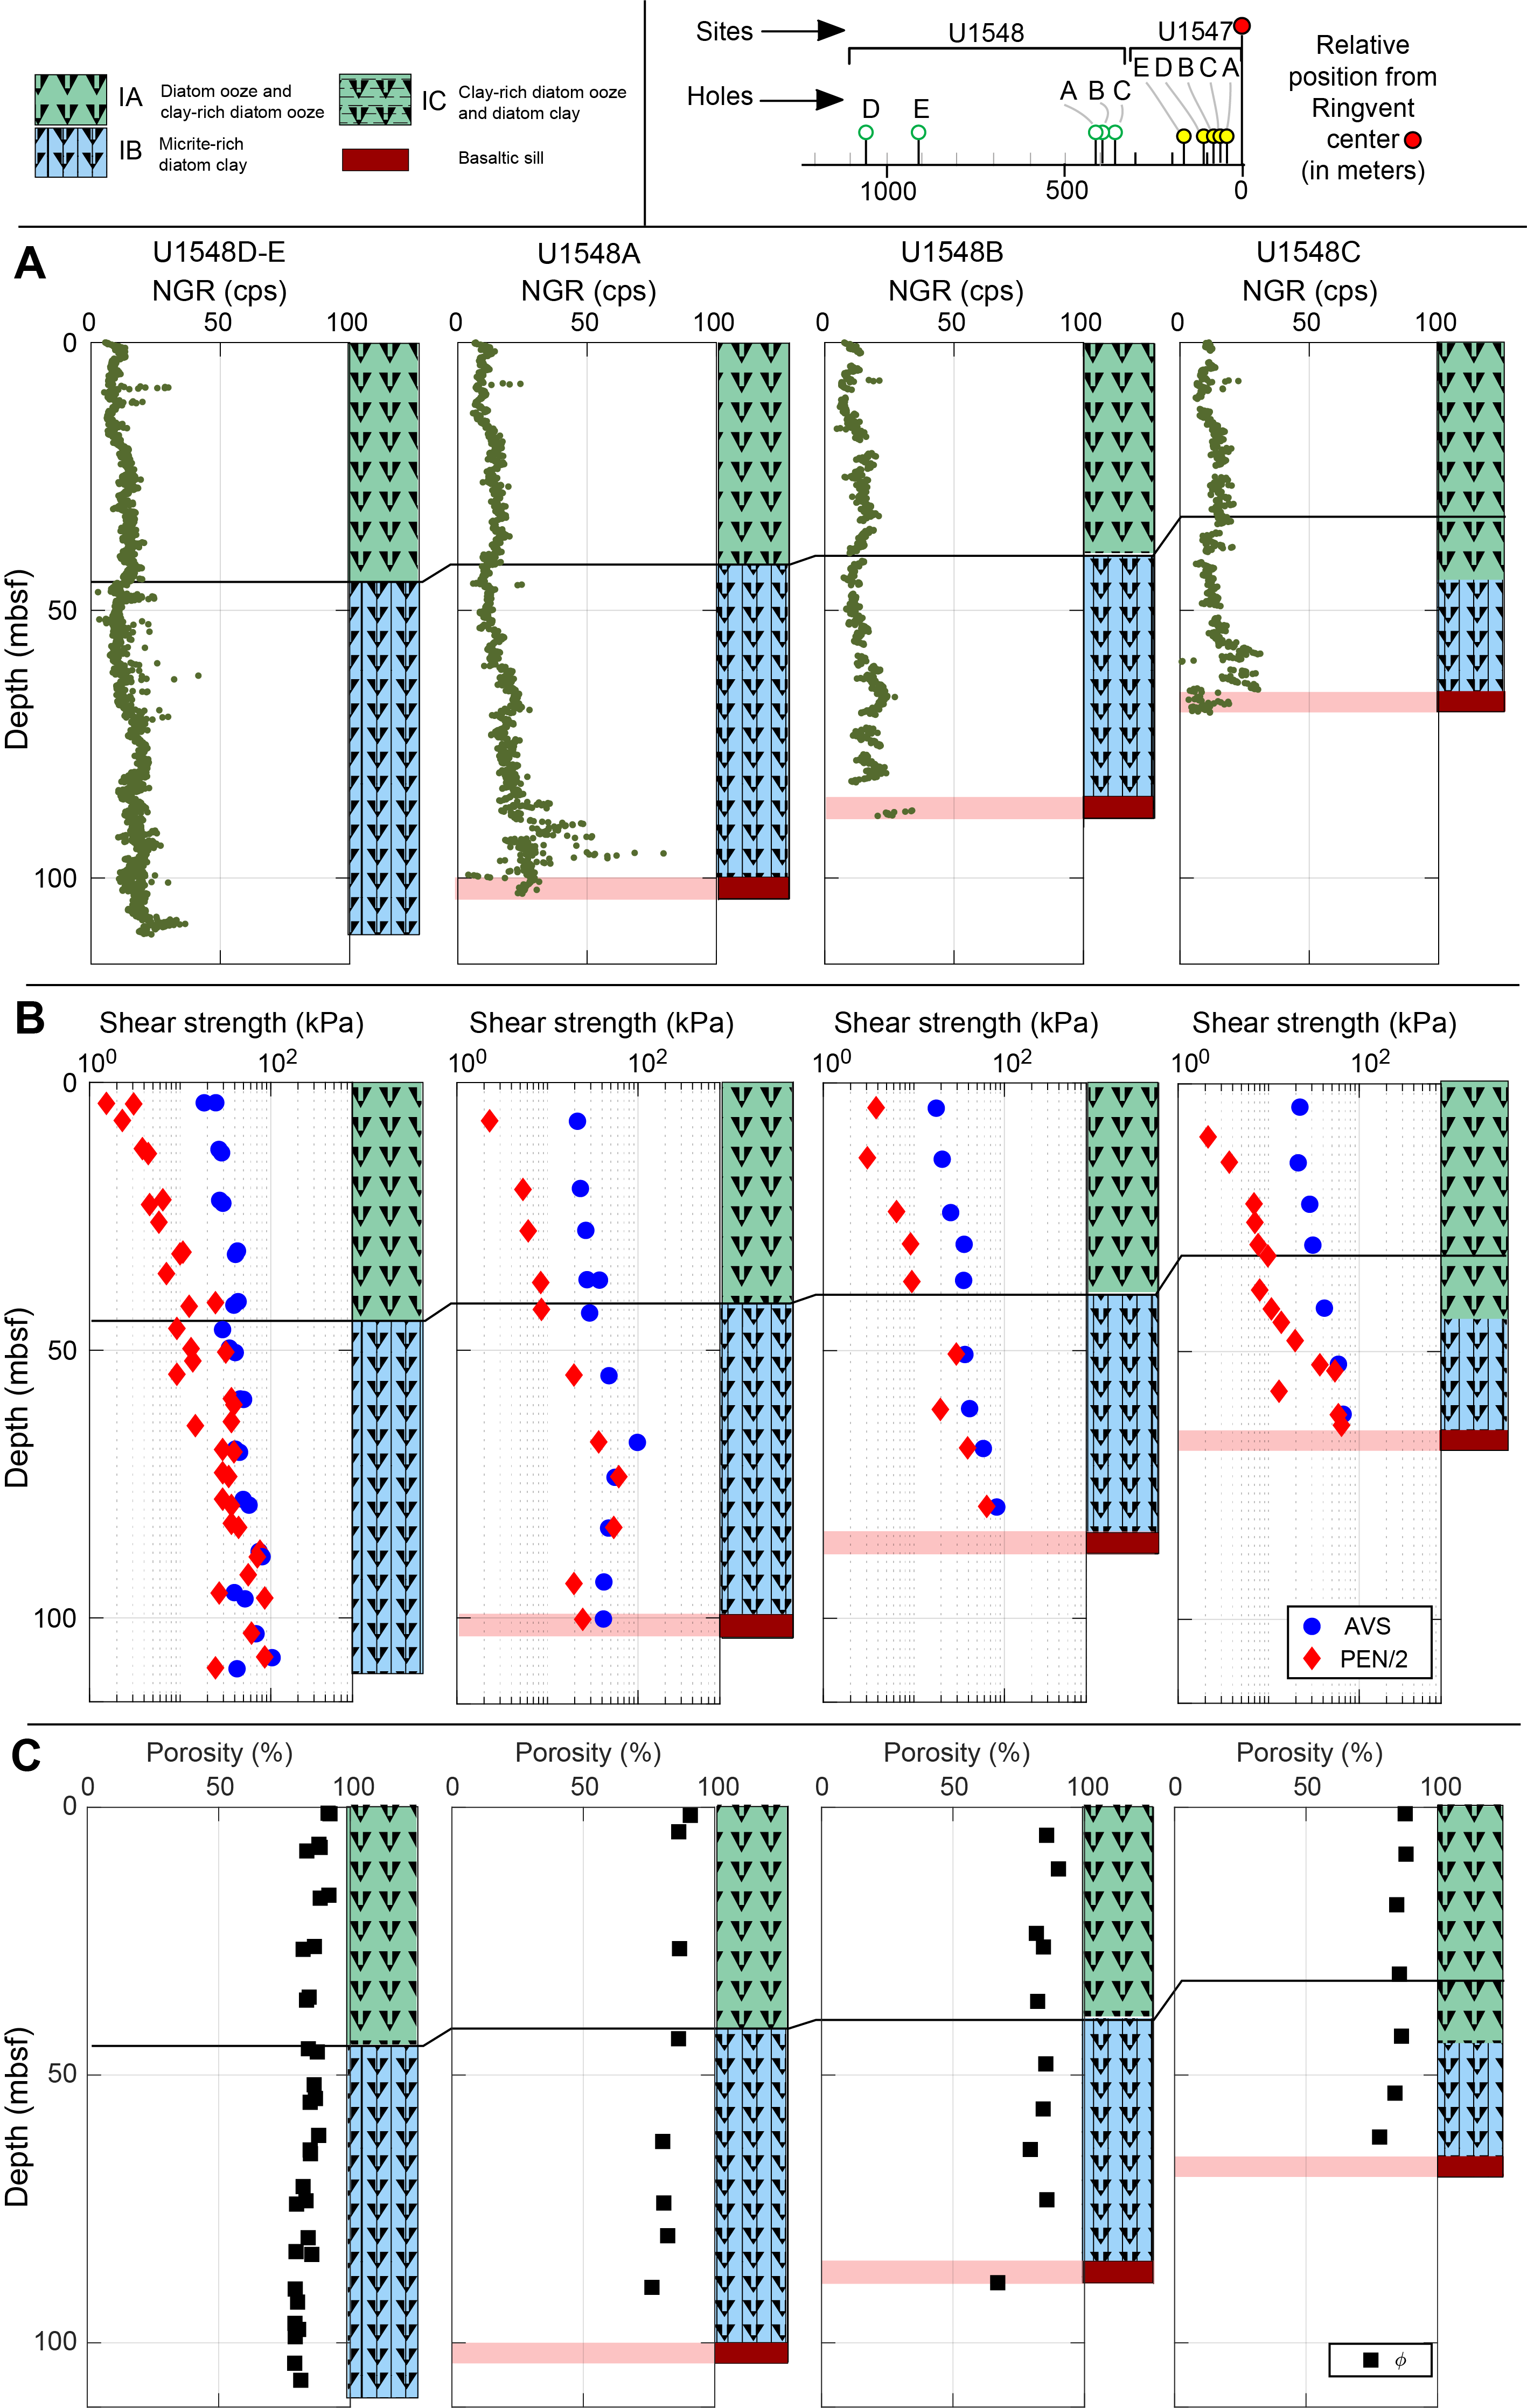

NGR measured on core sections from Holes U1548A–U1548E show consistent trends over common depths in all holes (Figure F59A):
- ~0–12 mbsf: a decreasing trend from ~12.5 to 7.7 counts/s.
- ~12–21 mbsf: an increasing trend from ~7.7 to 17.0 counts/s.
- ~21–50 mbsf: constant NGR values of ~15.5 counts/s.
- ~50–78 mbsf: NGR values increase from ~15.5 to ~78 counts/s (Holes U1548D, U1548E, and U1548A).
- ~80–110 mbsf: NGR values increase from ~13 to 20.7 counts/s.
The detailed variations in the 80–110 mbsf depth interval are identical in Holes U1548D and U1548E.
Large NGR fluctuations toward higher values are observed for Holes U1548A and U1548C in the vicinity (~10 m) of the sill marking the end of each hole (Figure F59A).
A significant decrease in NGR values is observed in sediments near the direct contact of the sills in Holes U1548A and U1548C. NGR values are low, as expected, over the ~4 m interval where sill material was recovered in Hole U1548C (Figure F59A).
Sediments in Holes U1547A and U1547C (Figure F60A) show NGR trends consistent with those described for Site U1548 to ~80 mbsf (Figure F59A). Hole U1547B shows greater NGR variability between ~90 and 120 mbsf with values ranging between 20–60 counts/s. In Hole U1547B, NGR values between ~120 and 150 mbsf vary around ~20 counts/s. In the uppermost 5–6 m of the large sill (155–161 mbsf), NGR values increase to ~50 counts/s. In the last depth interval from ~160 to 209 mbsf, the large sill in Hole U1547B shows very low values (5.2–10.5 counts/s). The depth interval ~70–166 mbsf in Hole U1547B is also covered by downhole measurements, which are consistent with core laboratory NGR measurements. Although values reported in American Petroleum Institute gamma radiation units (gAPI) are slightly higher than the NGR values from 70 to 120 mbsf, both sets of measurements show very close agreement over the 120–153 mbsf interval.
NGR values measured on sill material recovered from each hole at Site U1547 show consistently low values between 0 and 20 counts/s (Figure F60A).
Downhole logging in Hole U1547B provided continuous in situ measurements from 70 to 166 mbsf (Figure F60A). We describe the information from the HNGS in terms of potassium, uranium, and thorium concentration estimates (Figure F61). The abrupt drop in K, U, and Th concentrations at ~120 mbsf corresponds to the depth of the first (shallowest) sill in Hole U1547B (Figure F61). Sediments above this sill show increasing concentrations of K (to ~1.5 wt%) and Th (to ~9 ppm) over the ~40 m interval above the sill. Concentrations of U are anticorrelated with Th above the sill and consistently decrease from 3.5 ppm at ~104 mbsf to 0.9 ppm at 153 mbsf. No significant step in K, U, or Th concentration is observed moving from sill to sediment across the bottom contact of the small sill at ~124 mbsf. Remarkably, total concentrations of both U and Th decrease downhole through the small sill and continue to decrease until the thicker sill is encountered at ~154 mbsf. The long wavelength trends of both U and Th decrease, and their short wavelength variations remain anticorrelated.
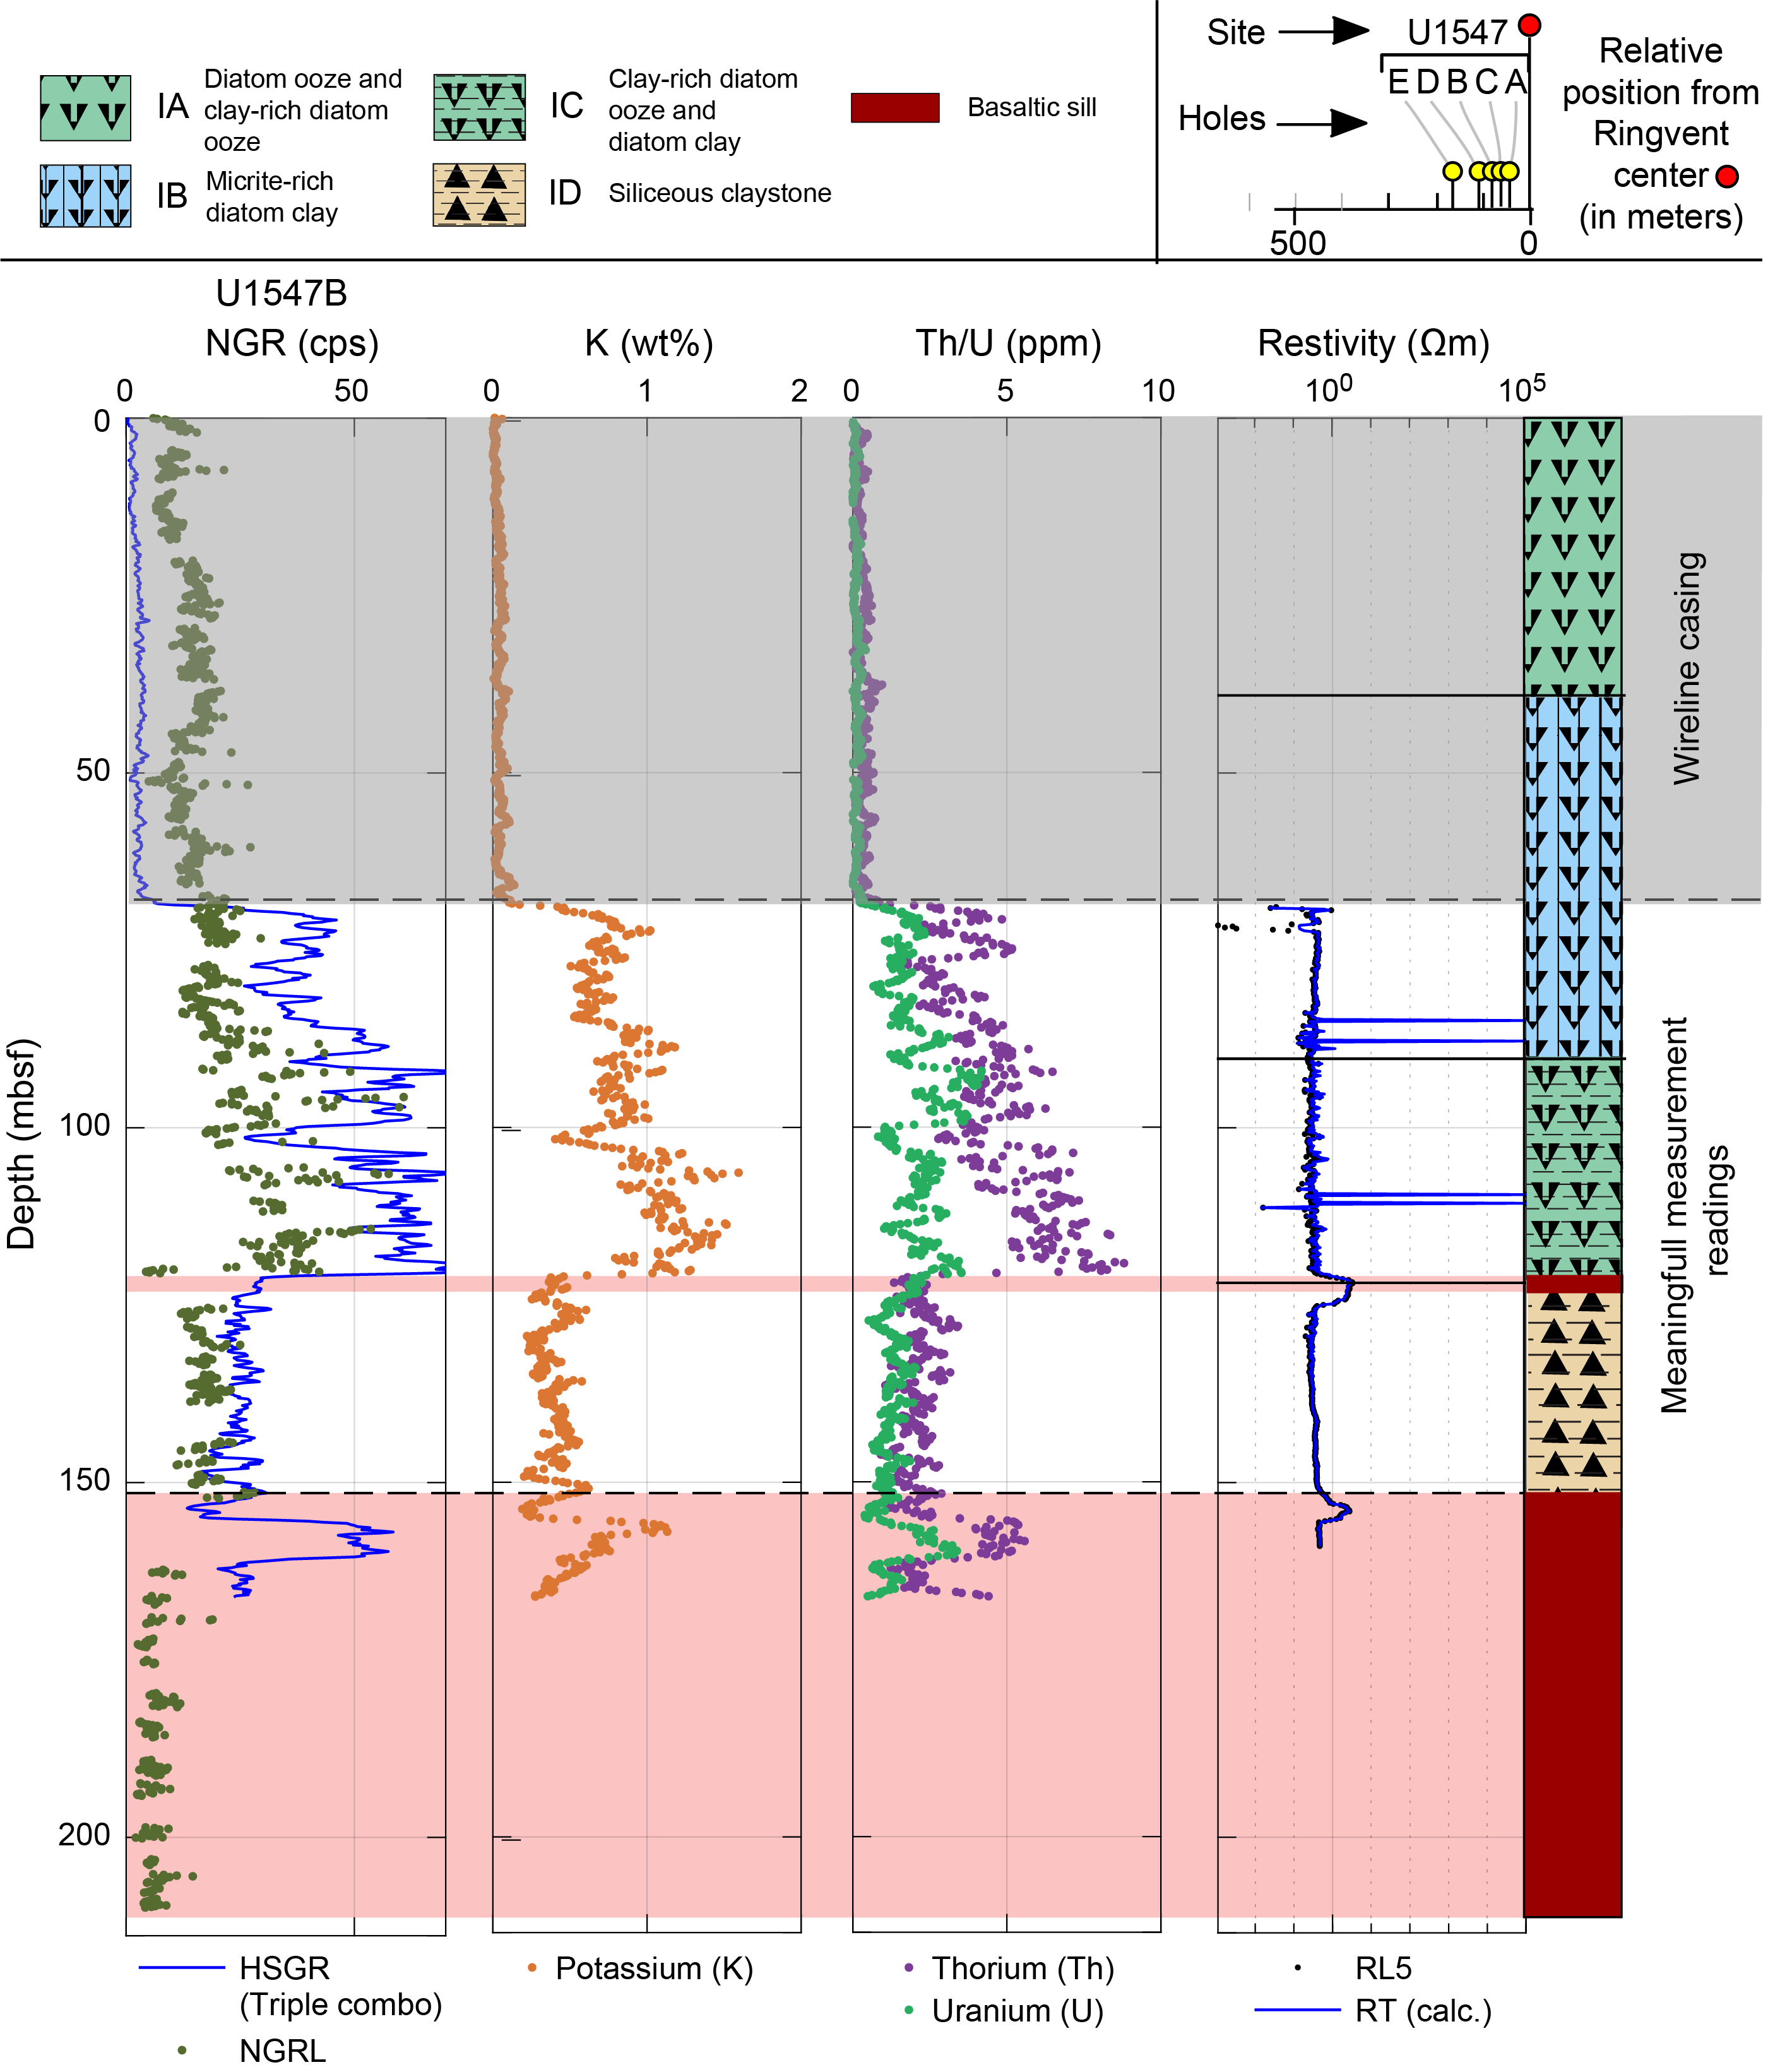
A small sill, located just 3.1 m above the thicker sill in Hole U1547B, shows peaks in K (~0.58 wt%), U (~1.5 ppm), and Th (~2.7 ppm) compared to the background values of the sediments (K = ~0.22 wt%; U = ~0.8 ppm; Th = ~1.0 ppm).
The top contact of the deepest, thick sill in Hole U1547B (Figure F61) is characterized by a large peak in NGR (observed in both the NGR and HNGS data) over the upper 5–6 m of this sill. K concentrations reach a maximum of ~1.12 wt% within 1 m of the top sill/sediment contact (156.4 mbsf). This maximum is correlated with comparatively high values for Th (~5 ppm) in the upper ~5.5 m of the sill. U shows an increase at the sill top contact from values comparable to the sediments at ~0.5 ppm to a maximum of ~3.3 ppm 5 m below the sill top contact. The relatively constant NGR values (3.7–9.3 counts/s) at greater depths within the sill suggest much lower concentrations in all three elements (K = ~0.27 wt%; U = ~0.5 ppm; Th = ~4.4 ppm; values estimated from the last values measured using the HNGS).
12.7. Borehole diameter (caliper)
The caliper readings provided by the modified triple combo indicate two large intervals, ~70–86 and ~122–148 mbsf (maximum logging depth), close to the maximum opening extent of the caliper arm. These are indications of washed out intervals where there was a considerable gap between the logging tool and the surrounding borehole walls. Caliper readings from ~86 to ~122 mbsf consistently show anticorrelated values with the density readings from the HLDS (larger borehole diameter correlates with lower density formation values) in a pattern suggesting fine-scale lithologic variations.
12.8. Rheology
Measured shear and compressive strength at Site U1548 generally increase from Hole U1548D, the most distal to the Ringvent structure, to Hole U1548C, the most proximal (Figure F59B). In Hole U1548D, shear strength linearly increases from 24.7 kPa at the seafloor to 42.5 kPa at 110 mbsf and compressive strength increases from 0.3 up 49 kPa over the same depth interval. Hole U1548E shows a similar pattern, except that compressive strength remains greater below 82 mbsf, increasing to ~172 kPa at ~107 mbsf. An increase of compressive strength similar to that observed in Hole U1548D is also observed in Holes U1548A and U1548B, but compressive strength is greater than shear strength at a comparatively greater depth range (~67.5–93 mbsf). In Hole U1548E, compressive strength becomes greater than shear strength at only 41 mbsf (Figure F59B).
When converted into shear strength, compressive strength measured with the pocket penetrometer (PEN) should match shear strength measurements from the automated vane shear (AVS) (see Petrophysics in the Expedition 385 methods chapter [Teske et al., 2021a]). We found that the depth beyond which PEN measurements become reliable varies between holes. In Holes U1548D and U1548E, this occurs at ~40 mbsf; in Hole U1548A, it occurs at ~70 mbsf; and in Holes U1548B and U1548C, it occurs at ~50 mbsf (Figure F59).
Rheological property measurements of the sediments from Holes U1547A and U1547B show trends similar to measurements at Site U1548. Hole U1547B shear strength measurements show a continuous increase from 44 to 86 kPa from 60 to 120 mbsf (Figure F60B). These values follow a slope similar to that observed at Site U1548 over the upper 60 m. Hole U1547B measurements show a large increase in compressive strength between 70 and 100 mbsf and values up to 122.5 kPa. This pattern is comparable to results obtained from Site U1548 over a similar depth range (Figure F59B). Over the bottom 20 m of Hole U1547A, shear strength (AVS raw values and PEN values divided by two) increase from 49 kPa at ~100 mbsf to 122.5kPa at ~118 mbsf. In contrast to Hole U1547B, Hole U1547A shows a relatively constant increase in shear stress up to a maximum value of 159.4 kPa at 112.5 mbsf (Figure F60B).
12.9. Porosity
MAD measurements at both Sites U1547 and U1548 (Figures F59C, F60C) show similar linear decreases in porosity over the uppermost 100 m of sediment. The most distal holes (U1548D and U1548E) reveal a general decrease in porosity from 90% at the subseafloor to ~80% at ~100 mbsf. Closer to Ringvent, Holes U1548A–U1548C deviate from this depth relation, showing a porosity reduction to 80% within 5 to 10 m of the sills found in each hole at 102, 89.2, and 65 mbsf, respectively.
Porosity of the sediments recovered from Holes U1547A and U1547B shows a similar decrease from 90% at the seafloor to 75% at 110 mbsf. Closer to the first sill interface, porosity values drop to ~62% at U1547B and ~70% at U1547A (Figure F60C).
Porosity of the sills found in Holes U1547E, U1547D, U1547B and U1547C increases from the rim of Ringvent toward the center (Figure F60C). At the rim (Hole U1547E), porosity is ~28% at the sill/sediment boundary and decreases downhole over 20 m to ~13% at ~100 mbsf. Large fluctuations between 10% and 20% are visible from 100 to 150 mbsf before attenuated variations around ~12% are observed at 190 mbsf. Porosity values in the uppermost 25 m of the sill at Hole U1547D are high, similar to those in Hole U1547E. Porosity is 15.2% at the sediment/sill interface (~100 mbsf) and then fluctuates between ~10% and 18% at ~100–126 mbsf and between ~12.4% and 14.6% below 126 mbsf (Figure F60C). The porosity/depth profile within the sill at Hole U1547B is the most regular at Site U1547 and has a nearly constant porosity of ~12% over the 54 m of sill recovered (Figure F60C). Only one significant porosity increase is observed: to 21.1% at ~206 mbsf. Finally, porosity measurements for Hole U1547C indicate the highest value measured for the Site U1547 sills: 24% at the sediment/sill interface (Figure F60C).
12.10. Resistivity
Resistivity measurements are relatively homogeneous, with values varying around a mean of ~0.4 Ωm in the sediments between 70 and 148 mbsf in Hole U1547B (Figure F61). Two large positive anomalies relative to the sediment are observed at ~120.6–125 and ~152.4–155.5 mbsf. The first anomaly has values up to 3 Ωm and corresponds to the thin, shallower sill in this hole. The second anomaly has comparable values up to 2.60 Ωm measured at the depth of the top contact of the deeper sill. The logging report indicates that the maximum depth of the modified triple combo was limited at around ~166 mbsf. Either the large washout above this sill prevented the logging instrument from continuing down the hole or the hole was otherwise filled in the uppermost meters of the sill.
The four large resistivity anomalies at ~85, ~88, ~109, and ~110 mbsf are inconsistent with the rest of the data. All four anomalies reach the same maximum value of 100,000 Ωm, and they are all interpreted to be metal bits from the drilling or coring equipment.
12.11. Data integration and lithologic correlation
12.11.1. Sediment
All petrophysical data show correlative transitions in sediment property at several intervals:
- 40 mbsf: this depth marks the transition between Lithostratigraphic Subunits IA and IB (see Lithostratigraphy), which correlates with density (Figures F58A, F59A), NGR (Figures F59A, F60A), and P-wave velocity (Figures F57C, F58C).
- 70 mbsf: a transition is marked by a change from a mean density value of 1.45 g/cm3 above 70 mbsf to 1.31 g/cm3 below 70 mbsf (Figure F57A). This is correlated with a change in NGR at Site U1548 (Figure F59A). Although less obvious in Holes U1547A and U1547B, a similar correlation with NGR and the change in density is observed between 70 and 80 mbsf (Figure F60A). This shift correlates with the transition from Lithostratigraphic Subunit IA to Subunit IB, which is noted in the core description as being deeper at Site U1547 than at Site U1548 (see Lithostratigraphy).
- 125–155 mbsf: this interval in Hole U1547B exhibits a unique variation in sediment properties, with lower density values (~1.3 g/cm3) correlated with a low NGR signal (~26 gAPI) (Figures F58A, F60A). This interval corresponds to Lithostratigraphic Subunit ID, which is dominated by siliceous claystone that marks the dissolution of diatoms and the opal-A to opal-CT phase change (see Lithostratigraphy). Evidence of deformation is also reported in this unit (see Structural geology).
12.11.2. Sill intrusions
P-wave velocities inside the sills at Site U1547 range between ~3654 and 4666 m/s. Here we compare measurements on the large sills found in Holes U1547B–U1547E with the large sill found at Site U1546:
- Bulk density of the sill is slightly lower than at previous sites: 2.7 g/cm3 (Hole U1547B) compared to 2.8 g/cm3 (Site U1546).
- Average porosity is greater: 12.2% (Hole U1547B) compared to 4.2% (Site U1546).
- Maximum porosity values for igneous rocks recovered at Site U1547 are found near the rim of the Ringvent structure in Hole U1547E, and values increase near the top contact to a maximum of 27.9% at the margin. The maximum porosity values for Hole U1547B are as high as 21.1% and relate to a peperite facies (see Igneous petrology and alteration and Lithostratigraphy). The highest porosity values found in Hole U1546C correspond to the gabbro facies found in the upper part of the sill with a porosity of 12.2%.
- Similar high concentrations of K, U, and Th are found at the top margins of the sills at Sites U1547 and U1546.
- Low NGR values are found in the main bodies of the sills at Sites U1547 and U1546.
Sills found at Sites U1546 and U1547 show large MS values three orders of magnitude greater than that of the sediment background. At Site U1546, higher MS values inside the sill highlight an observed distinct gabbroic texture. At Site U1547, two holes (U1547B and U1547D) show distinctly lower MS values ~50 m below the sill top contacts that could be indicative of distinct magmatic units.
References
Arason, P., and Levi, S., 2010. Maximum likelihood solution for inclination-only data in paleomagnetism. Geophysical Journal International, 182(2):753–771. https://doi.org/
Berner, R.A., 1982. Burial of organic carbon and pyrite sulfur in the modern ocean: its geochemical and environmental significance. American Journal of Science, 282(4):451–473. https://doi.org/
Čermák, V., and Rybach, L., 1982. Thermal conductivity and specific heat of minerals and rocks. In Angenheister, G. (Ed.), Landolt-Börnstein: Numerical Data and Functional Relationships in Science and Technology, New Series, (Group V) Geophysics and Space Research, (Volume Ia) Physical Properties of Rocks: Berlin (Springer), 305–343.
Goldhaber, M.B., and Kaplan, I.R., 1974. The sulfur cycle. In Goldberg, E.D. (Ed.), The Sea (Volume 5): Marine Chemistry: New York (Wiley), 569–655.
Hantschel, T., and Kauerauf, A.I., 2009. Fundamentals of Basin and Petroleum Systems Modeling: Berlin (Springer-Verlag). https://doi.org/
Kastner, M., and Gieskes, J.M., 1976. Interstitial water profiles and sites of diagenetic reactions, Leg 35, DSDP, Bellingshausen abyssal plain. Earth and Planetary Science Letters, 33(1):11–20. https://doi.org/
Kirschvink, J.L., 1980. The least-squares line and plane and the analysis of palaeomagnetic data. Geophysical Journal International, 62(3):699–718. https://doi.org/
Le Bas, M.J., Le Maitre, R.W., Streickeisen, A., Zanettin, B., and the IUGS Subcommission on the Systematics of Igneous Rocks, 1986. A chemical classification of volcanic rocks based on the total alkali-silica diagram. Journal of Petrology, 27(3):745–750. https://doi.org/
Levi, S., and Karlin, R., 1989. A sixty thousand year paleomagnetic record from Gulf of California sediments: secular variation, late Quaternary excursions and geomagnetic implications. Earth and Planetary Science Letters, 92(2):219–233. https://doi.org/
Lin, Y.-S., Biddle, J.F., Lipp, J.S., Orcutt, B.N., Holler, T., Teske, A., and Hinrichs, K.-U., 2010. Effect of storage conditions on archaeal and bacterial communities in subsurface marine sediments. Geomicrobiology Journal, 27(3):261–272. https://doi.org/
Martini, E., 1971. Standard Tertiary and Quaternary calcareous nannoplankton zonation. In McKee, E.D., and Weir, G.W. (Ed.), Trace Elements Investigations Report, 269: Washington, DC (US Department of the Interior). https://doi.org/
Martens, C.S., 1990. Generation of short chain acid anions in hydrothermally altered sediments of the Guaymas Basin, Gulf of California. Applied Geochemistry, 5(1):71–76. https://doi.org/
McDougall, K., and Martínez, A.Y.M., 2014. Evidence for a marine incursion along the lower Colorado River corridor. Geosphere, 10(5):842–869. https://doi.org/
Meyers, P.A., 1994. Preservation of elemental and isotopic source identification of sedimentary organic matter. Chemical Geology, 114(3–4):289–302. https://doi.org/
Pimmel, A., and Claypool, G., 2001. Introduction to shipboard organic geochemistry on the JOIDES Resolution. Ocean Drilling Program Technical Note, 30. https://doi.org/
Ramírez, G.A., McKay, L.J., Fields, M.W., Buckley, A., Mortera, C., Hensen, C., Ravelo, A.C., and Teske, A.P., 2020. The Guaymas Basin subseafloor sedimentary archaeome reflects complex environmental histories. iScience, 23(9):101459. https://doi.org/
Shervais, J.W., 1982. Ti-V plots and the petrogenesis of modern and ophiolitic lavas. Earth and Planetary Science Letters, 59(1):101–118. https://doi.org/
Shipboard Scientific Party, 1982. Guaymas Basin; Sites 477, 478, and 481. In Curray, J.R., Moore, D. G., et al., Initial Reports of the Deep Sea Drilling Project, 64: Washington, DC (US Government Printing Office), 211–415. https://doi.org/
Taylor, J.D., Glover, E.A., Smith, L., Dyal, P., and Williams, S.T., 2011. Molecular phylogeny and classification of the chemosymbiotic bivalve family Lucinidae (Mollusca: Bivalvia). Zoological Journal of the Linnean Society, 163(1):15–49. https://doi.org/
Teske, A., McKay, L.J., Ravelo, A.C., Aiello, I., Mortera, C., Núñez-Useche, F., Canet, C., et al., 2019. Characteristics and evolution of sill-driven off-axis hydrothermalism in Guaymas Basin – the Ringvent site. Scientific Reports, 9(1):13847. https://doi.org/
Teske, A., Lizarralde, D., and Höfig, T.W., 2018. Expedition 385 Scientific Prospectus: Guaymas Basin Tectonics and Biosphere: College Station, TX (International Ocean Discovery Program). https://doi.org/
Teske, A., Lizarralde, D., Höfig, T.W., Aiello, I.W., Ash, J.L., Bojanova, D.P., Buatier, M.D., Edgcomb, V.P., Galerne, C.Y., Gontharet, S., Heuer, V.B., Jiang, S., Kars, M.A.C., Khogenkumar Singh, S., Kim, J.-H., Koornneef, L.M.T., Marsaglia, K.M., Meyer, N.R., Morono, Y., Negrete-Aranda, R., Neumann, F., Pastor, L.C., Peña-Salinas, M.E., Pérez Cruz, L.L., Ran, L., Riboulleau, A., Sarao, J.A., Schubert, F., Stock, J.M., Toffin, L.M.A.A., Xie, W., Yamanaka, T., and Zhuang, G., 2021a. Expedition 385 methods. In Teske, A., Lizarralde, D., Höfig, T.W. and the Expedition 385 Scientists, Guaymas Basin Tectonics and Biosphere. Proceedings of the International Ocean Discovery Program, 385: College Station, TX (International Ocean Discovery Program). https://doi.org/
Teske, A., Lizarralde, D., Höfig, T.W., Aiello, I.W., Ash, J.L., Bojanova, D.P., Buatier, M.D., Edgcomb, V.P., Galerne, C.Y., Gontharet, S., Heuer, V.B., Jiang, S., Kars, M.A.C., Khogenkumar Singh, S., Kim, J.-H., Koornneef, L.M.T., Marsaglia, K.M., Meyer, N.R., Morono, Y., Negrete-Aranda, R., Neumann, F., Pastor, L.C., Peña-Salinas, M.E., Pérez Cruz, L.L., Ran, L., Riboulleau, A., Sarao, J.A., Schubert, F., Stock, J.M., Toffin, L.M.A.A., Xie, W., Yamanaka, T., and Zhuang, G., 2021b. Site U1545. In Teske, A., Lizarralde, D., Höfig, T.W. and the Expedition 385 Scientists, Guaymas Basin Tectonics and Biosphere. Proceedings of the International Ocean Discovery Program, 385: College Station, TX (International Ocean Discovery Program). https://doi.org/
Teske, A., Lizarralde, D., Höfig, T.W., Aiello, I.W., Ash, J.L., Bojanova, D.P., Buatier, M.D., Edgcomb, V.P., Galerne, C.Y., Gontharet, S., Heuer, V.B., Jiang, S., Kars, M.A.C., Khogenkumar Singh, S., Kim, J.-H., Koornneef, L.M.T., Marsaglia, K.M., Meyer, N.R., Morono, Y., Negrete-Aranda, R., Neumann, F., Pastor, L.C., Peña-Salinas, M.E., Pérez Cruz, L.L., Ran, L., Riboulleau, A., Sarao, J.A., Schubert, F., Stock, J.M., Toffin, L.M.A.A., Xie, W., Yamanaka, T., and Zhuang, G., 2021c. Site U1546. In Teske, A., Lizarralde, D., Höfig, T.W. and the Expedition 385 Scientists, Guaymas Basin Tectonics and Biosphere. Proceedings of the International Ocean Discovery Program, 385: College Station, TX (International Ocean Discovery Program). https://doi.org/
Teske, A., Lizarralde, D., Höfig, T.W., Aiello, I.W., Ash, J.L., Bojanova, D.P., Buatier, M.D., Edgcomb, V.P., Galerne, C.Y., Gontharet, S., Heuer, V.B., Jiang, S., Kars, M.A.C., Khogenkumar Singh, S., Kim, J.-H., Koornneef, L.M.T., Marsaglia, K.M., Meyer, N.R., Morono, Y., Negrete-Aranda, R., Neumann, F., Pastor, L.C., Peña-Salinas, M.E., Pérez Cruz, L.L., Ran, L., Riboulleau, A., Sarao, J.A., Schubert, F., Stock, J.M., Toffin, L.M.A.A., Xie, W., Yamanaka, T., and Zhuang, G., 2021d. Site U1550. In Teske, A., Lizarralde, D., Höfig, T.W., and the Expedition 385 Scientists, Guaymas Basin Tectonics and Biosphere. Proceedings of the International Ocean Discovery Program, 385: College Station, TX (International Ocean Discovery Program). https://doi.org/
Teske, A., Lizarralde, D., Höfig, T.W., and the Expedition 385 Scientists, 2021e. Supplementary material, https://doi.org/
Wellsbury, P., Goodman, K., Barth, T., Cragg, B.A., Barnes, S.P., and Parkes, R.J., 1997. Deep marine biosphere fuelled by increasing organic matter availability during burial and heating. Nature, 388(6642):573–576. https://doi.org/
White, J.D.L., McPhie, J., and Skilling, I., 2000. Peperite: a useful genetic term. Bulletin of Volcanology, 62:65–66. https://doi.org/
Zijderveld, J.D.A., 1967. AC demagnetization of rocks: analysis of results. In Runcorn, S.K.C., Creer, K.M., and Collinson, D.W. (Eds.), Methods in Palaeomagnetism: Amsterdam (Elsevier), 254–286.