Teske, A., Lizarralde, D., Höfig, T.W., and the Expedition 385 Scientists
Proceedings of the International Ocean Discovery Program Volume 385
publications.iodp.org
https://doi.org/10.14379/iodp.proc.385.107.2021
Site U15501
![]() A. Teske,
A. Teske,
![]() D. Lizarralde,
D. Lizarralde,
![]() T.W. Höfig,
T.W. Höfig,
![]() I.W. Aiello,
I.W. Aiello,
![]() J.L. Ash,
J.L. Ash,
![]() D.P. Bojanova,
D.P. Bojanova,
![]() M.D. Buatier,
M.D. Buatier,
![]() V.P. Edgcomb,
V.P. Edgcomb,
![]() C.Y. Galerne,
C.Y. Galerne,
![]() S. Gontharet,
S. Gontharet,
![]() V.B. Heuer,
V.B. Heuer,
![]() S. Jiang,
S. Jiang,
![]() M.A.C. Kars,
M.A.C. Kars,
![]() S. Khogenkumar Singh,
S. Khogenkumar Singh,
![]() J.-H. Kim,
J.-H. Kim,
![]() L.M.T. Koornneef,
L.M.T. Koornneef,
![]() K.M. Marsaglia,
K.M. Marsaglia,
![]() N.R. Meyer,
N.R. Meyer,
![]() Y. Morono,
Y. Morono,
![]() R. Negrete-Aranda,
R. Negrete-Aranda,
![]() F. Neumann,
F. Neumann,
![]() L.C. Pastor,
L.C. Pastor,
![]() M.E. Peña-Salinas,
M.E. Peña-Salinas,
![]() L.L. Pérez-Cruz,
L.L. Pérez-Cruz,
![]() L. Ran,
L. Ran,
![]() A. Riboulleau,
A. Riboulleau,
![]() J.A. Sarao,
J.A. Sarao,
![]() F. Schubert,
F. Schubert,
![]() J.M. Stock,
J.M. Stock,
![]() L.M.A.A. Toffin,
L.M.A.A. Toffin,
![]() W. Xie,
W. Xie,
![]() T. Yamanaka,
T. Yamanaka,
![]() G. Zhuang
2
G. Zhuang
2
1 Teske, A., Lizarralde, D., Höfig, T.W., Aiello, I.W., Ash, J.L., Bojanova, D.P., Buatier, M.D., Edgcomb, V.P., Galerne, C.Y., Gontharet, S., Heuer, V.B., Jiang, S., Kars, M.A.C., Khogenkumar Singh, S., Kim, J.-H., Koornneef, L.M.T., Marsaglia, K.M., Meyer, N.R., Morono, Y., Negrete-Aranda, R., Neumann, F., Pastor, L.C., Peña-Salinas, M.E., Pérez Cruz, L.L., Ran, L., Riboulleau, A., Sarao, J.A., Schubert, F., Stock, J.M., Toffin, L.M.A.A., Xie, W., Yamanaka, T., and Zhuang, G., 2021. Site U1550. In Teske, A., Lizarralde, D., Höfig, T.W., and the Expedition 385 Scientists, Guaymas Basin Tectonics and Biosphere. Proceedings of the International Ocean Discovery Program, 385: College Station, TX (International Ocean Discovery Program). https://doi.org/
2 Expedition 385 Scientists’ affiliations.
1. Summary
1.1. Background and objectives
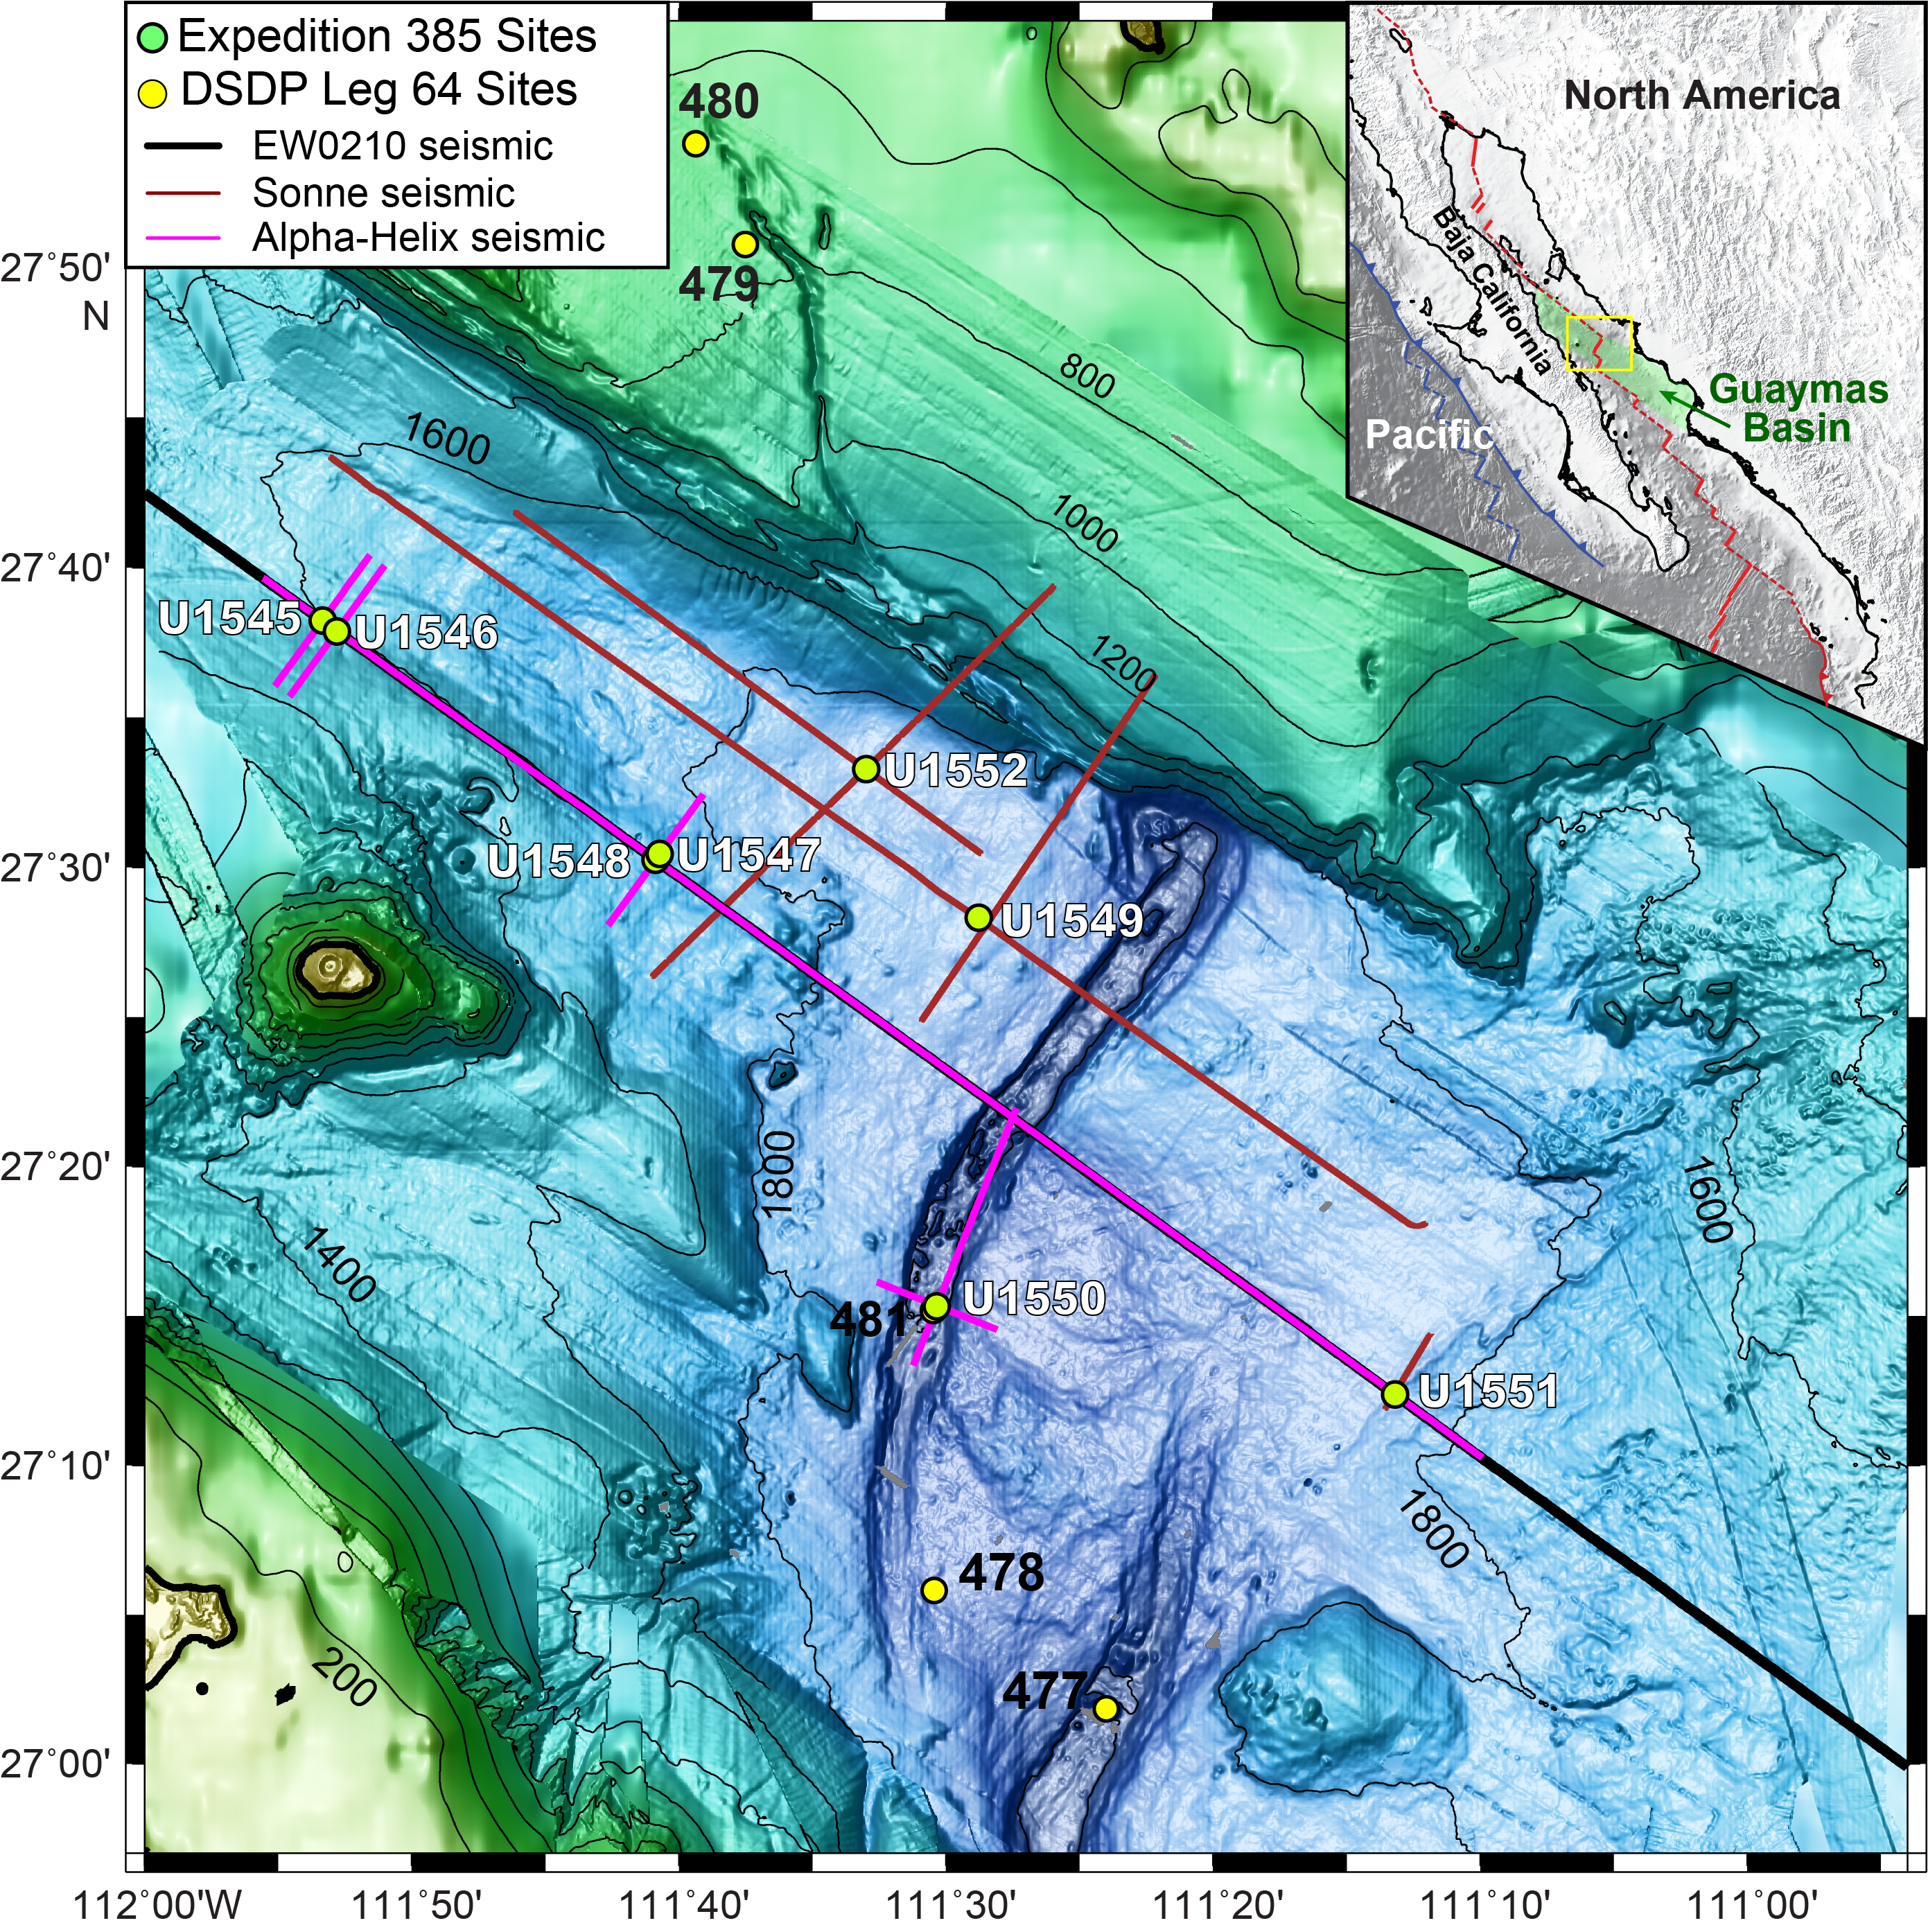
Site U1550 is located within the axial graben of the northern Guaymas Basin spreading segment (Figures F1, F2). This site was established very close to Deep Sea Drilling Project (DSDP) Site 481 to take advantage of the known presence, depth, and characteristics of sills and indurated sediments at Site 481 (Shipboard Scientific Party, 1982), and to clarify its stratigraphy by redrilling it with improved coring tools and sampling approaches. Substantially improved recovery was expected relative to Site 481, leading to increased sampling resolution of downhole changes and enabling the use of modern microbiological approaches. The fault-bounded setting of Site U1550 provides the potential for high-flux fluid circulation in response to sill intrusion, leading to swift cooling and potentially enhanced alteration due to the rapid removal of dissolved phases and gases. The primary objectives for Site U1550 were to characterize the physical, chemical, and microbial responses to sill intrusion into sediments at a high-flux end-member location.

1.2. Operations
We cored two holes at Site U1550. Hole U1550A is located at 27°15.1602′N, 111°30.4163′W in a water depth of 2000.8 m. In Hole U1550A, we used the advanced piston corer (APC), half-length APC (HLAPC), and extended core barrel (XCB) systems to advance from the seafloor to a final depth of 207.0 meters below seafloor (mbsf) with a recovery of 190.9 m (92%). We made formation temperature measurements at several depths with the advanced piston corer temperature (APCT-3) and Sediment Temperature 2 (SET2) tools. In Hole U1550B, located at 27°15.1704′N, 111°30.4451′W in a water depth of 2001.2 m, we deployed the APC, HLAPC, and XCB systems. Cores penetrated from the seafloor to a final depth of 174.2 mbsf and recovered 160.8 m (92%). Hole U1550B was dedicated to extensive microbial and biogeochemical sampling that required the deployment of perfluorocarbon tracers (PFTs) downhole on all cores to monitor drilling fluid (seawater) contamination. The pace of coring in Hole U1550B was adjusted to accommodate the complex microbial sampling program conducted on the core receiving platform. A total of 72.0 h, or 3.0 days, were spent at Site U1550. Table T1 provides an overview of cores, penetration depths, core recovery, and operations schedule for Site U1550.
1.3. Principal results
1.3.1. Lithostratigraphy
At Site U1550, a succession of sediments, sedimentary rocks, and igneous rocks was recovered (Figure F4). The sedimentary material recovered can mainly be ascribed to two lithologic types: (1) a biogenic-dominated type, in which more or less laminated olive-gray diatom clays occur mixed with various proportions of nannofossils and silt-sized siliciclastic particles or (2) a siliciclastic-dominated type in which coarse-grained siliciclastic components (sand and silt), clay minerals, and subordinate diatoms occur either mixed in homogeneous layers or segregated in depositional layers often characterized by graded beds and scoured bases. Most of the thickest graded terrigenous layers identified are traced between holes. Vertical changes in the character of the dominant lithology, the style of bedding and/or deformation, and the diagenetic boundaries prompted the subdivision of Unit I into three subunits. Subunit IA includes three thick terrigenous beds and displays evidence of soft-sediment deformation. The lower part of the subunit in both holes is marked by a lithologically complex but correlative interval that includes a large concentration of silt- to granule-sized scoria fragments. Subunit IB is mainly composed of varying proportions of diatoms, clay, and silt, and sand occurs as a minor component. The upper part of the subunit contains a very distinctive, ~18 m thick, homogeneous interval composed of olive-green diatom clay. There are pronounced differences in Subunit IC between holes. In Hole U1550A, the top of this subunit corresponds to the first appearance of carbonates (micrite/nodules). The latter occur scattered in diatom clay or as cementing crystals in coarser grained (sand to silt) lithologies. Folding and tilting are common, as well as the presence of coarser grained beds, including a fourth thick terrigenous bed (Figure F4). Low diatom abundance and preservation support the X-ray diffraction (XRD) analysis interpretation that the sediments have undergone silica diagenesis and the transition from opal-A to opal-CT. In Hole U1550B, Subunit IC was identified in only three cores that are mainly composed of organic-rich, yellowish brown homogeneous diatom clay with evidence of soft-sediment deformation. The sediments recovered at Site U1550 display a variety of sedimentary features, including graded beds with scoured bases ranging from a few centimeters to several meters thick, tilted and/or folded beds or laminae, and chaotic fabric. Taken together, these features are direct evidence that deposition at this site occurred mainly by means of mass-gravity flow events.
1.3.2. Igneous petrology and alteration
The dominant hypabyssal igneous lithology recovered from the bottom of both Hole U1550A (upper contact = ~204 mbsf; recovery = ~1.2 m) and Hole U1550B (upper contact = ~170 mbsf; recovery = ~1.6 m) is mafic rock with a largely doleritic texture. Minor basaltic rock intervals with a sparsely to highly plagioclase-phyric texture occasionally occur. Notably, there is a gradual change in grain size transitioning from basaltic to doleritic texture within a distance of a few centimeters, which indicates slow magma solidification. Nevertheless, there are also angular fragments of doleritic material entrapped in basaltic rock intervals in Hole U1550B. The slightly to moderately altered igneous rocks are nonvesicular to sparsely vesicular and contain multiple, slightly dipping calcite veinlets running parallel to each other. Samples obtained from this sill show a subalkaline, tholeiitic mafic rock chemistry that corresponds to an enriched mid-ocean-ridge basalt (MORB) composition. These rocks appear to represent somewhat more evolved melts based on their lower Mg# compared to the sill material recovered from nearby Site 481.
1.3.3. Structural geology
Both Holes U1550A and U1550B exhibit folding and tilted bedding starting at 15 mbsf and continuing intermittently below. These displacements are attributed to soft-sediment deformation and slumping because they are variable on a small spatial scale. Significant faults are seen in both holes at about 130–140 mbsf, where sets of parallel faults with apparent dips of about 60° displace the sediment. These faults have a spacing of 0.2–1 m in the cores, but the amount and direction of displacement is unknown. The faults indicate an episode of deformation that occurred prior to the time of deposition of sediments that are now found at about 130 mbsf.
1.3.4. Biostratigraphy
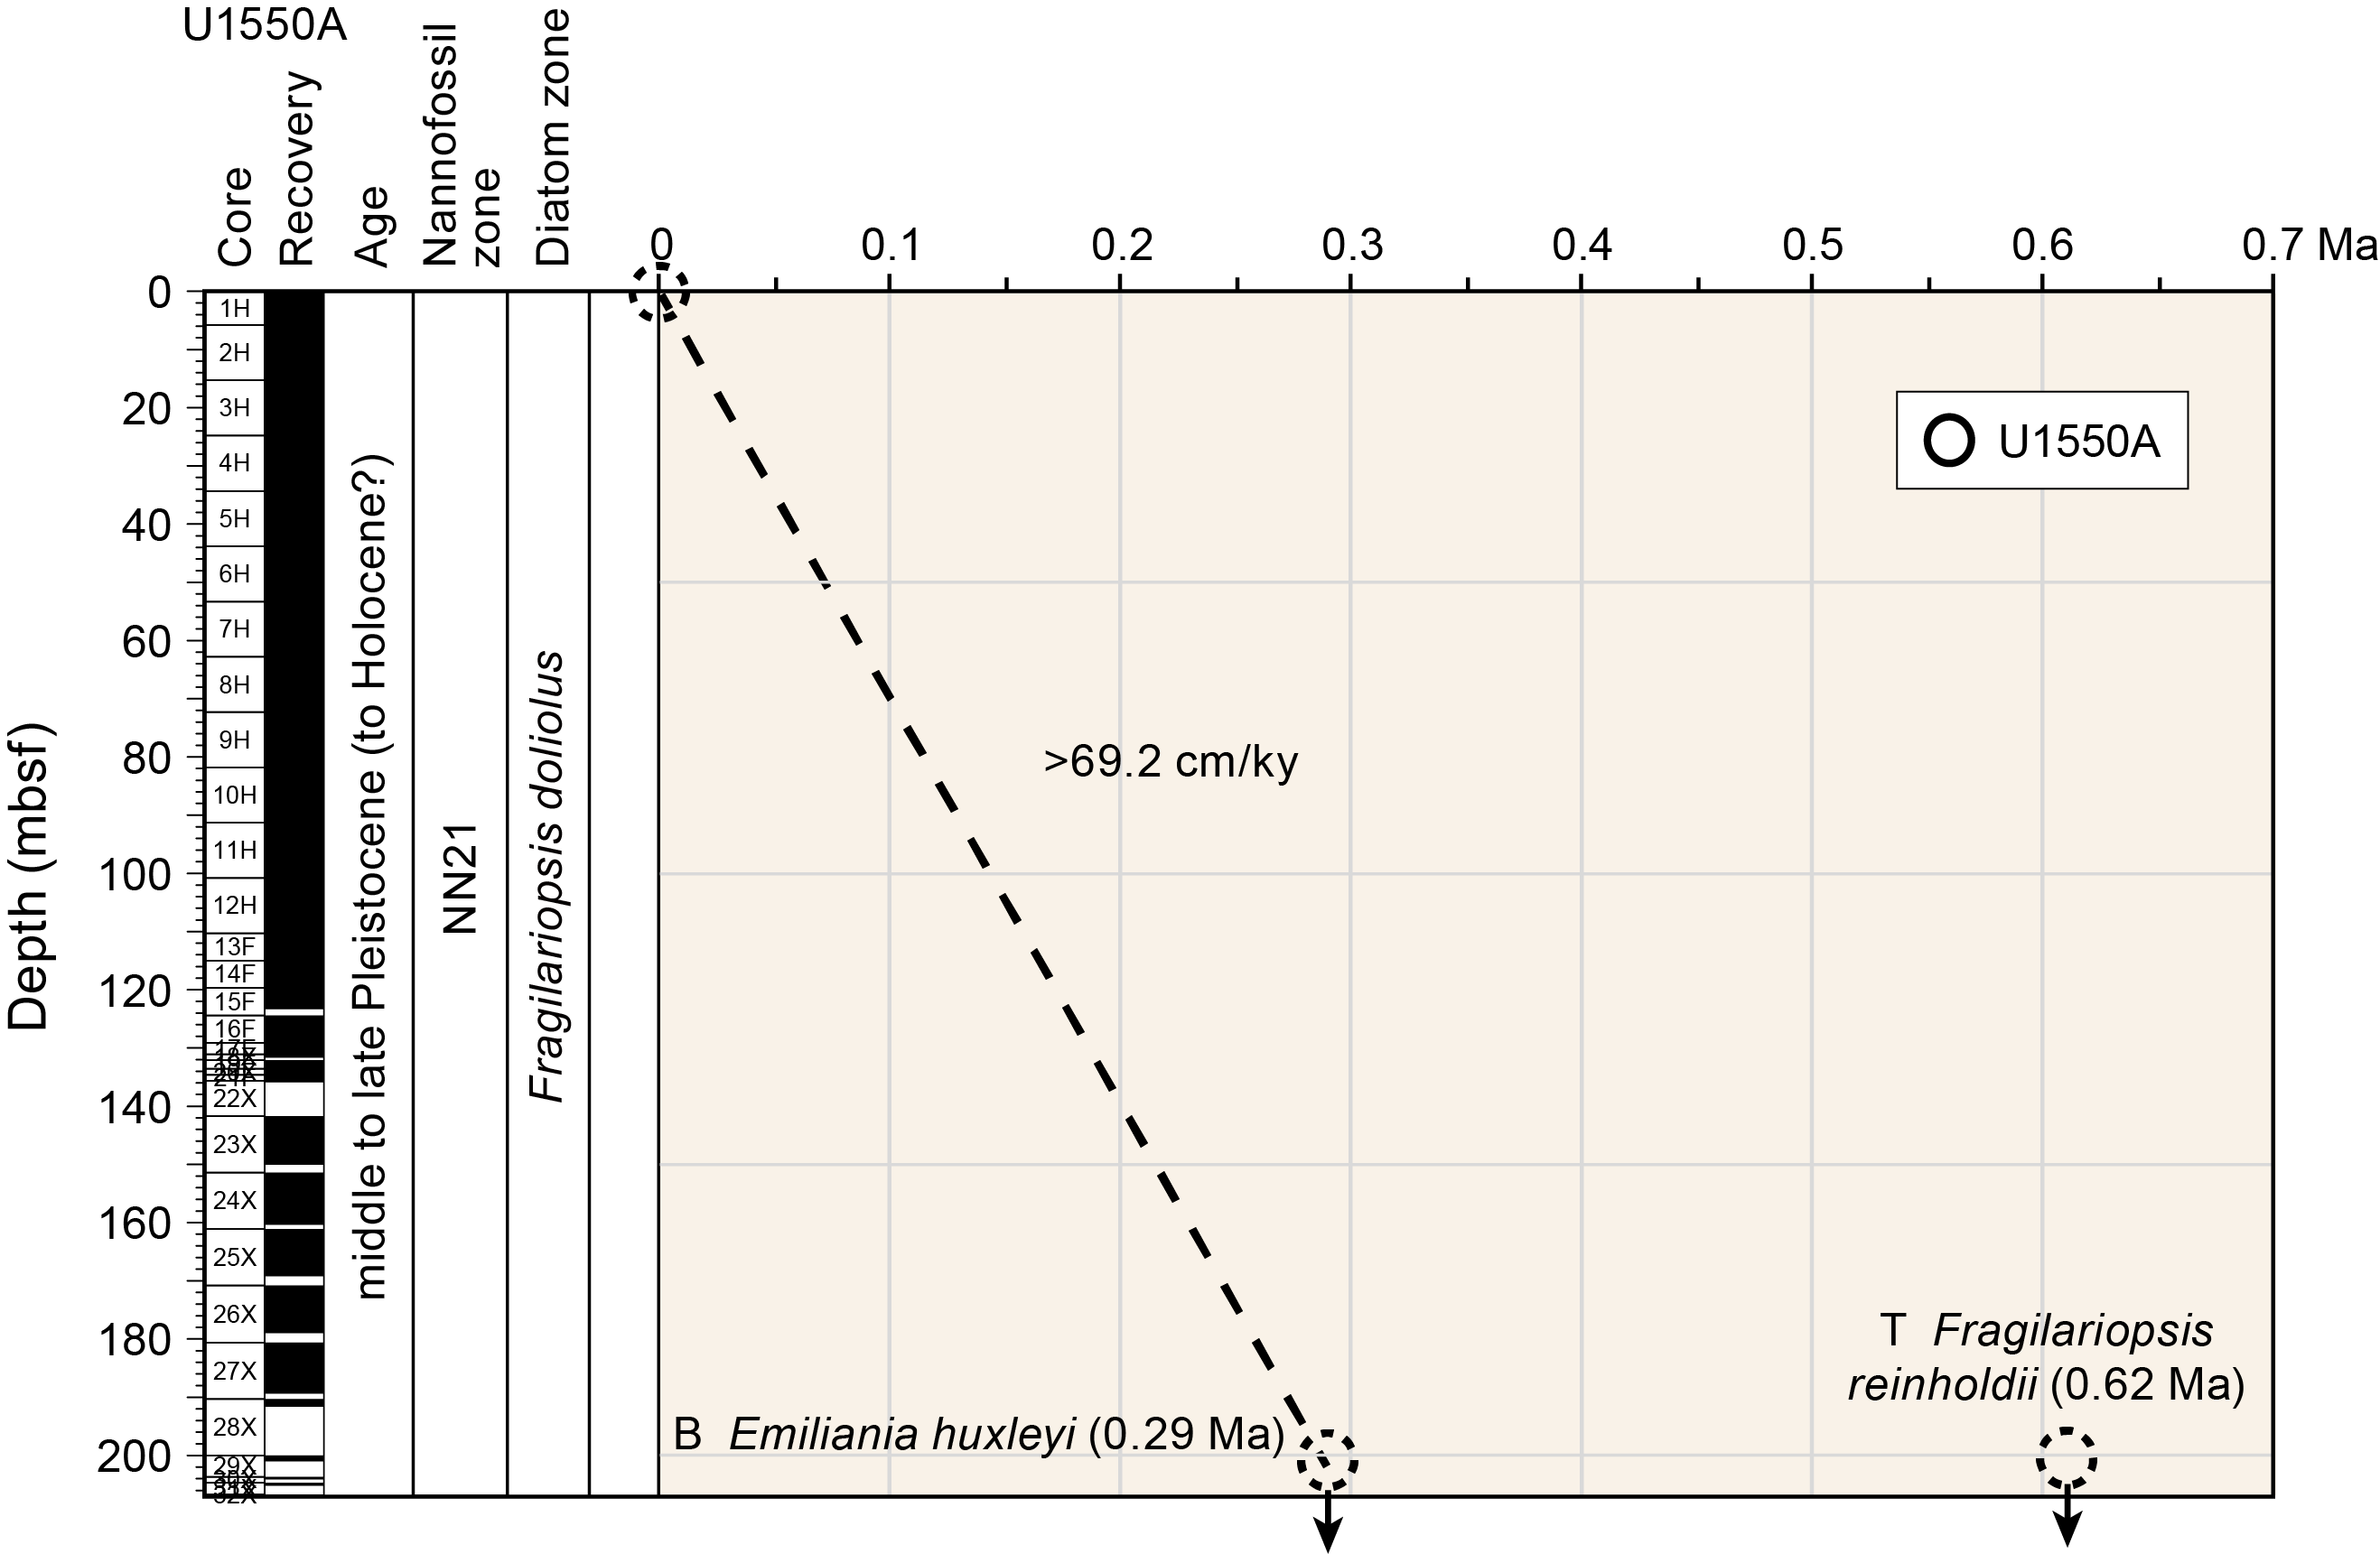
Calcareous nannofossils are abundant and common to 123.08 mbsf, rare/barren from 131.06 to 135.6 mbsf, and abundant and common from 142.02 to 187.66 mbsf. Nannofossil preservation is good/moderate throughout the entire sedimentary sequence. Marine diatoms are dominant to abundant with good/moderate preservation in the upper interval of Hole U1550A (0–72.51 mbsf). They alternate between abundant, common, and few with moderate to poor preservation at an intermediate depth range (81.02–123.08 mbsf) and range from few to rare and barren with poor preservation in the lowermost interval (131.06–200.55 mbsf). Apparent diagenetic alteration of diatoms is present in samples with rare diatoms at the bottom of Hole U1550A. The diatom assemblages are obviously different from those found at Sites U1545–U1548, possibly suggesting strong disturbance of sedimentation sequences by underwater gravity flow events. The occurrence of calcareous nannofossil Emiliania huxleyi from the top to the bottom of both holes dates the entire sediment sequence to (Holocene–)late–middle Pleistocene, or younger than 0.29 Ma (Hole U1550A = 0–200.55 mbsf). This age assignment is consistent with the absence of Pseudoemiliania lacunosa (last appearance datum [LAD] = 0.44 Ma) and Fragilariopsis reinholdii (LAD = 0.62 Ma) in all samples examined. The estimated average sedimentation rate is >692 m/My (>69.2 cm/ky).
1.3.5. Paleomagnetism
Alternating field (AF) demagnetization up to 20 mT was carried out with the superconducting rock magnetometer (SRM) on archive-half sections on all sediment cores from Hole U1550A (Cores 1H–29X). The drilling-induced overprint was successfully removed from APC and HLAPC cores (from the seafloor to ~130 mbsf) upon demagnetization. Inclination values after demagnetization at 20 mT cluster around 46°, which is comparable to the expected geocentric axial dipole (GAD) inclination at the latitude of the site (45.9°). A detailed analysis of the remanence of discrete samples from Hole U1550A shows that the drilling-induced overprint was removed by 10 mT and the characteristic remanent magnetization (ChRM) agrees with the SRM measurements. Unfortunately, XCB cores were overprinted and too disturbed to yield reliable paleomagnetic data. Nevertheless, three discrete samples were collected in XCB cores, and their inclination values are consistent with what is expected. Hole U1550A cores were therefore assigned to the normal Brunhes Chron C1n (younger than 0.78 Ma). Discrete sedimentary samples taken in Hole U1550A predominantly show prolate behavior throughout the hole with the Kmax principal axis of anisotropy of magnetic susceptibility distributed in the horizontal plane. The archive-half sections containing igneous rocks (Cores 385-U1550A-30X through 32X and 385-U1550B-22X through 23X) were only measured for their natural remanent magnetization (NRM) because AF demagnetization treatment was not effective.
1.3.6. Inorganic geochemistry
A total of 42 interstitial water (IW) samples were collected from the sedimentary succession at Site U1550. The sulfate–methane transition zone (SMTZ) at this site is located at ~10 mbsf, one of the shallowest SMTZs encountered during this expedition. The IW chemical properties show spatial and vertical heterogeneities, exhibiting differences between Holes U1550A and U1550B (e.g., alkalinity, ammonium, Mg2+, Li+, and B) and changing significantly between the upper and lower parts of the sediment succession throughout both holes. In the upper part of Site U1550 (0–40 mbsf), alkalinity reaches very high values up to 90 mM and Mg2+ accumulates to values higher than seawater concentration, whereas Ca2+ shows a decreasing trend due to authigenic carbonate precipitation. Ammonium shows local peaks at 25 mbsf and around 100 mbsf; the upper peak is stronger in Hole U1550A, and the deeper one is stronger in Hole U1550B. Below 100 mbsf, alkalinity and Mg2+ decrease with depth and Ca2+, Li+, Sr2+, and H4SiO4 concentrations increase with depth. These elements show remarkable excursions above the sill. Thus, the IW chemical properties in this interval are likely to be influenced by the sill, as previously evidenced at Site 481 (Shipboard Scientific Party, 1982).
1.3.7. Organic geochemistry
At Site U1550, organic geochemists performed sampling and analysis of gas and solid-phase samples and examined them for features that might distinguish this axial setting. In Hole U1550A, one headspace gas sample was analyzed per 9.5 m of advance for routine hydrocarbon safety monitoring; void gases were quantified and sampled for hydrocarbon, H2, and CO contents; and the carbon, nitrogen, and sulfur contents of particulate sediment were characterized. In Hole U1550B, hydrocarbon, H2, and CO analyses were performed on headspace and void gas samples. Carbon, nitrogen, and sulfur contents of sediment were characterized, and a comprehensive suite of gas and sediment samples for postexpedition analyses were taken. Methane and C2–C6 hydrocarbons are detectable below ~7 mbsf. Low C1/C2 values displaying an anomalous relationship with temperature were observed in both Holes U1550A and U1550B. The lowest ratios occur between ~100 and ~130 mbsf, but the concentrations of higher hydrocarbon are low and C1/C2 values return to normal farther downhole. From elemental analysis, we infer that the primary source of organic matter is marine in origin, although some samples indicate terrestrial organic matter input, and others are ambiguous because of the influence of mineral-associated nitrogen. In Hole U1550B, H2 and CO are present at nanomolar concentrations.
1.3.8. Microbiology
Hole U1550B is located ~50 m southeast of Site 481 where past studies included enrichments for hydrogenotrophic methanogens and detected living methanogens in shallow cores (Oremland et al., 1982). Consistent with previously measured moderate temperatures at Site 481 (Shipboard Scientific Party 1982), this hole presents an opportunity for microbiologists to examine the microbial abundance and community structure in sediments with a lower temperature gradient compared to the other sites of Expedition 385. Syringe samples for cell counts, 3-D structural imaging, and RNA analyses were taken on the core receiving platform, preserved or frozen, and stored for further analyses. Whole-round core samples were either stored in a −80°C freezer or temporarily stored in a cold room of 4°–8°C and processed further for shore-based analyses, as described for Site U1545. Samples for PFT measurements were taken on the core receiving platform using a syringe at nine distinct horizons. Cell abundance for selected samples was determined by direct counting with an epifluorescence microscope. Cell abundance was 3.1 × 10⁶ cells/cm3 in bottom seawater, whereas seafloor sediments showed 1.1 × 10⁹ cells/cm3. Below the seafloor, cell abundance gradually decreased to 1.3 × 10⁶ cells/cm3 at 94.5 mbsf and decreased below the detection limit of the protocol used for shipboard measurements at approximately 122 mbsf, which was nearly twice as deep as at Ringvent (Holes U1547B, U1548B, and U1548C).
1.3.9. Petrophysics
Physical properties measurements made on whole-round and working-half sections were compared between Holes U1550A and U1550B for lithostratigraphic characterization and correlation of visual core description with physical properties. Four in situ formation temperature measurements were conducted using the APCT-3 and SET2 tools to calculate the geothermal gradient (135°C/km) and heat flow (110 mW/m2). Conductivity measurements between Holes U1550A and U1550B show a similar increasing trend with depth. Three main depth intervals are characterized by notable petrophysical strength variations (between the seafloor and 43 mbsf, 43–86.5 mbsf, and below 96.5 mbsf), showing significant increases in shear strength. These features are embedded in a rheology trend of generally increasing shear strength downhole, whereas porosity strongly decreases because of the presence of a sill at the bottom of both holes. Strength and porosity measurements correlate positively with three lithologic subunits (IA–IC) and negatively with the rest of the physical properties (e.g., bulk density). Physical properties in Holes U1550A and U1550B show good correlation with depth except at ~80–90 mbsf where peaks in natural gamma radiation (NGR), magnetic susceptibility (MS), and P-wave velocity show an offset of 10 m between the two holes (~80 mbsf in Hole U1550A and ~90 mbsf in Hole U1550B). Also, these physical properties reveal the presence of a sill in both holes (top contact at ~204 mbsf in Hole U1550A and ~170 mbsf in Hole U1550B).
2. Background and objectives
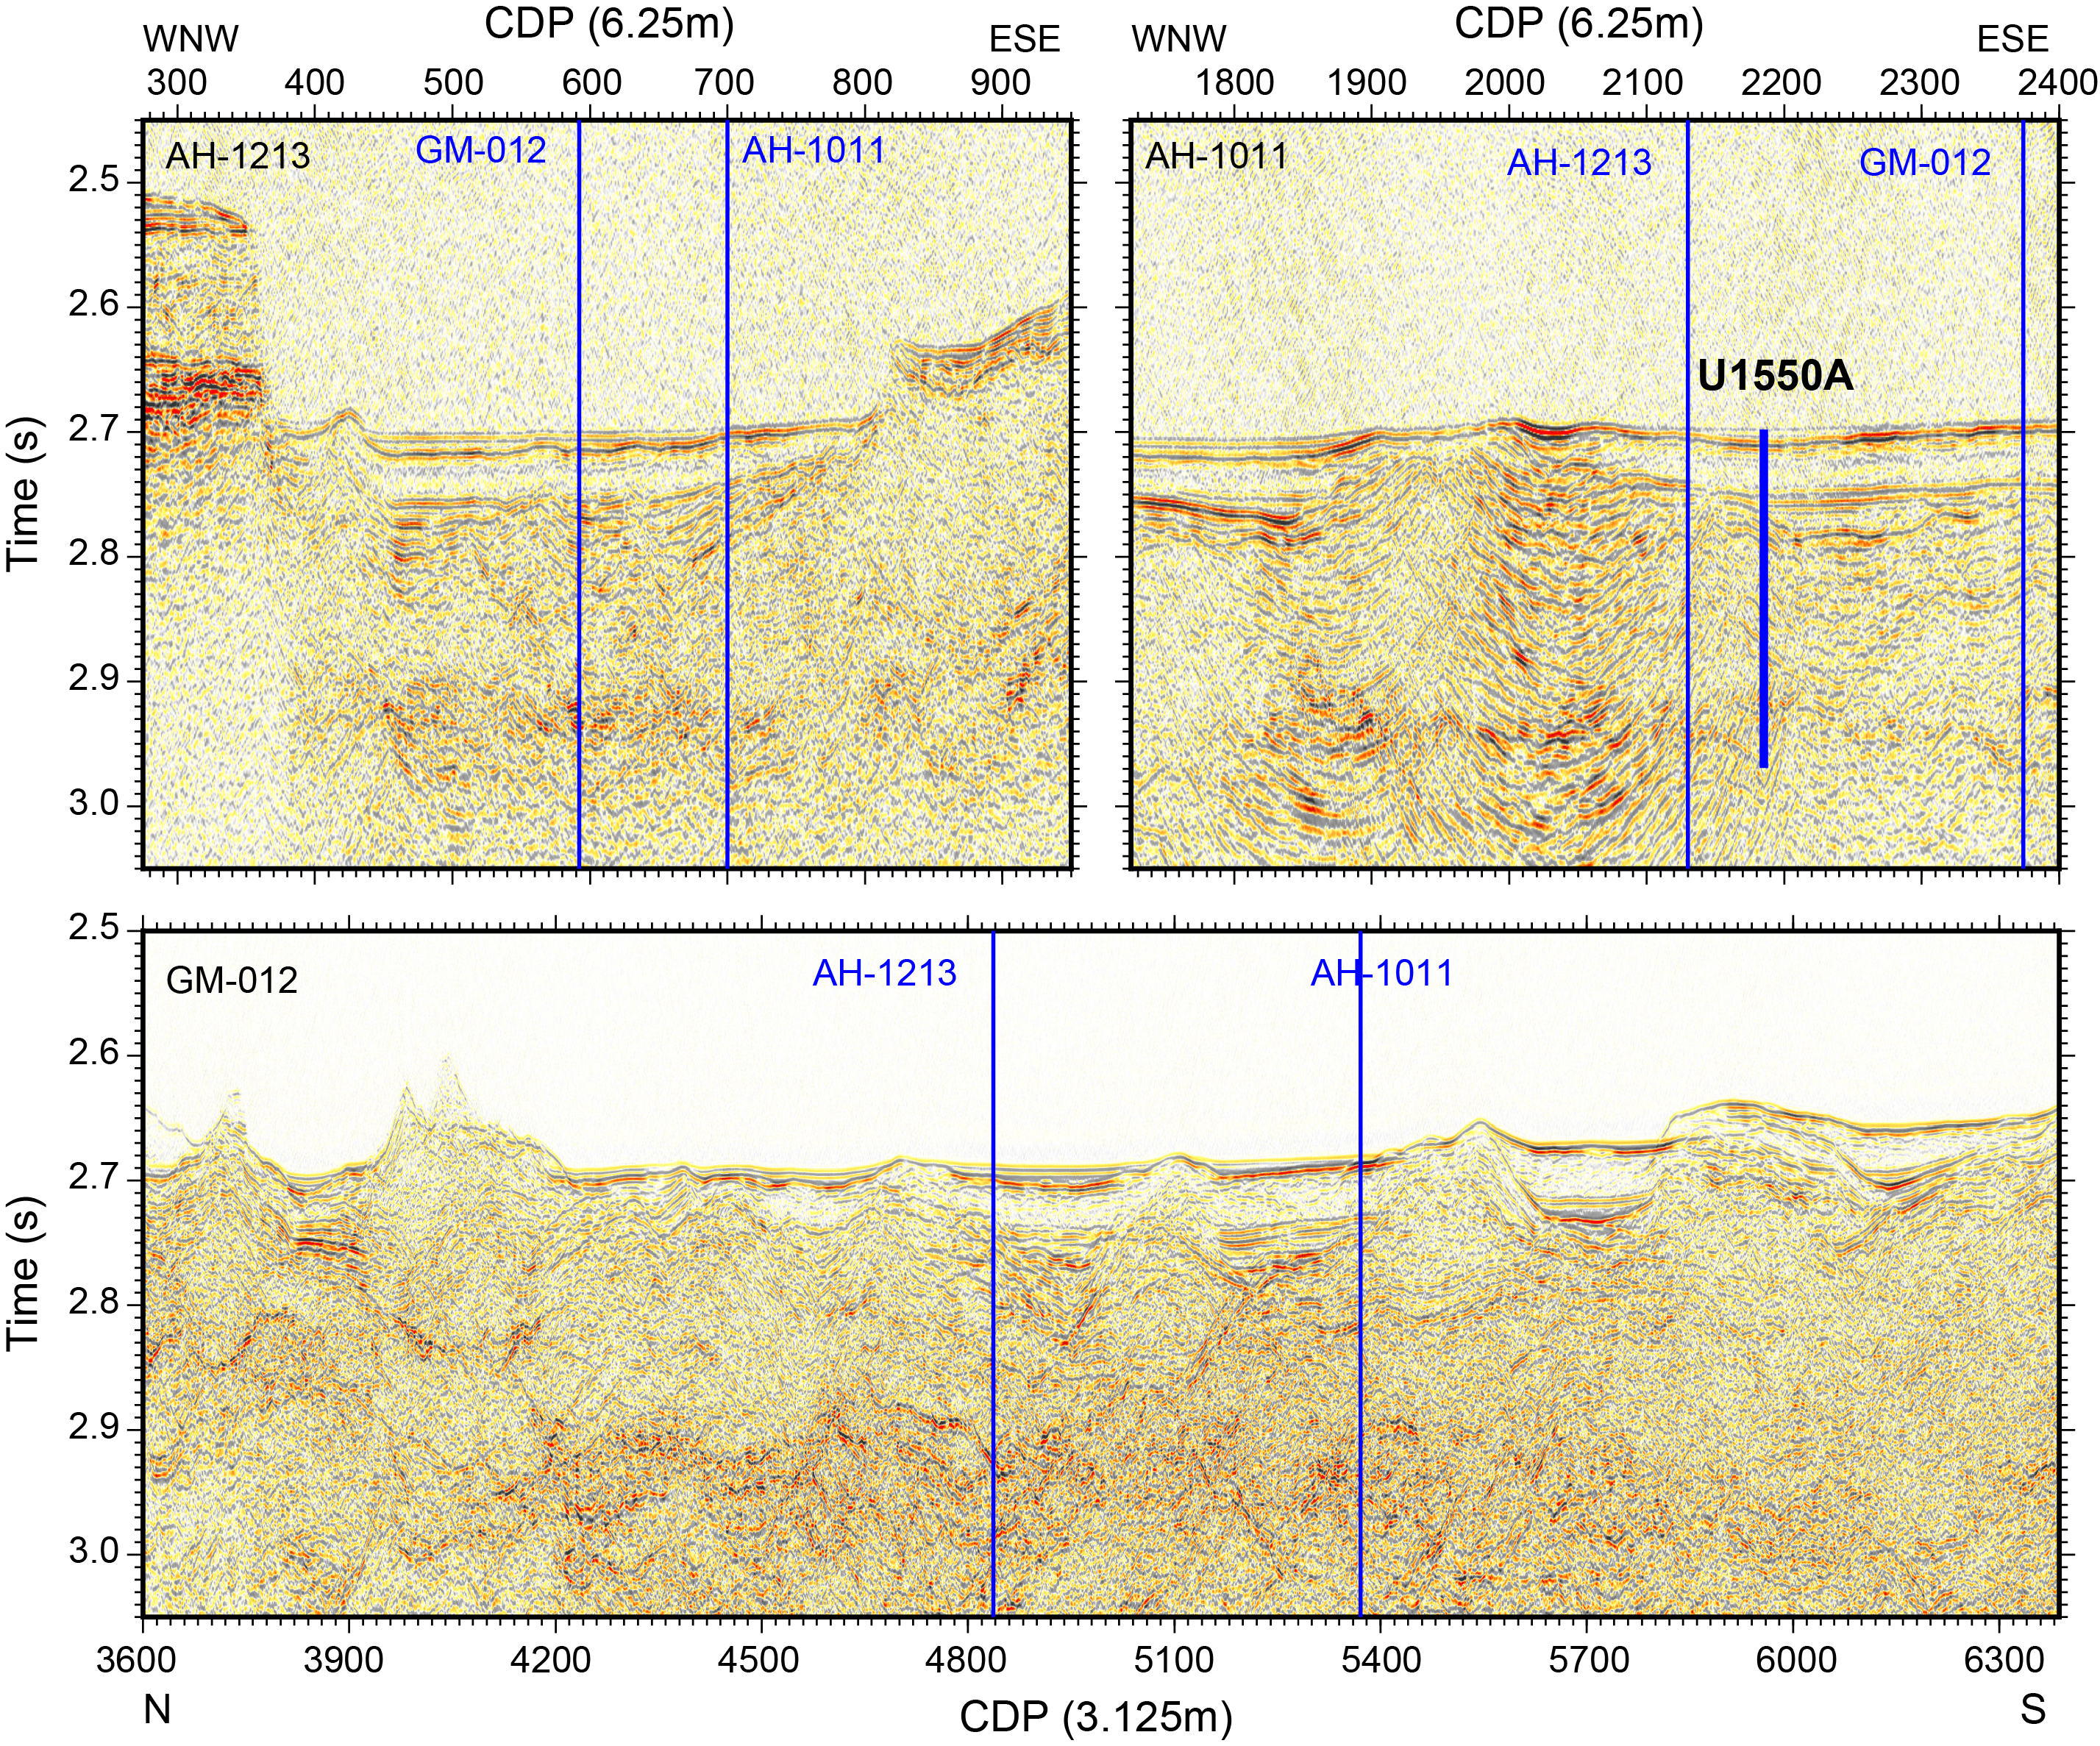
Site U1550 (proposed Site GUAYM-6B) is located at 7.25573°N, 111.50556°W within the axial graben of the northern Guaymas Basin spreading segment at a location where the northern graben enters the overlapping region of the northern and southern spreading segments (Figure F3; see Figure F1 in the Expedition 385 summary chapter [Teske et al., 2021b]). This site was chosen very close to DSDP Site 481 to take advantage of the known presence, depth, and characteristics of sills and indurated sediments at Site 481 (Shipboard Scientific Party, 1982) and to recore this site with improved coring tools and sampling approaches. Substantially improved recovery was expected, and it will lead to increased sampling resolution of downhole changes and the use of modern geochemical, mineralogic, and microbiological approaches.
A broad objective of Expedition 385 is to study the influence of sill intrusions on sediment alteration and the consequences of this alteration for carbon cycling. A number of factors influence both alteration and carbon cycling, and the robustness of hydrothermal circulation is a very important factor. The fault-bounded setting of axial Site U1550 provides the potential for high-flux fluid circulation in response to sill intrusion, leading to rapid cooling and potentially enhanced alteration due to the rapid removal of dissolved mineral phases and exsolved gases. The primary objectives for Site U1550 are thus to characterize the physical, chemical, and microbial responses to sill intrusion into sediments at a high-flux, end-member location.
3. Operations
3.1. Site U1550
Site U1550 consists of two holes that essentially represent a redrilling of adjacent DSDP Site 481 in the northern spreading segment of Guaymas Basin. The original plan for Site U1550 was to core two holes to 250 mbsf each by deployment of the APC and XCB systems, with the first hole dedicated to lithologic and pore water analysis and the second hole dedicated to sample recovery for microbiology studies. Actual operations somewhat differed from the plan, and both holes were terminated early so that the penetration of the local sill intrusion would be kept to the length of two coring advances. Hole U1550A was cored with the APC, HLAPC, and XCB systems to 207.0 mbsf; drilling stopped after ~3 m of sill had been cored. In proximal Hole U1550B, APC coring advanced through the sediment column before an underlying sill was encountered at a much shallower depth than in Hole U1550A and intersected for ~4 m when XCB coring stopped at a final depth of 174.2 mbsf. In total, 72.0 h, or 3.0 days, were spent at Site U1550.
3.1.1. Hole U1550A
After operations at Site U1549 and upon implementing a routine cut and slip of 115 ft (35 m) of the drilling line, we pulled the drill string up to the surface and reassembled the rig floor. At 2025 h on 26 October 2019, we secured the vessel for transit to Site U1550, located in the northern axial graben of Guaymas Basin. We switched from dynamic positioning (DP) to cruise mode at 2034 h, raised the thrusters, and started the ~13 nmi sea passage. We arrived at the coordinates of Site U1550 at 2209 h on 26 October, lowered the thrusters, and switched back to DP mode. At 2230 h, we started lowering the drill string with the APC/XCB bottom-hole assembly to the seafloor. At 0315 h on 27 October, we picked up the top drive and positioned the bit above the seafloor at 1997.3 mbsl. We then spudded Hole U1550A at 0405 h. Mudline Core 385-U1550A-1H recovered 5.8 m and established a seafloor depth of 2001.0 mbsl. Cores 1H–32X penetrated from the seafloor to a final depth of 207.0 mbsf and recovered 190.9 m (92%) (Table T2). After encountering strong overpull force on Core 12H, we had to drill over the core barrel to retrieve it. We switched to the HLAPC system from 110.3 mbsf (Core 13F) downhole. While deploying the HLAPC tool, we used the XCB system to core through infrequent hard layers that were penetrated with Cores 18X and 20X. Starting with Core 22X at 135.6 mbsf, we continuously deployed the XCB system. Nonmagnetic core barrels were deployed and orientation measurements were taken on all APC cores using the Icefield MI-5 core orientation tool. We made formation temperature measurements using the APCT-3 tool on Cores 4H, 6H, 8H, and 10H and the SET2 tool following Core 15F. After the XCB cutting shoe was destroyed on Core 32X, we terminated coring in Hole U1550A at 1200 h on 28 October. We pulled the drill string out of the hole, and the bit cleared the seafloor at 1320 h, ending Hole U1550A. A total of 38.8 h, or 1.6 days, were spent on Hole U1550A.
3.1.2. Hole U1550B
The vessel then moved over to the Hole U1550B coordinates 55 m west of Hole U1550A. Upon cutting and reheading the core line, we loaded the sinker bars, deployed the APC core barrel, and positioned the bit above the seafloor at 1997.3 mbsl. We spudded Hole U1550B at 1445 h on 28 October 2019. Mudline Core 385-U1550B-1H recovered 5.5 m and determined a seafloor depth of 2001.4 mbsl. Cores 1H–32X penetrated from the seafloor to a final depth of 174.2 mbsf and recovered 160.8 m (92%) (Table T2). After encountering strong overpull force on Core 12H, we had to drill over the core barrel to retrieve it. We thus switched to the HLAPC system at 109.9 mbsf (Core 13F). Upon a partial stroke on Core 17F (131.7 mbsf), we deployed the XCB system to refusal at 174.2 mbsf. We used nonmagnetic core barrels on all APC/HLAPC cores and pumped PFTs for drilling fluid (seawater) contamination monitoring on all cores. The pacing of coring was adjusted (75 min between cores) to the complex high-resolution microbial and biogeochemical sampling program conducted on the core receiving platform. We terminated coring in Hole U1550B after recovering Core 32X and started pulling the drill string out of the hole. The bit cleared the seafloor at 1815 h on 29 October. We then secured the vessel for transit to Site U1545, and at 2233 h, we switched from DP to cruise mode, ending Hole U1550B and Site U1550. We started our ~31 nmi sea passage at 2300 h on 29 October. A total of 33.2 h, or 1.4 days, were spent on Hole U1550A.
4. Lithostratigraphy
The two holes drilled at Site U1550 in the northern axial graben of Guaymas Basin near DSDP Site 481 recovered a stratigraphic succession of sediments, sedimentary rocks, and minor igneous rocks (Figure F4). Hole U1550A was drilled to 207 mbsf and a total curated depth of 206.97 mbsf. Hole U1550B was drilled ~51 m west of Hole U1550A to a final drilling depth of 174.2 m and a total curated depth of 173.34 mbsf. All references to depths in the text, figures, and tables represent curated depths on the core depth below seafloor, Method A (CSF-A), depth scale and use mbsf as the unit of measure. Lithologic description was based on combining the visual description of the core and results of the petrographic analyses of smear slides as well as the results of the mineralogic analysis done with XRD. The quality of the lithostratigraphic analysis depended on the quantity and the quality of the cores recovered, which in turn were partly a function of the lithologies encountered and the coring systems used: APC, HLAPC, and XCB. Measured physical properties such as MS, NGR, and color reflectance were also used to aid with interpretation of the cores and were compared to the lithologic data (Figure F4). Hole U1550A provided the most complete and the deepest recovered record for this site.

Hole U1550B was shallower and heavily sampled prior to sediment description; numerous whole-round core samples were collected for microbiology and geochemistry analyses (Figure F4; see Microbiology and Geochemistry). Hence, most of the lithologic observations and the depths of lithologic changes described in this report refer to Hole U1550A. The lithostratigraphy at these holes was designated as a single unit divided into four subunits. The sedimentary subunits (IA–IC) are the focus of this chapter. The bottom of Subunit IC includes igneous rocks that were intersected in both Hole U1550A and Hole U1550B (see Igneous petrology and alteration for a detailed description of this material). Igneous rocks were encountered at a greater depth (~30 mbsf) in Hole U1550A (203.7 mbsf) compared to Hole U1550B (170.4 mbsf) (Table T3). Not surprisingly, only ~70 m or about one-third of the record from Hole U1550A could be correlated to the record from Hole U1550B, as discussed below.
4.1. Unit descriptions
4.1.1. Lithostratigraphic Unit I
- Intervals: 385-U1550A-1H-1, 0 cm, to 32X-1, 27 cm; 385-U1550B-1H-1, 0 cm, to 23X-1, 114 cm
- Depths: Hole U1550A = 0–206.97 mbsf, Hole U1550B = 0–173.34 mbsf
- Thickness: Hole U1550A = 206.97 m, Hole U1550B = 173.34 m
- Age: late to middle Pleistocene
- Lithology: clay-rich diatom ooze, diatom clay, clay, sand, silt, micrite-rich diatom clay, limestone/dolostone, siliceous claystone, and mafic igneous rock
Lithostratigraphic Unit I is composed of a 206.97 m thick sequence of late to middle Pleistocene sediments and sedimentary rocks as well as igneous rocks (see Igneous petrology and alteration). The sediments recovered can mainly be ascribed to two lithologic types: (1) biogenic dominated, in which more or less laminated olive-gray diatom clay is mixed with various proportions of nannofossils and silt-sized siliciclastic particles, and (2) siliciclastic dominated, in which coarse-grained siliciclastic components (sand and silt), clay minerals, and secondarily diatoms occur either mixed in homogeneous layers or segregated in depositional units often characterized by graded bedding and scoured bases. Most of the thickest depositional events identified can be traced between holes (depositional units T1–T4) (Figure F4; Table T4). The two end-members can alternate within a core section or extend across several cores. A third type of geometric relationship is the more or less chaotic intermingling between lithologies as a result of folding, faulting, and in some cases, injection of one lithology into another. As further explained in Discussion, all these observations are evidence for large-scale episodes of soft-sediment deformation. Finally, other lithologies, including micrite (micrometer-sized authigenic carbonate particles) and carbonate nodules, occur but only in small stratigraphic intervals and only toward the bottom of Hole U1550A (Figure F4).
As seen at previous sites, the lithologic changes, although distinctive, are not significant enough to warrant formal division of the sedimentary succession into more than one lithostratigraphic unit (Unit I). However, there are vertical changes in the character of the dominant lithology, the style of bedding and/or deformation, and diagenetic boundaries, some of which are traceable between holes, that prompt division of Unit I into three subunits (Figure F4; Table T3). Unless otherwise stated, all stratigraphic intervals and depths mentioned in the chapter refer to Hole U1550A, which is the deepest hole and the least sampled for pore water geochemistry or microbiology.
4.1.1.1. Subunit IA
- Intervals: 385-U1550A-1H-1, 0 cm, to 10H-CC, 24 cm; 385-U1550B-1H-1, 0 cm, to 11H-4, 110 cm
- Depths: Hole U1550A = 0–91.74 mbsf, Hole U1550B = 0–94.53 mbsf
- Thickness: Hole U1550A = 91.74 m, Hole U1550B = 94.53 m
- Age: (Holocene? to) late to middle Pleistocene
- Lithology: diatom ooze, diatom clay, nannofossil-rich diatom clay, silt- and nannofossil-bearing diatom clay, silt-rich diatom clay, diatom-rich silty clay, silt, diatom-rich clayey silt, sandy silt, sand, silty sand, foraminifer-rich sand, ash, and scoria
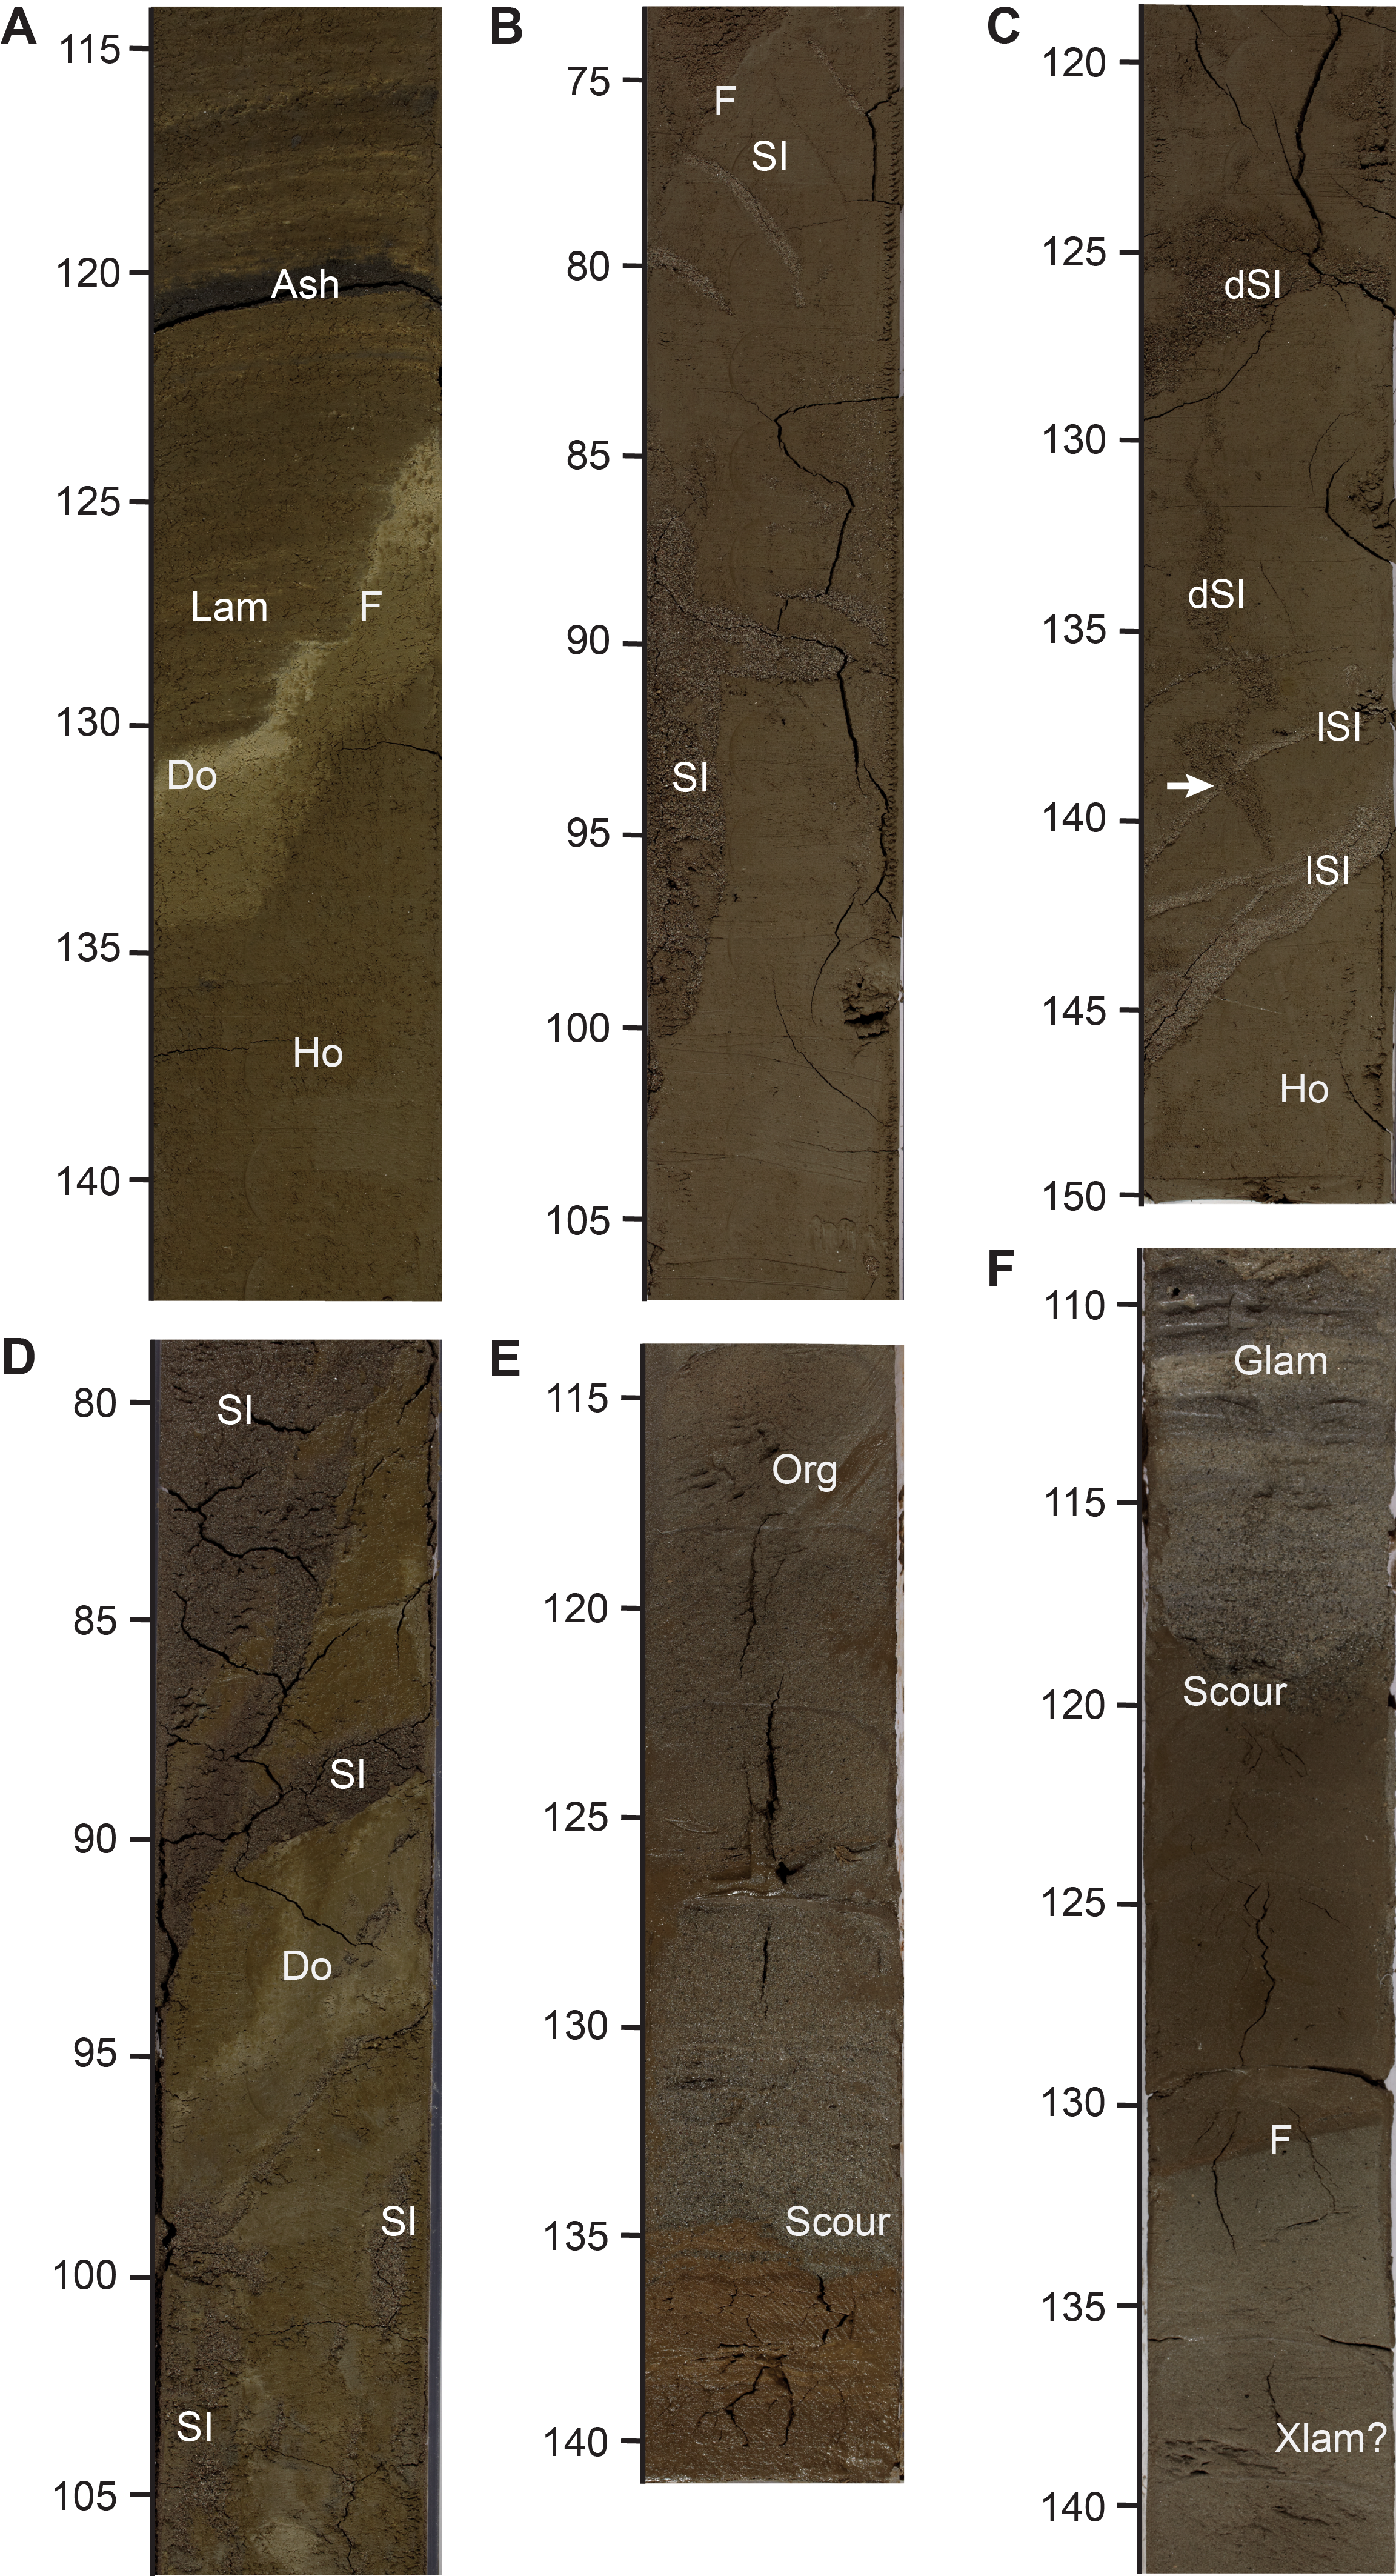
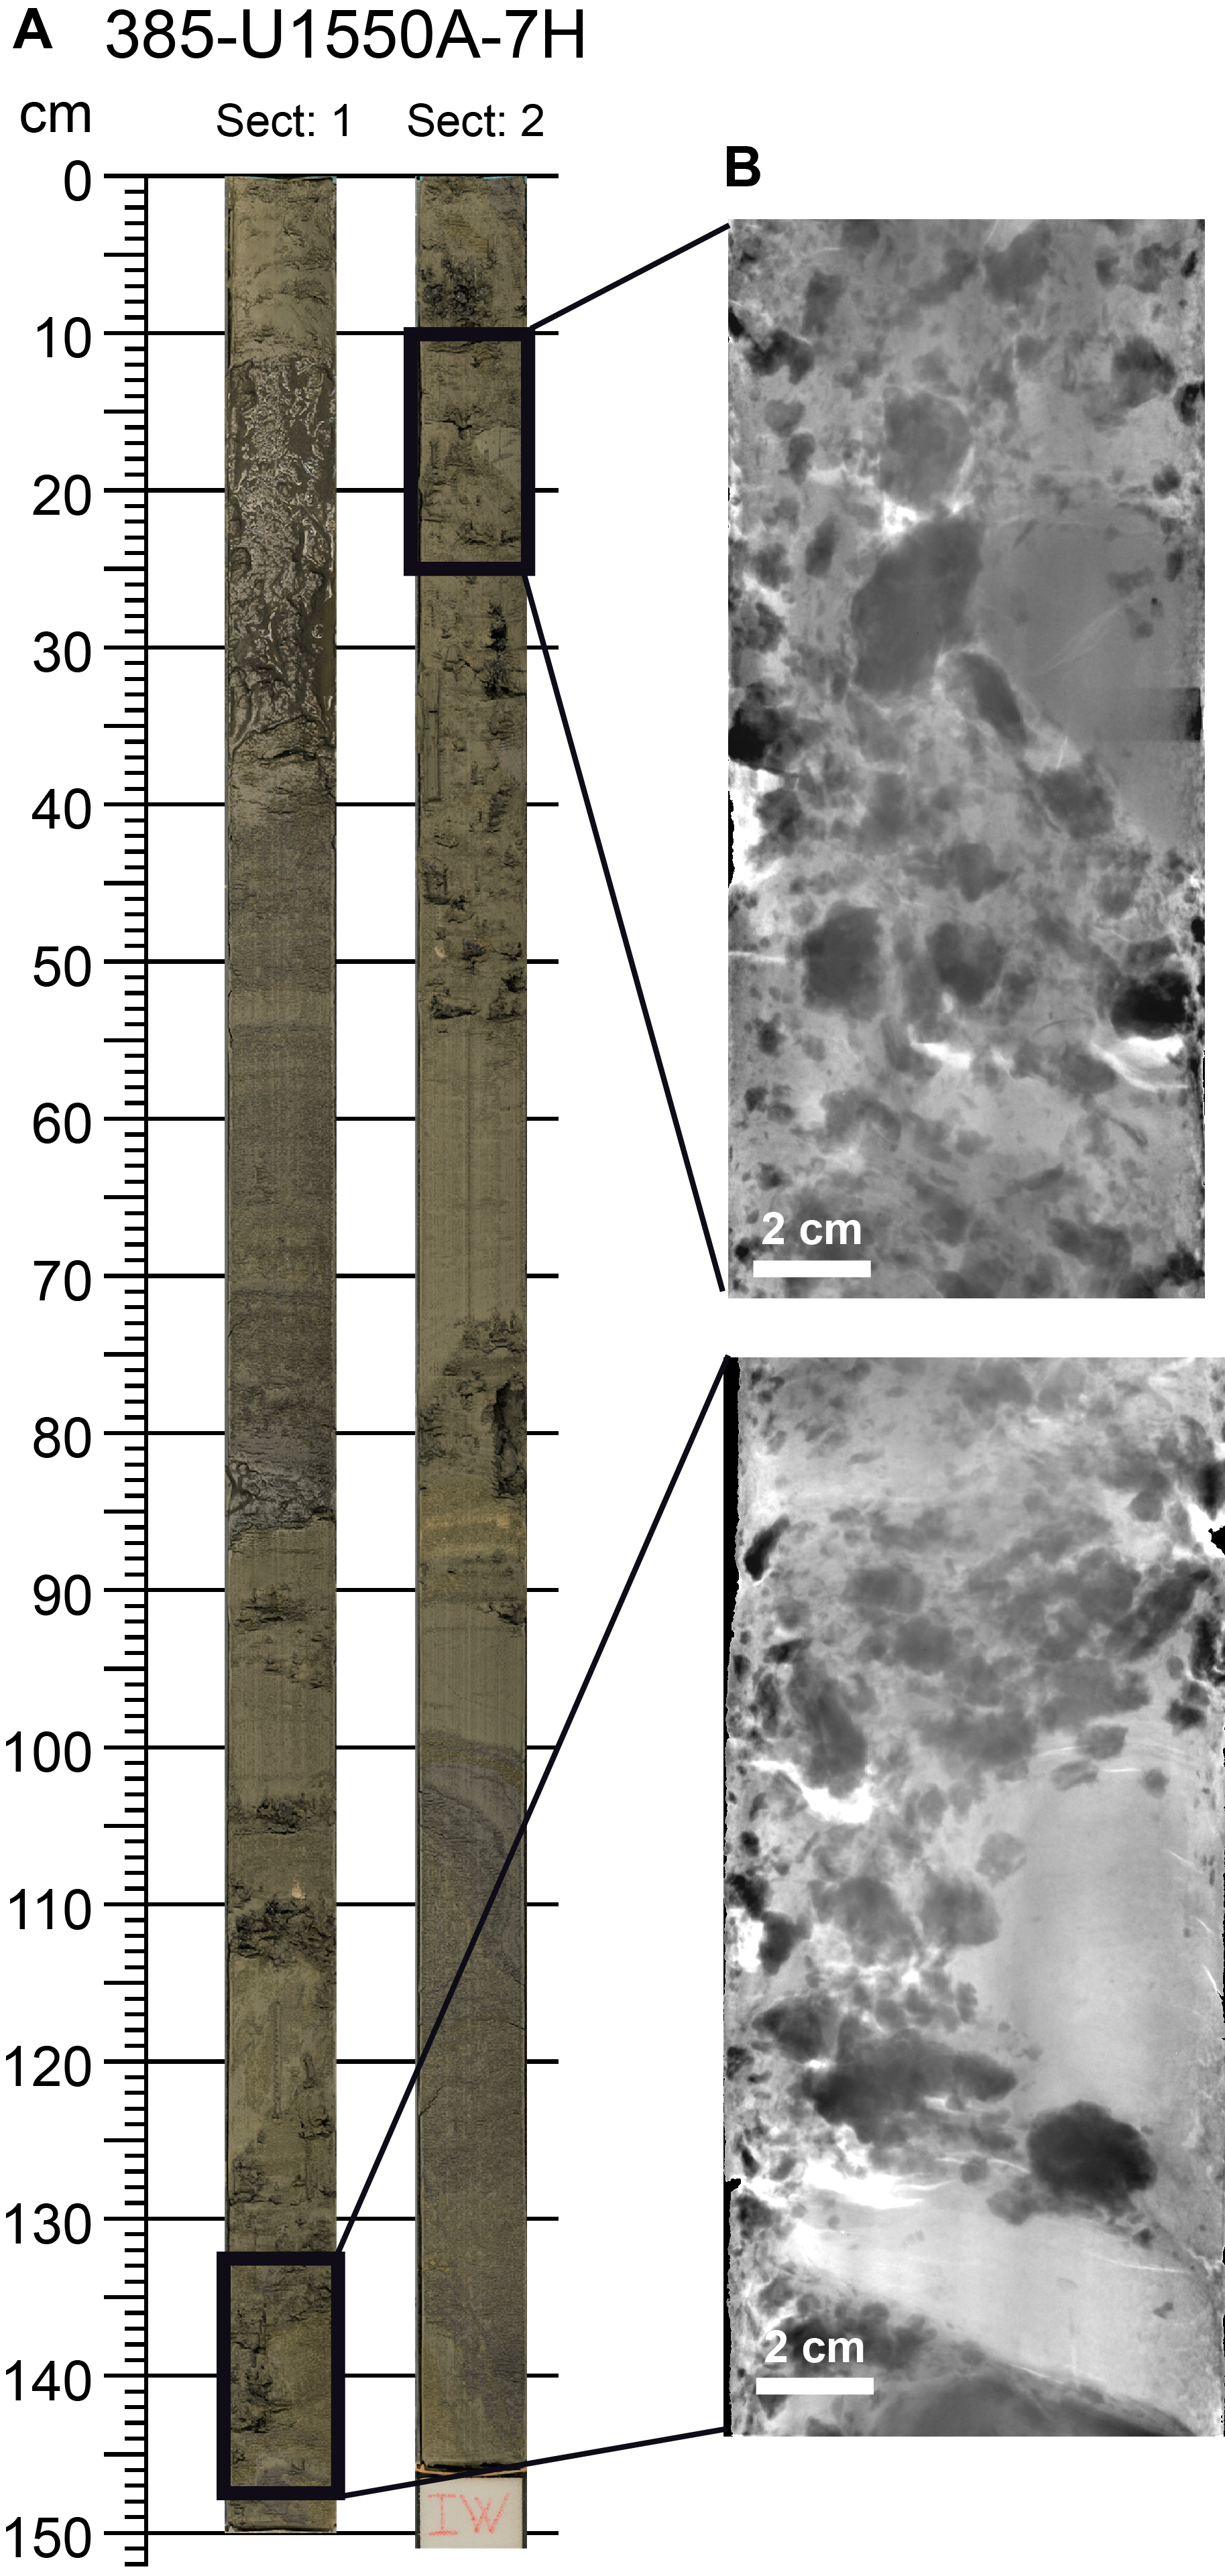
Core 1H in each hole includes two thick (~2.5 m each) intervals composed of dark yellowish brown silty diatom clay with sandy laminae toward the bottom, which are referred to in combination as Depositional Unit T1 (Table T4). Core 2H shows the uppermost evidence of soft-sediment deformation in the form of a ~50 cm thick overturned depositional unit composed of an inversely graded gray silty sand that overlies light olive-gray diatom ooze (Figure F5). The evidence of soft-sediment deformation in underlying cores includes tilted and folded lamination in the diatom clay and contorted and injected sandy intervals (Figure F6). Deformation corresponds to relatively flat values of both NGR and MS, perhaps as a result of the mixing of lithologies associated with it (Figure F4). The most deformed interval in this subunit occurs between ~6 and 35.8 mbsf (Figure F6; Table T3). Toward the bottom of the subunit, the strata appear more regular (see Structural geology). Smaller depositional units alternate with the background (host) sediment of more or less laminated olive-brown silt-bearing diatom clay. The former are often characterized by light olive-gray diatom-rich clayey silt intervals capped by lighter colored diatom oozes and scoured bases that also contain coarser silt and sand grains (Figure F6). A thicker depositional unit was observed between Sections 385-U1550A-2H-4 and 2H-7 (i.e., ~10 and ~16 mbsf) with a gradational shift from clay (low MS and NGR) to sand (high MS and NGR) at the base (Depositional Unit T2; Table T3). In both Holes U1550A and U1550B, the subunit is marked by a lithologically complex interval that can be correlated between the two holes; it includes a remarkably large concentration of silt- (ash) to granule-sized (lapilli) scoria fragments (Sections 385-U1550A-5H-1 and 5H-2 [~34.3–37.3 mbsf] and 385-U1550B-7H-6 [~61–62 mbsf]) (Figure F7). The host sediments include clay-rich diatom ooze and small depositional units composed of olive-gray and gray diatom-rich silty clay and intervals of olive-black sand showing scoured bases and minor foraminiferal sand. Shells and shell fragments are common through the subunit.

4.1.1.2. Subunit IB
- Intervals: 385-U1550A-10H-CC, 24 cm, to 16F-CC, 24 cm; 385-U1550B-11H-4, 110 cm, to 385-U1550B-17F-1, 0 cm
- Depths: Hole U1550A = 91.74–129.29 mbsf, Hole U1550B = 94.53–128.7 mbsf
- Thickness: Hole U1550A = 37.55 m, Hole U1550B = 34.17 m
- Age: late to middle Pleistocene
- Lithology: clay-rich diatom ooze, diatom ooze, diatom clay, nannofossil-rich diatom clay, silt, sandy silt, and sand
Subunit IB is mainly composed of varying proportions of diatoms, clay, and silt with sand occurring mainly as a secondary component. The upper two cores in Holes U1550A and U1550B (Cores 11H and 12H) contain a very distinctive, ~18 m thick homogeneous interval characterized by relatively low values of NGR and MS and composed of olive-green diatom clay mixed with variable amounts of nannofossils. The interval is underlain by silty sand and sandy silt forming Depositional Unit T4 in Core 13H (Table T3). This lithologic change corresponds to an increase in both MS and NGR. The depositional unit shows extensive folding, including concentric folds that are generally consistent with the contrasting rheologies expected for the observed alternating sand and diatom clay lithologies. The lowermost part of Subunit IB is mainly diatom clay mixed with different proportions of silt and nannofossils. Soft-sediment deformation is especially evident when coarser grained silty or sandy silt laminae are present (see Structural geology).
The bottom of this subunit marks the depth (~130 mbsf in Holes U1550A and U1550B) at which it is no longer possible to correlate the two holes and, as explained below, some of the lithologies found in Hole U1550A below this depth are not found in Hole U1550B.
4.1.1.3. Subunit IC
- Intervals: 385-U1550A-16F-CC, 24 cm, to 32X-1, 27 cm; 385-U1550B-17F-1, 0 cm, to 23X-1, 114 cm
- Depths: Hole U1550A = 129.29–206.97 mbsf, Hole U1550B = 128.7–173.34 mbsf
- Thickness: Hole U1550A = 77.68 m, Hole U1550B = 44.64 m
- Age: late to middle Pleistocene
- Lithology: micrite-rich diatom clay, micrite, micrite-rich silty sand, limestone/dolostone, clayey siltstone, and mafic igneous rock
As mentioned above, the sedimentary part of Subunit IC cannot be correlated between holes, suggesting local stratigraphic complexity at a lateral scale of 50 m. This subunit includes sediments and sedimentary rocks with a thin interval of igneous rocks intersected at its very base (see Igneous petrology and alteration).
In Hole U1550A, the top of this subunit corresponds to the uppermost appearance of carbonates (micrite/nodules) and a change in sediment color. The host sediment is mainly dusky yellowish brown diatom clay alternating with dark yellowish brown micrite-rich diatom clay. Micrite also occurs in lighter colored patches or as cement in coarser grained lithologies such as sandy siltstone beds. Folding and tilting are also present. An organic matter–rich, black-olive clayey silt layer was observed in both holes (Sections 385-U1550A-19F-2 [~133.5 mbsf] and 385-U1550B-20X-4 [~155.4 mbsf]), but it is not clear whether they are correlative or different deposits. Coarser grained beds and depositional units showing fining-upward grain sizes and coarser sandy bases are also present (Figure F6E–F6F). Pebble-sized carbonate nodules are also common, although the majority are probable fall-ins from shallower intervals (see Lithostratigraphy in the Expedition 385 methods chapter [Teske et al., 2021a]). In Hole U1550A, carbonate intervals were not observed below ~135.9 mbsf (Core 22X), whereas in Hole U1550B they were limited to below ~153 mbsf (Cores 20X and 21X).
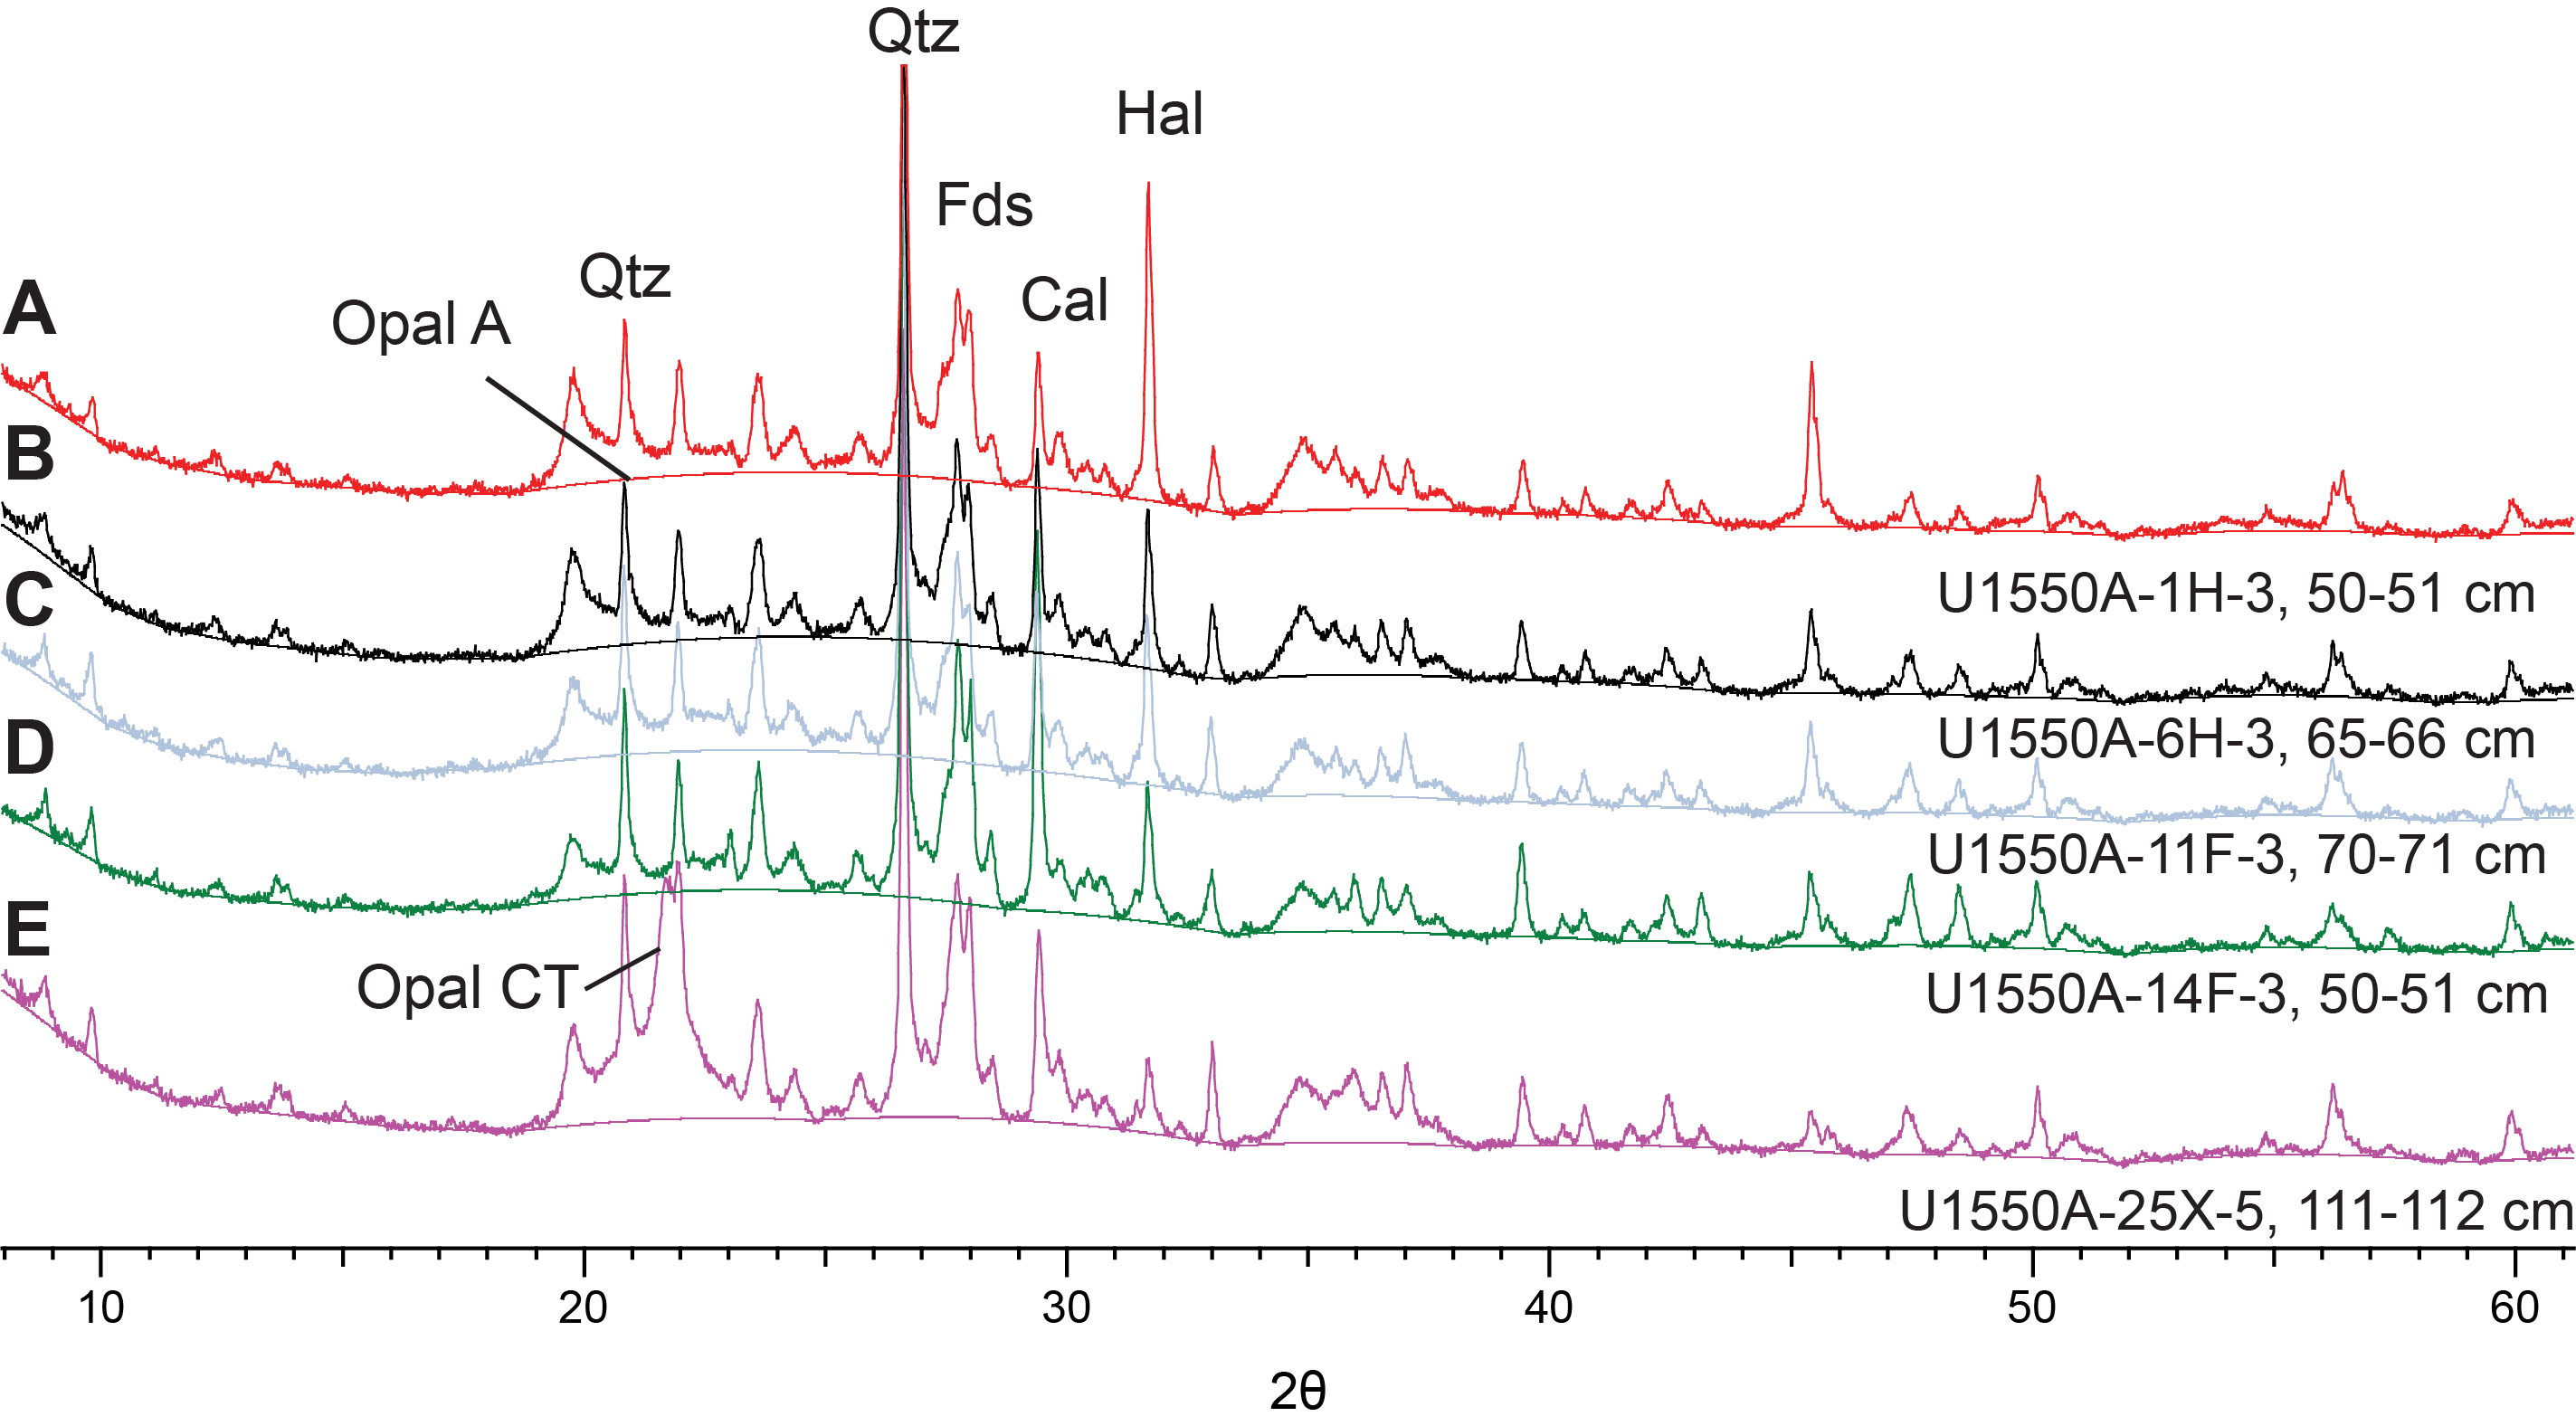
Between ~141.7 and ~160.4 mbsf in Hole U1550A (Cores 23X and 24X), the main lithology is dark yellowish brown silty clay mixed with a variable abundance of diatoms (from rich to absent) and locally alternating with sporadic graded silty sand layers. Low diatom abundance and preservation also agree with micropaleontological observations (see Biostratigraphy). The variability in diatom content is probably a consequence of silica diagenesis and the transition from opal-A to opal-CT, which, according to the XRD mineralogic data, could start in Core 25X (~161 mbsf; Figure F8). The dominant sedimentary lithology at the bottom of Hole U1550A above the igneous rocks is dark yellowish brown biscuited homogeneous siliceous claystone and silty siliceous claystone with occasional graded silty sand layers that have higher MS values. A higher concentration of siliciclastic silt component characterizes Core 27X, which is composed of silt-rich siliceous claystone with a laminated/folded interval in Section 27X-4. Finally, in the lowermost interval (~200.2–201 mbsf) of sediments above igneous rock, the color of the siliceous claystone is very dark, possibly as consequence of recrystallization and enhanced silica diagenesis at the contact zone. XRD analyses confirmed the occurrence of quartz, cristobalite, pyrrhotite, and clay minerals in Section 29X-1.
In Hole U1550B, Subunit IC consists of only three cores (17F–19X, ~128.7–145.5 mbsf) that are mainly composed of more or less organic-rich dark yellowish brown homogeneous diatom clay. Subordinate coarser lithologies, including layers of silt and sand, occur interspersed with the main lithology and show evidence of soft-sediment deformation (tilting and folding) and carbonate authigenesis, as indicated above. The igneous contact was not recovered intact, only represented by recovered fragments of clayey siltstone and altered basaltic rock in Core 21X.
4.2. Discussion
The sediments recovered at Site U1550 display a variety of sedimentary features, including graded beds with scoured bases ranging from a few centimeters to several meters thick, tilted and/or folded beds or laminae, and chaotic fabric, that together are direct evidence that deposition at this site occurred mainly by means of mass-gravity flows ranging from hybrid to debris flows. Four of these gravity flows are several meters thick (T1–T4 in Table T4), have a relatively thin coarser grained base, and show normal grading, whereas the majority of the bed is homogeneous. These observed sedimentologic characteristics suggest that these deposits are the product of hybrid flows (mixture between debris flows and turbidity flows). Three of these hybrid-flow beds can be correlated between the two holes with intervening chaotic or deformed intervals, which suggests that slumping and chaotic sedimentation alternated with periods of “normal” deposition. In a tectonically active basin such as Guaymas Basin and under the influence of large terrestrial sources of riverine sediments (i.e., the Yaqui River), large flood events and seismic activity can be key factors in increasing terrigenous inputs to the basin, triggering submarine landslides or slumps, and promoting reworking and resedimentation from mass-gravity flows.
Only ~70 m or about one-third of the record from Hole U1550A could be correlated to the record from Hole U1550B. The lack of correlation stems from either the lateral discontinuity of some of the depositional bodies (in particular the highly deformed intervals) and/or missing sections because of microbiological/geochemistry sampling. Another difference between the holes, which are only ~51 m apart, is the depth at which igneous rocks were encountered, which was ~34 m shallower in Hole U1550B (~170 mbsf) compared to Hole U1550A (~204 mbsf; Table T3). DSDP Leg 64 Shipboard Scientists also noted the presence of gravity-flow deposits at Site 481 (Shipboard Scientific Party, 1982); therefore, future correlation of the uppermost section across holes may be possible.
5. Igneous petrology and alteration
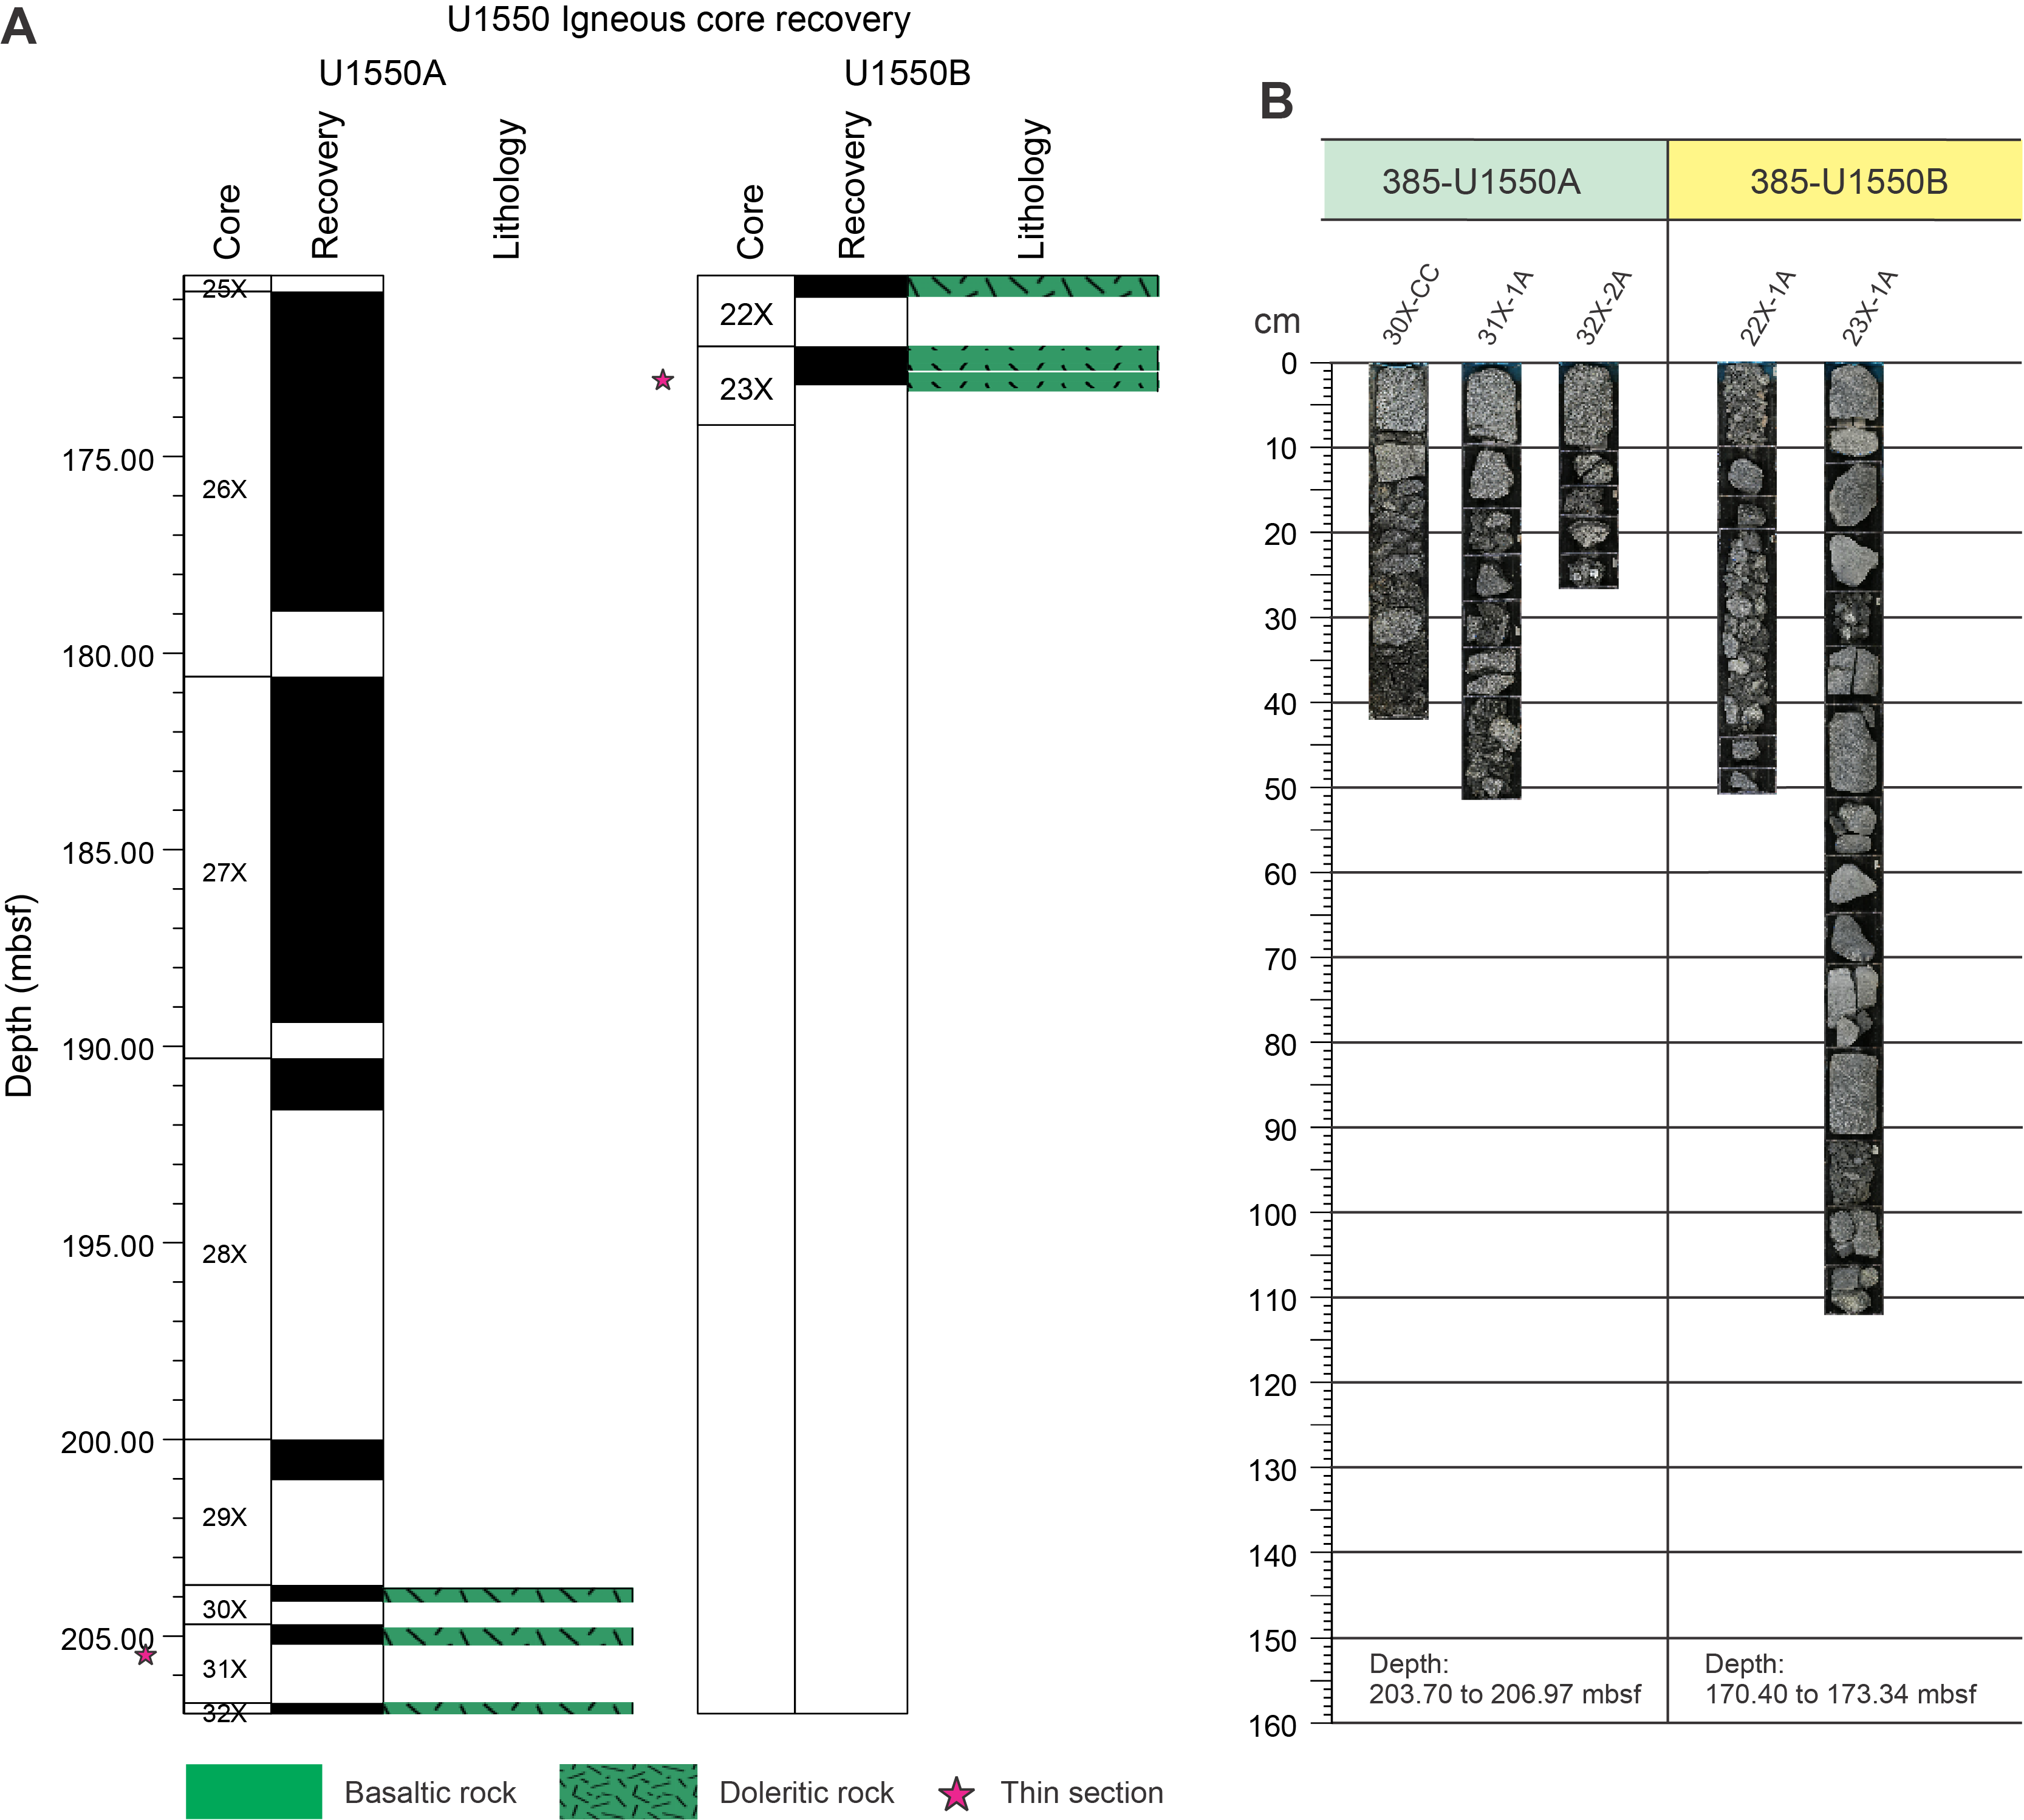
Igneous rock was recovered in both holes at Site U1550 using the XCB system. The total thickness of the intersected basaltic and doleritic rock is 3.27 m in Hole U1550A and 2.94 m in Hole U1550B, and the top depths are 203.70 and 170.40 mbsf, respectively. Neither hole reached the bottom contact with the underlying sediment. The igneous rock intervals intersected in each hole are part of intrusive bodies that were emplaced within silt-rich siliceous claystone and diatom clay and make up Lithostratigraphic Subunit IC in Holes U1550A and U1550B. Thus, the intrusion has been stratigraphically assigned to Subunit IC and designated Igneous Lithologic Unit 1. Igneous recovery plots and the length of recovered sections from Site U1550 are shown in Figure F9.
5.1. Igneous Lithologic Unit 1 (Lithostratigraphic Subunit IC)
- Interval: 385-U1550A-30X-CC, 0 cm, to 32X-1, 27 cm
- Depth: 203.70–206.97 mbsf
- Thickness: 3.27 m (cored)
- Recovery: 1.19 m (36%)
- Lithology: doleritic hypabyssal igneous rock
- Age: middle Pleistocene or younger (younger than 0.29 Ma)
- Interval: 385-U1550B-22X-1, 0 cm, to 23X-1, 114 cm
- Depth: 170.40–173.34 mbsf
- Thickness: 2.94 m (cored)
- Recovery: 1.55 m (53%)
- Lithology: plagioclase phyric basaltic and doleritic hypabyssal igneous rock
- Age: middle Pleistocene or younger (younger than 0.29 Ma)
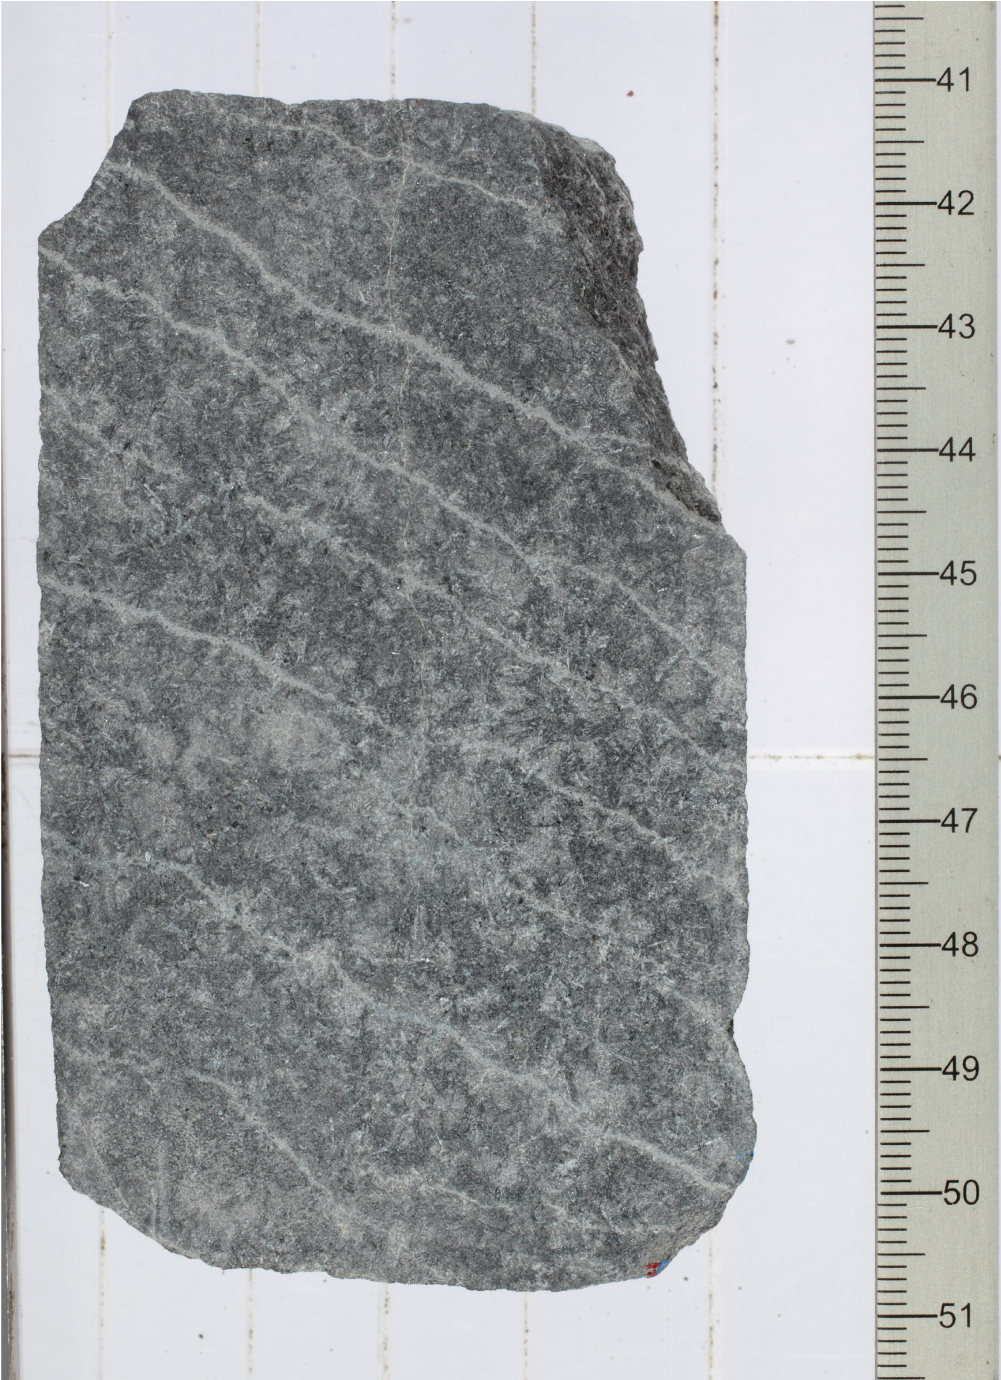
In Hole U1550A, hypabyssal igneous rock was recovered from a top depth of 203.70 m to the curated bottom core depth of the hole at 206.97 mbsf, underlying very dark brown siliceous claystone. The dark color of the claystone could be an indication that the contact zone between sediment and sill was recrystallized and silicified by thermal overprint (see Lithostratigraphy). The sill material, which was observed in three cores (385-U1550A-30X through 32X, consisting of one section each), is solely composed of mafic rock with doleritic texture showing a modal composition of 70 vol% plagioclase, 25 vol% pyroxene, and 5 vol% accessory minerals (mostly Fe oxide minerals) in a subophitic matrix. Slight variation was observed in terms of textural appearance. Slightly altered doleritic rock in Section 30X-CC is porphyritic and sparsely vesicular and shows rounded to subrounded vesicles filled with chlorite (90 vol%) and carbonate (10 vol%) (Figure F10D). In contrast, porphyritic doleritic rock recovered in Sections 31X-1 and 32X-1 is nonvesicular and less altered. The groundmass size of dolerite varies from fine grained (0.2–1 mm) in Section 30X-CC to medium grained (1–2 mm and 2–4 mm, respectively) in Sections 31X-1 and 32X-1 (Figure F10E–F10F). Interval 32X-1, 10–23 cm, comprises doleritic rock of much lighter color (white tone), which could be due to a higher abundance of plagioclase. This interval contains a horizontally running black sedimentary vein of baked clay (Figure F10A).
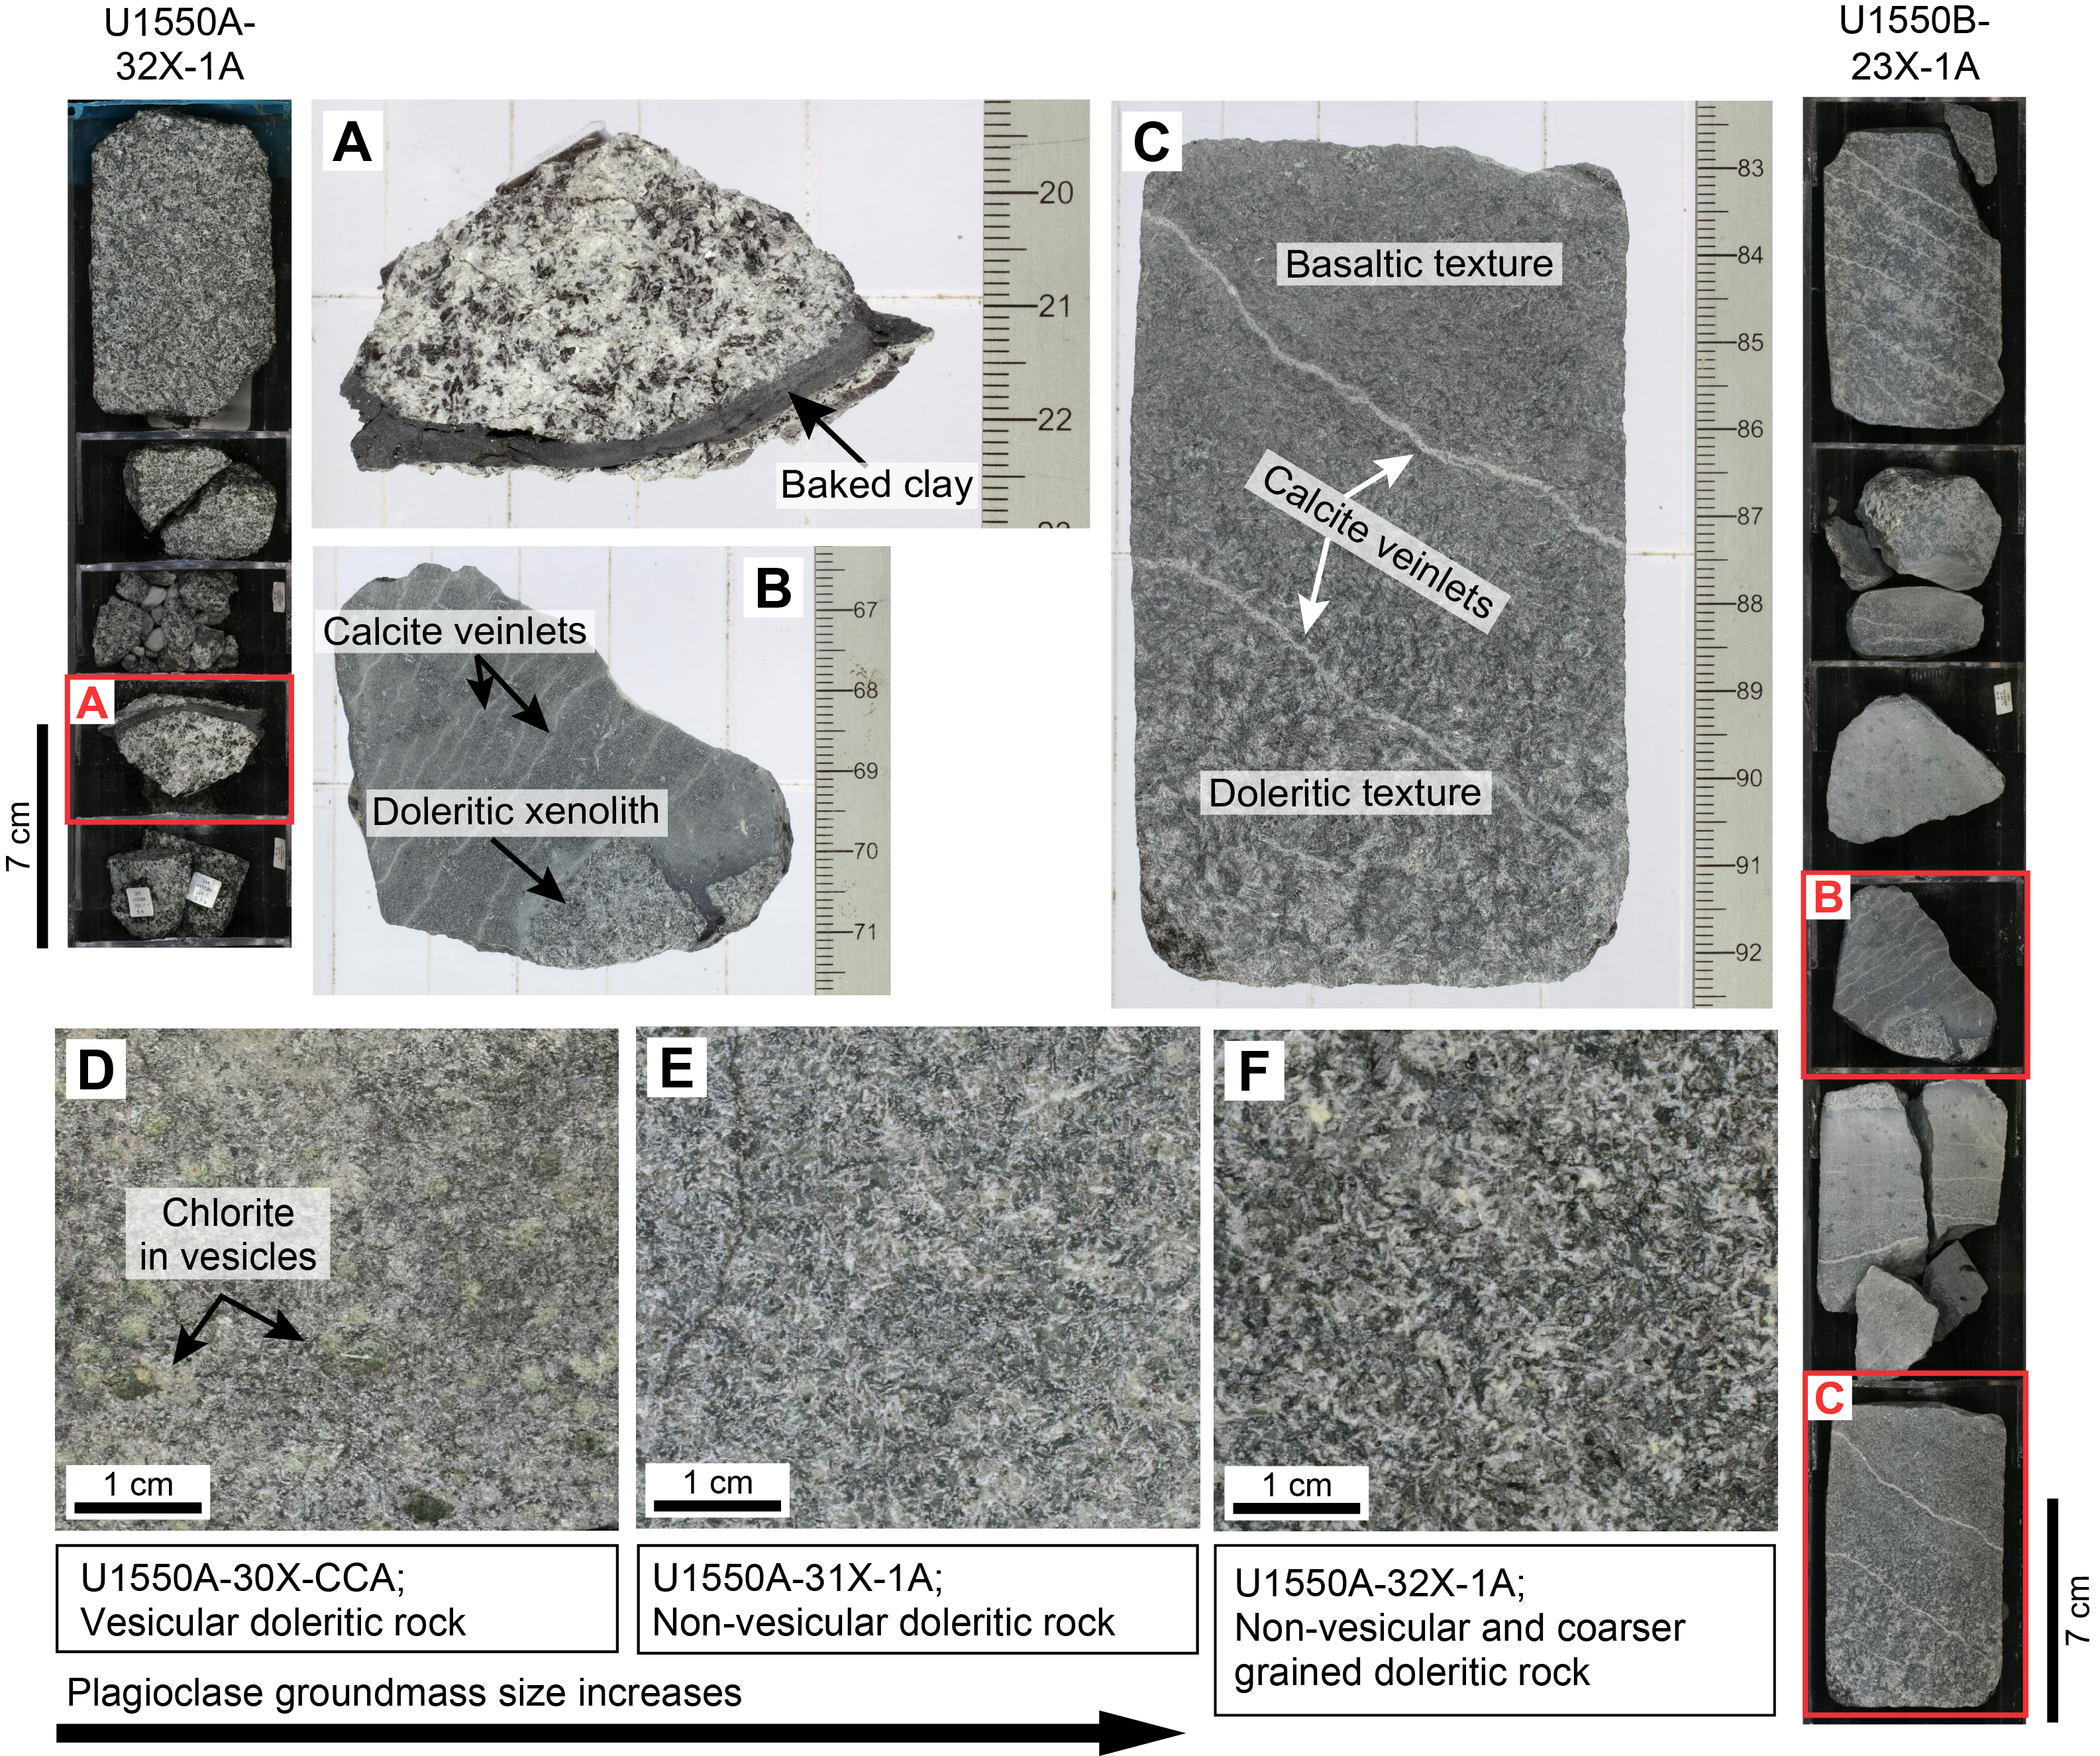
In Hole U1550B, igneous rock was recovered in Sections 22X-1 and 23X-1. The former consists of slightly altered doleritic rock with subophitic texture showing a high degree of drilling-induced fragmentation. Moderately plagioclase phyric (15%–20 vol%) basaltic rock in Section 23X-1 contains intervals (~15 mm in diameter) with doleritic texture and sharp contact between both textures (Figure F10B). The change in grain size from basaltic to doleritic texture can also be gradational (Figure F10C). Among the doleritic intervals in both sections, composition and texture do not vary significantly. Multiple parallel-trending calcite veins are also present in both basaltic and doleritic rock intervals (Figure F10B–F10C).
5.2. Petrographic description
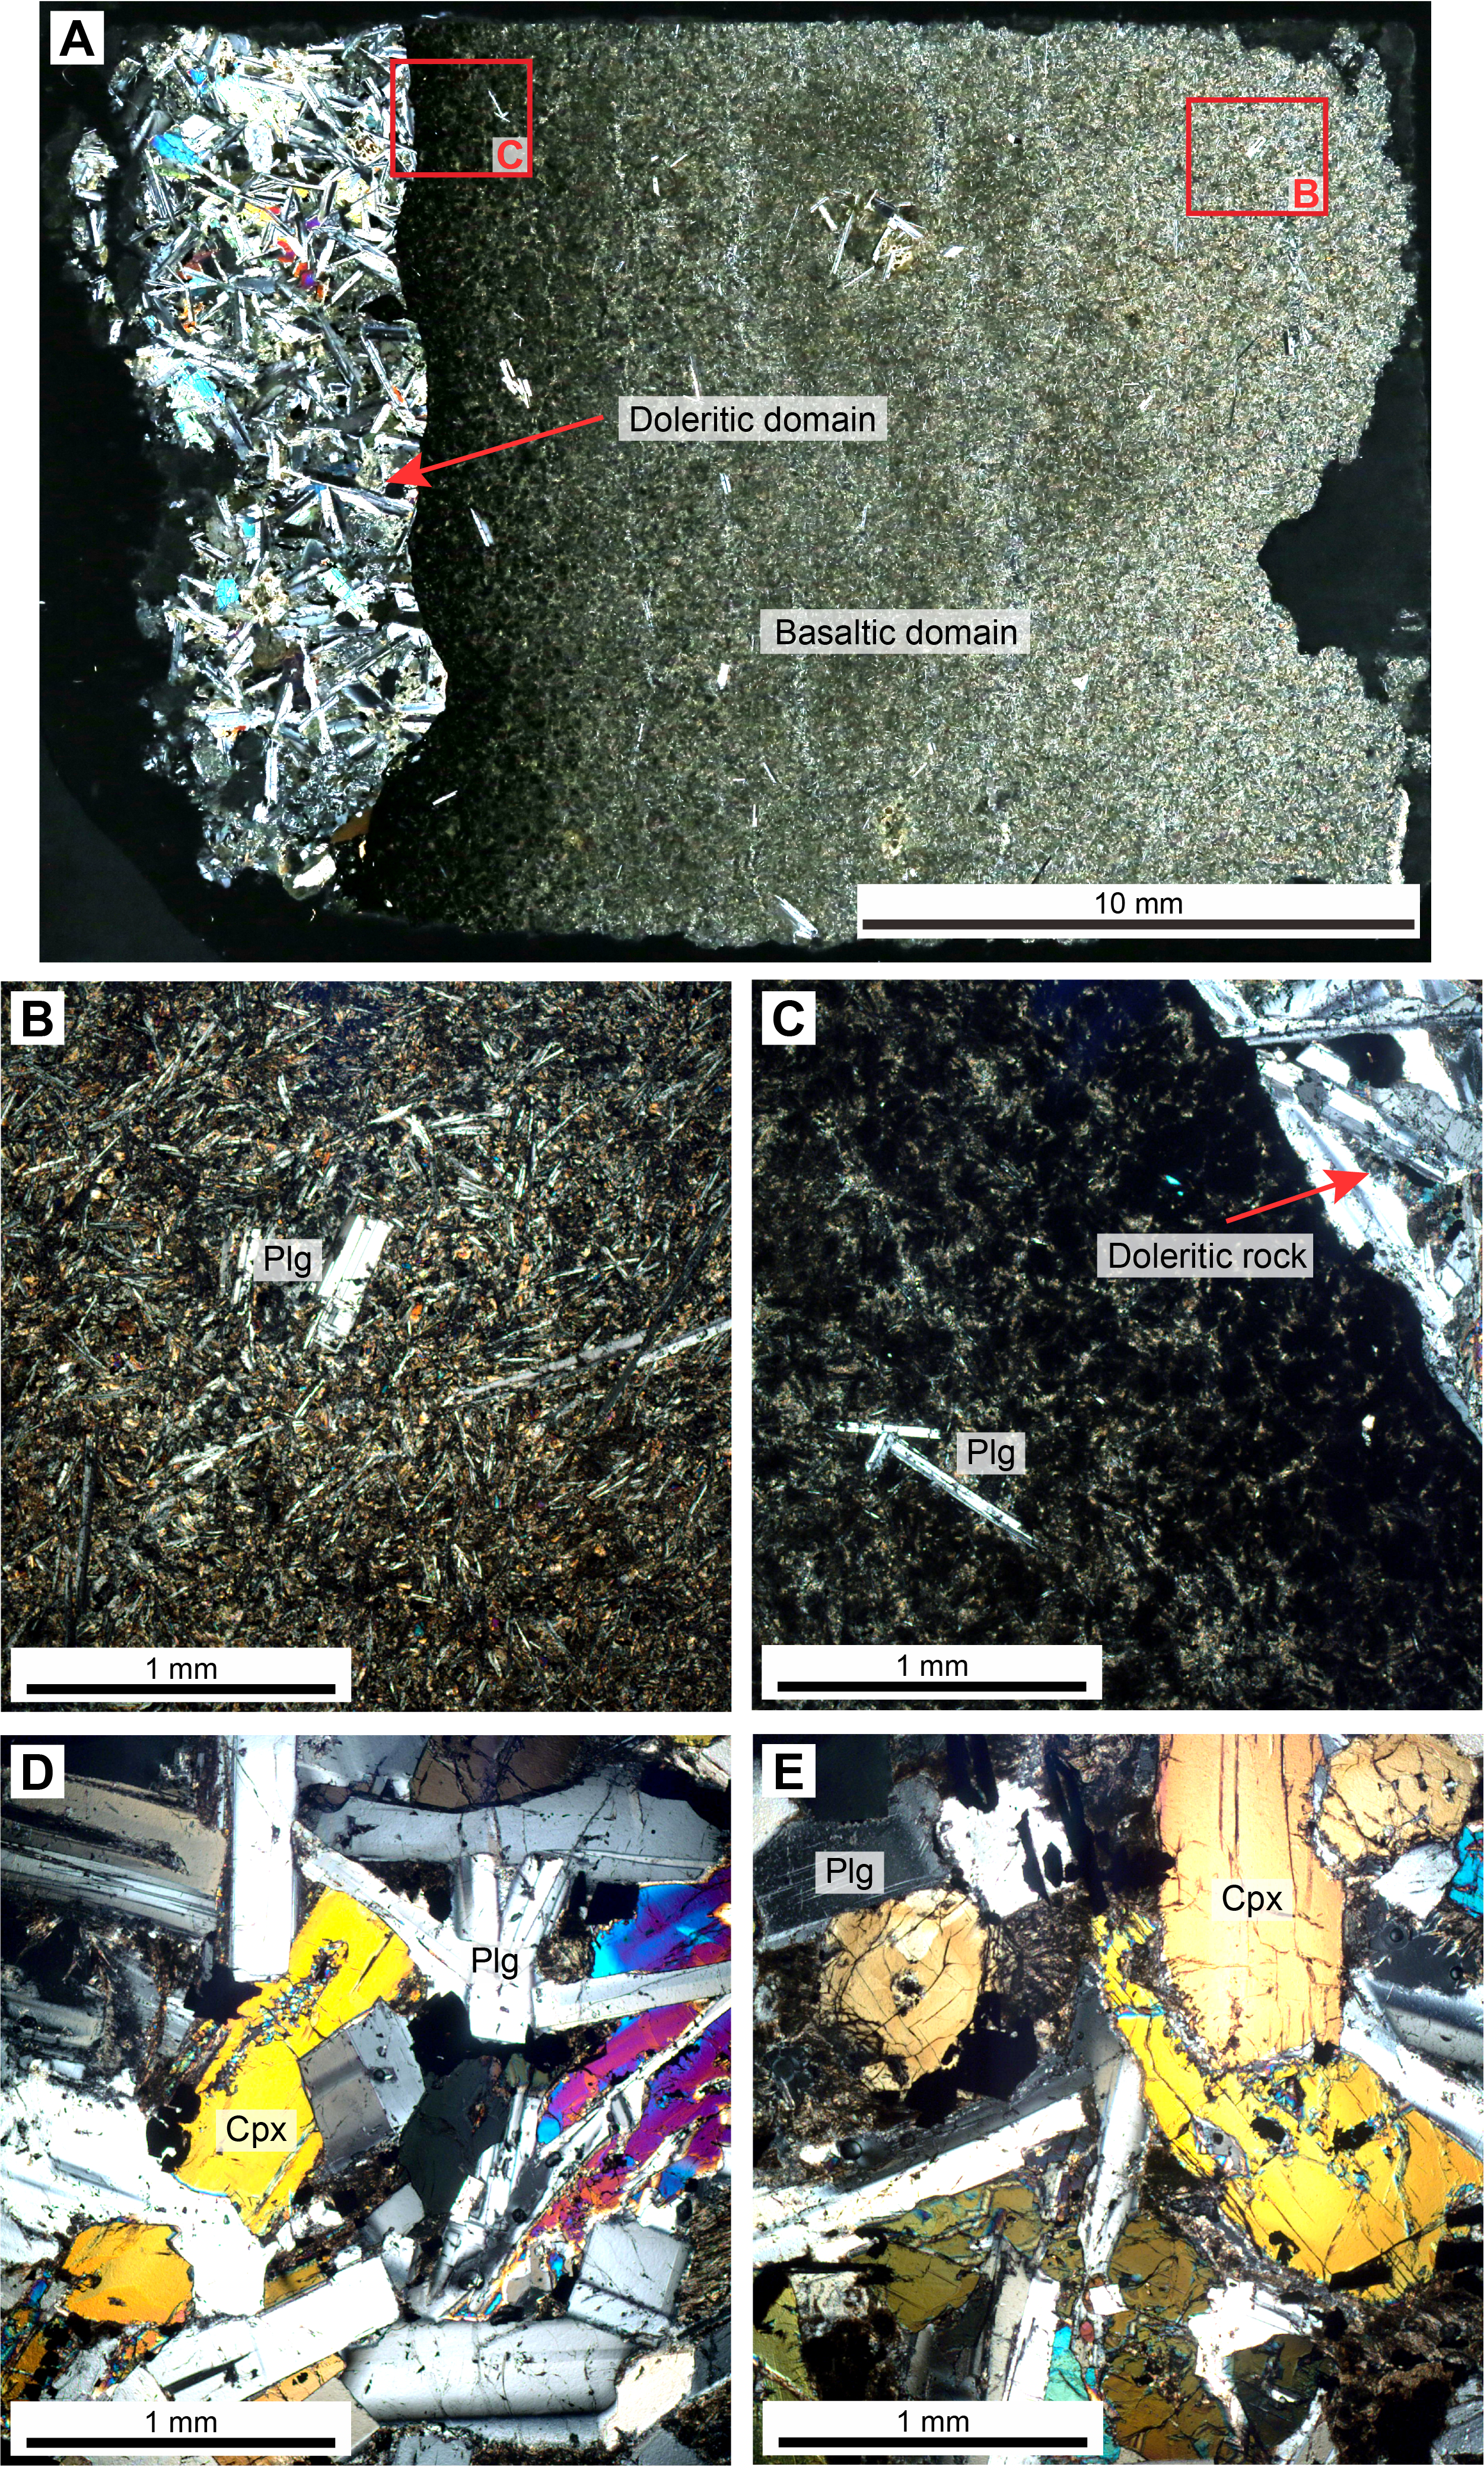
At the microscopic scale, doleritic and plagioclase phyric basaltic rocks show a well-preserved primary igneous mineral assemblage (plagioclase, clinopyroxene, and Fe-Ti oxides) and a range of microtextures (such as porphyritic, subophitic, and intersertal) (Figure F11). Euhedral acicular and lath-shaped plagioclase is the dominant phenocryst mineral (2–20 vol%; 1–4 mm in size) in the gray porphyritic basaltic rock. The felty equigranular to inequigranular, microcrystalline groundmass shows euhedral to subhedral acicular plagioclase (50–60 vol%) and subhedral stubby pyroxene crystals (30–40 vol%). The gray to greenish gray doleritic rock shows equigranular to inequigranular grain size distribution with fine- to medium-grained crystals (1–4 mm). It is generally composed of 60–70 vol% plagioclase, 30–40 vol% clinopyroxene, and 1–3 vol% Fe-Ti oxides. Plagioclase mostly occurs as narrow, elongated prismatic crystals in subophitic relationship with subhedral clinopyroxene.
5.3. Alteration and veins
Doleritic rock–hosted clinopyroxene is recognizable by pseudomorphs composed of chlorite, carbonates, and mesh textures of clay minerals and fine-grained magnetite. In contrast, plagioclase is fresh or slightly seritized, resulting in overall slight alteration (Figure F11D–F11E). Overall, the porphyritic basaltic rock is moderately to highly altered. Plagioclase crystals from both phenocrysts and groundmass are slightly to moderately altered to sericite, whereas clinopyroxene in groundmass is usually partially or completely altered to chlorite and fine-grained secondary magnetite (Figure F11B–F11C). In Hole U1550A, one black, ~4 mm thick vein is present in interval 32X-1, 19–23 cm, and is filled with baked clay material. In Hole U1550B, many <1 mm wide, white veinlets are steeply dipping and run parallel to each other (Figure F10B–F10C). They are probably filled with carbonates. No halos were observed surrounding these veins.
5.4. Petrographic discussion
Guaymas Basin encompasses two spreading segments with axial troughs that overlap at their segment boundaries (Figure F1). Site U1550 was drilled just north of the overlapping portion of the northern trough, and Hole U1550B lies just ~51 m east-southeast of DSDP Site 481, where a complete section was drilled through three igneous sills to ~380 mbsf (Shipboard Scientific Party, 1982). The dominant igneous lithology recovered at Site U1550 is doleritic rock, but sparsely to moderately plagioclase phyric basaltic rock also appears at different intervals. There is both sharp and gradational change in grain size from basaltic to doleritic texture (Figure F10). The presence of doleritic rock (<2 cm) enclosed by basaltic rock seems to represent a xenolithic or commingling assemblage. The relatively small size of the doleritic parts entrapped and low percentage of recovery of doleritic rock toward the bottom of Hole U1550B (there was no attempt to core through encountered sills at Site U1550) makes any speculation about the relationship of the basaltic rock–hosted doleritic intervals unwarranted at this time. We therefore leave this for postexpedition research to investigate. The samples also contain multiple, slightly dipping calcite veinlets trending parallel to each other, which may be indicative of the flow direction of the hydrothermal fluid that led to the carbonate precipitation.
5.5. Geochemistry
Two inductively coupled plasma–atomic emission spectroscopy (ICP-AES) analyses (see Inorganic geochemistry in the Expedition 385 methods chapter [Teske et al., 2021a]) were obtained from the Site U1550 sill. These are slightly altered samples representing doleritic rock from one interval each in Hole U1550A (31X-1, 40–52 cm; top depth = 205.1 mbsf) and Hole U1550B (22X-1, 20–45 cm; 170.6 mbsf) (Table T5). Their SiO2 and Na2O + K2O compositions narrowly range from 48.7 to 48.9 wt% and from 3.59 to 3.75 wt%, respectively, showing a subalkaline basalt chemistry (Figure F12; Table T5). These are low-K tholeiitic rocks (K2O = 0.25–0.35 wt%; Table T5) whose Ti-V pattern points to a MORB composition (Figure F13). The tholeiitic character of these rocks is corroborated by a relatively high FeO*/MgO value of 1.44–1.46 (Table T5). They have a Mg# of 0.55 in common, implying a solidification from a slightly evolved melt that had likely already undergone some fractionation (Figure F14; Table T5). The abundances of lithophile elements (e.g., Na, K, and Sr) (Figures F12, F14A) and high field strength elements (HFSE) (e.g., Ti and Zr) (Figures F13, F14B) are within the range of the other Guaymas Basin sites drilled during Expedition 385. The abundance of Sr is somewhat lower at the on-axis Site U1550 (Figure F14A), although its content of highly incompatible trace element Zr is somewhat higher at a given Mg# (Figure F14B) compared to the similarly evolved magmas of the off-axis, northwestern rift flank ~50 km distant (Site U1546). Strongly resembling the behavior of Zr, the highly incompatible trace element Y is also more enriched in the northern rift segment compared to the far off-axis location (Figure F15). Overall, Site U1550 shows the highest contents of the highly incompatible HFSE among all Expedition 385 igneous rock samples except for one more differentiated sample from off-axis Site U1547 (Figures F13, F14B). In contrast, hypabyssal rocks from Site U1550 have the lowest Sr abundance compared to the other Expedition 385 sites (Figure F14A).
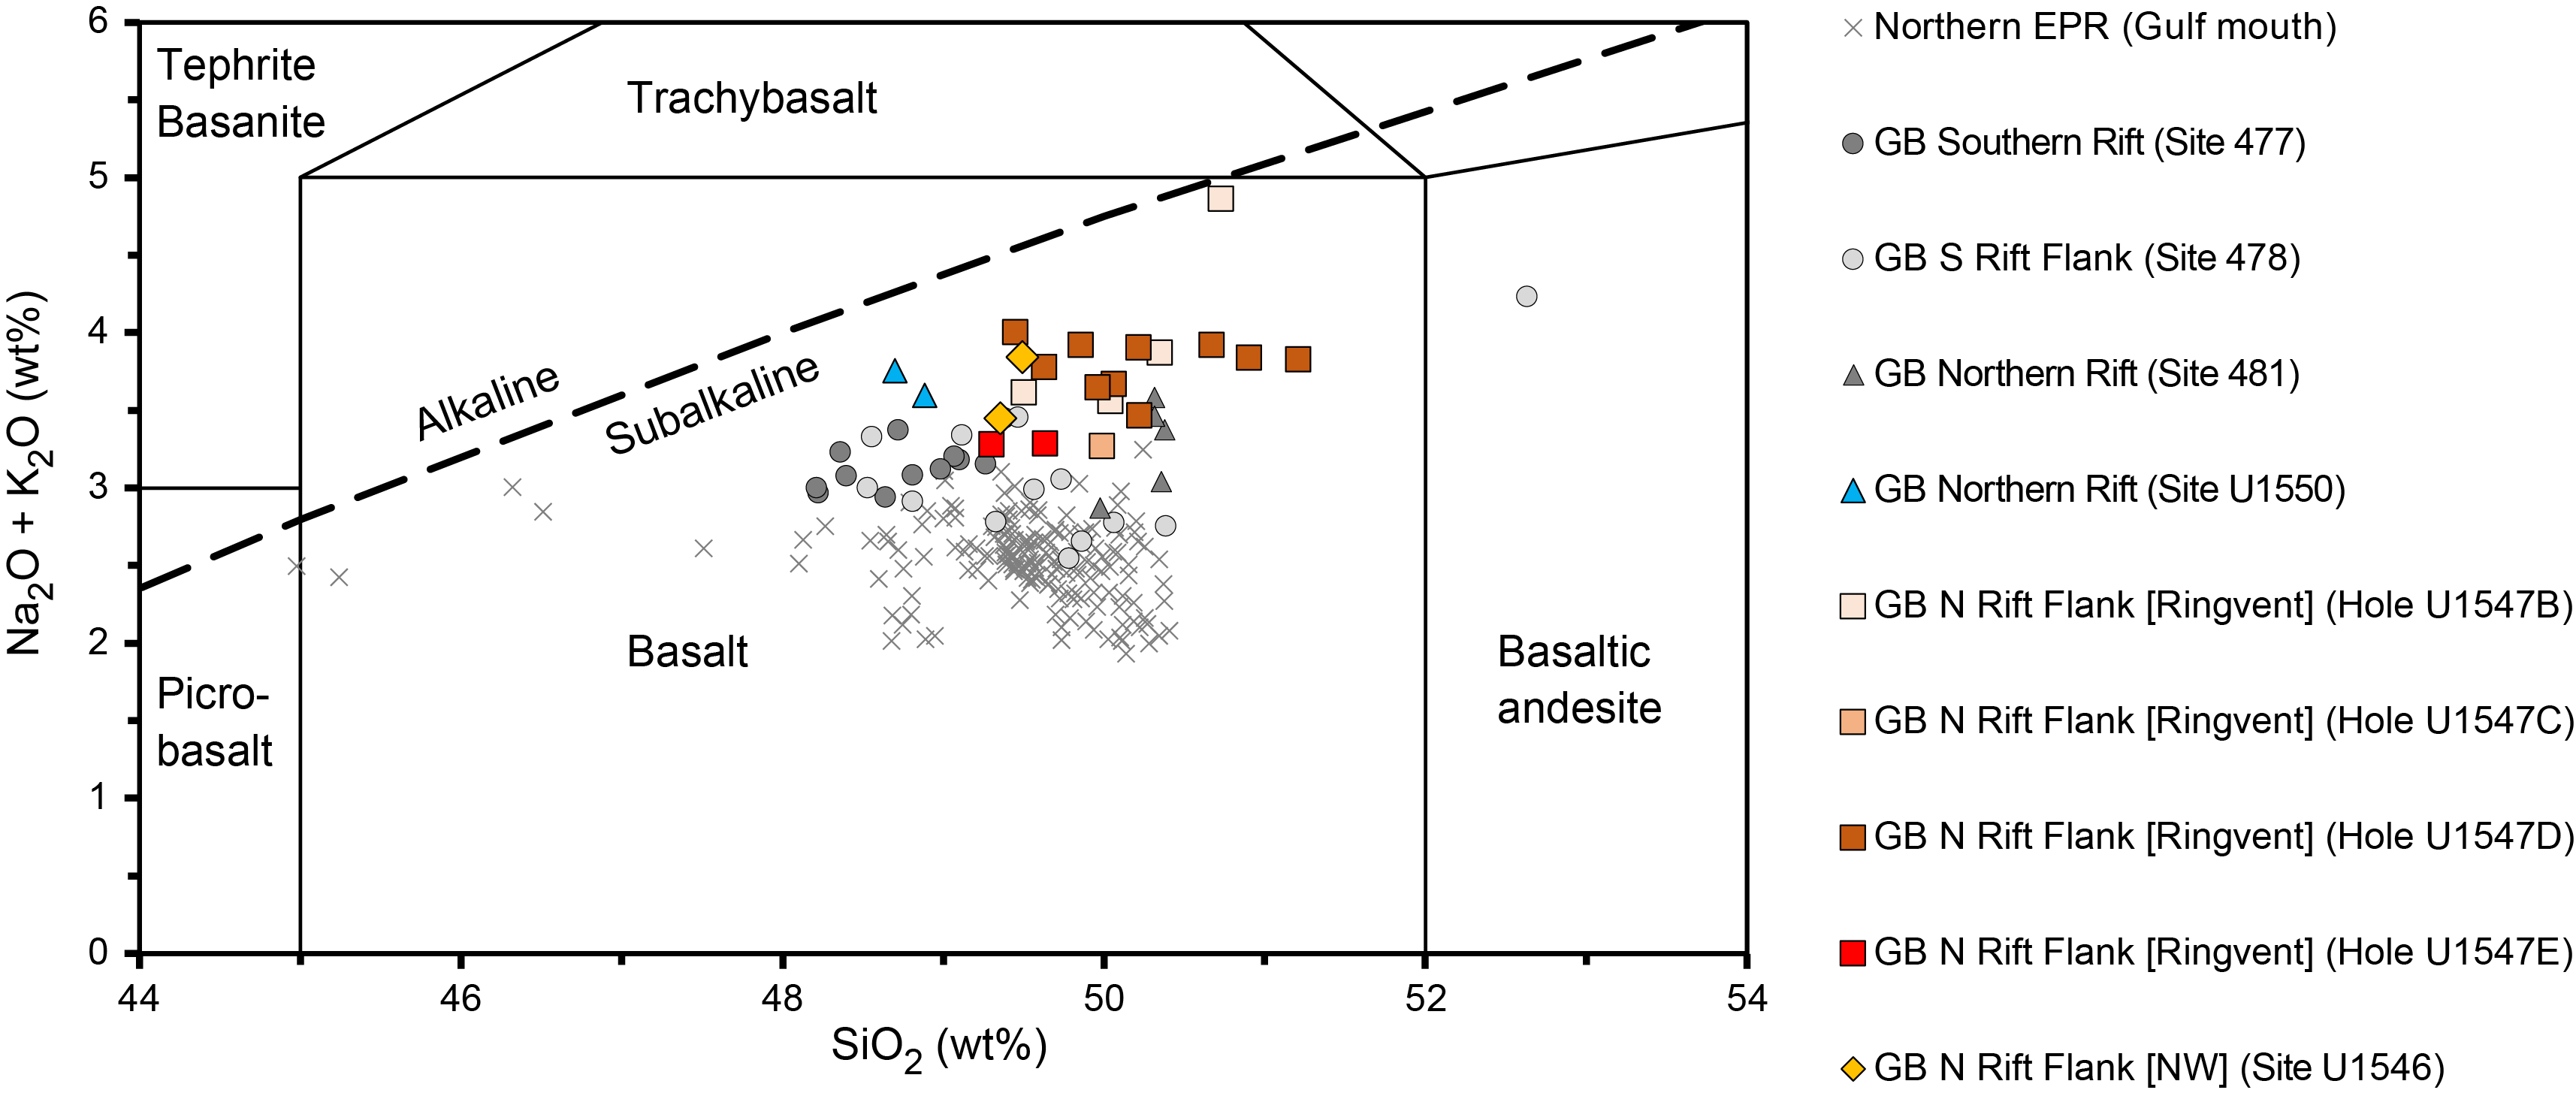
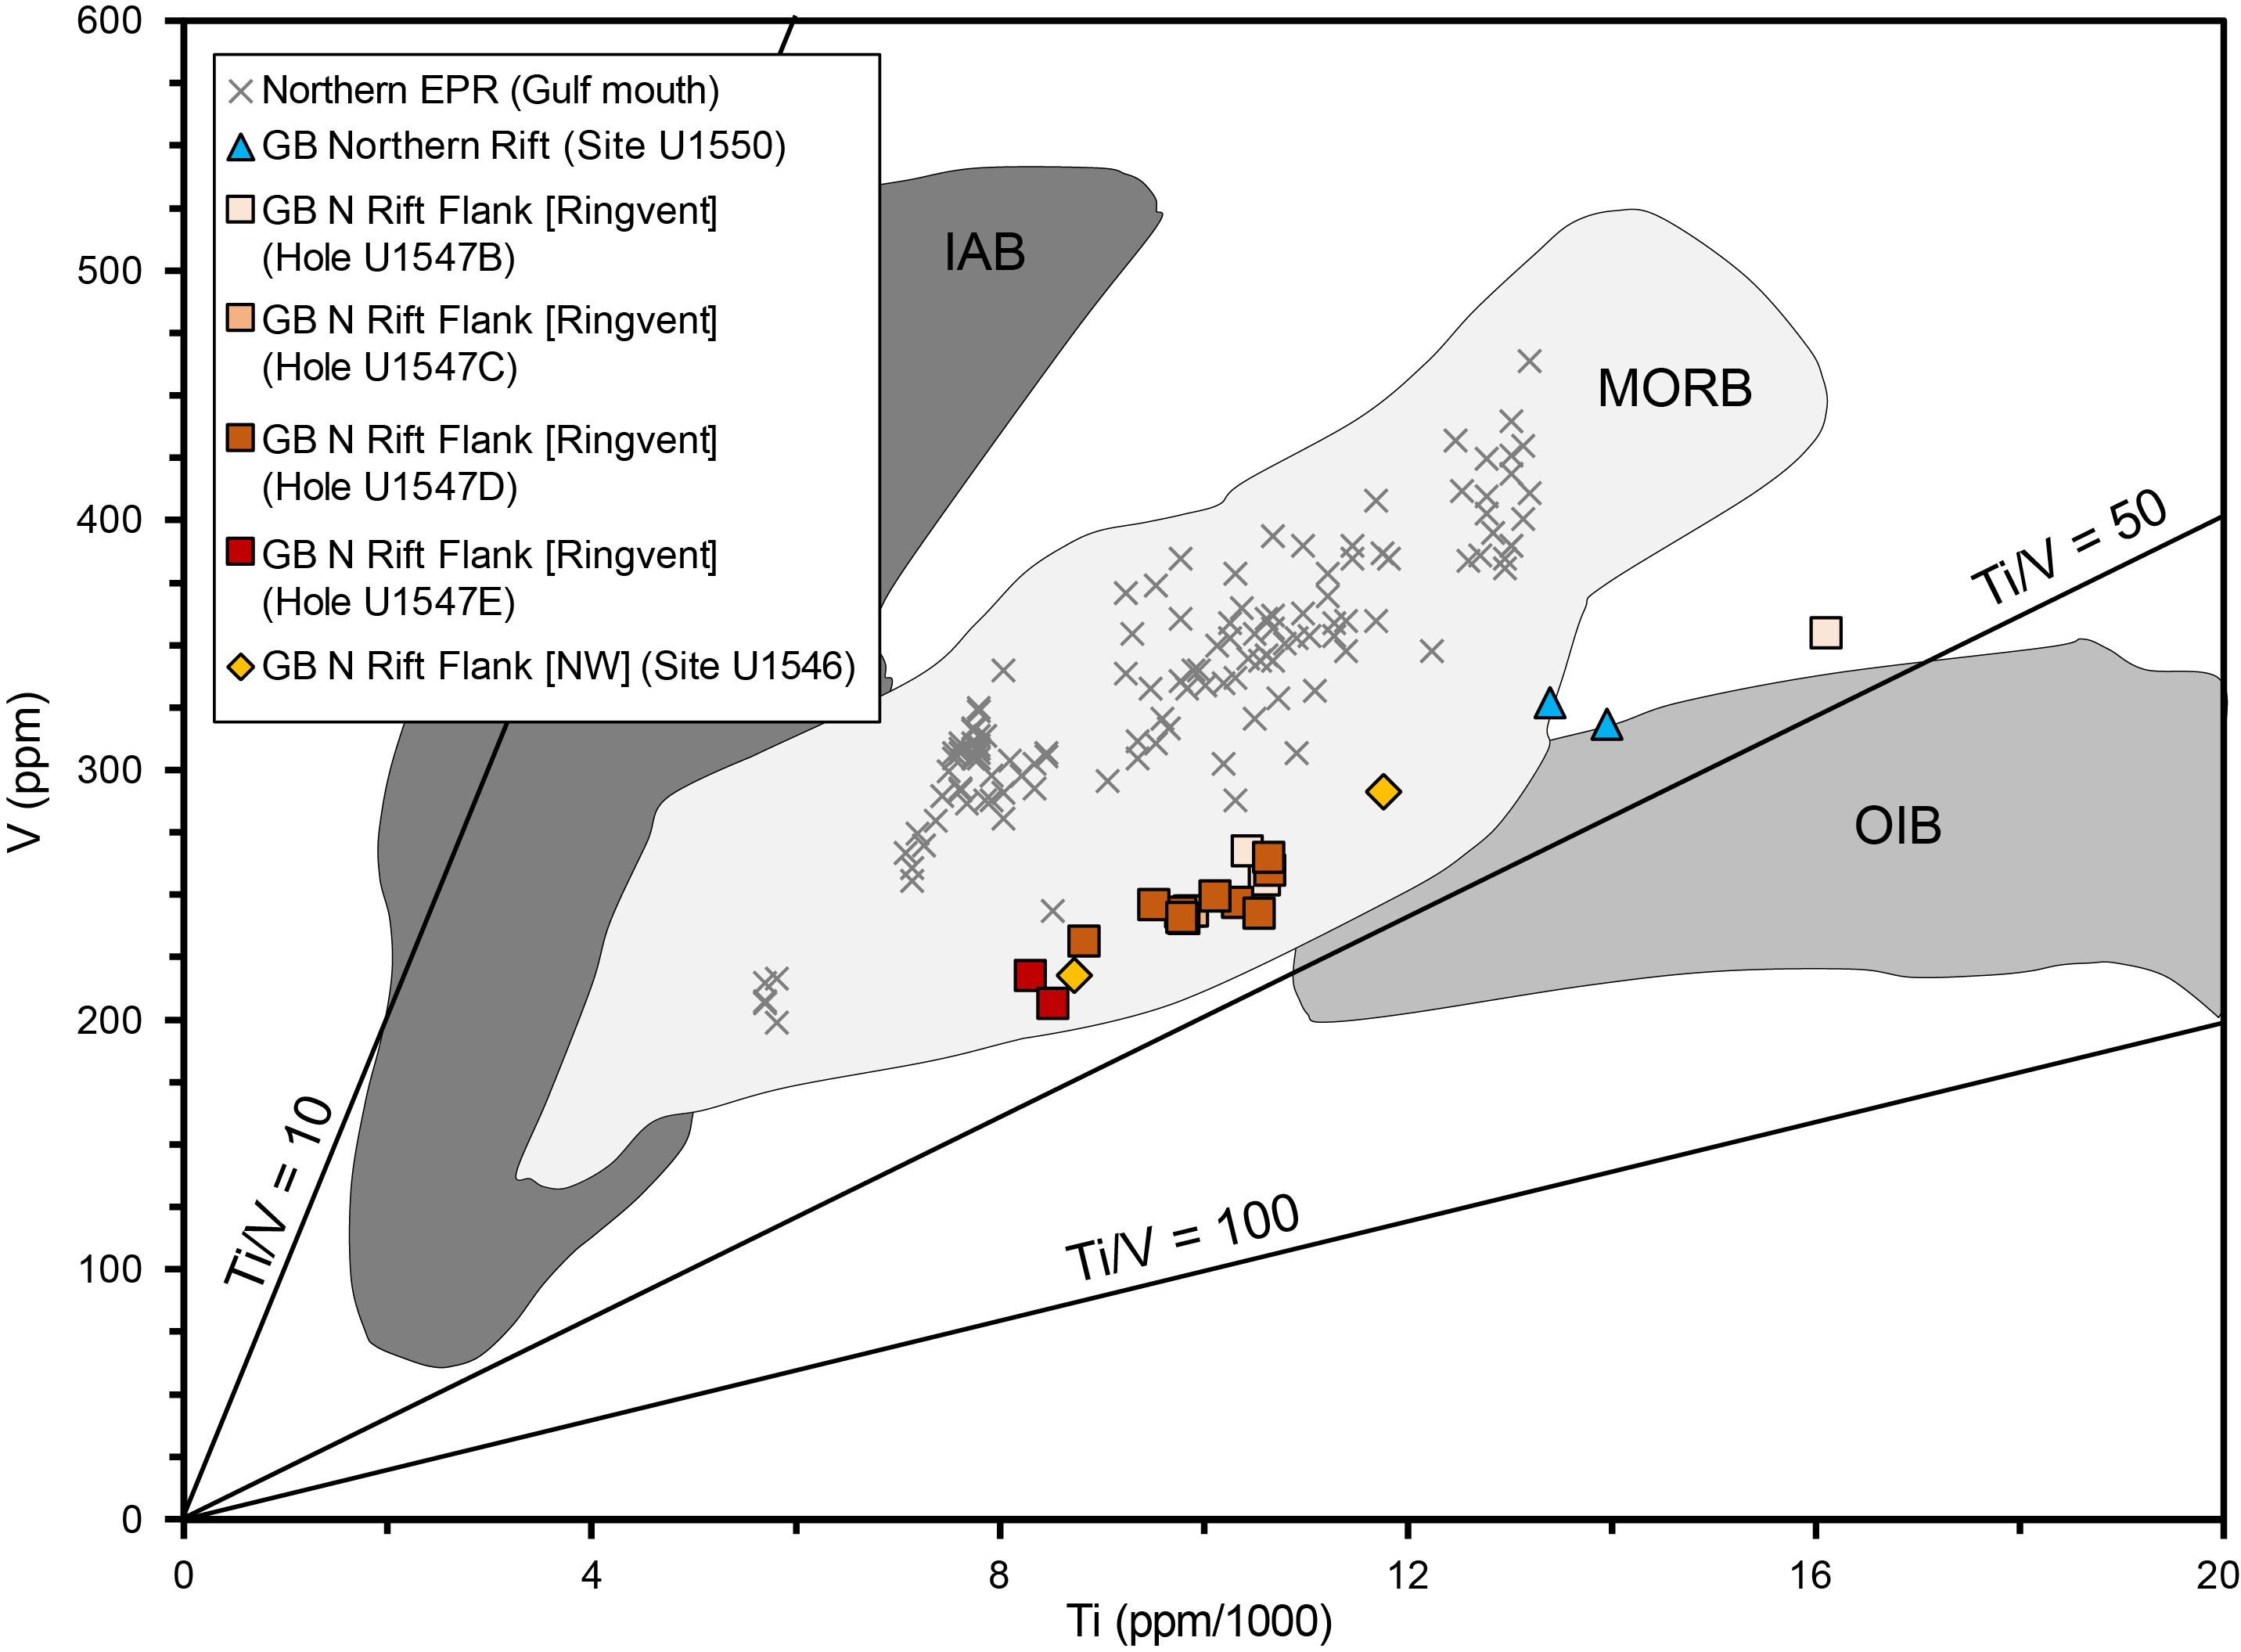
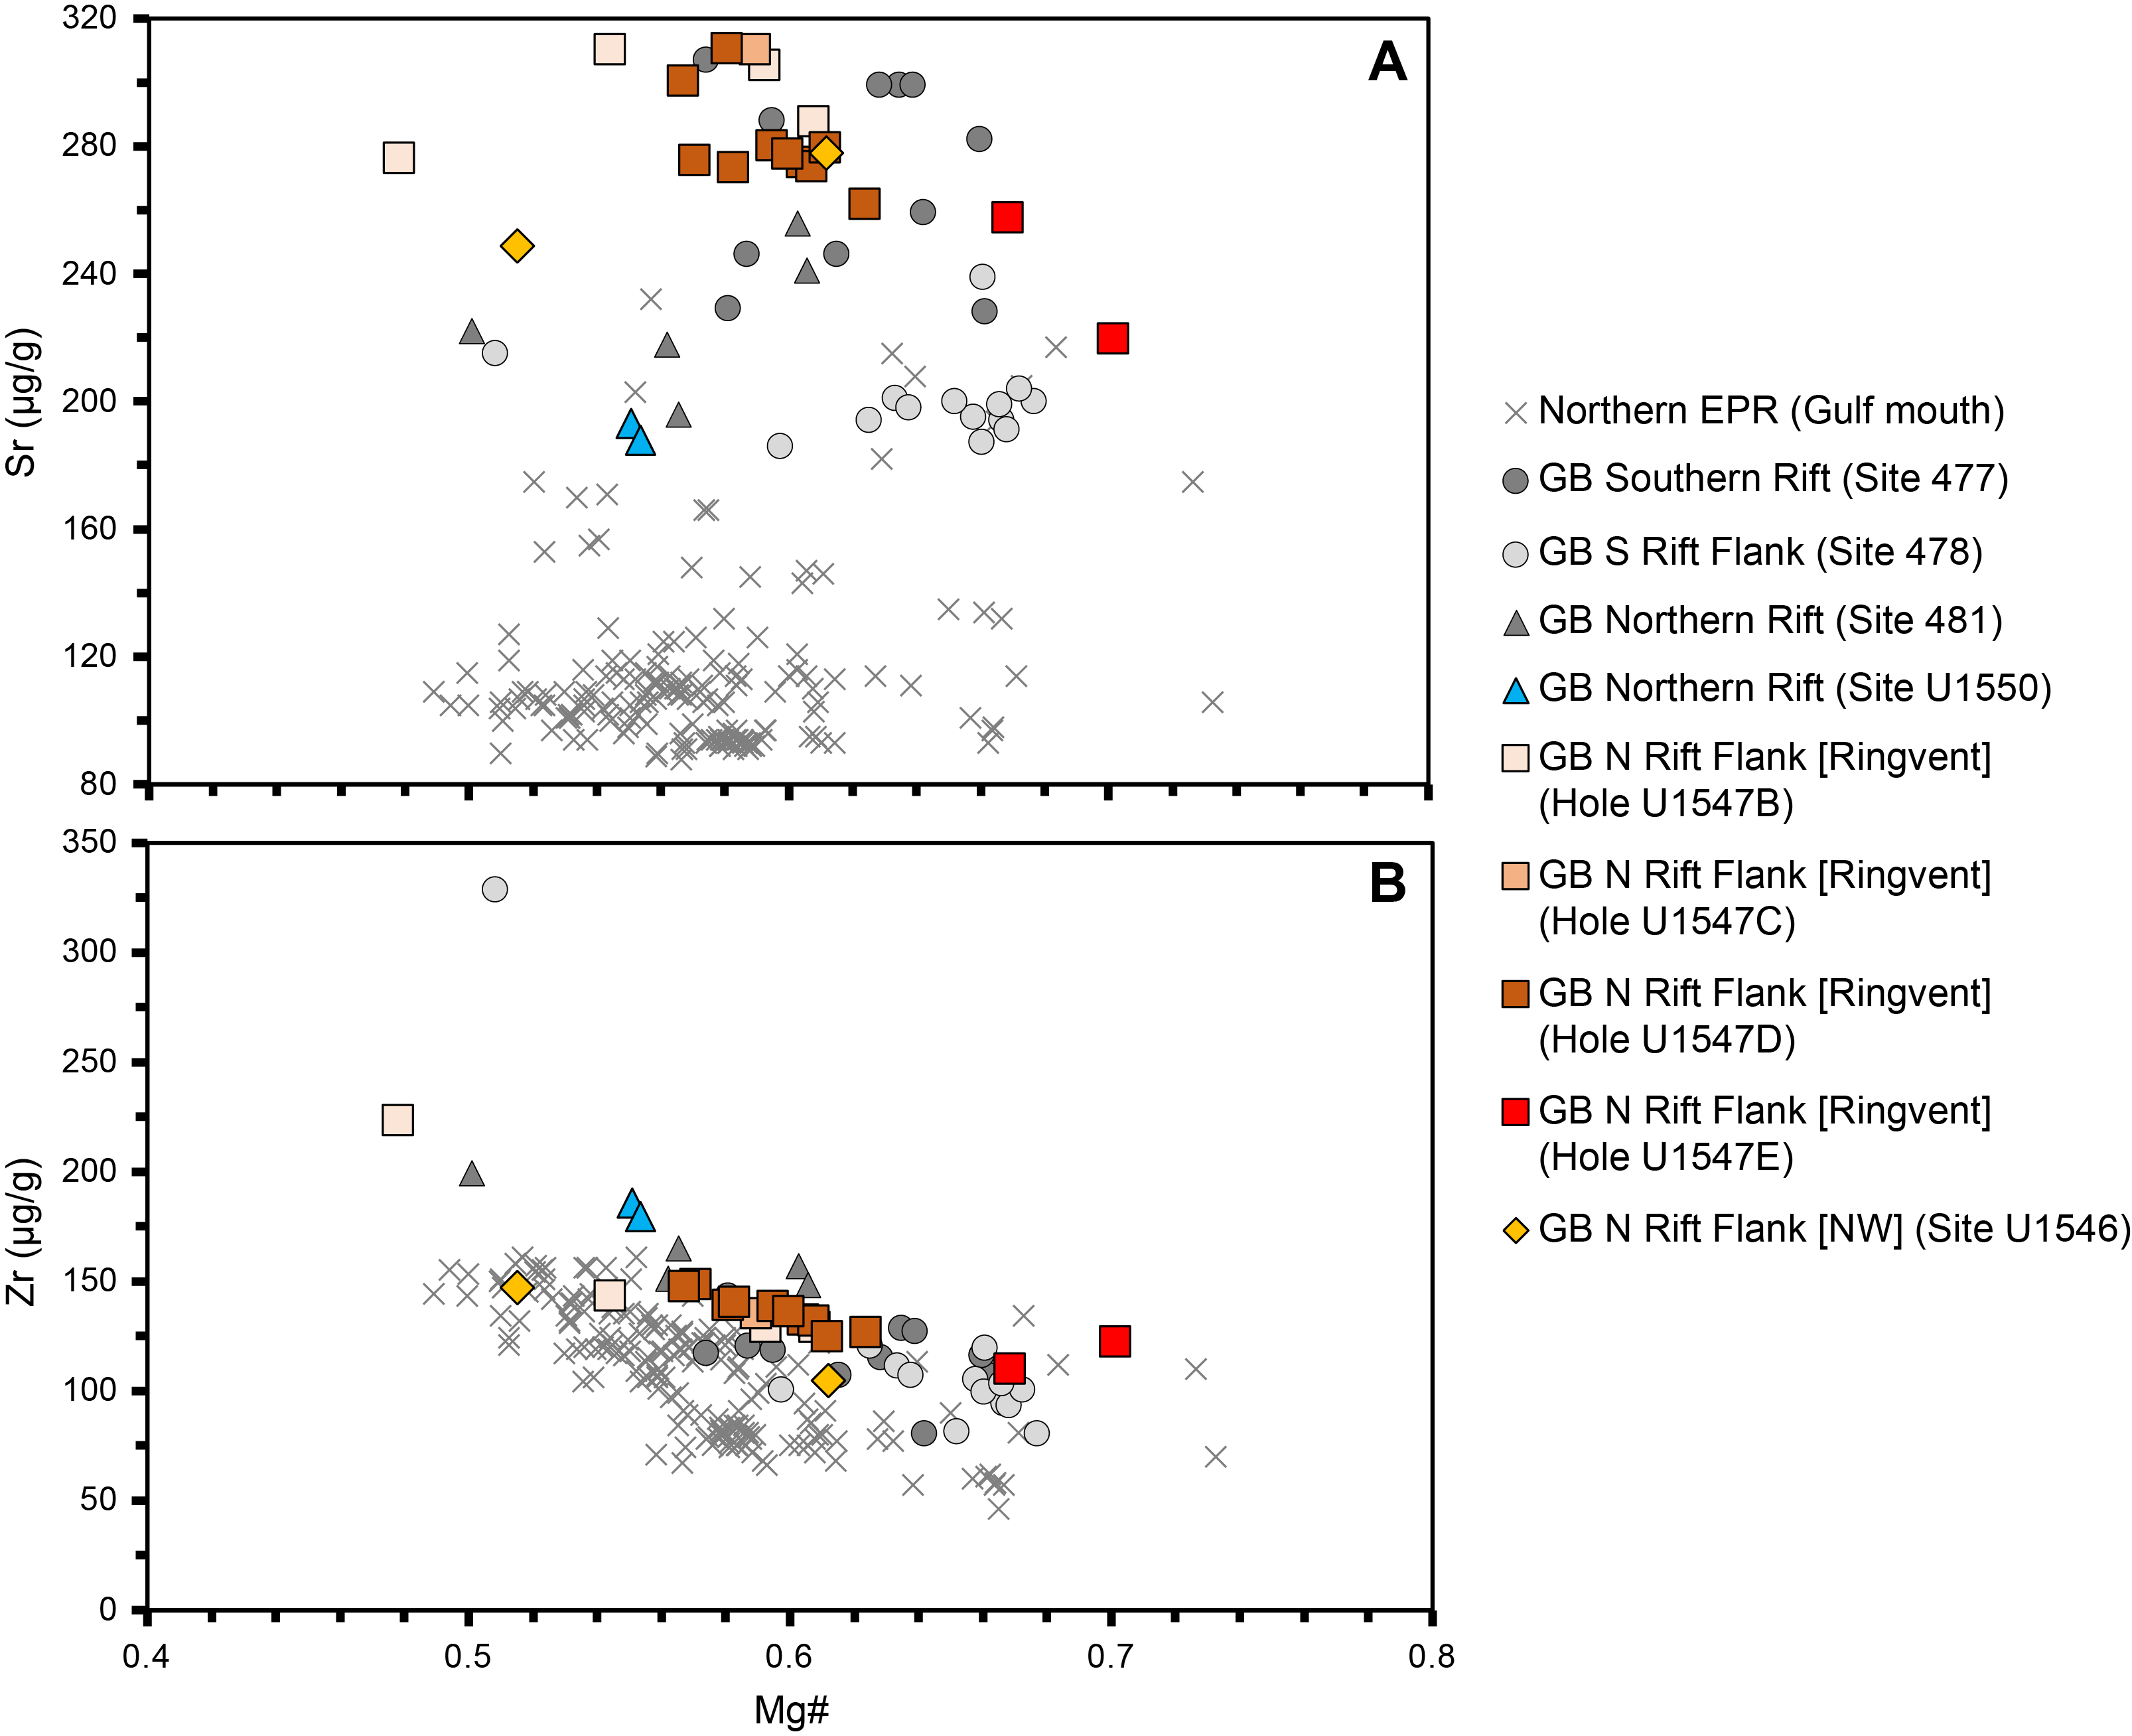

In comparison with nearby northern rift Site 481, which was drilled just ~112 m and ~51 m northeast from Hole U1550A and Hole U1550B, respectively (Figure F2), Site U1550 rocks have a similar content of alkaline metals. However, Site 481 shows a greater silica concentration (~52 wt%) at a given Na2O + K2O content (Figure F12). Except for one sample from Site 481, the slightly more mafic rocks from Site U1550 appear to be more evolved based on their lower Mg# (Figure F14). Their increased degree of differentiation is expressed by higher abundances of the highly incompatible HFSE Ti and Zr (Figures F13, F14B). Incompatible element ratios (e.g., Zr/Y) and Y concentrations show similar values at both sites (Figure F15), which may suggest compositionally similar magma sources. Generally, the sills drilled in the northern rift segment possess the highest contents of highly incompatible elements (e.g., Zr and Y) at a given Mg# among all on- and off-axis areas studied in Guaymas Basin. As for the other Guaymas Basin sites, the Site U1550 ratios of highly incompatible trace elements (e.g., Zr/Y) (Figure F15) are higher and the calc-alkaline character is more pronounced (i.e., higher Na2O + K2O) (Figure F12) than at the East Pacific Rise spreading segment of the Gulf of California mouth. This indicates a significant heterogeneity in magma source compositions from the southernmost to the central (Guaymas Basin) part of the gulf because the same difference is indicated by the incompatible trace element Sr at comparable fractionation degrees (Figure F14A). This suggests the ubiquitous presence of enriched MORB compositions in Guaymas Basin for both on- and off-axis magmas.
6. Structural geology
At Site U1550, Holes U1550A and U1550B penetrated Lithostratigraphic Unit I and recovered a sedimentary sequence of diatom ooze, diatom clay, sand, and silt followed by hypabyssal basaltic and doleritic rocks that comprise a sill intrusion. The sequence corresponds to Lithostratigraphic Subunits IA–IC. When a sill was encountered in each hole, drilling was stopped after taking two XCB cores (385-U1550A-31X and 32X and 385-U1550B-22X and 23X), with low recovery in all cases.
For all cores, structures were measured and/or described, where present, from the archive-half or whole-round sections of the cores as well as their photos in visible light. X-ray images were also used for Hole U1550A. X-ray imaging was obtained for only one Hole U1550B core (7H), in which a zone of mafic scoria clasts was identified during core description. This X-ray imaging was performed on both the working- and archive-half sections of Core 7H to provide location information for possible future sampling.
6.1. Sedimentary units
Structural information was obtained from sedimentary units in both holes at Site U1550. Hole U1550A was lithologically more complete and reached a greater depth in the sedimentary section. In Hole U1550B, some whole-round sections were removed for microbiological sampling immediately upon retrieval from the core liners and were therefore not available for structural study. Hole U1550A penetrated ~203 m of the sedimentary section, and Hole U1550B penetrated ~170 m. This variance is due to differences in the depths at which an underlying sill was encountered and a significantly shallower top sediment/sill contact in Hole U1550B.
Bedding and lamination in the sedimentary rocks are similar to those described for Site U1545. However, Site U1550 also has several massive “event beds” caused by rapid deposition of a large quantity of sediment as gravity-flow deposits; these event beds can be several meters thick and are correlatable between holes (Table T4). The lack of stratification within the event beds implied that any deformation structures in those sections of the cores could not be identified. The remaining stratified parts of the recovered sedimentary cores were carefully examined for faults, folds, and tilted bedding.
6.2. Folds
Significant changes in the apparent dip of the laminations are inferred to be caused by folding in much of the sedimentary sequence. Apparent dips exceeding 10° were noted in Cores 385-U1550A-3H, 4H, 5H, 16F, and 17F (15–30 and 124–130 mbsf) and 385-U1550B-3H, 4H, 7H, 8H, 9H, and 17F (15–33 and 50–80 mbsf). Fold axes were directly visible in Sections 385-U1550B-4H-2 (~27 mbsf), 385-U1550A-15F-1 (~120 mbsf), and 24X-1 (~152 mbsf).
6.3. Brittle fractures and faults
In both holes at Site U1550, identified faults were measured on the split core surfaces. In Hole U1550A, faults start to occur in Core 10H (~82 mbsf) and continue through Section 24X-1 (~151 mbsf). Faults were more commonly identified in Cores 16F (~124 mbsf) and below. These faults appear to belong to a single subparallel fault set in borehole coordinates rather than a conjugate set. For example, in Sections 17X-1 and 17X-2 (129.1–131 mbsf), stratigraphic discontinuities consistently indicate fault traces with apparent dips down to the right (Figure F16A). The strike direction is not known because the core was not oriented, but the fault spacing suggests an array of four parallel faults dipping about 60° and spaced 0.5 m apart. In Hole U1550B, a similar fault pattern is observed although less material was preserved (Figure F16B). The detailed X-ray images obtained from Core 7H (~55 mbsf) show some small-scale faults not visible on the core surface (Figure F17).


6.4. Igneous units
Short intervals of basaltic and doleritic rock were recovered in Holes U1550A and U1550B. They added about a meter of curated length for each hole. They were examined for planar features such as baked contact zones, fractures, and veins. The planar features were measured for dip relative to the borehole axis using the same methods as used for previously drilled Sites U1545–U1548.
Although only a few pieces of igneous rock were recovered, several from Core 385-U1550B-23X (~172 mbsf) preserved baked contacts or chilled margins with glassy textures and had orientations of 30°–50° relative to the borehole axis. Significant parallel, closely spaced fractures and veins were also noted near the top of the recovered basaltic rock (Figure F18) parallel to the interpreted baked contact features. This vein pattern seems to be restricted to the top few centimeters of the layers with basaltic textures and could serve as an indicator of proximity to the contact zone with the overlying sediments and constrain the local orientation in three dimensions and the possible tilting of the contact zone.
6.5. Discussion
The observations of fault patterns and geometry of the recovered sill material, along with the lithostratigraphic differences between Holes U1550A and U1550B, suggest a preliminary model for tectonic and depositional history of the Site U1550 lithologic record. Significant faults were seen in both drill holes at about 130 mbsf in Cores 385-U1550A-17F and 385-U1550B-17F. This is also the depth below which the stratigraphy cannot be correlated between the two drill holes. The difference in depth to the mafic sill in the two holes suggests several possible explanations: a single horizontal sill was offset by faulting or showed an irregular geometry (such as a saucer shape), or two different sills are present and the shallower one in Hole U1550B did not reach the location of Hole U1550A.
The lithostratigraphic differences in the basal sedimentary section in the two holes are most easily explained by faulting. If the sill was originally a single horizontal layer, faulting would have dropped the Hole U1550A location by 30 m relative to Hole U1550B and ended shortly after the time of the sediment deposition recovered in Cores 385-U1550A-17F and 385-U1550B-17F. This early major faulting may also have tilted the basal sedimentary section and the sediment/sill interface relative to the horizontal. Minor faulting and slump folding may have continued after this time.
An argument for a single shallow sill that does not extend to Hole U1550A, thus favoring the presence of two distinct sill bodies, is indirectly supported by organic geochemistry observations. Hole U1550A is located 102 m away from DSDP Hole 481A, and Hole U1550B is located between these two holes, 51 m away from each. The sill encountered in Hole U1550B was found at ~170 mbsf, the same depth as the shallowest sill encountered in Hole 481A, suggesting that it is the same sill with a small dip. A dramatic excursion in the ethane to methane ratio (C2/C1) is observed above the sill in Hole 481A (figure 57 in Kelts et al., 1982); this ratio reaches a peak at ~150 mbsf and then decreases rapidly toward the sill. This same excursion, which appears to be diagnostic of a proximal sill, is seen in both Holes U1550A and U1550B (see Organic geochemistry) even though a sill is not encountered in Hole U1550A. It is possible that Hole U1550A passed just by the edge of this sill, close enough to record the halo of its imprint on the organic geochemical signature. In this case, the sill encountered at ~204 mbsf in Hole U1550A would be interpreted to be a different sill that is perhaps related in some way to the deeper sills encountered in Hole 481A.
7. Biostratigraphy
Toothpick samples from Hole U1550A were taken and analyzed for calcareous nannofossils and marine diatoms to determine biostratigraphic events. Samples were taken from the bottom intervals or from working- and archive-half cores from 5 to 200.55 mbsf in Hole U1550A.
No biostratigraphic datum was defined in the mostly continuous succession from the (Holocene? to) late to middle Pleistocene (Table T6). The occurrence of E. huxleyi at the bottom of the hole dates the entire sediment sequence of Hole U1550A to Holocene(?)–late/middle Pleistocene, or 0–0.29 Ma (0–200.55 mbsf). This age assignment is consistent with the absence of P. lacunosa (LAD = 0.44 Ma) and F. reinholdii (LAD = 0.62 Ma) in all samples examined. The estimated average sedimentation rate is greater than 692 m/My (>69.2 cm/ky) (Figure F19).
7.1. Calcareous nannofossils
Calcareous nannofossil abundance varies from abundant to barren throughout the entire sampled sequence at Site U1550 (Table T7). Nannofossils are abundant and common from the top of the sequence to Sample 385-U1550A-15F-3, 50 cm (123.08 mbsf), dramatically decrease to rare/barren occurrences (131.06–135.6 mbsf), and then return to abundant and common occurrences in the underlying interval (142.02–187.66 mbsf). The barren interval seen at Sites U1545–U1548 is also present at Site U1550 (see Biostratigraphy in the Site U1545, Site U1546, and Site U1547 and U1548 chapters [Teske et al., 2021c, 2021d, 2021e]).
Preservation of calcareous nannofossils is good/moderate throughout the entire sedimentary sequence and generally associated with good/moderate preservation in samples that show abundant or common nannofossils (Table T7).
Reworking of Cretaceous and Miocene taxa is present throughout Hole U1550A. The origin of reworked nannofossils is uncertain, although possible sources may include eroded Cretaceous outcrops in the Colorado River catchment, Cretaceous chalk deposits underlying the Sierra Madre Occidental, and marine Miocene strata on Isla Tiburón (McDougall and Martínez, 2014; Helenes et al., 2009). The source and environmental implications of reworking will be determined in detail during postexpedition research.
The sediment sequence from Hole U1550A is assigned to Nannofossil Zone NN21 based on the presence of E. huxleyi in all samples from this hole. However, the first appearance of E. huxleyi (0.29 Ma), was estimated to occur in deeper sediments than those drilled in Hole U1550A (Table T7). This indicates an age younger than 0.29 Ma for the sedimentary bottom of Hole U1550A (i.e., above the intersected sill).
7.2. Diatoms
In the upper part of Hole U1550A, marine diatoms are dominant and abundant and occur in good and moderate preservation from intervals 1H-4, 50 cm (5 mbsf), to 8H-7, 70 cm (72.5 mbsf). In the middle interval, diatoms alternating in abundant, common, and few occurrences were observed in moderate and poor preservation from interval 9H-6, 120 cm (81 mbsf), to 15F-3, 50 cm (123 mbsf) (Table T8). In the lower part of the hole, poorly preserved diatoms in few, rare, and barren occurrences were observed from interval 17F-2, 50 cm (123 mbsf), to 29X-1, 55 cm (200 mbsf). Apparent diagenetic alteration of diatoms was found in the samples with rare diatoms at the bottom of Hole U1550A (Table T8) (see photomicrograph Plate 9 in DIATOMS in Supplementary material for decreasing diatom preservation with increasing degree of diagenesis based on documentation from Holes U1545A and U1546A). In Hole U1550A, no age-diagnostic diatom species were found, suggesting an age younger than 0.62 Ma, as indicated by the top/LAD of F. reinholdii (Table T8).
Samples with few, rare, and barren diatoms were observed at different depths at Site U1550. The diatom assemblages are obviously different from those at the previously drilled Sites U1545–U1548, which had diatom-barren conditions only at the bottom of the holes. This pattern of changing diatom abundance and preservation in Hole U1550A might be related to the strong disturbance of sedimentation sequences by turbidity or underwater slumps (see Lithostratigraphy). Photomicrograph Plate 6 in DIATOMS in Supplementary material displays an overview of some diatom taxa identified in Hole U1550A.
8. Paleomagnetism
Paleomagnetic shipboard measurements included the analysis of the NRM and its demagnetization on archive-half sections and discrete samples from Hole U1550A to establish a magnetostratigraphy of the site. Representative discrete samples were collected from all APC (two samples per core), HLAPC (one sample per core), and XCB (one sample per core) cores. No paleomagnetic measurements were conducted for Hole U1550B except for NRM measurements on igneous sections.
8.1. Archive-half section analysis
Archive-half sections from Hole U1550A were demagnetized at 5 cm intervals up to 20 mT. All sections in Hole U1550A were measured, including heavily disturbed XCB cores, for magnetic intensity. Paleomagnetic measurements, other than NRM, were not conducted on Hole U1550B cores for the same reasons as at previous sites: (1) a discontinuous record of the archive-half sections due to sampling for microbiology and geochemistry and (2) the absence in the paleomagnetic record of excursions and reversals (see Magnetostratigraphy).
In-line AF demagnetization of archive-half sections indicates a drilling overprint (steep inclination) that was removed by an AF demagnetization treatment of 5–10 mT (Figure F20A). Steeper inclination values were found in XCB cores (Figure F20A). After demagnetization at 20 mT, inclination values for APC and HLAPC cores (385-U1550A-1H through 21F) vary around an average value of 46°, which is comparable to the expected GAD inclination value at the latitude of the site (~45.9°) (Figure F20B). Negative inclinations at ~54–56 mbsf (interval 7H-1, 90 cm, to 7H-2, 90 cm) correspond to a slump mixed with mafic lapilli (see Lithostratigraphy and the visual core description sheets [VCDs] in Core descriptions). XCB sediment cores (22X–29X) are too heavily disturbed (e.g., brecciated, fractured biscuits) to yield any reliable paleomagnetic signal.
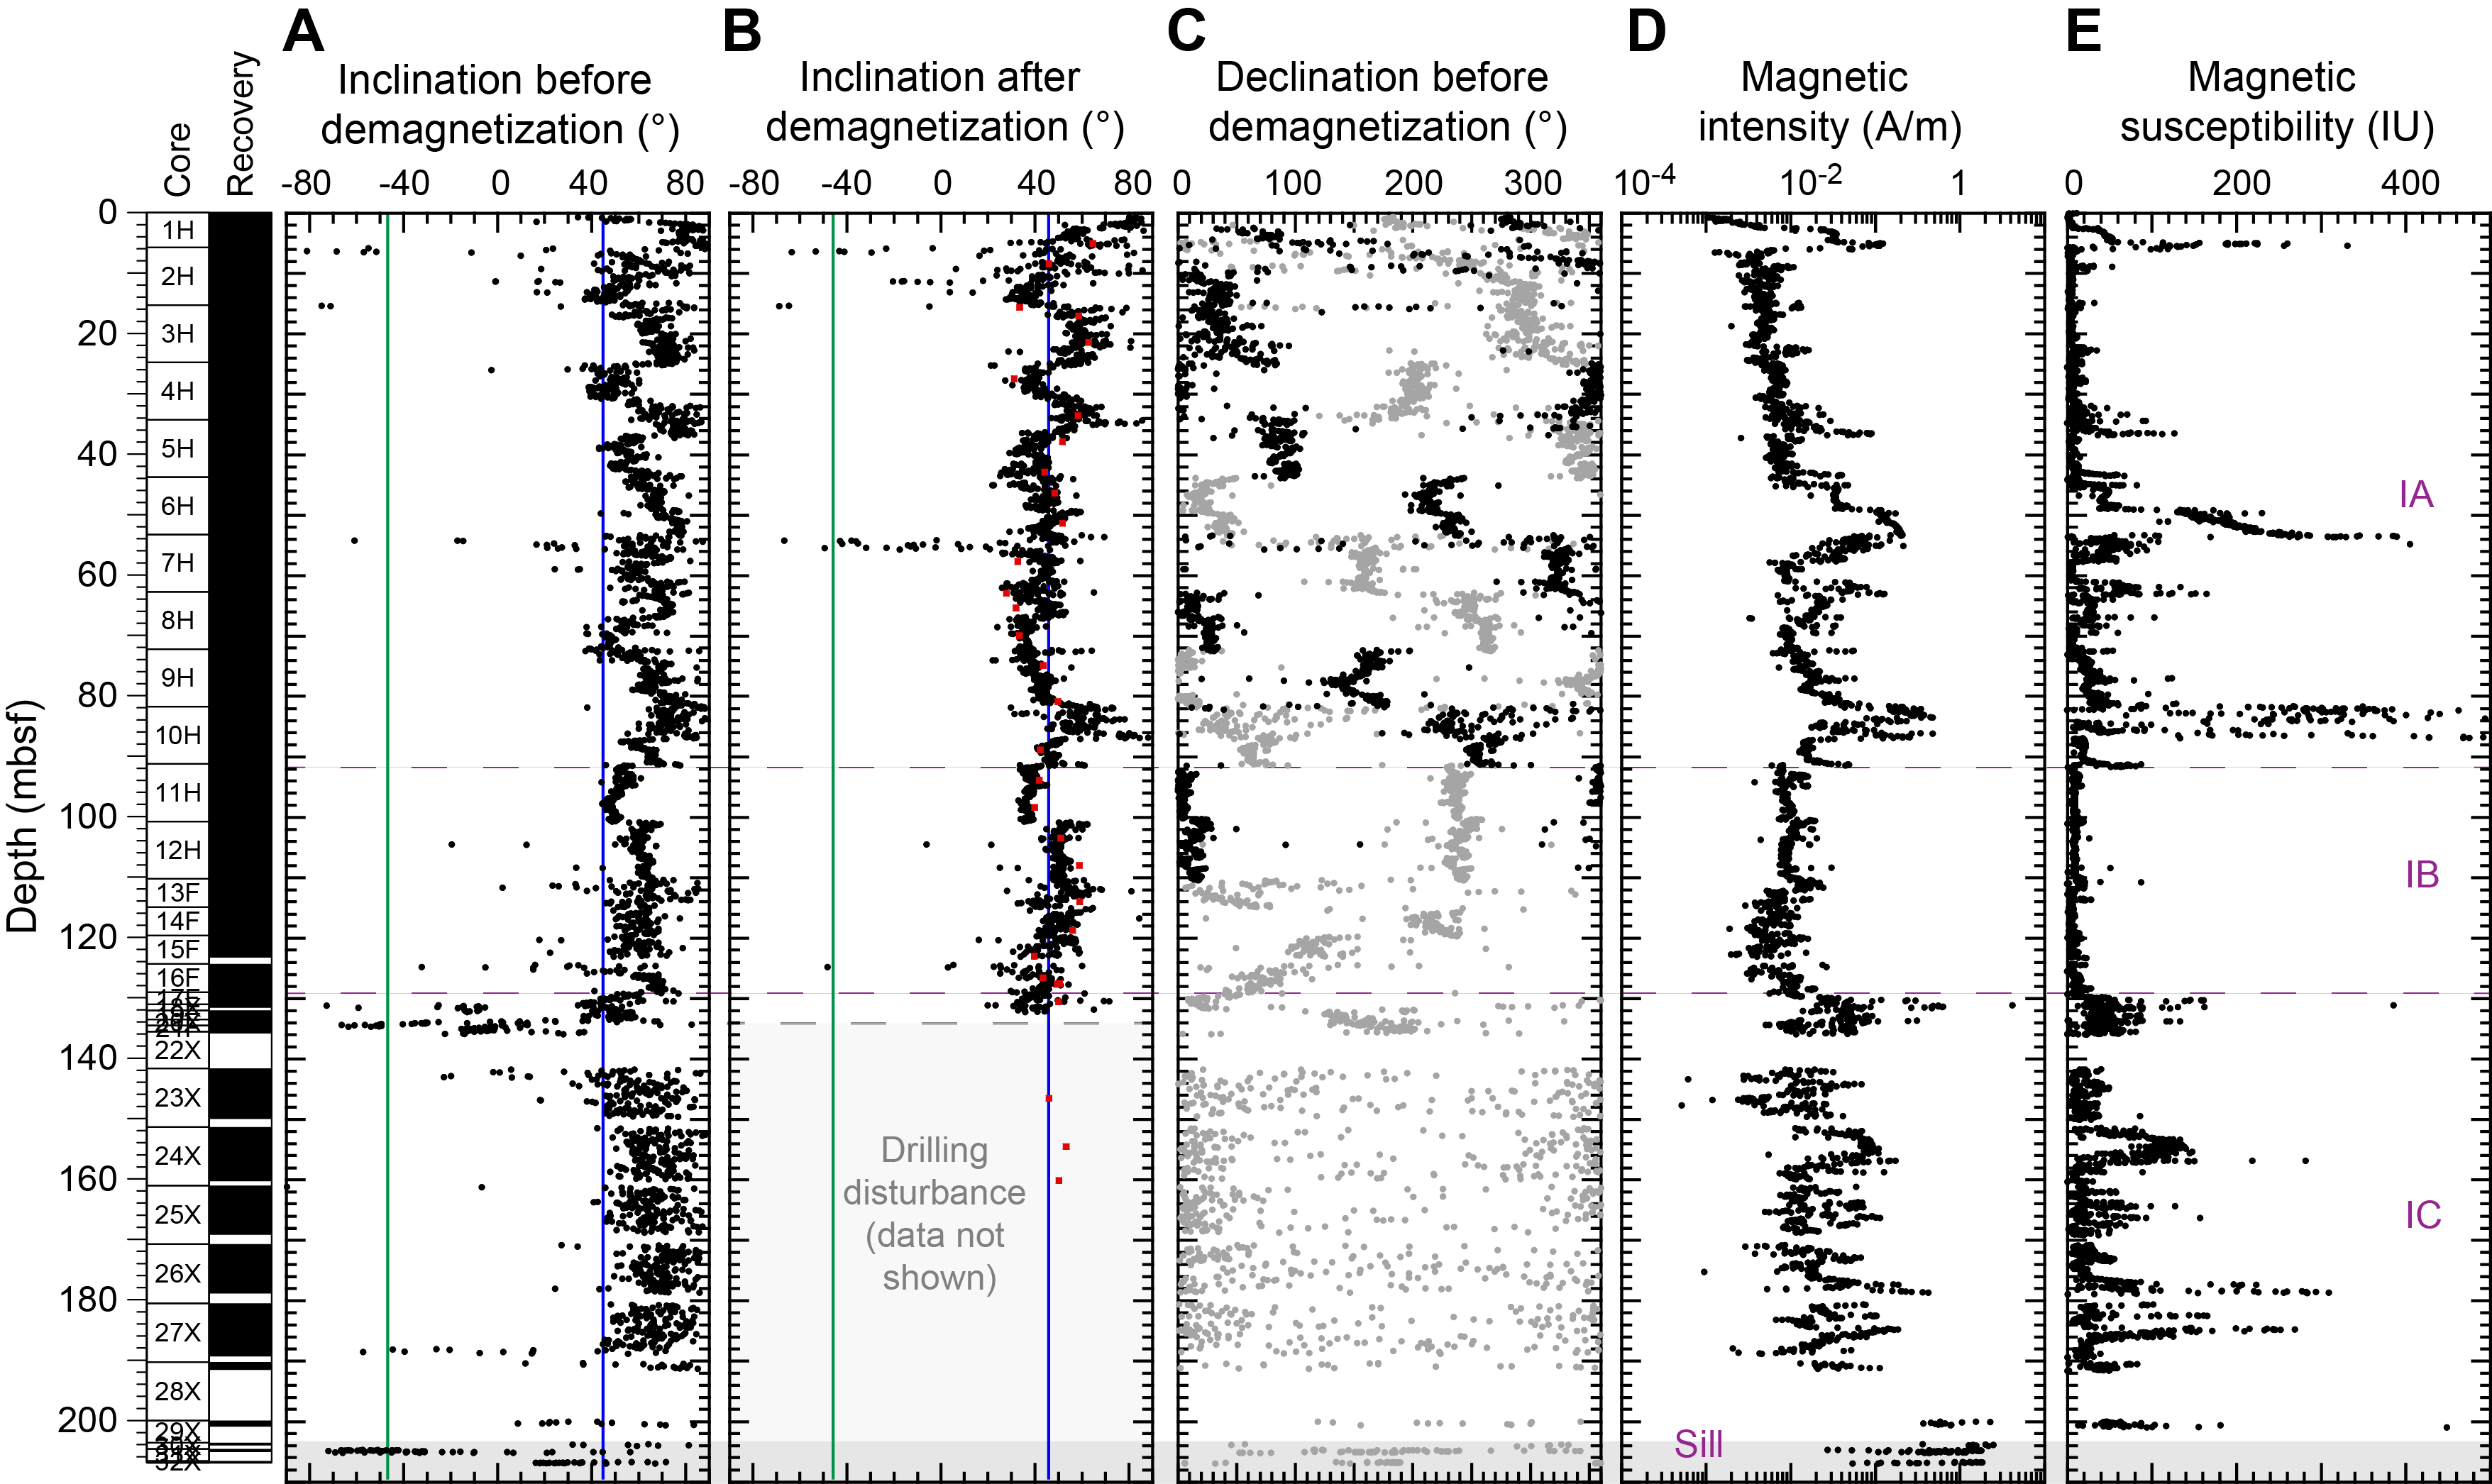
Magnetic intensity in Hole U1550A sediments is generally <0.05 A/m (Figure F20D), which is similar to the other sites drilled during Expedition 385 (see Paleomagnetism in the Site U1547 and U1548 and Site U1549 chapters [Teske et al., 2021e, 2021f]). Several peaks of magnetic intensity are present downhole at ~5 mbsf (Section 385-U1550A-1H-4), ~50.7–61.7 mbsf (Sections 6H-5 through 7H-6), and ~86.5–93.5 mbsf (Sections 10H-4 through 11H-2) with a maximum value of about 0.7 A/m. These intervals correspond to coarser silty/sandy layers (see Lithostratigraphy and the VCDs in Core descriptions), which contain more detrital material. The peaks in magnetic intensity are mirrored in point magnetic susceptibility (Figure F20E). Similar to Site U1549, no drastic decrease of magnetic intensity related to the occurrence of a SMTZ is observed in shallow cores.
Sections 385-U1550A-30X-CC, 31X-1, and 32X-1 and 385-U1550B-21X-1, 22X-1, and 23X-1 contain igneous rocks. Only NRM was measured on these sections (with the exception of Section 21X-1, which consists of small fragments). Magnetic intensity of igneous rocks is as high as ~2.5 A/m, about three orders of magnitude higher than for fine-grained sediments (Figure F20D). AF demagnetization treatment was not effective for previously drilled Site U1546 (see Paleomagnetism in the Site U1546 chapter [Teske et al., 2021d]). Therefore, no AF demagnetization was conducted on igneous rock sections from Site U1550.
8.2. Discrete sample analysis
For a more detailed study of the remanence in Hole U1550A, discrete samples were taken from the working-half sections of Cores 1H–24X at intervals of two discrete samples per APC core and one per HLAPC and XCB core.
Measurements of remanence were made using an AGICO JR-6A spinner magnetometer on a total of thirty-two 8 cm3 cube samples (see Figure F21 in the Expedition 385 methods chapter [Teske et al., 2021a]). All of these samples were demagnetized using a stepwise-increasing AF to isolate the ChRM direction using principal component analysis (Kirschvink, 1980). No samples were thermally demagnetized because all discrete samples were taken using plastic sampling boxes.
NRM intensities vary between 2.92 × 10⁻³ A/m and 9.77 × 10⁻² A/m with a mean intensity of 1.50 × 10⁻² A/m (Table T9). AF demagnetization was performed up to 60 mT, by which point the samples had lost more than 90% of their total magnetization (Figure F21B). Representative demagnetization diagrams (Zijderveld, 1967) are shown in Figure F21A. All reported declination and inclination data are shown in the sample coordinate reference frame. However, because cores are free to rotate in the core barrel, only the inclination data are taken into account for interpretation. Two magnetic components can be identified on the demagnetization diagrams for each discrete sample (Figure F21A). The first component is removed by an AF demagnetization treatment of 5–10 mT and corresponds to drilling overprint. The second component is stable and points toward the origin. This component is of normal polarity for all analyzed discrete samples. The median destructive field ranges from 3.9 to 29.2 mT with a mean of 16.7 mT, comparable to results obtained from previous holes. This suggests a magnetic mineral assemblage dominated by low-coercivity (titano)magnetite.
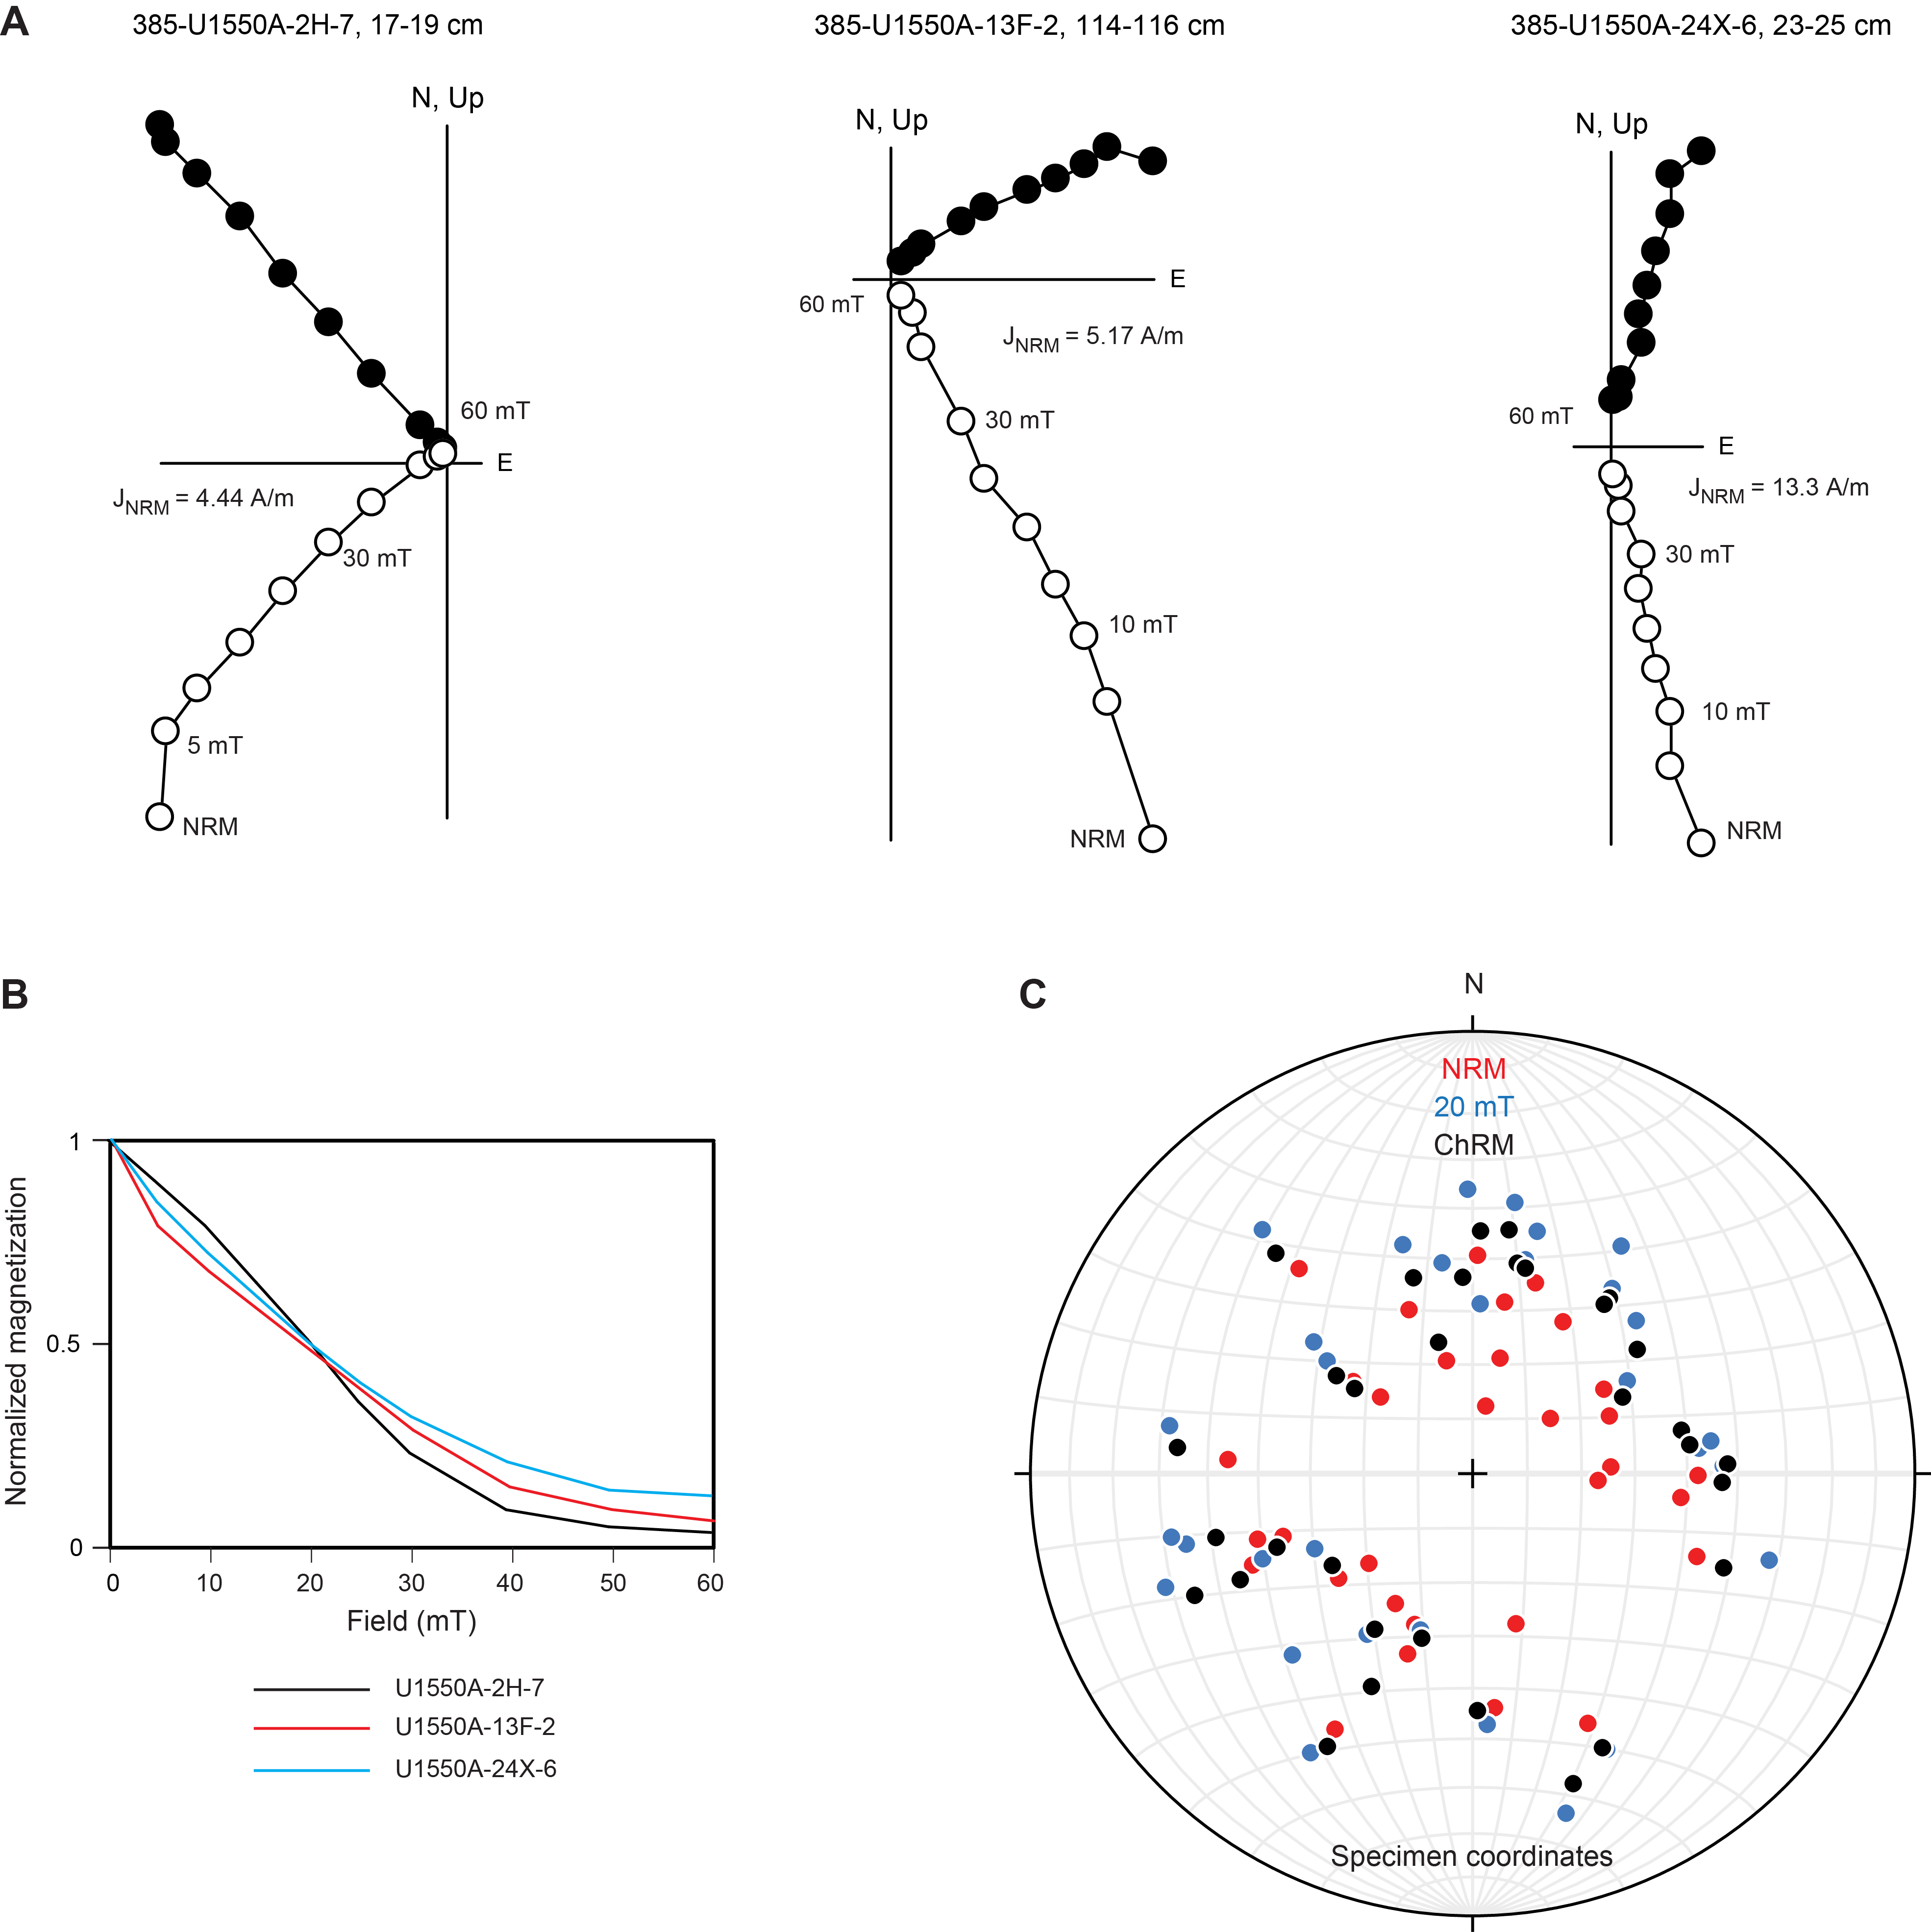
The distributions of the inclinations of the NRM and the ChRM of all discrete samples are shown in Figure F21C. The NRM inclinations range from 35.0° to 77.2° with a mean inclination of 56.2° (Figure F21C). The scatter of inclination values is likely due to the presence of slump deposits in the upper part of Hole U1550A. Demagnetization at 20 mT results in the inclination showing a shallower average of 42.6° and ranging between 22.1° and 59.7°. Upon performing principal component analysis, a mean inclination for the ChRM was calculated using the maximum likelihood method of Arason and Levi (2010) (Table T10). The calculated mean inclination for the ChRM results is 47.85°, which is slightly higher than the GAD inclination expected at this location (~45.9°).
8.3. Anisotropy of magnetic susceptibility
Anisotropy of magnetic susceptibility was measured for all discrete samples from Site U1550 prior to demagnetization to characterize the magnetic fabrics present in the samples. Results for the sediments of Hole U1550A are shown in Figure F22 in the core reference frame. Because these results are unoriented, it is not possible to determine whether there is a preferred magnetic lineation in these rocks; therefore, only the inclination of the anisotropy is taken into account. Sedimentary samples obtained from Hole U1550A predominantly show prolate behavior downhole; Kmax (maximum) principal axes are distributed in the horizontal plane, and Kmin (minimum) principal axes are oriented perpendicular to the sedimentary bedding.

8.4. Magnetostratigraphy
We used SRM measurements on archive-half sections to determine the polarity at Site U1550. We based our interpretation of the magnetic polarity on the sign of inclination at the maximum AF demagnetization step (20 mT) (Figure F20B). All APC and HLAPC cores (Sections 385-U1550A-1H-1 through 21F-1) show a positive inclination of ~46°. This is supported by the detailed discrete sample analysis (Table T9). Therefore, we assigned the cores to the normal Brunhes Chron (C1n; <0.78 Ma), which is in line with biostratigraphic observations (see Biostratigraphy). No magnetic excursions during Chron C1n were identified in spite of the fact that previously published paleomagnetic results from DSDP Site 480 pointed out the Mono Lake and Laschamp magnetic polarity excursions at ~29–26 ky before present (BP) and ~51–49 ky BP, respectively (Levi and Karlin, 1989).
9. Inorganic geochemistry
9.1. Interstitial water sampling
All samples were prepared and squeezed under laboratory atmosphere. The chemical composition of the IW and mudline water is listed in Table T11. All profiles are shown in Figure F23.

9.2. Interstitial water results
Site U1550 is located ~51 m (Hole U1550B) and ~112 m (Hole U1550A) from DSDP Site 481. The depth at which a sill was encountered differs between the holes: ~203.7 mbsf in Hole U1550A and ~170.4 mbsf in Hole U1550B (Figure F23). The lowermost IW sample was recovered at 175 mbsf in Hole U1550A and 153 mbsf in Hole U1550B.
9.2.1. pH, salinity, chloride, and sodium
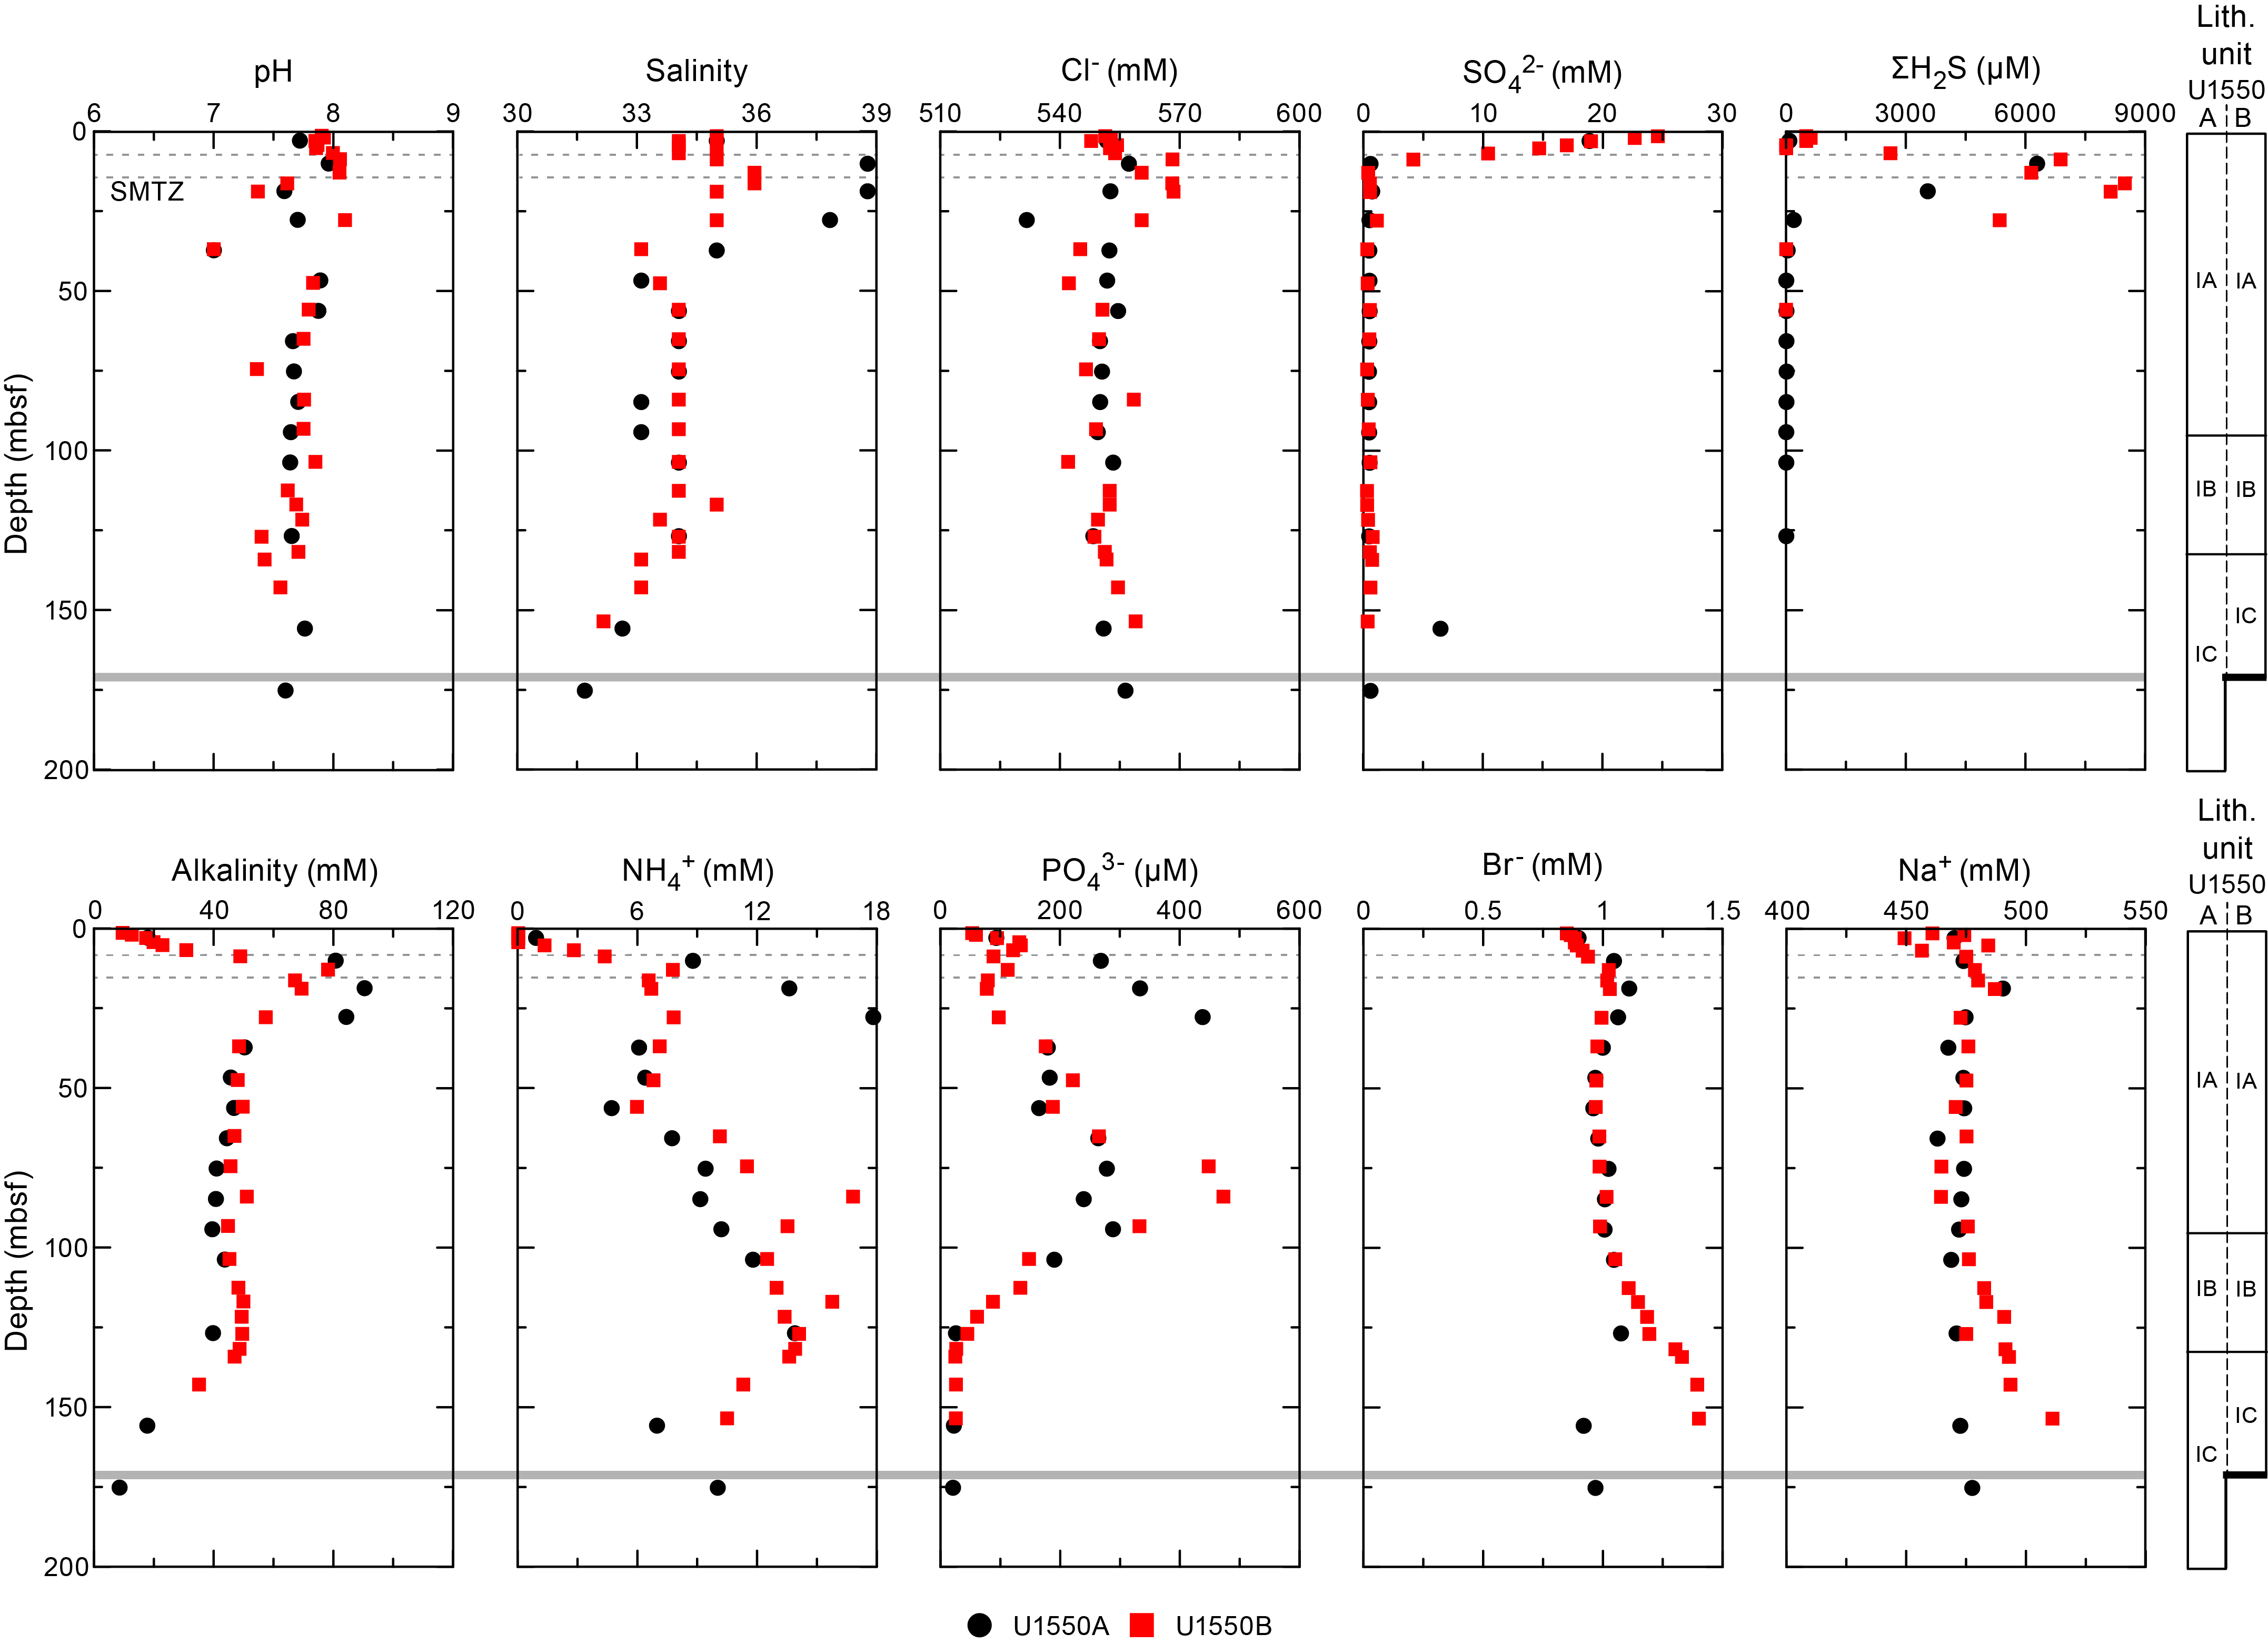
pH values range between 7.0 and 8.1 in Holes U1550A and U1550B, and the maximum values were recorded between the seafloor and 35 mbsf. Salinity exhibits a maximum of 39 around 20 mbsf (Figure F23). Below 125 mbsf, salinity decreases to values around 31.5.
Chloride (Cl−) concentration ranges from 542 to 568 mM between the top and the bottom of Holes U1550A and U1550B and has slightly different values at ~20 mbsf. These data are consistent with previous chloride profiles for Site 481, which show a continued concentration increase toward the sill and a mirror profile in the deeper sediments below the sill (Gieskes et al., 1982).
Sodium (Na+) concentration exhibits two increases within the sedimentary column. The first increase, from 470 to 490 mM, occurs around 19 mbsf in both holes, followed by a decrease to seawater values within a few meters. The second concentration increase was only observed in Hole U1550B, from 80 mbsf to 15 m above the sill, where sodium reaches a concentration of 511 mM.
9.2.2. Sulfate, sulfide, alkalinity, ammonium, phosphate, and bromide
Sulfate (SO42−) concentration decreases from seawater value (28 mM) to <1 mM in the upper 10 or 13 m penetrated (Holes U1550A and U1550B, respectively) and then remains at low concentrations of <0.5 mM throughout both holes. The SMTZ is estimated to occur around 10 mbsf (Figure F23) based on sulfate and methane profiles (see Organic geochemistry). A similar decline in sulfate concentrations within the upper sediment column was previously observed at Site 481 with a 2 mM sulfate background in the deeper sediments (Gieskes et al., 1982) that could have resulted from sulfide reoxidation during oxygen-exposed sample storage.
Sulfide concentration (ΣH2S = S2 + HS− + H2S) peaks around 8 mM between 15 and 20 mbsf in Hole U1550B and then quickly decreases toward a few micromolar between 30 and 40 mbsf.
Alkalinity rapidly increases in the uppermost 20 m to 90 mM in Hole U1550A and 69 mM in Hole U1550B. Below this depth, alkalinity values decrease to 45–50 mM before decreasing again in the vicinity of the sill to 8 mM in Hole U1550A and 35 mM in Hole U1550B.
Ammonium (NH4+) concentration exhibits an initial maximum of ~8 mM around 20 mbsf and an increase to 14 mM from 60 to 130 mbsf. Two values from Hole U1550A are higher than those in Hole U1550B: around 13.6 mM at 19 mbsf and 17.8 mM around 28 mbsf. Between 60 and 90 mbsf, values from Hole U1550B are higher than those from Hole U1550A. Below 130 mbsf, ammonium concentration decreases, possibly due to incorporation into a clay mineral formed as a consequence of the sill intrusion.
Phosphate (PO43−) concentration profiles in Holes U1550A and U1550B resemble the ammonium profiles with three values higher in Hole U1550A between 10 and 30 mbsf (Figure F23). In Hole U1550A, phosphate increases to a local maximum of 439 µM at ~28 mbsf before decreasing to less than half this value. In Hole U1550B, a smaller maximum of ~135 µM occurs just above the SMTZ around 5 mbsf. These differences may reflect distinct sedimentary conditions between the holes, with variations in deposit thickness. Below 30 mbsf, phosphate concentrations in both holes indicate a second local maximum around 85 mbsf, but again with divergent concentrations of 473 µM in Hole U1550B and 288 µM in Hole U1550A. Subsequently, concentrations decrease in both holes to 27 µM between 127 mbsf and the bottom of the hole. The two phosphate peaks are consistent with Site 481, where phosphate concentrations reach local maxima of >250 µM near 20 and 80 mbsf and then decrease to the detection limit near and below the sill (Gieskes et al., 1982).
Bromide (Br−) concentration increases from 0.8 to 1.0 mM in the upper 20 m in both holes, and then the values stay within a narrow range between 0.9 and 1.1 mM to 120 mbsf. In Hole U1550A, values remain in this range from this depth to the bottom of the hole. In Hole U1550B, bromide concentration increases again to a 1.4 mM maximum at 25 m above the sill. Interestingly, this trend parallels the Na+ concentration increase toward the sill in the same hole.
9.2.3. Silica, calcium, magnesium, and potassium
Dissolved silica (expressed in solution as H4SiO4) starts at high concentrations near 800 µM in both holes (Figure F23), by a factor of 4.5 above silica concentration in the mudline water (178 µM in Hole U1550B) and in the Guaymas Basin bottom water (Campbell and Gieskes, 1984). This result suggests fast dissolution of silica minerals in the uppermost meters of sediment. Dissolved silica then increases from 784 µM near the seafloor to 1100–1200 µM around 120 to 140 mbsf with conspicuous variability that resembles a zigzag pattern; a local maximum near 25 mbsf is followed by a minimum near 50 mbsf and a local maximum near 75 mbsf. Below 140 mbsf, silica concentrations decrease toward minimum values around 314 µM (Hole U1550B) and 450 µM (Hole U1550A) above the sill.
Dissolved calcium (Ca2+) concentration decreases from 10 to 3 mM in the upper 20 m, most likely due to increased alkalinity and calcium carbonate precipitation. Values then range between 2 and 4 mM to 100 mbsf, and below this depth, they increase with depth to 6–8 mM above the sill. The highest concentration, near 13 mM, was found in the deepest sample from Hole U1550A.
Dissolved magnesium (Mg2+) concentration is around 53 mM from the seafloor to 100 mbsf, with a local maximum near 66 mM around 10–13 mbsf. Below 100 mbsf, values decrease to 30 mM close to the sill.
Dissolved potassium (K+) has a fairly consistent range of 10–11 mM from the seafloor to ~100 mbsf with a slight increase to 12 mM around 16 mbsf. Below 100 mbsf, values decrease to 4 mM just above the sill.
9.2.4. Manganese and iron
Dissolved manganese (Mn = Mn2+ + Mn4+) concentration rapidly increases to 179 µM at 3 mbsf and then approaches 0 µM around 9 mbsf (Figure F23). A second peak, with values ranging from 8 to 38 µM, was observed between 20 and 85 mbsf. Below this depth, concentration remains low (<4 µM). Dissolved iron (Fe = Fe2+ + Fe3+) is barely detectable in the upper 20 m and increases below this depth to variable values between 15 and 73 µM. Just above the sill, concentration decreases to <5 µM.
9.2.5. Boron, lithium, barium, and strontium
Boron (B; dissolved as borate; B[OH]4−) displays some differences between Holes U1550A and U1550B. In Hole U1550A, boron linearly increases from the seafloor to 28 mbsf, reaching 1433 µM (similar to the ammonium and phosphate profiles in the same hole), and then decreases to 610–720 µM between 28 and 130 mbsf. It exhibits a minimum value of 228 µM at 156 mbsf, and the last value above the sill is 529 µM. In Hole U1550B, the increase is less pronounced from the seafloor to 28 mbsf with a maximum value of 840 µM, again resembling the phosphate profile in this hole. Subsequent values range between 570 and 830 µM before they increase to 1280 µM above the sill.
Lithium (Li+) and strontium (Sr2+) concentrations do not show large variations from the seafloor to 100 mbsf, and concentrations range from 17 to 36 µM and from 70 to 98 µM, respectively. Two values from Hole U1550A are higher than those in Hole U1550B: 100 µM around 19 mbsf and 212 µM around 28 mbsf. Li+ concentrations in Hole U1550A show a marked increase just above the sill to 808 µM; this increase is more pronounced and better defined in Hole U1550B, where values reach 1493 µM. Sr2+ concentration exhibits the same behavior, with an increase just above the sill to values as high as 440 µM in Hole U1550B.
Barium (Ba2+) concentration starts building up just below the SMTZ around 10 mbsf to reach concentrations as high as 140 µM in Hole U1550B at 19 mbsf. Then it decreases to range between 5 and 45 µM from 40 to 140 mbsf before increasing again just above the sill to 222 µM in Hole U1550B and 80 µM in Hole U1550A.
9.3. Concluding remarks
Because of the proximity of Site U1550 to Site 481 (~51 m for Hole U1550B and ~112 m for Hole U1550A), the IW chemistry of Site U1550 exhibits very similar trends in terms of geochemical profiles as those described for Site 481 (Gieskes et al., 1982). In the upper part, a shallow SMTZ is evident around 10 mbsf, where high methane concentrations (as high as 15 mM at 18 mbsf in Hole U1550A) (see Organic geochemistry) coexist with sulfate depletion and a peak of alkalinity as high as 90 mM (Figure F23). Overturned and deformed sedimentary layers were observed in cores from these holes (see Lithostratigraphy), and these disturbances would naturally lead to nonsteady-state profiles with different geochemical gradients depending on sediment composition and origin, especially visible in ammonium and phosphate profiles.
At depth, the influence of the sill intrusion becomes most evident. A strong increase in dissolved lithium and strontium is observed above the sill in both Holes U1550A and U1550B, presumably due to past elevated temperatures leading to release of these elements (Gieskes et al., 1982). The lithium profile at Site 481 contains additional data points very close to the sill that have no equivalent at Site U1550; lithium concentrations show a partial reversal to lower concentrations immediately adjacent to the sill that was ascribed to “retrograde reactions” after the sill cooled down (Gieskes et al., 1982).
In contrast to generally increasing lithium and strontium concentrations, silica consistently decreases near the sill, matching previous results from Site 481 (Gieskes et al., 1982). There, the silica profile starts near 800 µM in surficial sediments, continues in a zigzag pattern between around 800 and 1400 µM, and then decreases to <200 µM near the sill before increasing again, like in a mirror profile, in the deeper sediments below the sill (Gieskes et al., 1982). The latter was not drilled through at Site U1550.
10. Organic geochemistry
At Site U1550, organic geochemists performed sampling and analysis of gas and solid-phase samples. For Hole U1550A, one headspace gas sample was analyzed per 9.5 m core for routine hydrocarbon safety monitoring; void gases were quantified and sampled for hydrocarbon, H2, and CO content; and the carbon, nitrogen, and sulfur content of particulate sediment were characterized. For Hole U1550B, hydrocarbon, H2, and CO analyses were performed on headspace gas and void gases were quantified and sampled for hydrocarbon, H2, and CO content. Carbon, nitrogen, and sulfur contents of sediment were characterized, and a comprehensive suite of gas and sediment samples for postexpedition analyses was taken.
10.1. Solid-phase carbon, nitrogen, and sulfur contents
Solid-phase sediment samples were analyzed to determine the weight percent of CaCO3, total organic carbon (TOC), total nitrogen (TN), and total sulfur (TS) (Figure F24). In Holes U1550A and U1550B, sampling frequency was approximately one sample per 9.5 m core (Table T12). For Hole U1550A, the core description team selected samples from primary and secondary sedimentary components, whereas for Hole U1550B, material was subsampled from the community gas (COMGAS) whole-round core for correlation to other biogeochemical data to be generated during onshore analyses. Trends observed in Holes U1550A and U1550B are combined for discussion below.
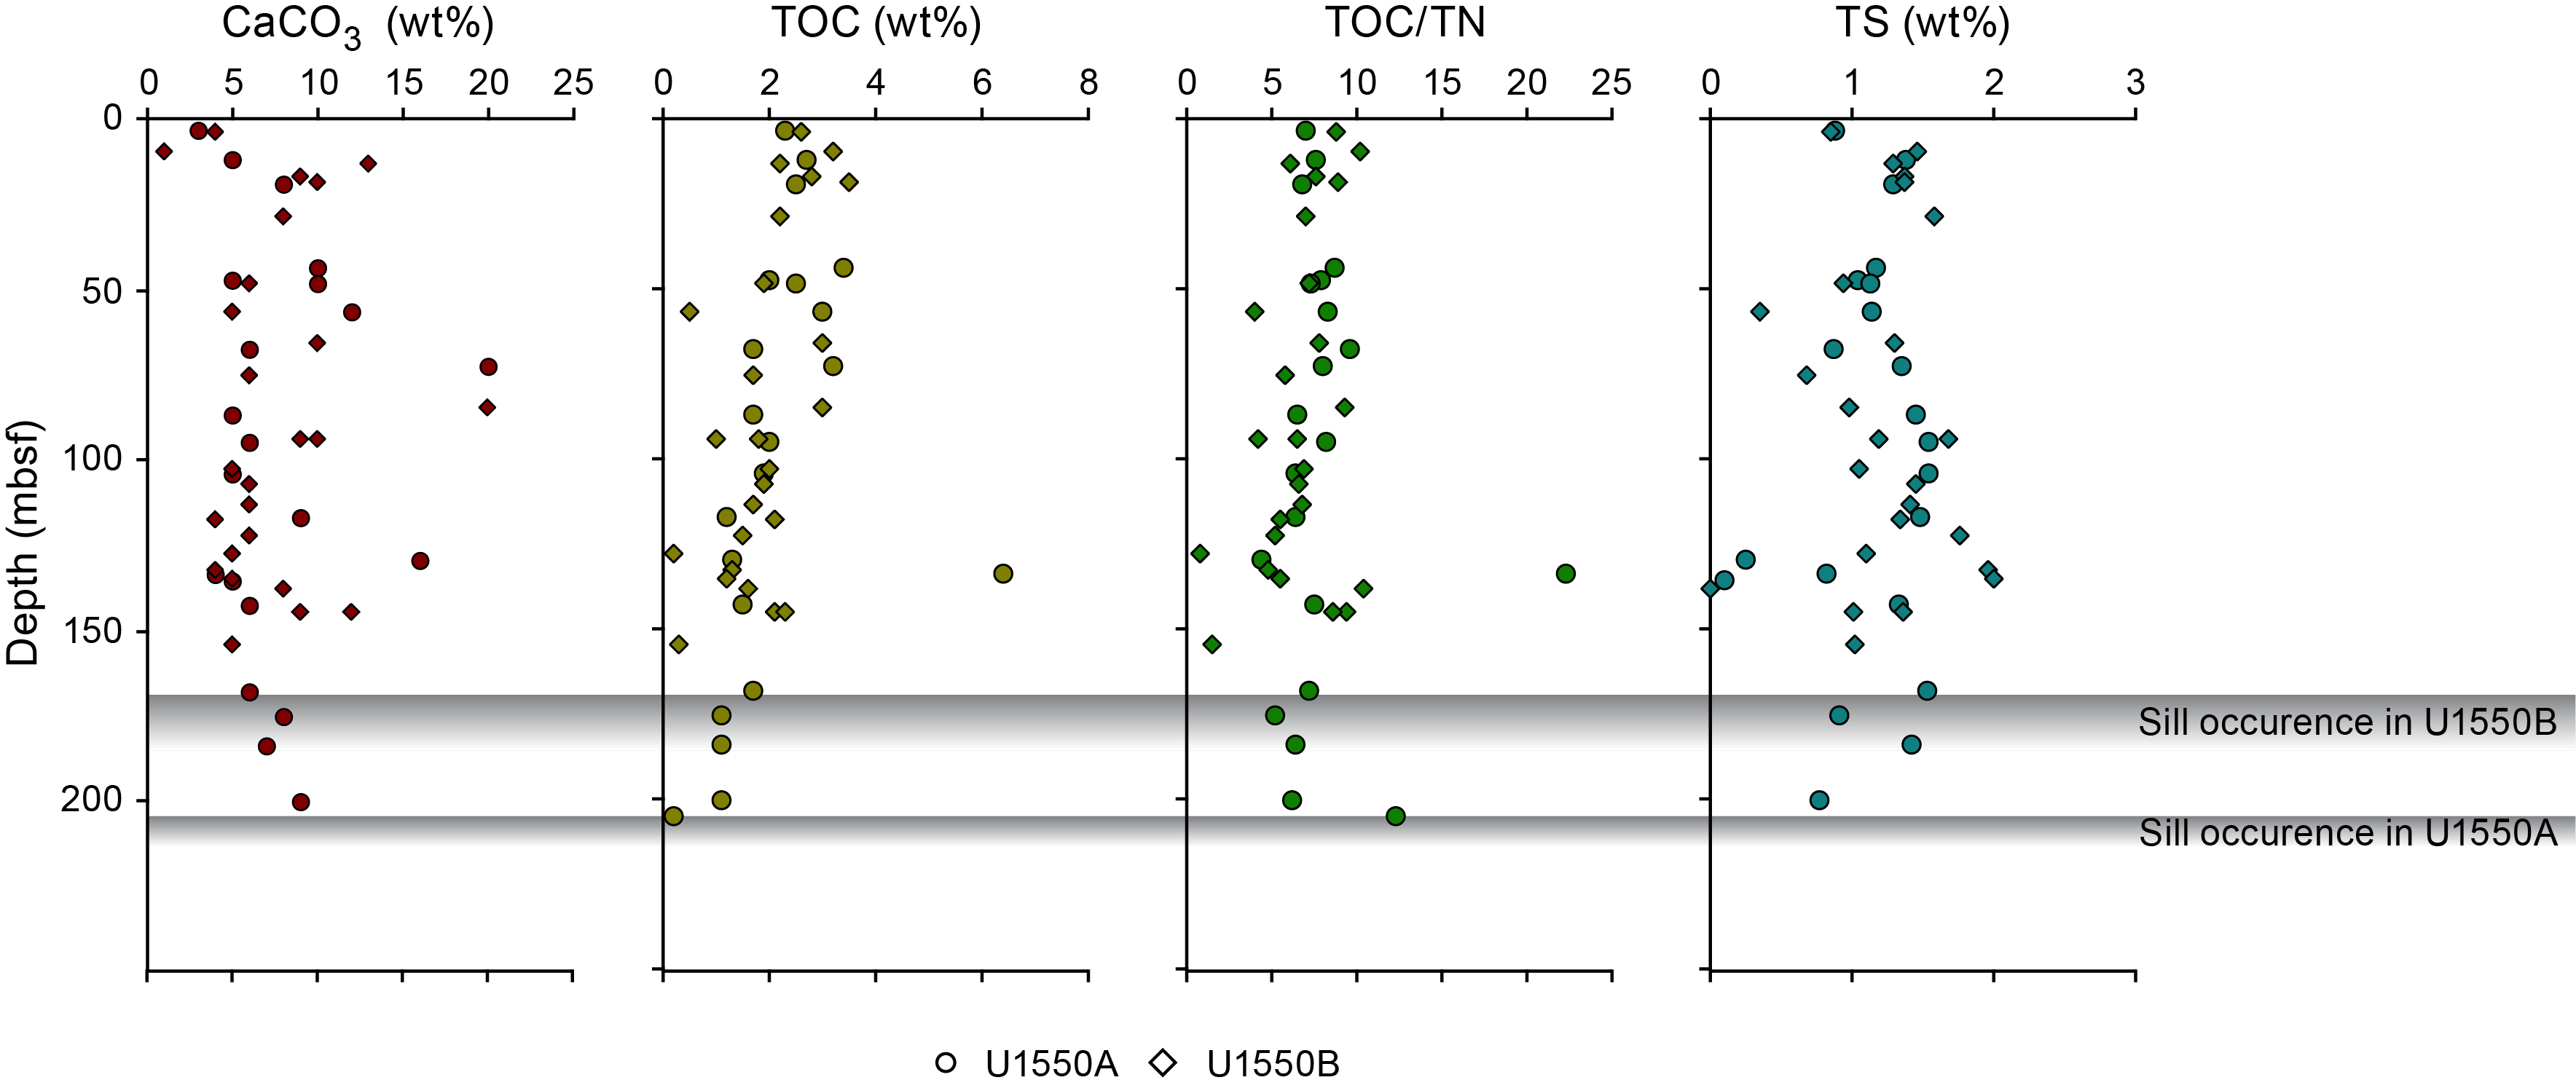
The CaCO3 content is less than 5 wt% in the uppermost 12 m of sediment. From 12 to 200 mbsf, it is higher and fluctuates between 5 and 10 wt%. Layers richer in carbonate are dispersed throughout and have CaCO3 contents as high as 20 wt%. TOC values are variable but generally decrease from the range of ~2.5–3.6 wt% in the upper 50 mbsf to 1.0 wt% at 200 mbsf. Below 200 mbsf, TOC values are lower than 2 wt% with the exception of the maximum TOC value of 6.9 wt% observed in a dark layer at 133.8 mbsf (Sample 385-U1550A-19F-2, 41–42 cm). For most of the analyzed samples, TOC/TN values range between 5 and 10 without a clear downhole trend. These values indicate that the organic matter is predominantly of algal origin (Meyers, 1994). Two samples (385-U1550B-16F-3, 132–139 cm, and 20X-2, 141–148 cm) have TOC/TN values lower than 2. These low values result from the low TOC content of these two samples and cannot be used to infer the origin of the organic matter. The most organic-rich sample at 133.8 mbsf has a TOC/TN value of 22.3, which indicates the influence of organic matter of terrestrial origin in this sample (Meyers, 1994). The TS content increases in the upper sediments from 0.85 wt% at 3.2 mbsf to 1.46 wt% at 9 mbsf and remains at ~1.5 wt% to 28 mbsf. Below this depth and to the bottom of hole, TS content varies around an average value of 1.1 wt% without a clear trend with depth. At Site U1550, TS and TOC contents are not correlated and show excess sulfur compared to the normal marine trend (Goldhaber and Kaplan, 1974; Berner, 1982), with an average TOC/TS value of 1.9.
10.2. Hydrocarbon gases
Headspace samples were taken from each core to monitor C1–C6 hydrocarbons per the standard safety protocol during drilling (Pimmel and Claypool, 2001). For Holes U1550A and U1550B, 55 headspace samples were analyzed for their parts per million by volume concentration (Table T13) and then corrected by sample weight and porosity to determine the molar concentration of dissolved hydrocarbons (Table T14). Trends observed in Holes U1550A and U1550B are combined for discussion below.
Site U1550 hydrocarbon data are shown in Figure F25. Methane concentrations are below the detection limit to ~7 mbsf. Below ~7 mbsf, methane concentrations sharply increase to a maximum value of 15.39 mM at ~18 mbsf and then decrease downhole. A second local maximum of similar magnitude may appear at ~125 mbsf, but because of the oversaturation and rapid degassing of methane in cores brought to the surface, it is not possible to know the true magnitude of dissolved methane concentration in this interval. Below ~125 mbsf, methane concentrations decrease to <1 mM in the bottommost sample at ~207 mbsf. C2–C6 compounds generally occur concurrently with methane and remain present throughout at the submicromolar to micromolar level. In Hole U1550A, C2–C6 hydrocarbons are present in low abundance with only a small maximum appearing at ~103 mbsf. In contrast, in Hole U1550B, C2–C6 hydrocarbons are present at low abundance with little variation to ~133 mbsf. They all sharply increase by 1–2 orders of magnitude to maximum values observed at ~152 mbsf and then decrease again downhole. Unlike the hydrocarbon maxima observed at other locations (see Organic geochemistry in the Site U1549 chapter [Teske et al., 2021f]), all hydrocarbons here peak at the same depths.
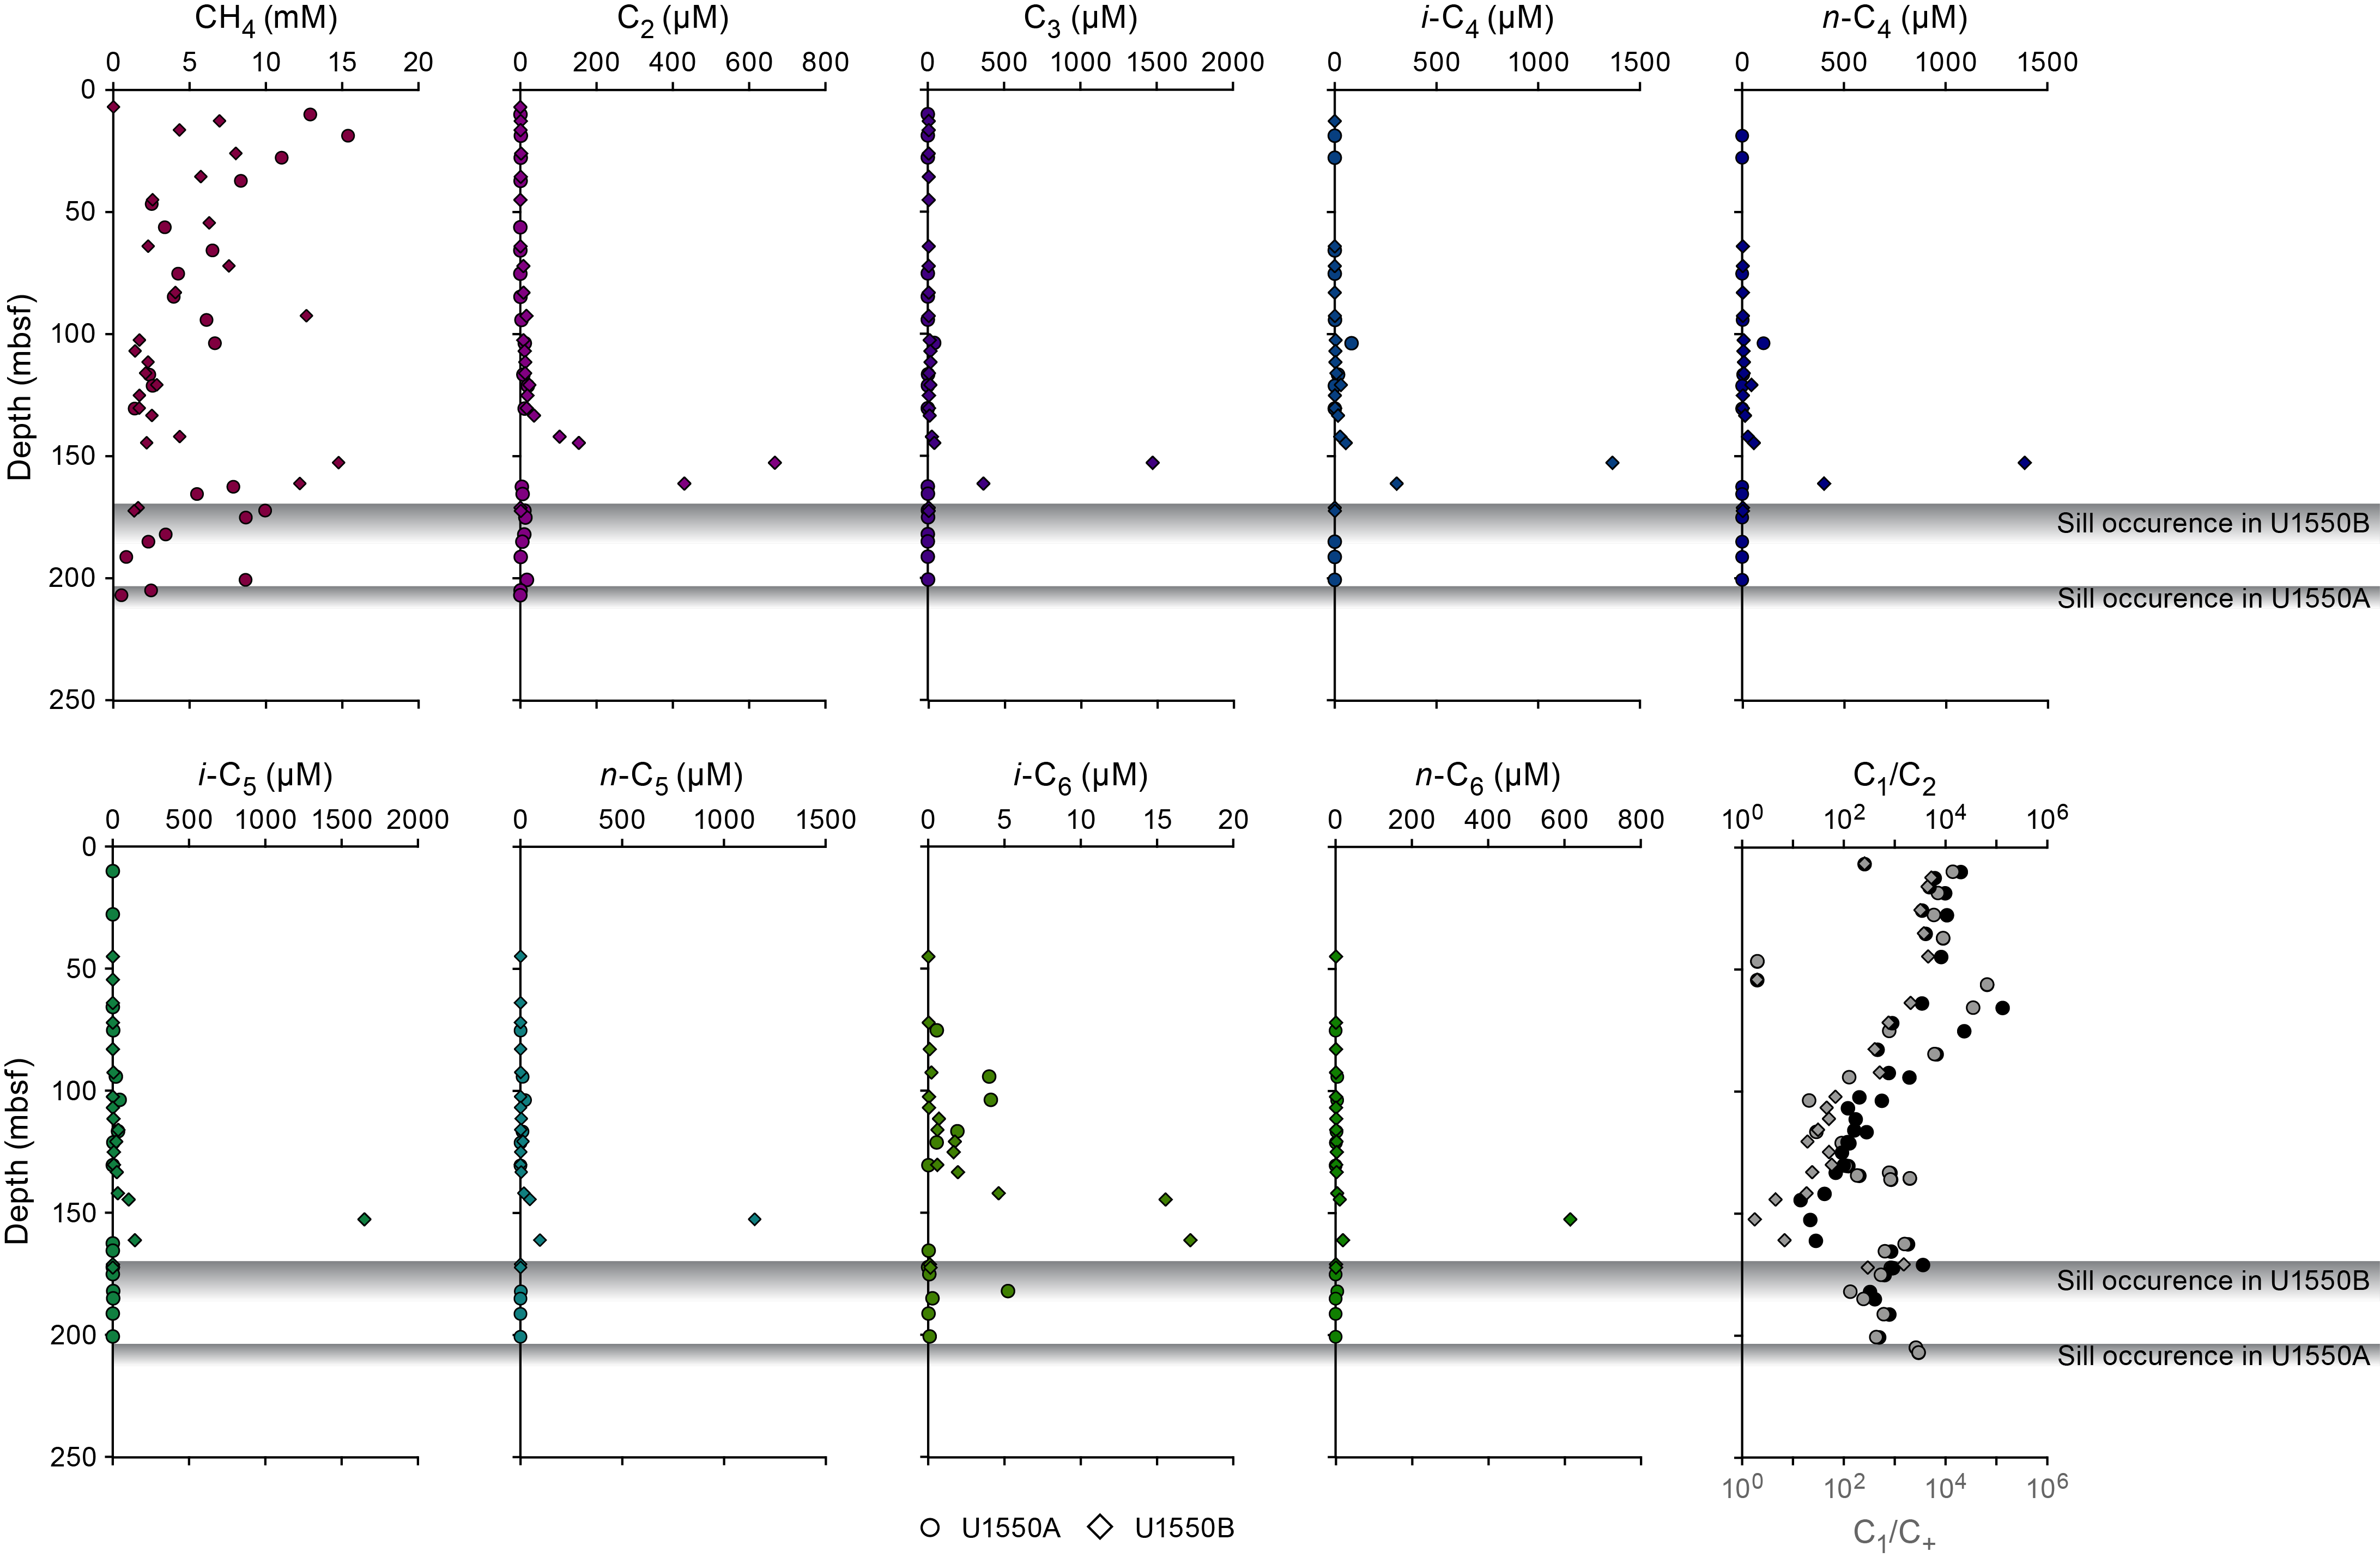
These trends in methane and C+ are reflected in values of C1/C2 and C1/C+ (Figure F25). C1/C2 values in Holes U1550A and U1550B differ in magnitude and appear to have a similar trend, with a depth offset ranging from ~20 to 40 m. In general, C1/C2 values in Hole U1550A are greater by approximately an order of magnitude than those observed in Hole U1550B. In each hole, a maximum appears in the upper part of the sediment column (~56 mbsf in Hole U1550A and ~13 mbsf in Hole U1550B). Below these depths, C1/C2 values decrease to minima at ~121 mbsf in Hole U1550A and ~144 mbsf in Hole U1550B. A second local maximum is observed farther downhole at ~135 mbsf in Hole U1550A and ~170 mbsf in Hole U1550B, corresponding to the bottom of this hole where igneous rocks were recovered. In Hole U1550A, which was cored to a greater depth than Hole U1550B, C1/C2 values then decrease to a second local minimum at ~182 mbsf before increasing in the igneous rocks at the bottom of the hole. C1/C2 values have an anomalous relationship with temperature in both Holes U1550A and U1550B (Figure F26), as defined by Pimmel and Claypool (2001). However, hydrocarbon concentrations were low in both holes, and in Hole U1550A, values moved from the anomalous region back into the normal C1/C2 temperature plot space (Figure F26). Therefore, coring operations were not modified in either hole, despite the anomalous C1/C2 values.

In addition to the headspace measurements described above, 20 void gas samples were taken from Holes U1550A and U1550B when void spaces were observed on the core receiving platform (Table T15). These samples were analyzed to determine the parts per million by volume concentrations and values of C1/C2 and C1/C+ (Figure F27). Void samples were dominated by methane, which was present at volume percent values ranging from ~60% to 92% with an average of ~74%. C2–C6 hydrocarbons are present in every interval sampled. The discernible trends mirror those seen in the headspace samples, namely the increase in C2–C6 hydrocarbons with depth in Hole U1550B.
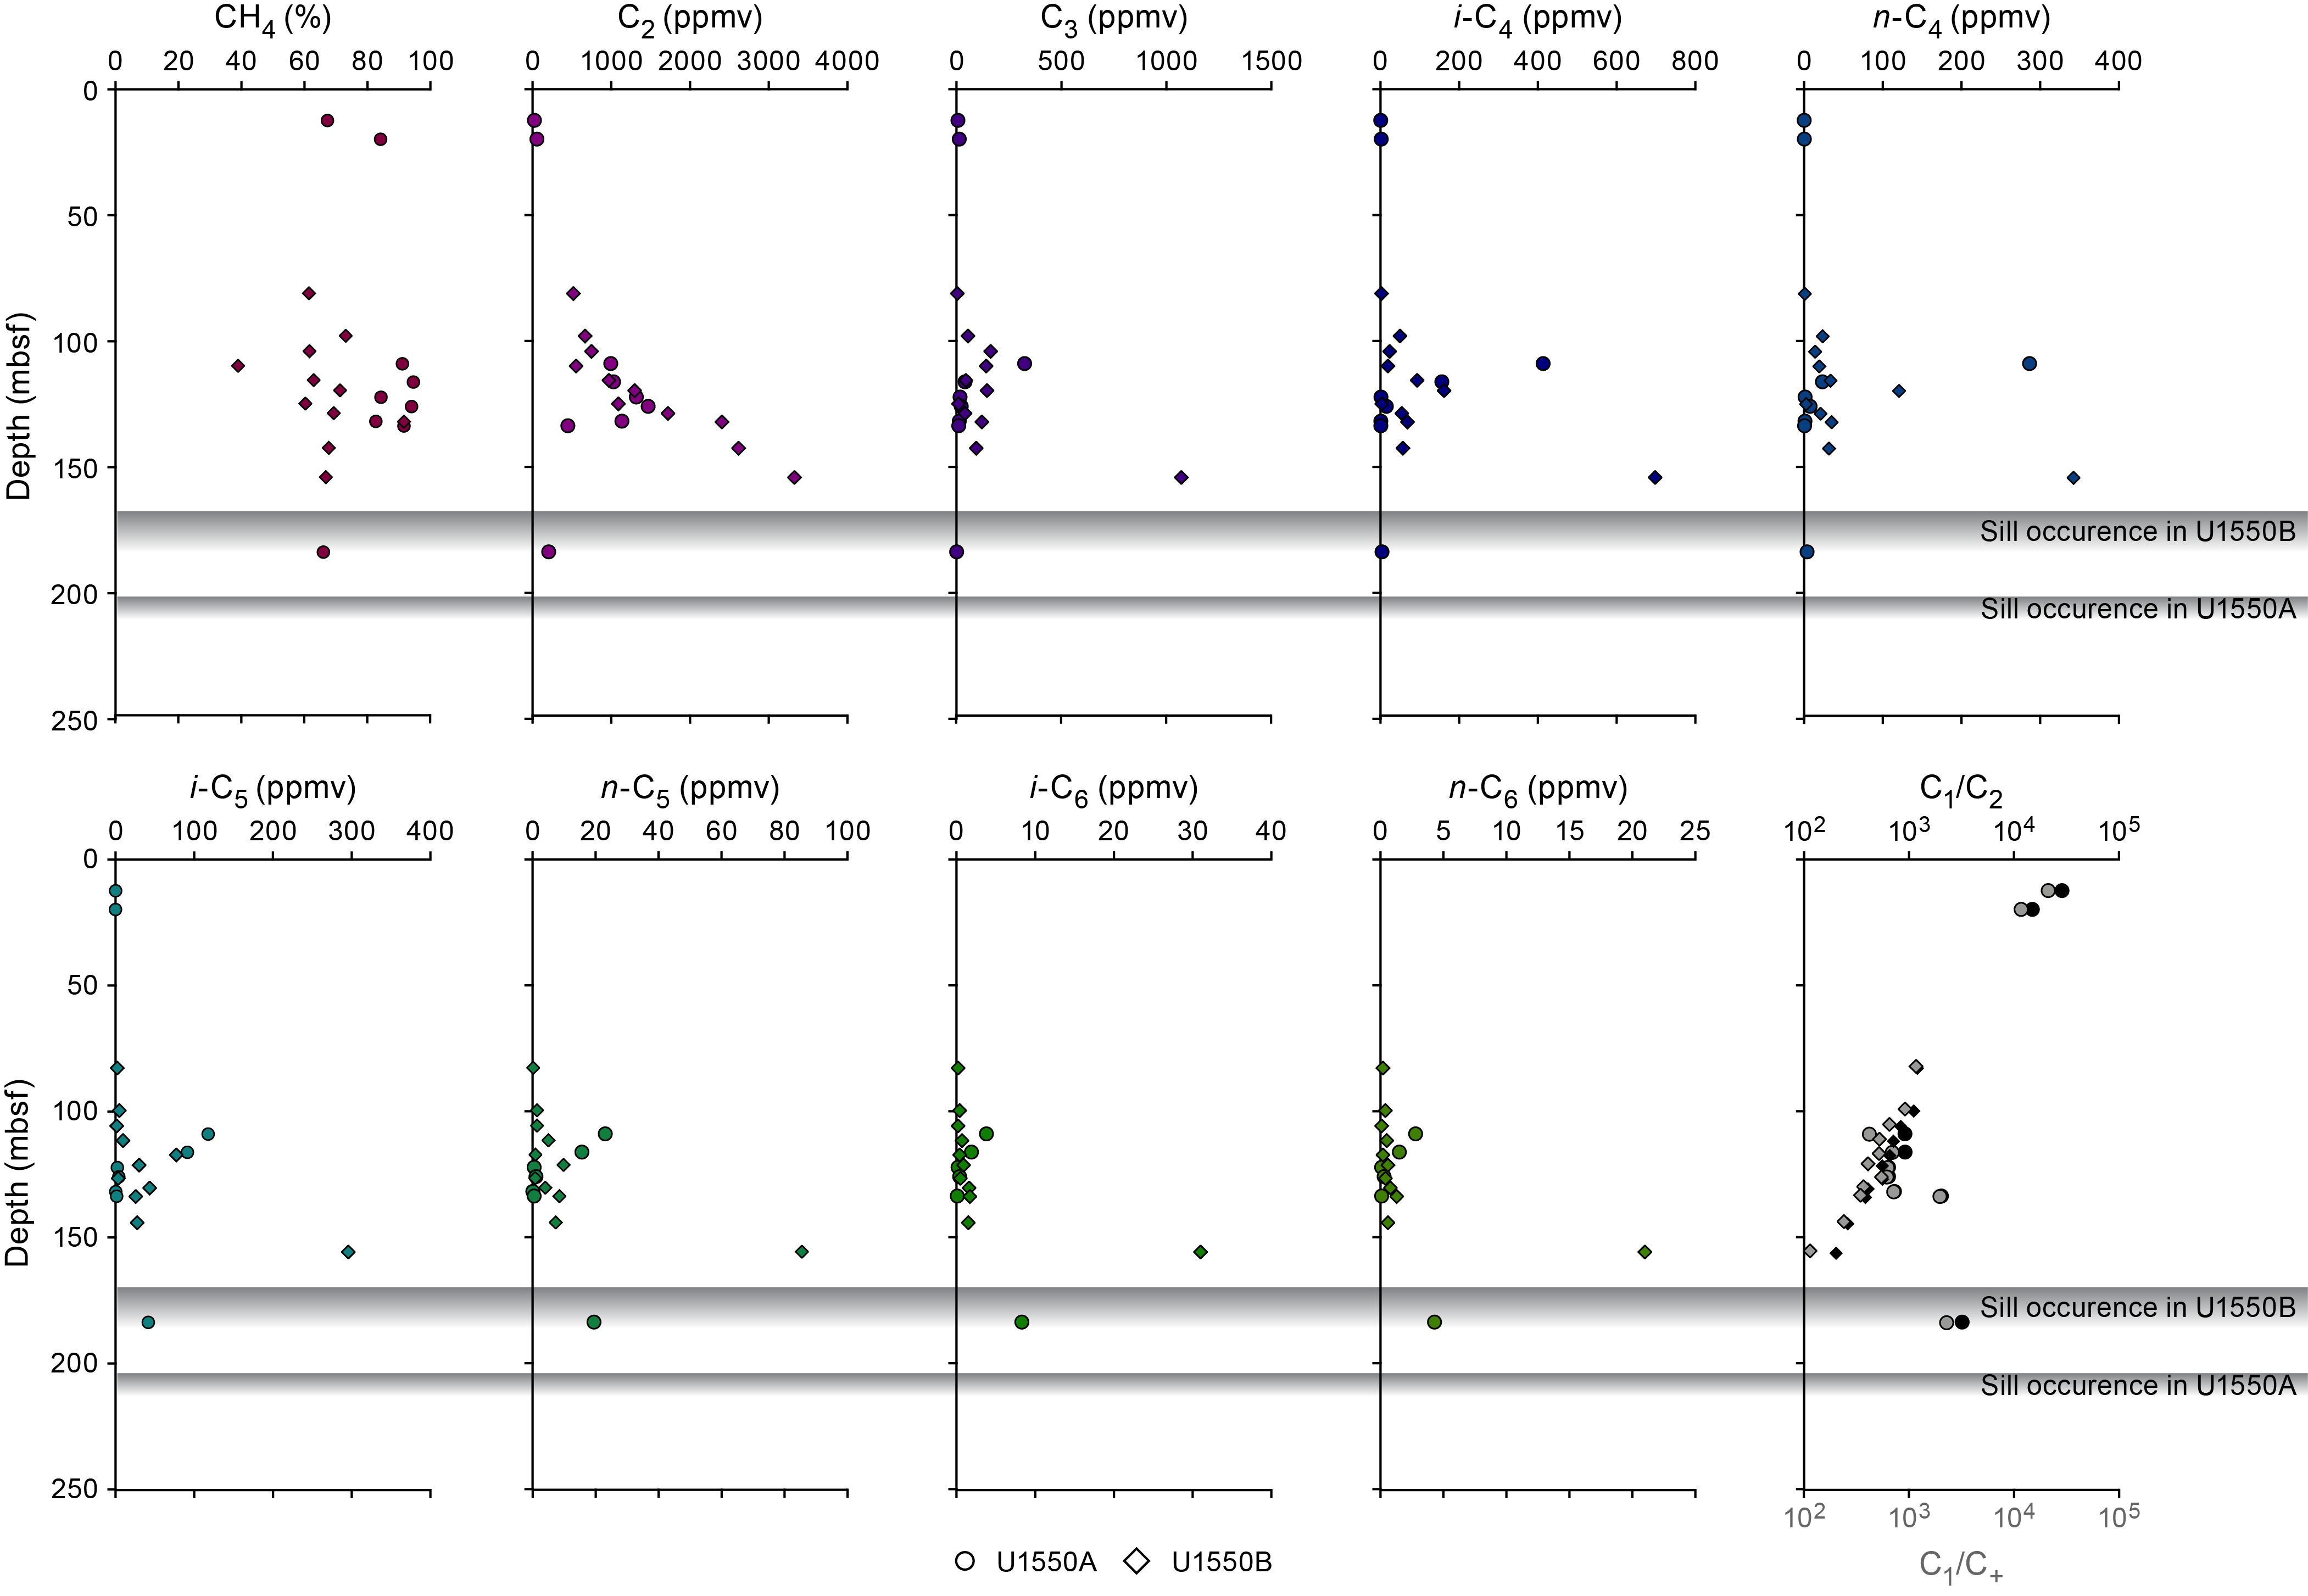
For Holes U1550A and U1550B, the lengths of the void spaces within the core liner created by expanding gases were measured immediately after core recovery on the core receiving platform (Table T16). The percent of void spaces ranged from 0% to 29% and generally increased with depth in both Holes U1550A and U1550B (Figure F28). In the upper 35 m of Hole U1550A, void space is initially 14%; it then decreases to 0% before increasing with depth. In Hole U1550B, voids are absent in the upper 15 m and then increase with depth.
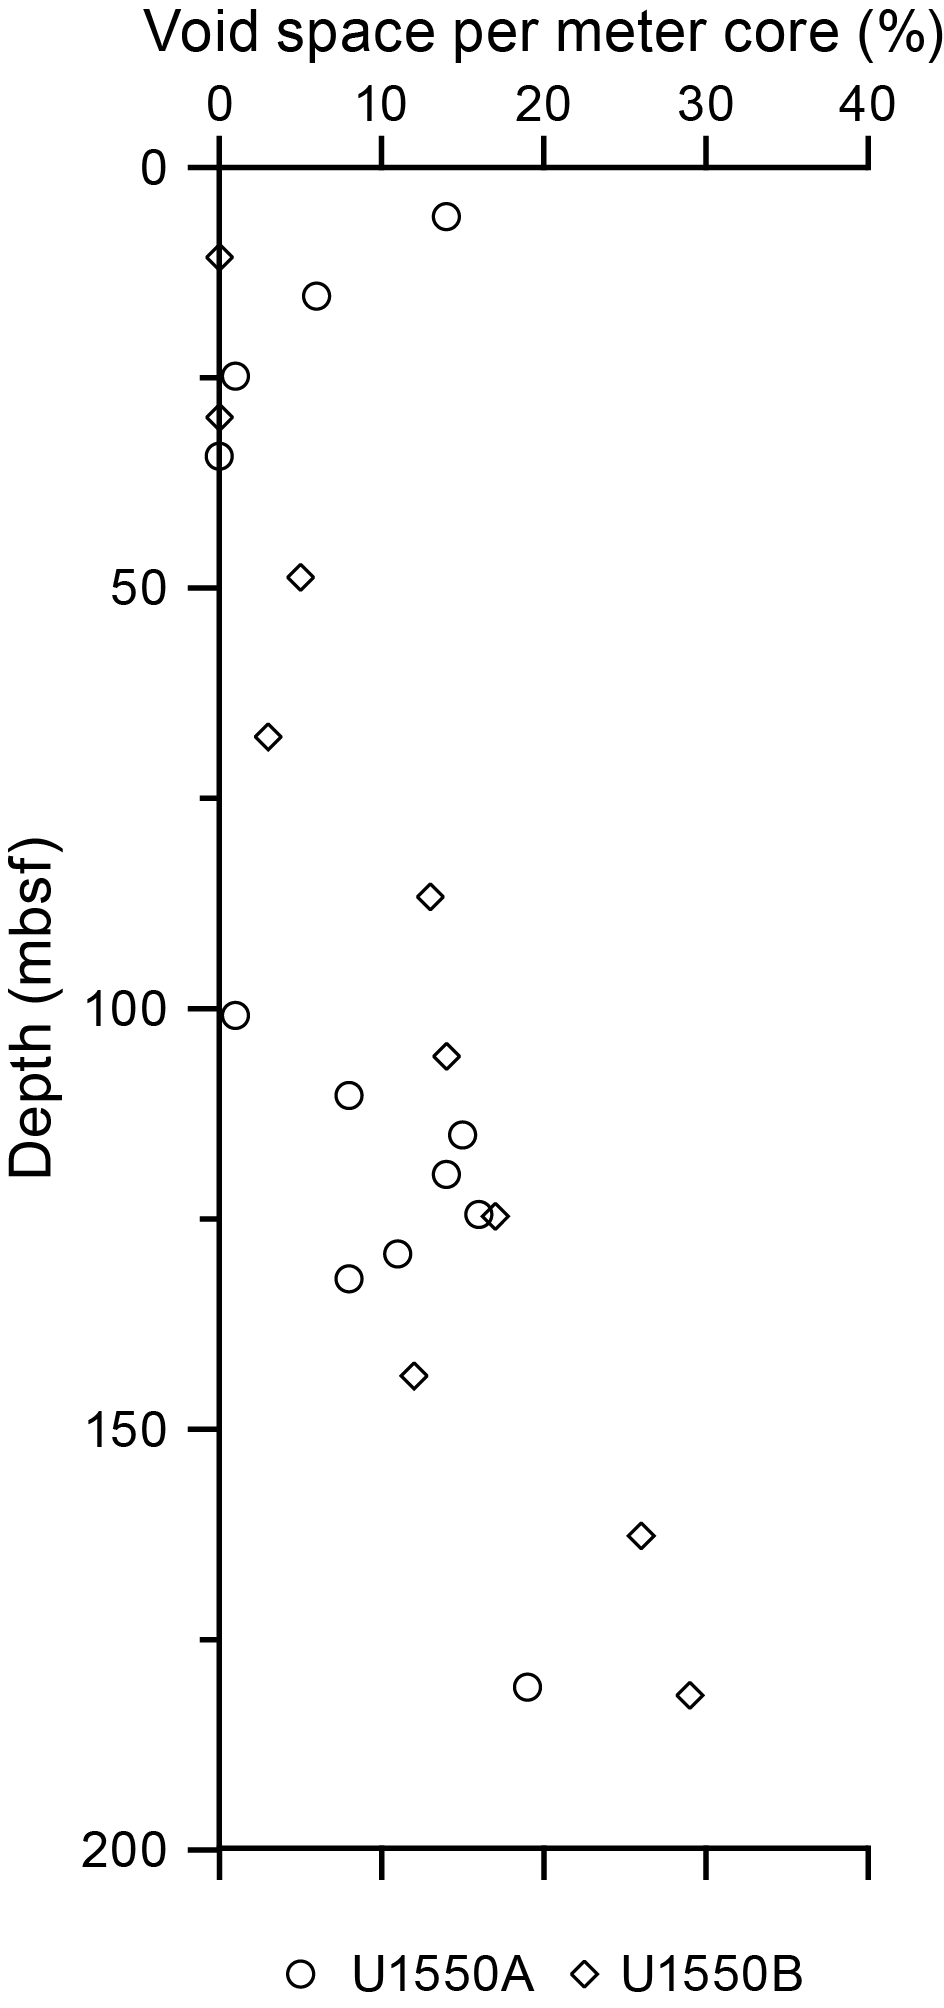
10.3. Rock incubations
During igneous rock recovery, three rock samples were incubated to facilitate degassing (see Organic geochemistry in the Expedition 385 methods chapter [Teske et al., 2021a]) for shipboard analyses of hydrocarbon, H2, and CO contents (Table T17). The concentration of CH4 within the pore spaces in these samples (see Organic geochemistry in the Expedition 385 methods chapter [Teske et al., 2021a]) ranges from ~1.5 to 3.7 mM, the pore space concentration of H2 ranges from ~0.5 to 7 µM, and the pore space concentration of CO ranges from ~0.6 to 1 µM.
10.4. Hydrogen and carbon monoxide
For Hole U1550B, headspace samples were taken from each core to monitor molecular hydrogen (H2) and carbon monoxide (CO) concentrations. Duplicate samples were collected from depths next to samples for safety gas monitoring of hydrocarbon gases (Table T18). Dissolved H2 and CO were extracted into a defined headspace, the headspace gas was analyzed, and molar concentrations of dissolved H2 and CO were determined as described in Organic geochemistry in the Expedition 385 methods chapter (Teske et al., 2021a). Because of the presence of H2 and CO in the analytical blank, the minimum quantification limits for in situ concentrations of dissolved H2 and CO were 40 and 150 nM, respectively. Concentrations of dissolved H2 increase with depth from below the minimum quantification limit at ~1.4 mbsf to 204 nM at ~152 mbsf (Figure F29). In contrast, CO varies from below the minimum quantification limit to 495 nM with no discernible downhole trend.
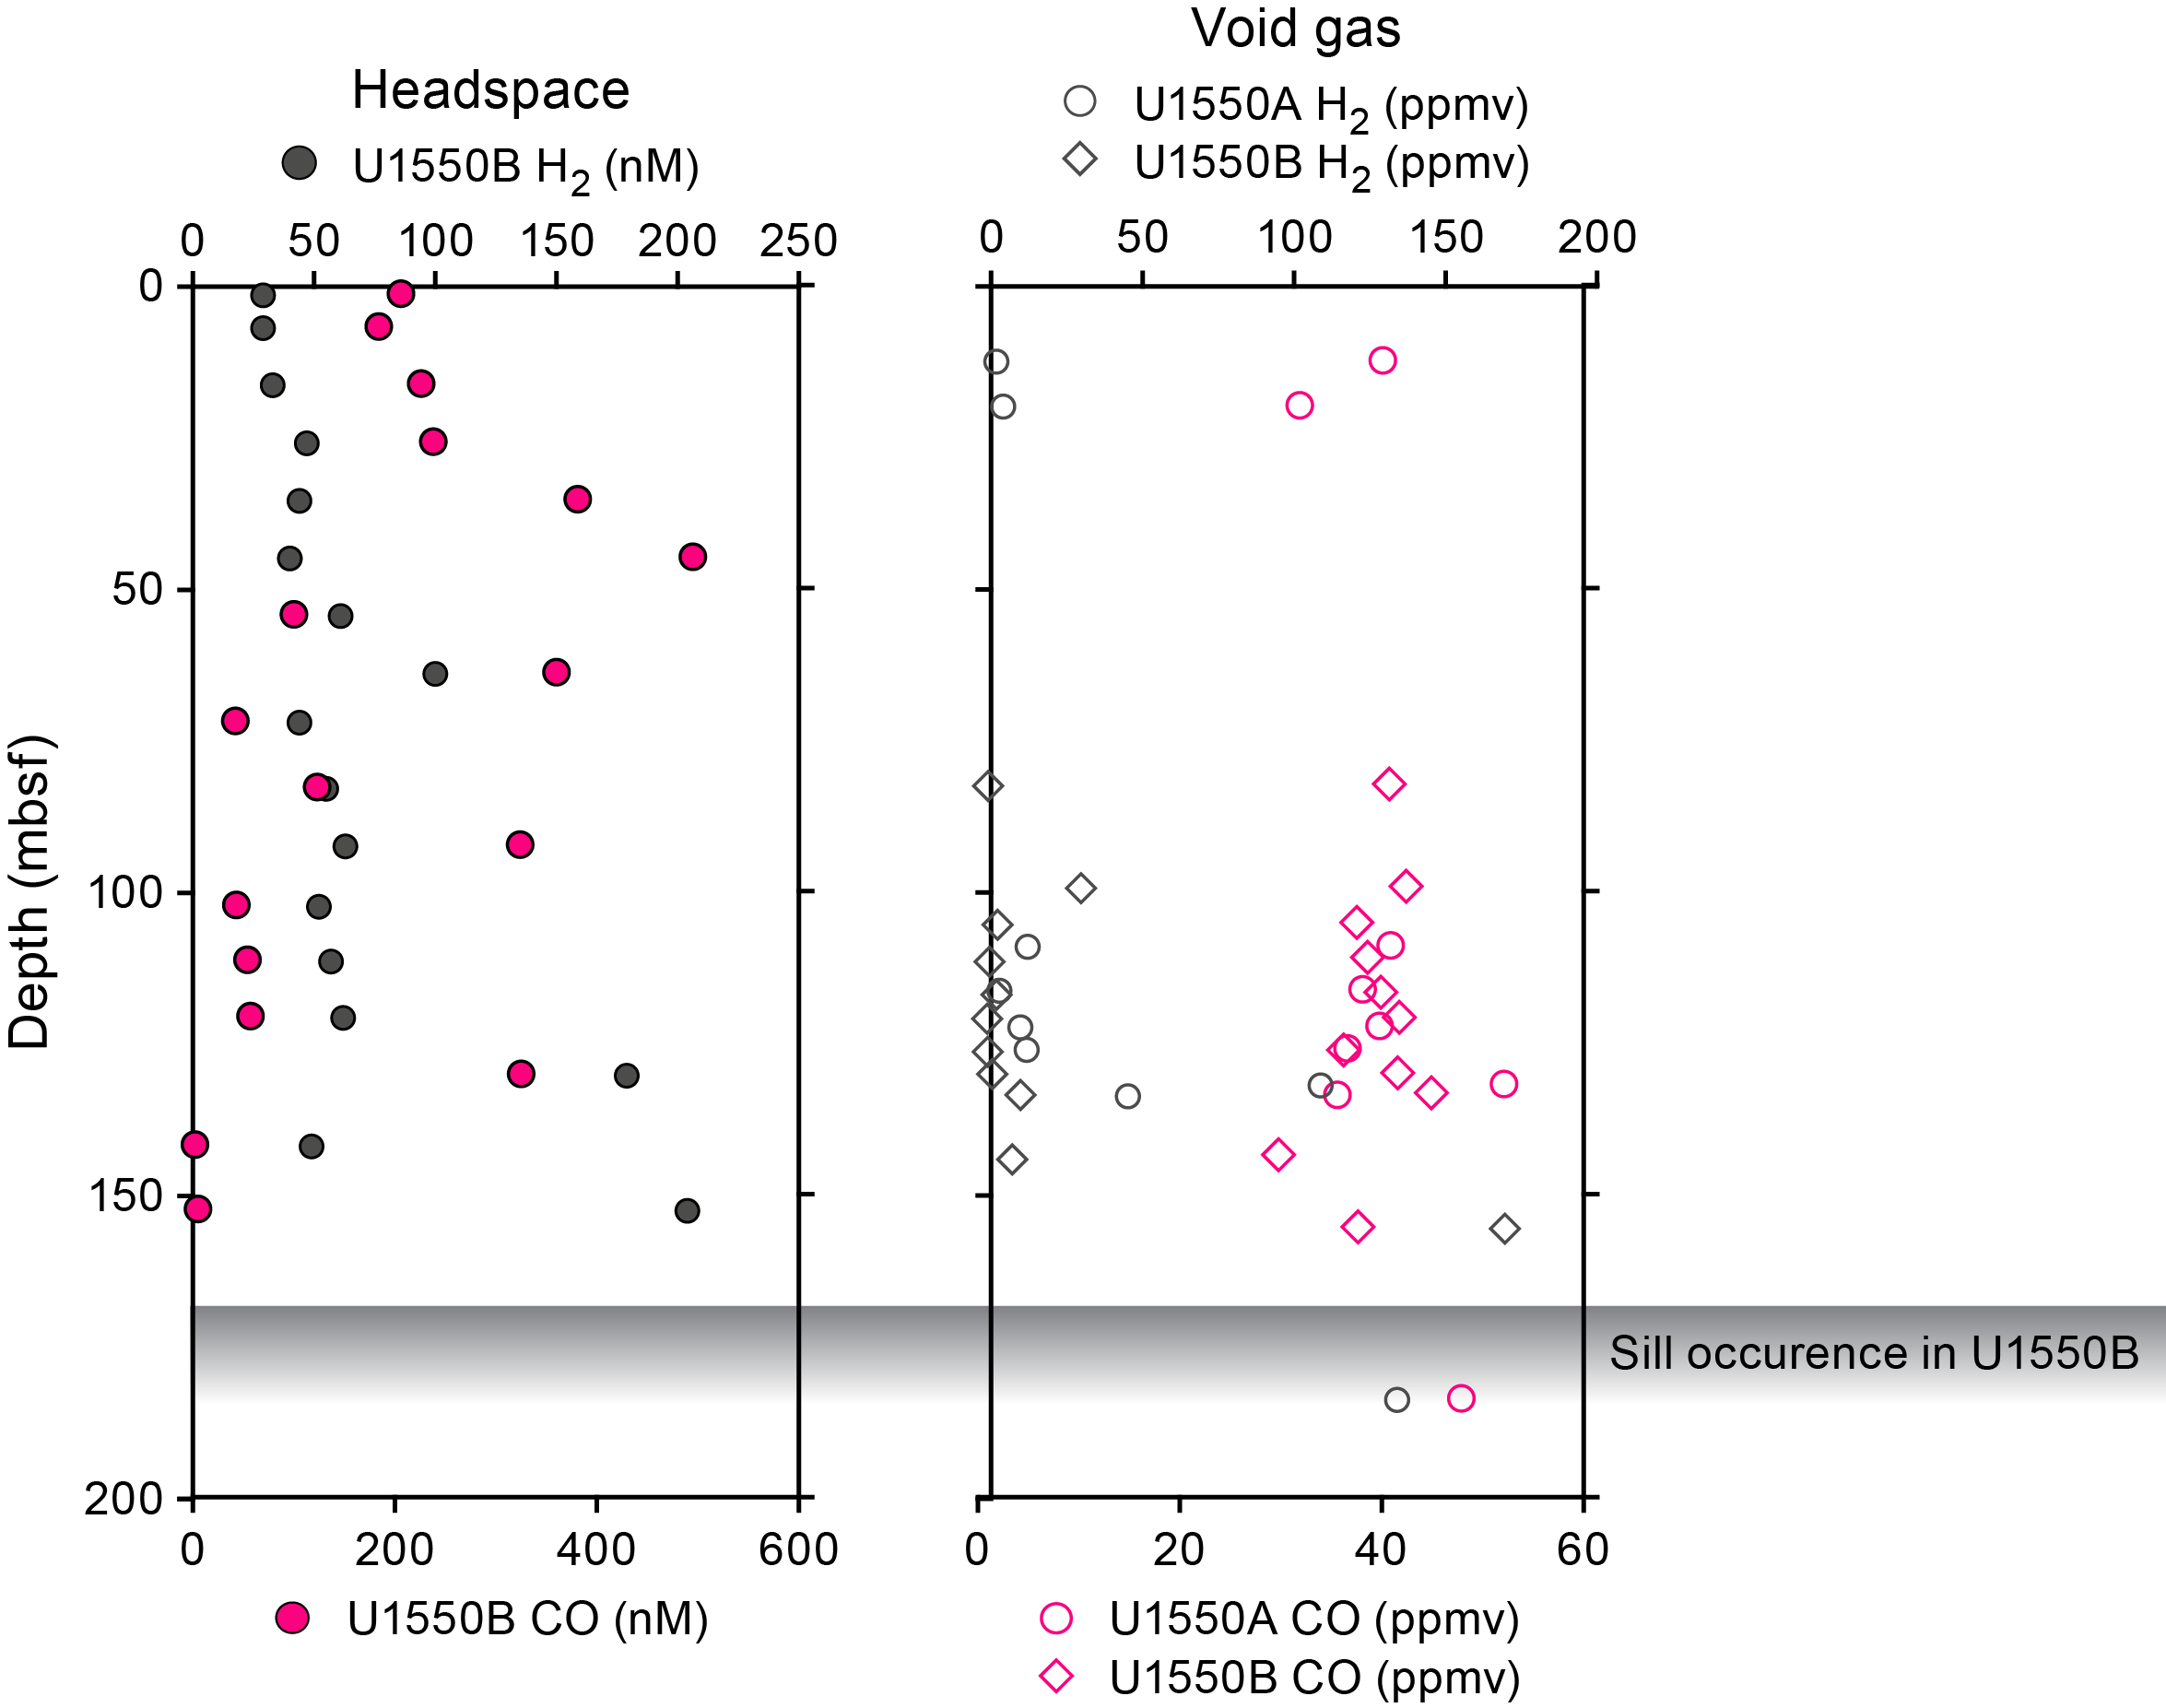
In addition to the headspace measurements described above, 20 void gas samples from Holes U1550A and U1550B were collected by gas-tight syringe and analyzed for H2 and CO contents (Table T19; Figure F29). In Hole U1550A, H2 content increases with depth from 2 ppmv at ~12 mbsf to 134 ppmv at ~184 mbsf, and CO content varies around ~40 ppmv. In Hole U1550B, H2 concentrations are generally <34 ppmv with no discernible trend to the bottommost sample at ~155 mbsf, in which an H2 concentration of 174 ppmv was observed. CO varies around an average value of 39 ppmv with no discernible downhole trend.
11. Microbiology
11.1. Sampling
Sediment cores for microbiological studies were obtained from Hole U1550B using the APC, HLPAC, and XCB coring systems. Hole U1550B is located in the northern axial valley ~51 m east-southeast from DSDP Site 481, where enrichments for hydrogenotrophic methanogens have been conducted and living methanogens were detected in shallow cores (Oremland et al., 1982). Because of its comparatively cool temperatures, this site presents an opportunity for microbiologists to examine the microbial abundance and community structure in sediments with a lower temperature gradient (134°C/km; see Petrophysics) compared to the other Expedition 385 sites. Sampling for cell counting, RNA analyses, and contamination tracing was performed as described in Microbiology in the Expedition 385 methods chapter (Teske et al., 2021a).
Detailed curatorial information about all samples taken (e.g., core, section, interval, and absolute depths of samples) can be retrieved from the Curation and Samples Laboratory Information Management System Online Report (http://web.iodp.tamu.edu/LORE).
11.2. Microbial cell detection and enumeration
11.2.1. Microbial cell counts
Cell abundance was determined by direct counting with an epifluorescence microscope. For shipboard analysis of sediment, samples (1 cm3) were aseptically taken from Hole U1550B sections using tip-cut syringes; selected samples (Sections 385-U1550B-1H-1, 1H-3, 2H-3, 3H-3, 4H-4, 6H-4, 8H-3, 11H-4, 15H-3, 19X-4, and 20X-3) were processed using the noncell extraction protocol described in Microbiology in the Expedition 385 methods chapter (Teske et al., 2021a). Cell abundance was 3.1 × 10⁶ cells/cm3 in bottom seawater and 1.1 × 10⁹ cells/cm3 in seafloor sediments. Below the seafloor, cell abundance gradually decreased to 1.3 × 10⁶ cells/cm3 at approximately 94.5 mbsf (Figure F30). Cell abundance dropped below the detection limit in Section 15F-3 (122.1 mbsf) and remained at this undetectable level throughout the remainder of the hole.
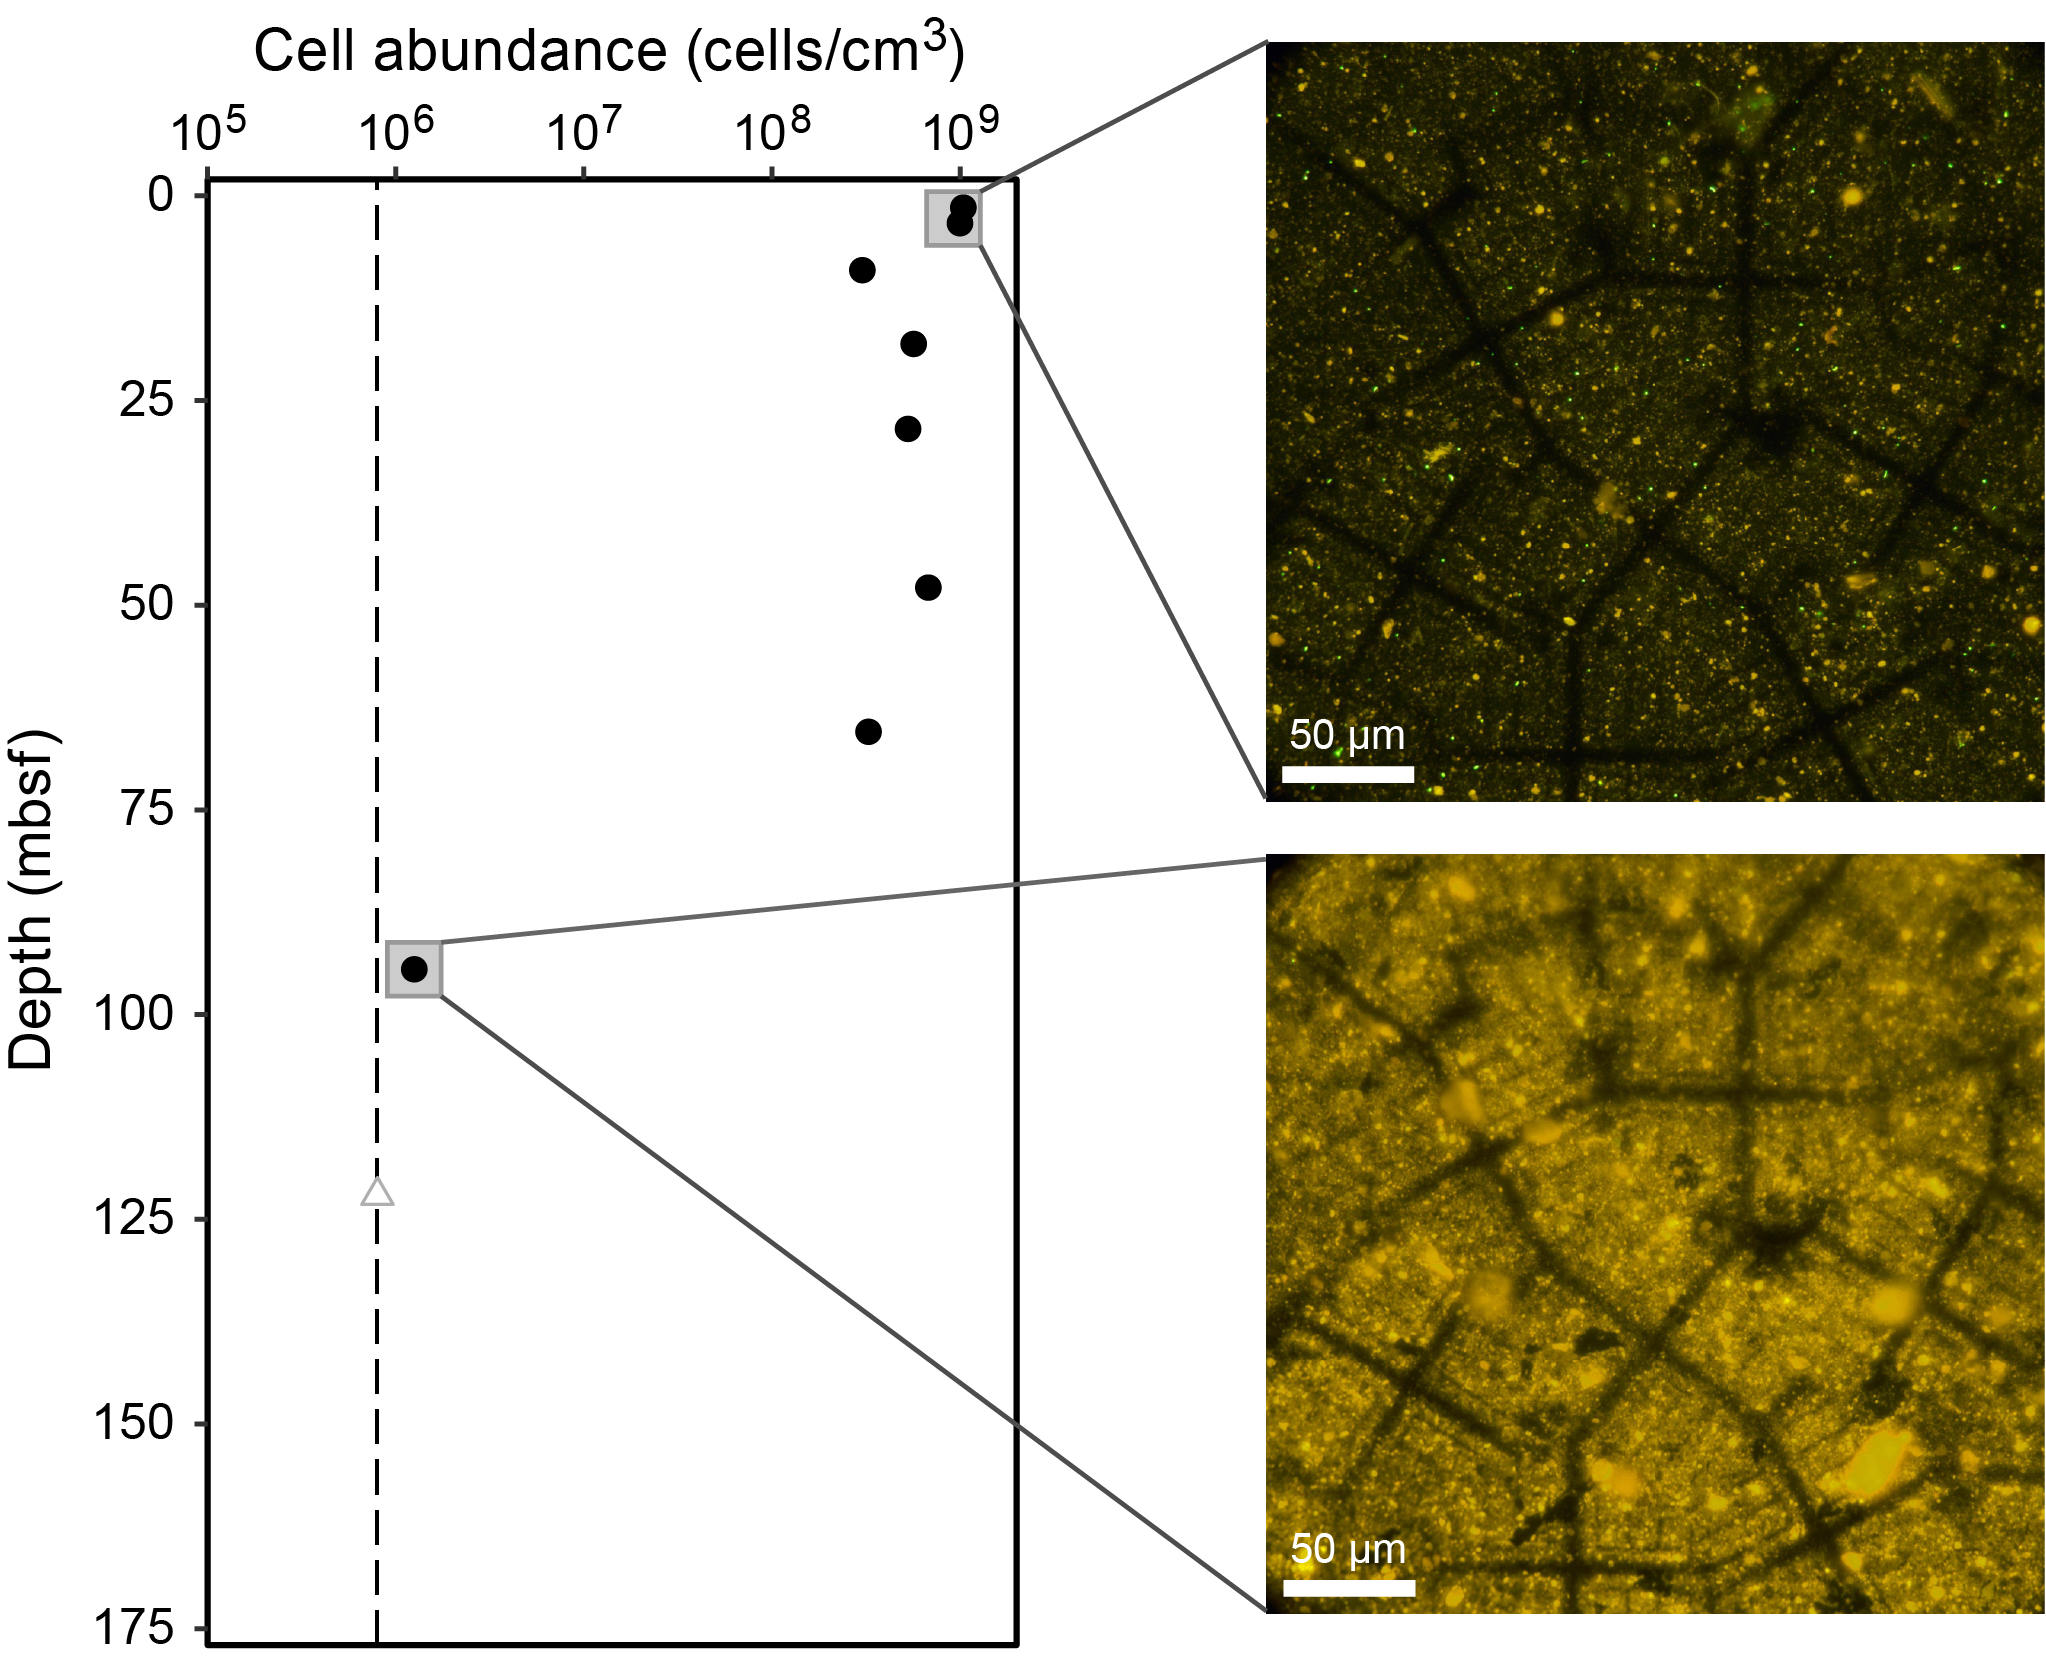
11.2.2. CARD-FISH cell counts of fungi
For catalyzed reporter deposition–fluorescence in situ hybridization (CARD-FISH) cell counts of fungi, ~10 cm3 sediment samples from Sections 385-U1550B-1H-2, 2H-2, 3H-2, 4H-3, 5H-2, 6H-3, 7H-2, 9H-2, 10H-2, 11H-2, 13F-2, 17F-2, and 19X-2 were fixed, washed, and stored as outlined in Microbiology in the Expedition 385 methods chapter (Teske et al., 2021a).
11.3. Microbial activity measurements
11.3.1. Single-cell stable isotope analysis
Whole-round samples taken from Sections 385-U1550B-1H-3, 2H-3, 3H-3, 5H-3, 7H-3, 9H-3, 11H-3, 13F-3, 17F-3, and 19X-3 were immediately stored at ~4°C under anaerobic conditions in preparation for potential shore-based incubation and single-cell stable isotope analysis using nanoscale secondary ion mass spectrometry (NanoSIMS) (see Microbiology in the Expedition 385 methods chapter [Teske et al., 2021a]).
11.3.2. Sulfate reduction activity
Whole-round samples (length = 10 cm) were taken from Sections 385-U1550B-1H-2, 2H-2, 2H-4, 3H-2, 3H-4, 4H-3, 5H-2, 7H-2, 9H-2, 11H-2, 13F-2, 15F-2, 17F-2, and 19X-2 and immediately stored anaerobically at ~4°C. Because of the shallow SMTZ at approximately 5–15 mbsf, a higher sample density was chosen for the upper 30 mbsf. All samples were collected and stored for shore-based analysis.
11.4. Cultivation experiments
11.4.1. Cultivation of methanogenic subsurface microorganisms
Sediment samples from Hole U1550B were selected for stable isotope incubations and enrichments of potential methanogenic populations (Table T20). Corresponding sediment slurries were prepared as described in the expedition-specific protocols (see Microbiology in the Expedition 385 methods chapter [Teske et al., 2021a]) to enable later enrichments in the home laboratory on shore. As a starting point for enrichment and incubation monitoring, subsamples of around 50 cm3 were frozen at −80°C within a few hours of core recovery for planned shore-based metagenomic and metabarcoding analyses.
11.4.2. Cultivation experiments for fungi
For each sample (Sections 385-U1550B-1H-2, 2H-2, 3H-2, 4H-3, 5H-2, 6H-3, 7H-2, 9H-2, 10H-2, 11H-2, 13F-2, 17F-2, and 19X-2), two enrichment cultures were initiated by placing 5 mL of sediment into each of two 30 mL Hungate bottles with 15 mL of filtered bottom water, filling with Biomix gas (5% H2:70% N2:25% CO2), capping, and storing at ~4°C. Additional live sediment overlaid with filtered bottom water was stored anaerobically in 250 mL glass bottles flushed with Biomix gas and stored at ~4°C. These samples will be subjected to fungal enrichment experiments in a shore-based laboratory.
11.4.3. Methanogenic and sulfate-reducing microbial enrichments and DNA preservation for metagenomic analyses
Whole-round core samples were collected from Hole U1550B (Sections 9H-2, 11H-2, 13F-2, 17F-2, and 19X-2) for shore-based microbial enrichments and DNA extraction for downstream metagenomic analyses. Whole-round core samples of 10 cm in length were stored in anaerobic (N2 gassed) Mylar bags at ~4°C for shore-based enrichments and in sterile Whirl-Pak bags at −80°C for shore-based metagenomic analyses.
12. Petrophysics
Measurements of physical properties on whole-round cores and section halves (primarily working halves) were compared between Holes U1550A and U1550B for lithostratigraphic characterization and correlation with core description information. These holes were cored to ~207 mbsf (Hole U1550A) and ~173 mbsf (Hole U1550B), and a good correlation based on measurements of physical properties was obtained, although some slight differences were visible.
Four in situ formation temperature measurements were conducted using the APCT-3 and SET2 tools to calculate geothermal gradient and heat flow. Conductivity measurements made on cores from both Holes U1550A and U1550B show a similar increasing trend with depth. Rheological measurements reveal a general trend of increasing shear strength and identify three distinct depth intervals within this trend: from the seafloor to 43 mbsf, 43–86.5 mbsf, and below 96.5 mbsf. Porosity strongly decreases due to the presence of a sill at the bottom of both holes. Rheology and porosity measurements can be correlated with three lithostratigraphic subunits (IA–IC) and are negatively correlated with the rest of the physical properties (i.e., bulk density). Measured physical properties for Holes U1550A and U1550B show a good correlation with depth except at ~80 mbsf, where the peaks of NGR, MS, and P-wave velocities vary. These physical properties reflect the presence of a sill found in both holes: at ~204 mbsf in Hole U1550A and at ~170 mbsf in Hole U1550B.
12.1. Data acquisition
Core laboratory measurements were conducted as explained in Petrophysics in the Expedition 385 methods chapter (Teske et al., 2021a) for Holes U1550A and U1550B. Measured properties and measurement procedures are listed in Tables T17 and T18 in the Expedition 385 methods chapter (Teske et al., 2021a).
12.2. Downhole temperature and thermal conductivity
12.2.1. Downhole temperature
Four in situ formation temperature measurements were conducted using the APCT-3 and SET2 tools (see Petrophysics in the Expedition 385 methods chapter [Teske et al., 2021a]). Measured formation temperatures range from 7.92°C at 34.3 mbsf (Core 385-U1550A-4H) to 19.2°C at 125.4 mbsf (Core 16F) (Table T21). These values indicate that the formation temperature increases with depth along a linear geothermal gradient of 135°C/km (Figure F31A). The slope of the linear fit between thermal resistance and formation temperature (Figure F31C) indicates a heat flow of 110 mW/m2.
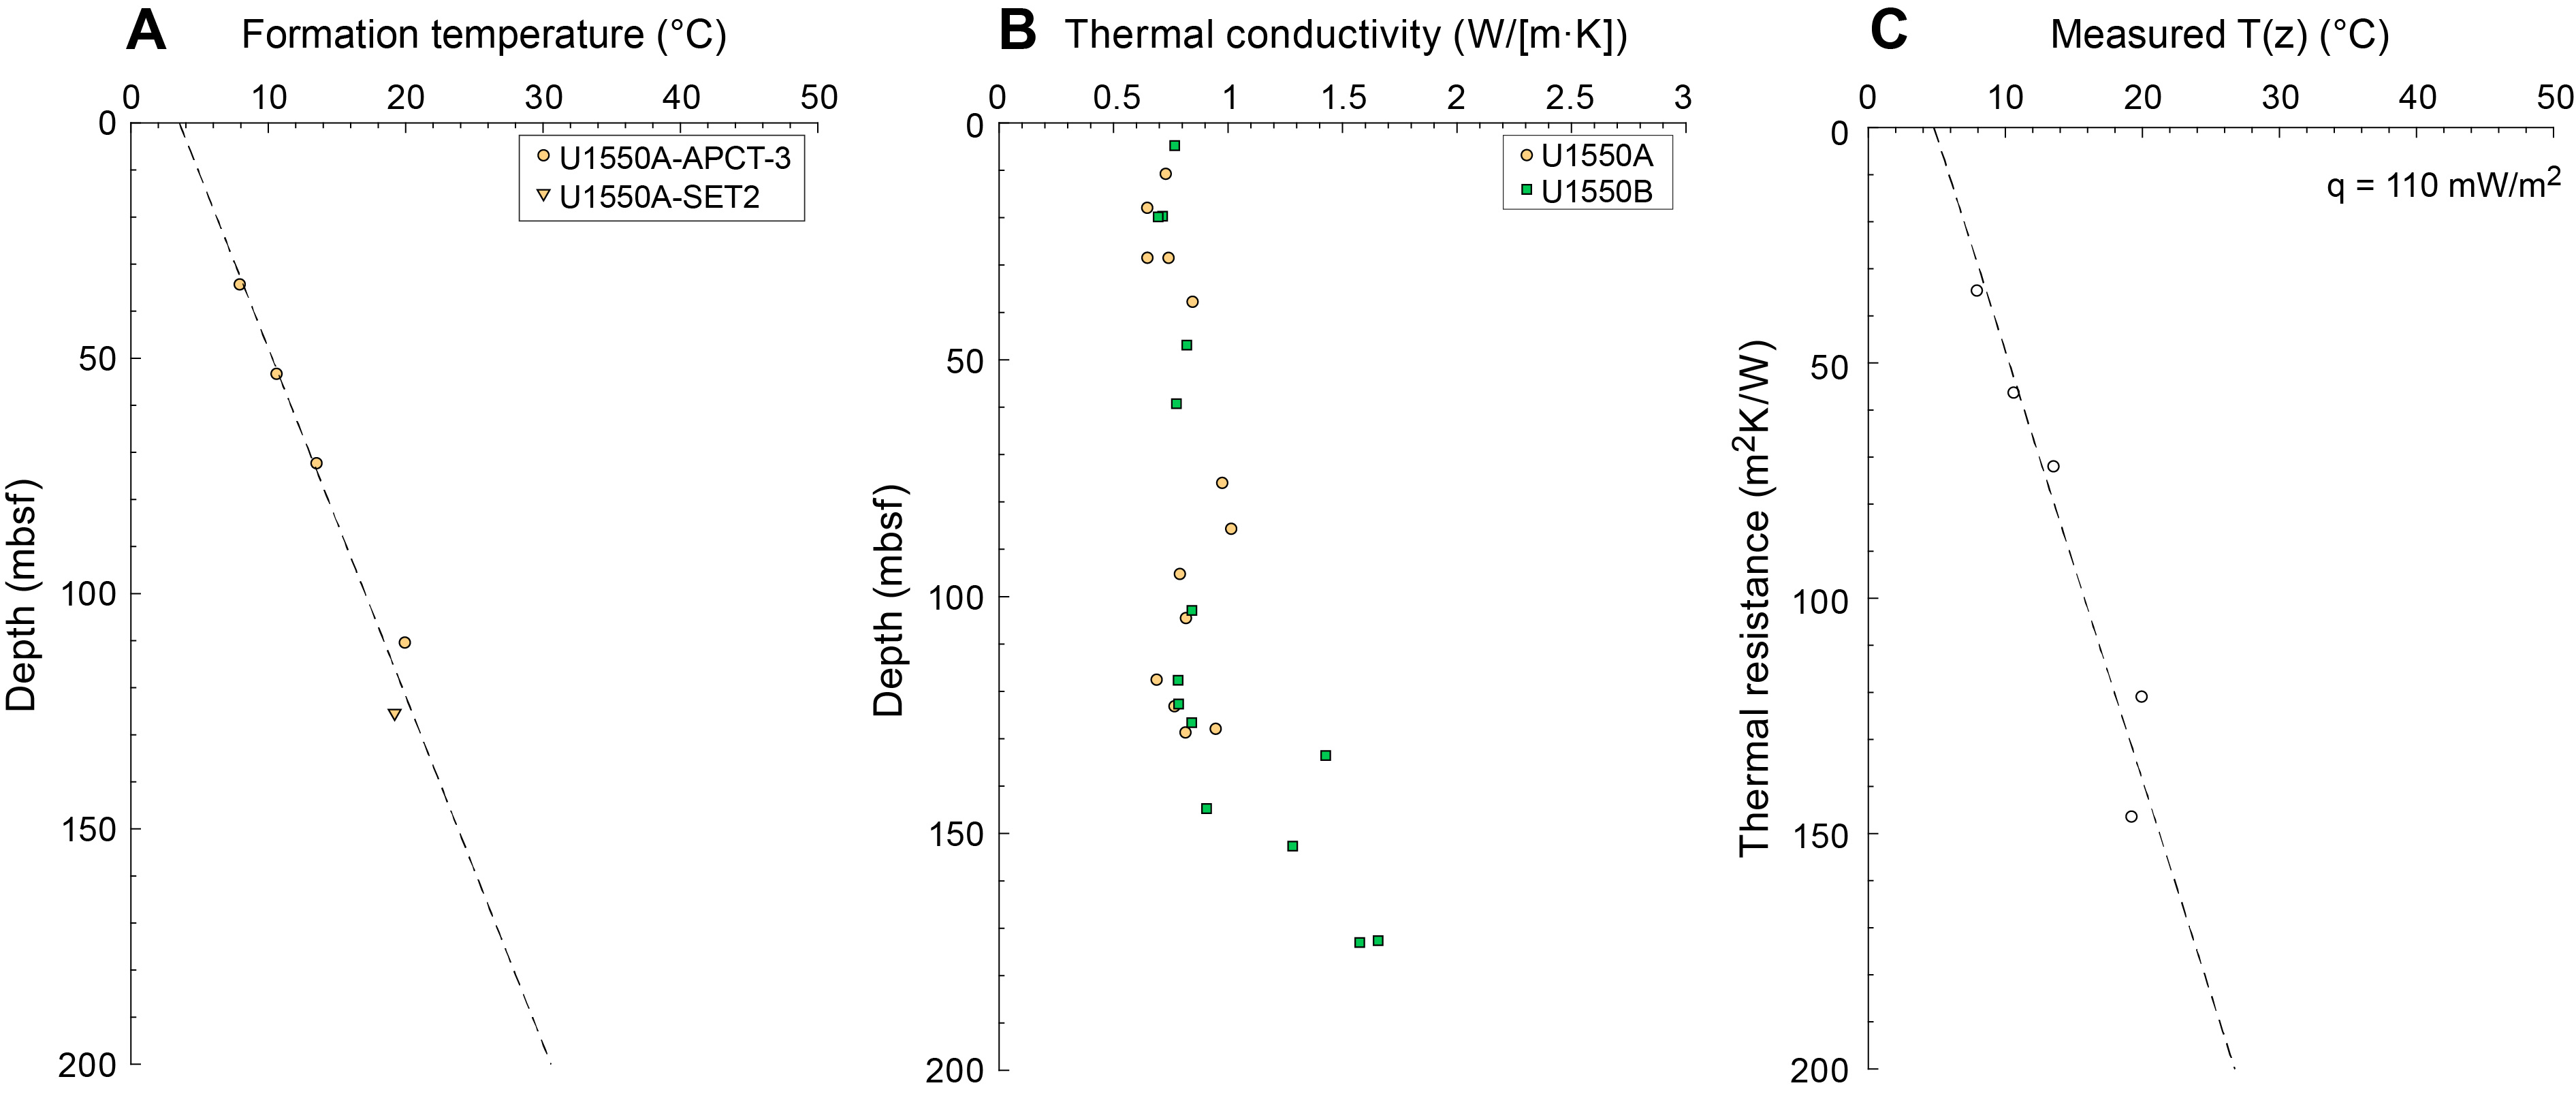
12.2.2. Thermal conductivity
Thermal conductivity for Holes U1550A and U1550B varies between ~0.65 and ~1.66 W/(m·K) with a mean of 0.90 ± 0.27 W/(m·K) (Figure F31B). Measurements for Hole U1550B show a trend similar to values from Hole U1550A.
12.3. Density (core and grain)
Moisture and density (MAD) bulk density measurements are in good agreement with the upper values obtained from gamma ray attenuation (GRA) bulk density measurements (Figure F32B). Density increases in the uppermost ~55 m from 1.1 g/cm3 at the seafloor to a maximum value of ~1.9 g/cm3. After a small decrease to 1.3 g/cm3 at ~58 mbsf, density increases linearly to ~2.0 g/cm3 at ~87 mbsf for Hole U1550A and 1.8 g/cm3 at ~92 mbsf for Hole U1550B. From 94 to 140 mbsf, density is generally lower, ranging from 1.3 to 1.6 g/cm3. Finally, relatively constant values around ~1.6–1.8 g/cm3 (MAD) are observed between ~145 and ~200 mbsf (Figure F31B).
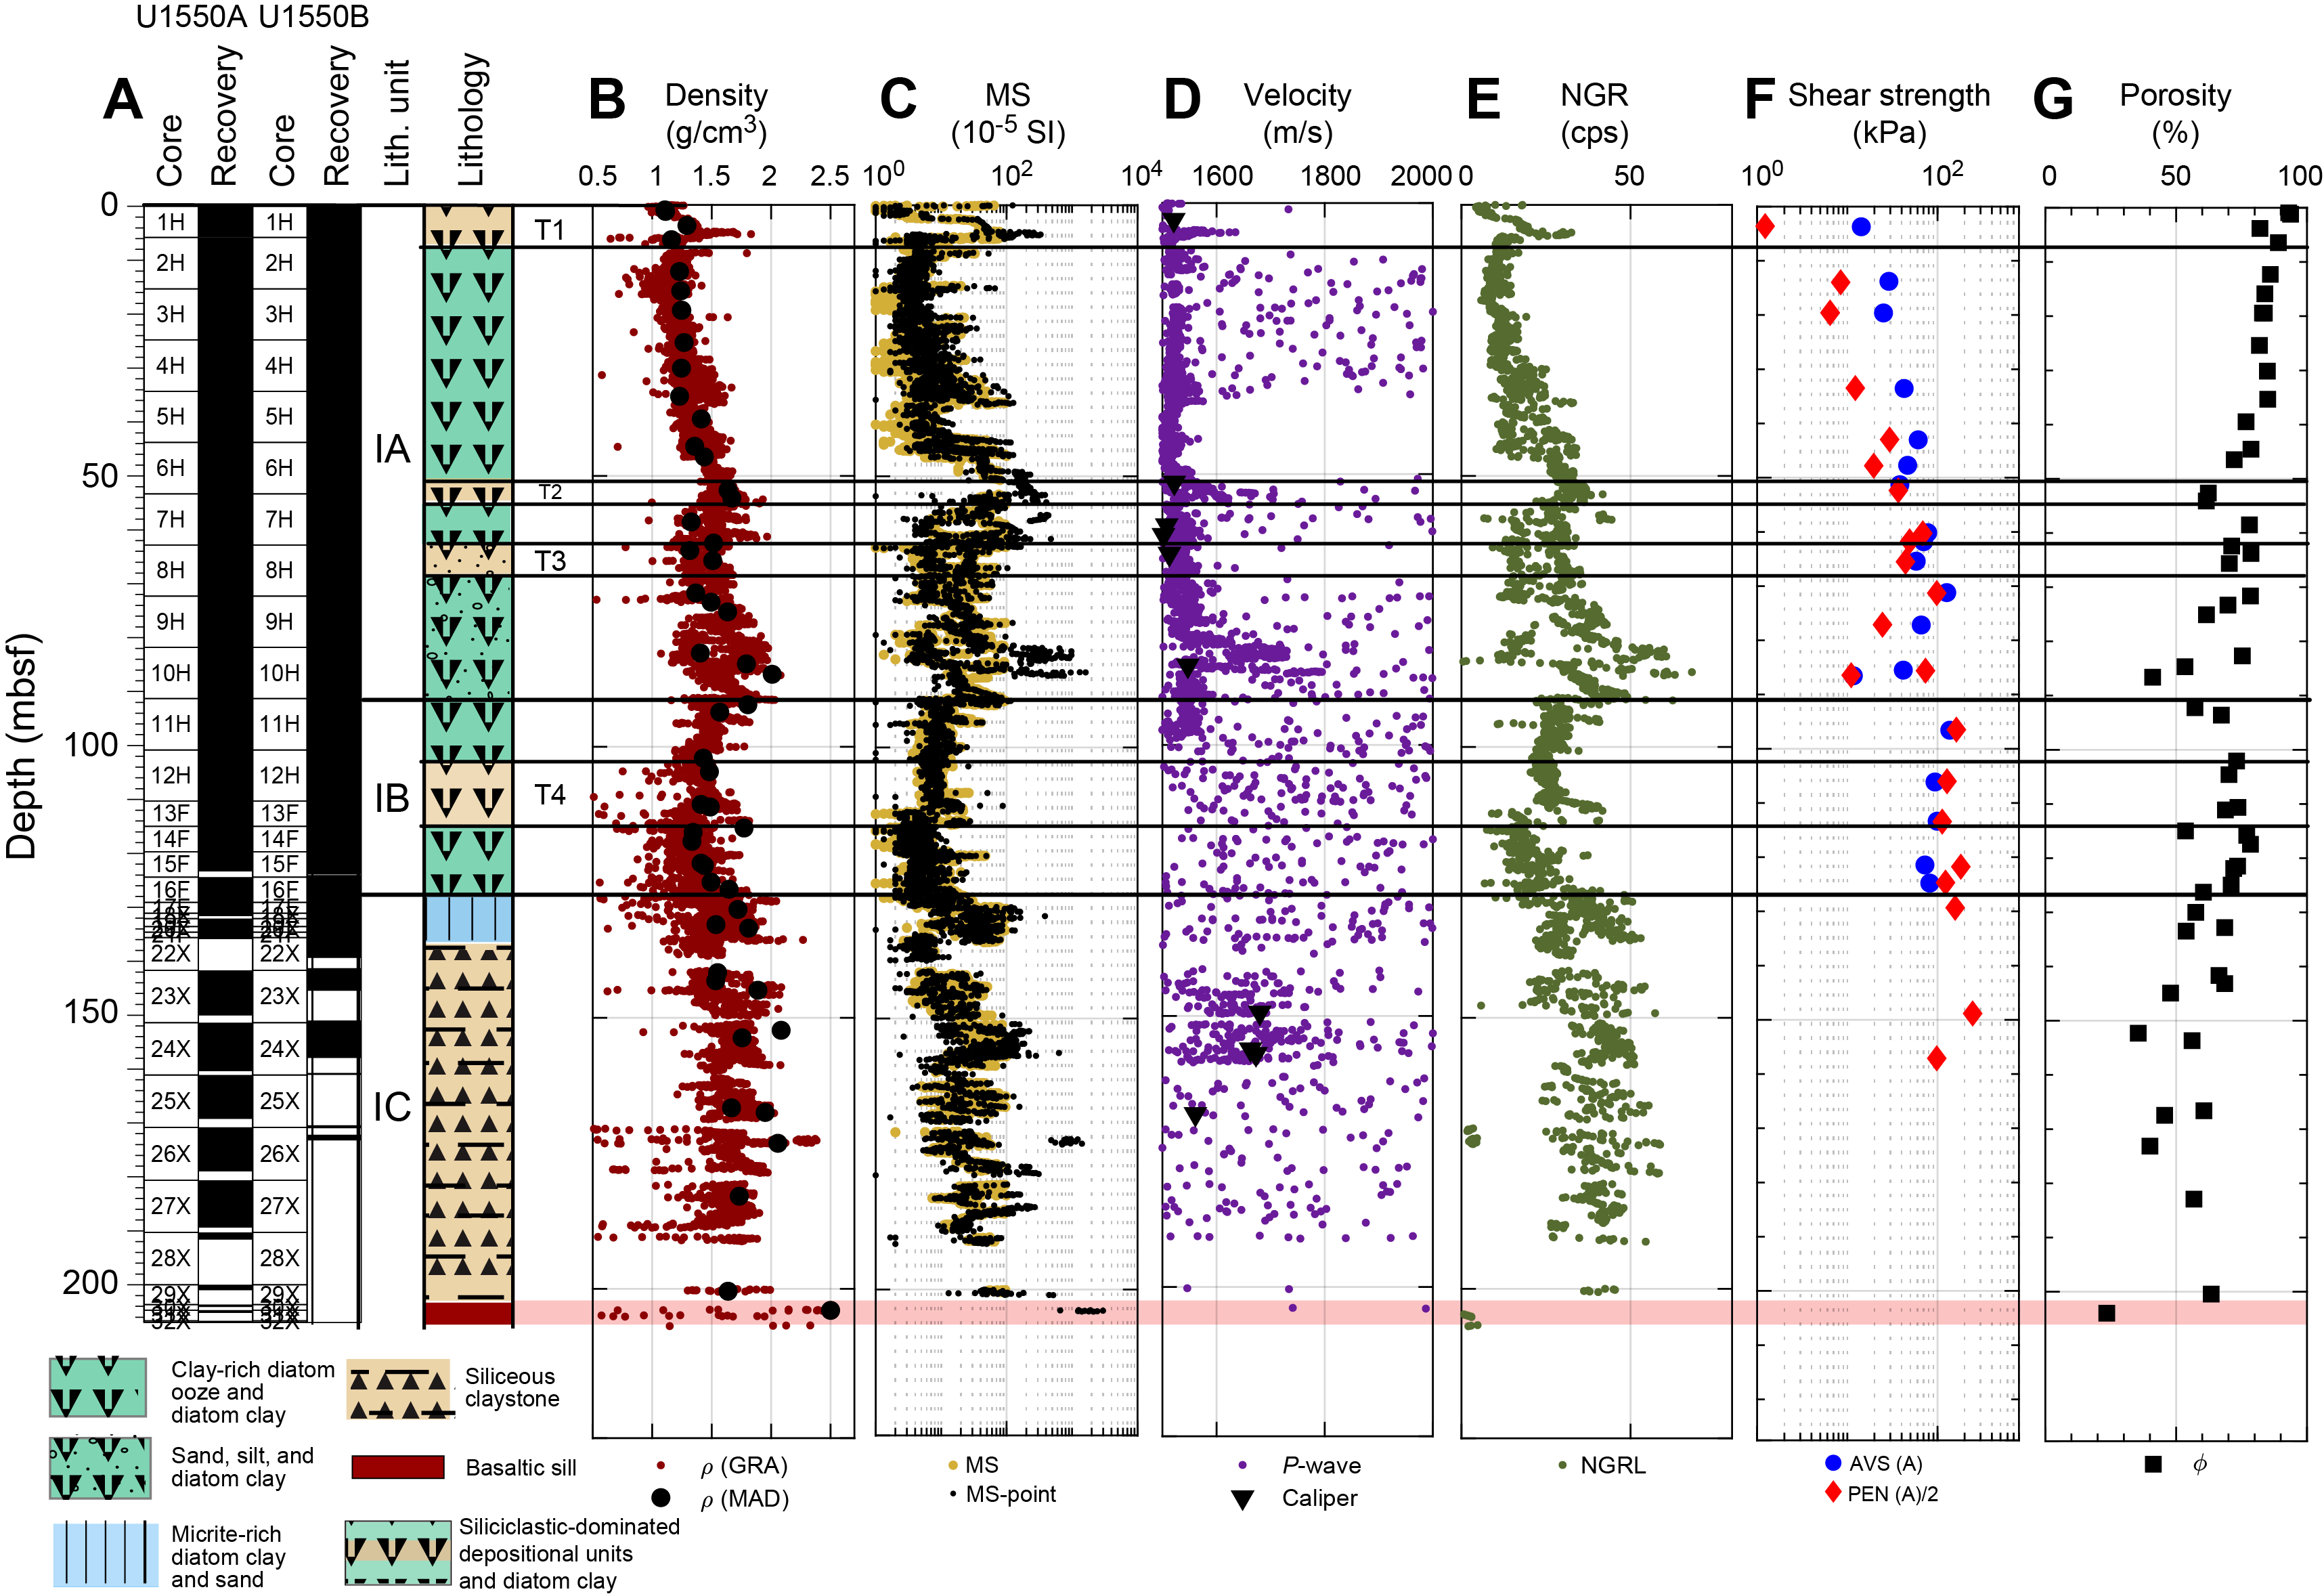
Peak density values observed at ~5, ~55, ~86, ~115 and 145 mbsf are consistent with peaks in NGR, MS, and P-wave velocity. The general density trend from the seafloor to ~55, ~55 to ~87, and ~102–142 mbsf is negatively correlated with porosity and positively correlated with rheological parameters (Figure F32).
The basaltic to doleritic sills encountered at the bottom of both holes (U1550A = ~204 mbsf; U1550B = ~170 mbsf) show relatively high densities. For Hole U1550A, GRA values up to ~2.4 g/cm3 are close to the MAD measurement of ~2.5 g/cm3, and the sill material recovered from Hole U1550B also has GRA density values up to ~2.4 g/cm3.
12.4. Magnetic susceptibility
MS was measured on the Whole-Round Multisensor Logger (WRMSL) (MS) and the Section Half Multisensor Logger (SHMSL) (point magnetic susceptibility). Values are in very good agreement along the entire profile (Figure F32C) and correlate with peaks observed in NGR, density, and P-wave velocity. Values are around ~11 × 10−5 SI in both holes and are mainly constant to ~50 mbsf. From ~55–110 mbsf, MS values show a mean of ~18 × 10−5 SI. A decrease to a mean value of ~16 × 10−5 is observed around 150 mbsf. From this depth to the bottom of Hole U1550A, values range from 10 × 10−5 to 100 × 10−5 SI.
High MS values are consistently observed at the depth of the recovered sills encountered in both holes (Hole U1550A = ~204 mbsf; Hole U1550B = ~170 mbsf).
12.5. Sonic velocities
P-wave velocities measured with the WRMSL and Section Half Measurement Gantry (SHMG) caliper for the uppermost sediment are close to the velocity of seawater (~1500 m/s) from ~10 to 75 mbsf (Figure F32D). Both whole-round and caliper measurements are in good agreement in this interval. The peaks observed at ~5, 55, and 80 mbsf show maxima of 1635, 1670, and 1700 m/s, respectively. These three peaks are in good agreement with other physical properties (e.g., NGR and density). At depths greater than ~100 mbsf, measurements are inconsistent due to voids, cracks, and small fractures in the sediment. Four individual P-wave caliper values on section halves at ~150 mbsf show a mean of 1644 m/s (Figure F32D).
12.6. Natural gamma radiation
NGR values for Holes U1550A and U1550B are similar. A first peak value of up to 32.5 counts/s is observed at ~5 mbsf. This peak is positively correlated with similar peaks in density, MS, and P-wave velocity and negatively correlated with porosity and rheological parameters. Similar relations are observed at ~55, ~80–90, ~112, and ~135 mbsf. These depths mark the lower bound of a series of linear NGR increases:
- From a few meters below the seafloor to around 55 mbsf, values range from 8 to 36 counts/s.
- After a decrease to ~12 counts/s, values vary between 17 and 60 counts/s at ~60–82 mbsf in Hole U1550A and 63–91 mbsf in Hole U1550B with slightly lower values between 60 and 48 counts/s.
- After remaining relatively constant at ~25 counts/s from ~90 to 110 mbsf, NGR values for both holes increase from a low 16.5 counts/s at 113 mbsf to a high value of ~47 counts/s at ~135 mbsf.
- The final interval, 142–200 mbsf, shows relatively constant values of ~40 counts/s.
Hole U1550A shows an increase in NGR from ~75 to 80 mbsf that is consistent with low measured values for density, porosity, and rheological parameters and high values of MS and P-wave velocity. NGR values for Hole U1550B show a similar correlation with density and MS 10 m deeper. The maximum value of NGR, 49 counts/s, is observed at 91 mbsf.
12.7. Rheology
Three main depth intervals are identified by the rheological measurements (Figure F32F):
- From the seafloor to 43 mbsf, both shear and compressional strength increase in parallel from a subseafloor value of 2.4 kPa to 58.8 kPa.
- Between 43 and 86.5 mbsf, shear strength values measured by the two independent methods (automated vane shear [AVS], pocket penetrometer [PEN] value divided by 2) converge. Both data sets are negatively correlated with density variations and positively correlated with porosity. Shear strength values vary between 58 and 126.6 kPa (AVS) and between 24.5 and 98 kPa based on measurements from the PEN (PEN value divided by 2).
- Starting at 96.5 mbsf, strong increases in both shear and compressive strength are observed, with a greater gap between the low values. Shear strength varies around 100 kPa (AVS), 112.5 and 245 kPa (PEN value divided by 2).
Below 125 mbsf, the sediments recovered become too strong to be measured with the AVS. We stopped measuring compressive strength on cores from depths greater than ~157 mbsf. Below this depth, the integrity of the material recovered was greatly compromised and thus not representative of undisturbed material properties.
12.8. Porosity
Porosity data derived from MAD measurements (Figure F32G) show the depth variation in density with a decrease from 93% at the seafloor to 62% at ~52 mbsf. Porosity decreases from 78% to 41% from ~58.5 to 87 mbsf. Between 94 and 143 mbsf, porosity remains relatively constant at ~67%–69%. It is also relatively constant at ~50% between ~145 and ~200 mbsf.
Finally, the sill intrusion found at ~204 mbsf in Hole U1550A has a measured porosity of 23.5%, which is consistent with its medium-grained, doleritic texture (see Igneous petrology and alteration).
12.9. Data integration and lithology correlation
Correlated peak values in NGR and MS at 5.5, 55, and 82–87 mbsf correspond to the base of slump deposits of various thicknesses, each outlined by a relatively thin (a few meters) base of sand (see Lithostratigraphy). In general, correlated variations in petrophysical properties with depth can also be aligned with the lithologic descriptions. Between the seafloor and 85 mbsf, the relative increase in density, NGR, and MS and decrease in porosity is correlated with a diatom-rich lithology with more silty clay and diatom ooze–rich occurrences (see Lithostratigraphy) (Figure F32). The depth interval from ~85 to ~110 mbsf is characterized by relatively constant petrophysical properties (Figure F32) and corresponds to a diatom ooze and diatom clay interval (see Lithostratigraphy). Between 115 and 135 mbsf, the progressive change in lithology from diatom clay to silty sand is correlated with an increase in density, NGR, and MS, marking the transition toward more indurated sediments below 132 mbsf (siliceous claystone) (see Lithostratigraphy) (Figure F32).
References
Arason, P., and Levi, S., 2010. Maximum likelihood solution for inclination-only data in paleomagnetism. Geophysical Journal International, 182(2):753–771. https://doi.org/
Berner, R.A., 1982. Burial of organic carbon and pyrite sulfur in the modern ocean: its geochemical and environmental significance. American Journal of Science, 282(4):451–473. https://doi.org/
Campbell, A.C., and Gieskes, J.M., 1984. Water column anomalies associated with hydrothermal activity in the Guaymas Basin, Gulf of California. Earth and Planetary Science Letters, 68(1):57–72. https://doi.org/
Gieskes, J.M., Elderfield, H., Lawrence, J.R., Johnson, J., Meyers, B., and Campbell, A., 1982. Geochemistry of interstitial waters and sediments, Leg 64, Gulf of California. In Curray, J.R., Moore, D. G., et al., Initial Reports of the Deep Sea Drilling Project. 64: Washington, DC (US Government Printing Office), 675–694. https://doi.org/
Goldhaber, M.B., and Kaplan, I.R., 1974. The sulfur cycle. In Goldberg, E.D. (Ed.), The Sea (Volume 5): Marine Chemistry: New York (Wiley), 569–655.
Helenes, J., Carreño, A.L., and Carrillo, R.M., 2009. Middle to late Miocene chronostratigraphy and development of the northern Gulf of California. Marine Micropaleontology, 72(1):10–25. https://doi.org/
Kelts, K., Curray, J.R., and Moore, D.G., 1982. Introduction and explanatory notes. In Curray, J.R., Moore, D. G., et al., Initial Reports of the Deep Sea Drilling Project, 64: Washington, DC (US Government Printing Office), 5–26. https://doi.org/
Kirschvink, J.L., 1980. The least-squares line and plane and the analysis of palaeomagnetic data. Geophysical Journal International, 62(3):699–718. https://doi.org/
Le Bas, M.J., Le Maitre, R. W., Streickeisen, A., Zanettin, B., the IUGS Subcommission on the Systematics of Igneous Rocks, 1986. A chemical classification of volcanic rocks based on the total alkali-silica diagram. Journal of Petrology, 27(3):745–750. https://doi.org/
Levi, S., and Karlin, R., 1989. A sixty thousand year paleomagnetic record from Gulf of California sediments: secular variation, late Quaternary excursions and geomagnetic implications. Earth and Planetary Science Letters, 92(2):219–233. https://doi.org/
McDougall, K., and Martínez, A.Y.M., 2014. Evidence for a marine incursion along the lower Colorado River corridor. Geosphere, 10(5):842–869. https://doi.org/
Meyers, P.A., 1994. Preservation of elemental and isotopic source identification of sedimentary organic matter. Chemical Geology, 114(3–4):289–302. https://doi.org/
Oremland, R.S., Culbertson, C., and Simoneit, B.R.T., 1982. Methanogenic activity in sediment from Leg 64, Gulf of California. In Curray, J.R., Moore, D. G., et al., Initial Reports of the Deep Sea Drilling Project. 64: Washington, DC (US Government Printing Office), 759–762. https://doi.org/
Pimmel, A., and Claypool, G., 2001. Introduction to shipboard organic geochemistry on the JOIDES Resolution. Ocean Drilling Program Technical Note, 30. https://doi.org/
Martini, E., 1971. Standard Tertiary and Quaternary calcareous nannoplankton zonation. In McKee, E.D., and Weir, G.W. (Ed.), Trace Elements Investigations Report, 269: Washington, DC (US Department of the Interior). https://doi.org/
Shervais, J.W., 1982. Ti-V plots and the petrogenesis of modern and ophiolitic lavas. Earth and Planetary Science Letters, 59(1):101–118. https://doi.org/
Shipboard Scientific Party, 1982. Guaymas Basin; Sites 477, 478, and 481. In Curray, J.R., Moore, D. G., et al., Initial Reports of the Deep Sea Drilling Project, 64: Washington, DC (US Government Printing Office), 211–415. https://doi.org/
Teske, A., Lizarralde, D., Höfig, T.W., Aiello, I.W., Ash, J.L., Bojanova, D.P., Buatier, M.D., Edgcomb, V.P., Galerne, C.Y., Gontharet, S., Heuer, V.B., Jiang, S., Kars, M.A.C., Khogenkumar Singh, S., Kim, J.-H., Koornneef, L.M.T., Marsaglia, K.M., Meyer, N.R., Morono, Y., Negrete-Aranda, R., Neumann, F., Pastor, L.C., Peña-Salinas, M.E., Pérez Cruz, L.L., Ran, L., Riboulleau, A., Sarao, J.A., Schubert, F., Stock, J.M., Toffin, L.M.A.A., Xie, W., Yamanaka, T., and Zhuang, G., 2021a. Expedition 385 methods. In Teske, A., Lizarralde, D., Höfig, T.W. and the Expedition 385 Scientists, Guaymas Basin Tectonics and Biosphere. Proceedings of the International Ocean Discovery Program, 385: College Station, TX (International Ocean Discovery Program). https://doi.org/
Teske, A., Lizarralde, D., Höfig, T.W., Aiello, I.W., Ash, J.L., Bojanova, D.P., Buatier, M.D., Edgcomb, V.P., Galerne, C.Y., Gontharet, S., Heuer, V.B., Jiang, S., Kars, M.A.C., Khogenkumar Singh, S., Kim, J.-H., Koornneef, L.M.T., Marsaglia, K.M., Meyer, N.R., Morono, Y., Negrete-Aranda, R., Neumann, F., Pastor, L.C., Peña-Salinas, M.E., Pérez Cruz, L.L., Ran, L., Riboulleau, A., Sarao, J.A., Schubert, F., Stock, J.M., Toffin, L.M.A.A., Xie, W., Yamanaka, T., and Zhuang, G., 2021b. Expedition 385 summary. In Teske, A., Lizarralde, D., Höfig, T.W. and the Expedition 385 Scientists, Guaymas Basin Tectonics and Biosphere. Proceedings of the International Ocean Discovery Program, 385: College Station, TX (International Ocean Discovery Program). https://doi.org/
Teske, A., Lizarralde, D., Höfig, T.W., Aiello, I.W., Ash, J.L., Bojanova, D.P., Buatier, M.D., Edgcomb, V.P., Galerne, C.Y., Gontharet, S., Heuer, V.B., Jiang, S., Kars, M.A.C., Khogenkumar Singh, S., Kim, J.-H., Koornneef, L.M.T., Marsaglia, K.M., Meyer, N.R., Morono, Y., Negrete-Aranda, R., Neumann, F., Pastor, L.C., Peña-Salinas, M.E., Pérez Cruz, L.L., Ran, L., Riboulleau, A., Sarao, J.A., Schubert, F., Stock, J.M., Toffin, L.M.A.A., Xie, W., Yamanaka, T., and Zhuang, G., 2021c. Site U1545. In Teske, A., Lizarralde, D., Höfig, T.W., and the Expedition 385 Scientists, Guaymas Basin Tectonics and Biosphere. 385: College Station, TX (International Ocean Discovery Program). https://doi.org/
Teske, A., Lizarralde, D., Höfig, T.W., Aiello, I.W., Ash, J.L., Bojanova, D.P., Buatier, M.D., Edgcomb, V.P., Galerne, C.Y., Gontharet, S., Heuer, V.B., Jiang, S., Kars, M.A.C., Khogenkumar Singh, S., Kim, J.-H., Koornneef, L.M.T., Marsaglia, K.M., Meyer, N.R., Morono, Y., Negrete-Aranda, R., Neumann, F., Pastor, L.C., Peña-Salinas, M.E., Pérez Cruz, L.L., Ran, L., Riboulleau, A., Sarao, J.A., Schubert, F., Stock, J.M., Toffin, L.M.A.A., Xie, W., Yamanaka, T., and Zhuang, G., 2021d. Site U1546. In Teske, A., Lizarralde, D., Höfig, T.W. and the Expedition 385 Scientists, Guaymas Basin Tectonics and Biosphere. Proceedings of the International Ocean Discovery Program, 385: College Station, TX (International Ocean Discovery Program). https://doi.org/
Teske, A., Lizarralde, D., Höfig, T.W., Aiello, I.W., Ash, J.L., Bojanova, D.P., Buatier, M.D., Edgcomb, V.P., Galerne, C.Y., Gontharet, S., Heuer, V.B., Jiang, S., Kars, M.A.C., Khogenkumar Singh, S., Kim, J.-H., Koornneef, L.M.T., Marsaglia, K.M., Meyer, N.R., Morono, Y., Negrete-Aranda, R., Neumann, F., Pastor, L.C., Peña-Salinas, M.E., Pérez Cruz, L.L., Ran, L., Riboulleau, A., Sarao, J.A., Schubert, F., Stock, J.M., Toffin, L.M.A.A., Xie, W., Yamanaka, T., and Zhuang, G., 2021e. Sites U1547 and U1548. In Teske, A., Lizarralde, D., Höfig, T.W., and the Expedition 385 Scientists, Guaymas Basin Tectonics and Biosphere. Proceedings of the International Ocean Discovery Program, 385: College Station, TX (International Ocean Discovery Program). https://doi.org/
Teske, A., Lizarralde, D., Höfig, T.W., Aiello, I.W., Ash, J.L., Bojanova, D.P., Buatier, M.D., Edgcomb, V.P., Galerne, C.Y., Gontharet, S., Heuer, V.B., Jiang, S., Kars, M.A.C., Khogenkumar Singh, S., Kim, J.-H., Koornneef, L.M.T., Marsaglia, K.M., Meyer, N.R., Morono, Y., Negrete-Aranda, R., Neumann, F., Pastor, L.C., Peña-Salinas, M.E., Pérez Cruz, L.L., Ran, L., Riboulleau, A., Sarao, J.A., Schubert, F., Stock, J.M., Toffin, L.M.A.A., Xie, W., Yamanaka, T., and Zhuang, G., 2021f. Site U1549. In Teske, A., Lizarralde, D., Höfig, T.W., and the Expedition 385 Scientists, Guaymas Basin Tectonics and Biosphere. Proceedings of the International Ocean Discovery Program, 385: College Station, TX (International Ocean Discovery Program). https://doi.org/
Teske, A., Lizarralde, D., Höfig, T.W., and the Expedition 385 Scientists, 2021g. Supplementary material, https://doi.org/
Zijderveld, J.D.A., 1967. AC demagnetization of rocks: analysis of results. In Runcorn, S.K.C., Creer, K.M., and Collinson, D.W. (Eds.), Methods in Palaeomagnetism: Amsterdam (Elsevier), 254–286.