Teske, A., Lizarralde, D., Höfig, T.W., and the Expedition 385 Scientists
Proceedings of the International Ocean Discovery Program Volume 385
publications.iodp.org
https://doi.org/10.14379/iodp.proc.385.106.2021
Site U15491
![]() A. Teske,
A. Teske,
![]() D. Lizarralde,
D. Lizarralde,
![]() T.W. Höfig,
T.W. Höfig,
![]() I.W. Aiello,
I.W. Aiello,
![]() J.L. Ash,
J.L. Ash,
![]() D.P. Bojanova,
D.P. Bojanova,
![]() M.D. Buatier,
M.D. Buatier,
![]() V.P. Edgcomb,
V.P. Edgcomb,
![]() C.Y. Galerne,
C.Y. Galerne,
![]() S. Gontharet,
S. Gontharet,
![]() V.B. Heuer,
V.B. Heuer,
![]() S. Jiang,
S. Jiang,
![]() M.A.C. Kars,
M.A.C. Kars,
![]() S. Khogenkumar Singh,
S. Khogenkumar Singh,
![]() J.-H. Kim,
J.-H. Kim,
![]() L.M.T. Koornneef,
L.M.T. Koornneef,
![]() K.M. Marsaglia,
K.M. Marsaglia,
![]() N.R. Meyer,
N.R. Meyer,
![]() Y. Morono,
Y. Morono,
![]() R. Negrete-Aranda,
R. Negrete-Aranda,
![]() F. Neumann,
F. Neumann,
![]() L.C. Pastor,
L.C. Pastor,
![]() M.E. Peña-Salinas,
M.E. Peña-Salinas,
![]() L.L. Pérez-Cruz,
L.L. Pérez-Cruz,
![]() L. Ran,
L. Ran,
![]() A. Riboulleau,
A. Riboulleau,
![]() J.A. Sarao,
J.A. Sarao,
![]() F. Schubert,
F. Schubert,
![]() J.M. Stock,
J.M. Stock,
![]() L.M.A.A. Toffin,
L.M.A.A. Toffin,
![]() W. Xie,
W. Xie,
![]() T. Yamanaka,
T. Yamanaka,
![]() G. Zhuang
2
G. Zhuang
2
1 Teske, A., Lizarralde, D., Höfig, T.W., Aiello, I.W., Ash, J.L., Bojanova, D.P., Buatier, M.D., Edgcomb, V.P., Galerne, C.Y., Gontharet, S., Heuer, V.B., Jiang, S., Kars, M.A.C., Khogenkumar Singh, S., Kim, J.-H., Koornneef, L.M.T., Marsaglia, K.M., Meyer, N.R., Morono, Y., Negrete-Aranda, R., Neumann, F., Pastor, L.C., Peña-Salinas, M.E., Pérez Cruz, L.L., Ran, L., Riboulleau, A., Sarao, J.A., Schubert, F., Stock, J.M., Toffin, L.M.A.A., Xie, W., Yamanaka, T., and Zhuang, G., 2021. Site U1549. In Teske, A., Lizarralde, D., Höfig, T.W., and the Expedition 385 Scientists, Guaymas Basin Tectonics and Biosphere. Proceedings of the International Ocean Discovery Program, 385: College Station, TX (International Ocean Discovery Program). https://doi.org/
2 Expedition 385 Scientists’ affiliations.
1. Summary
1.1. Background and objectives
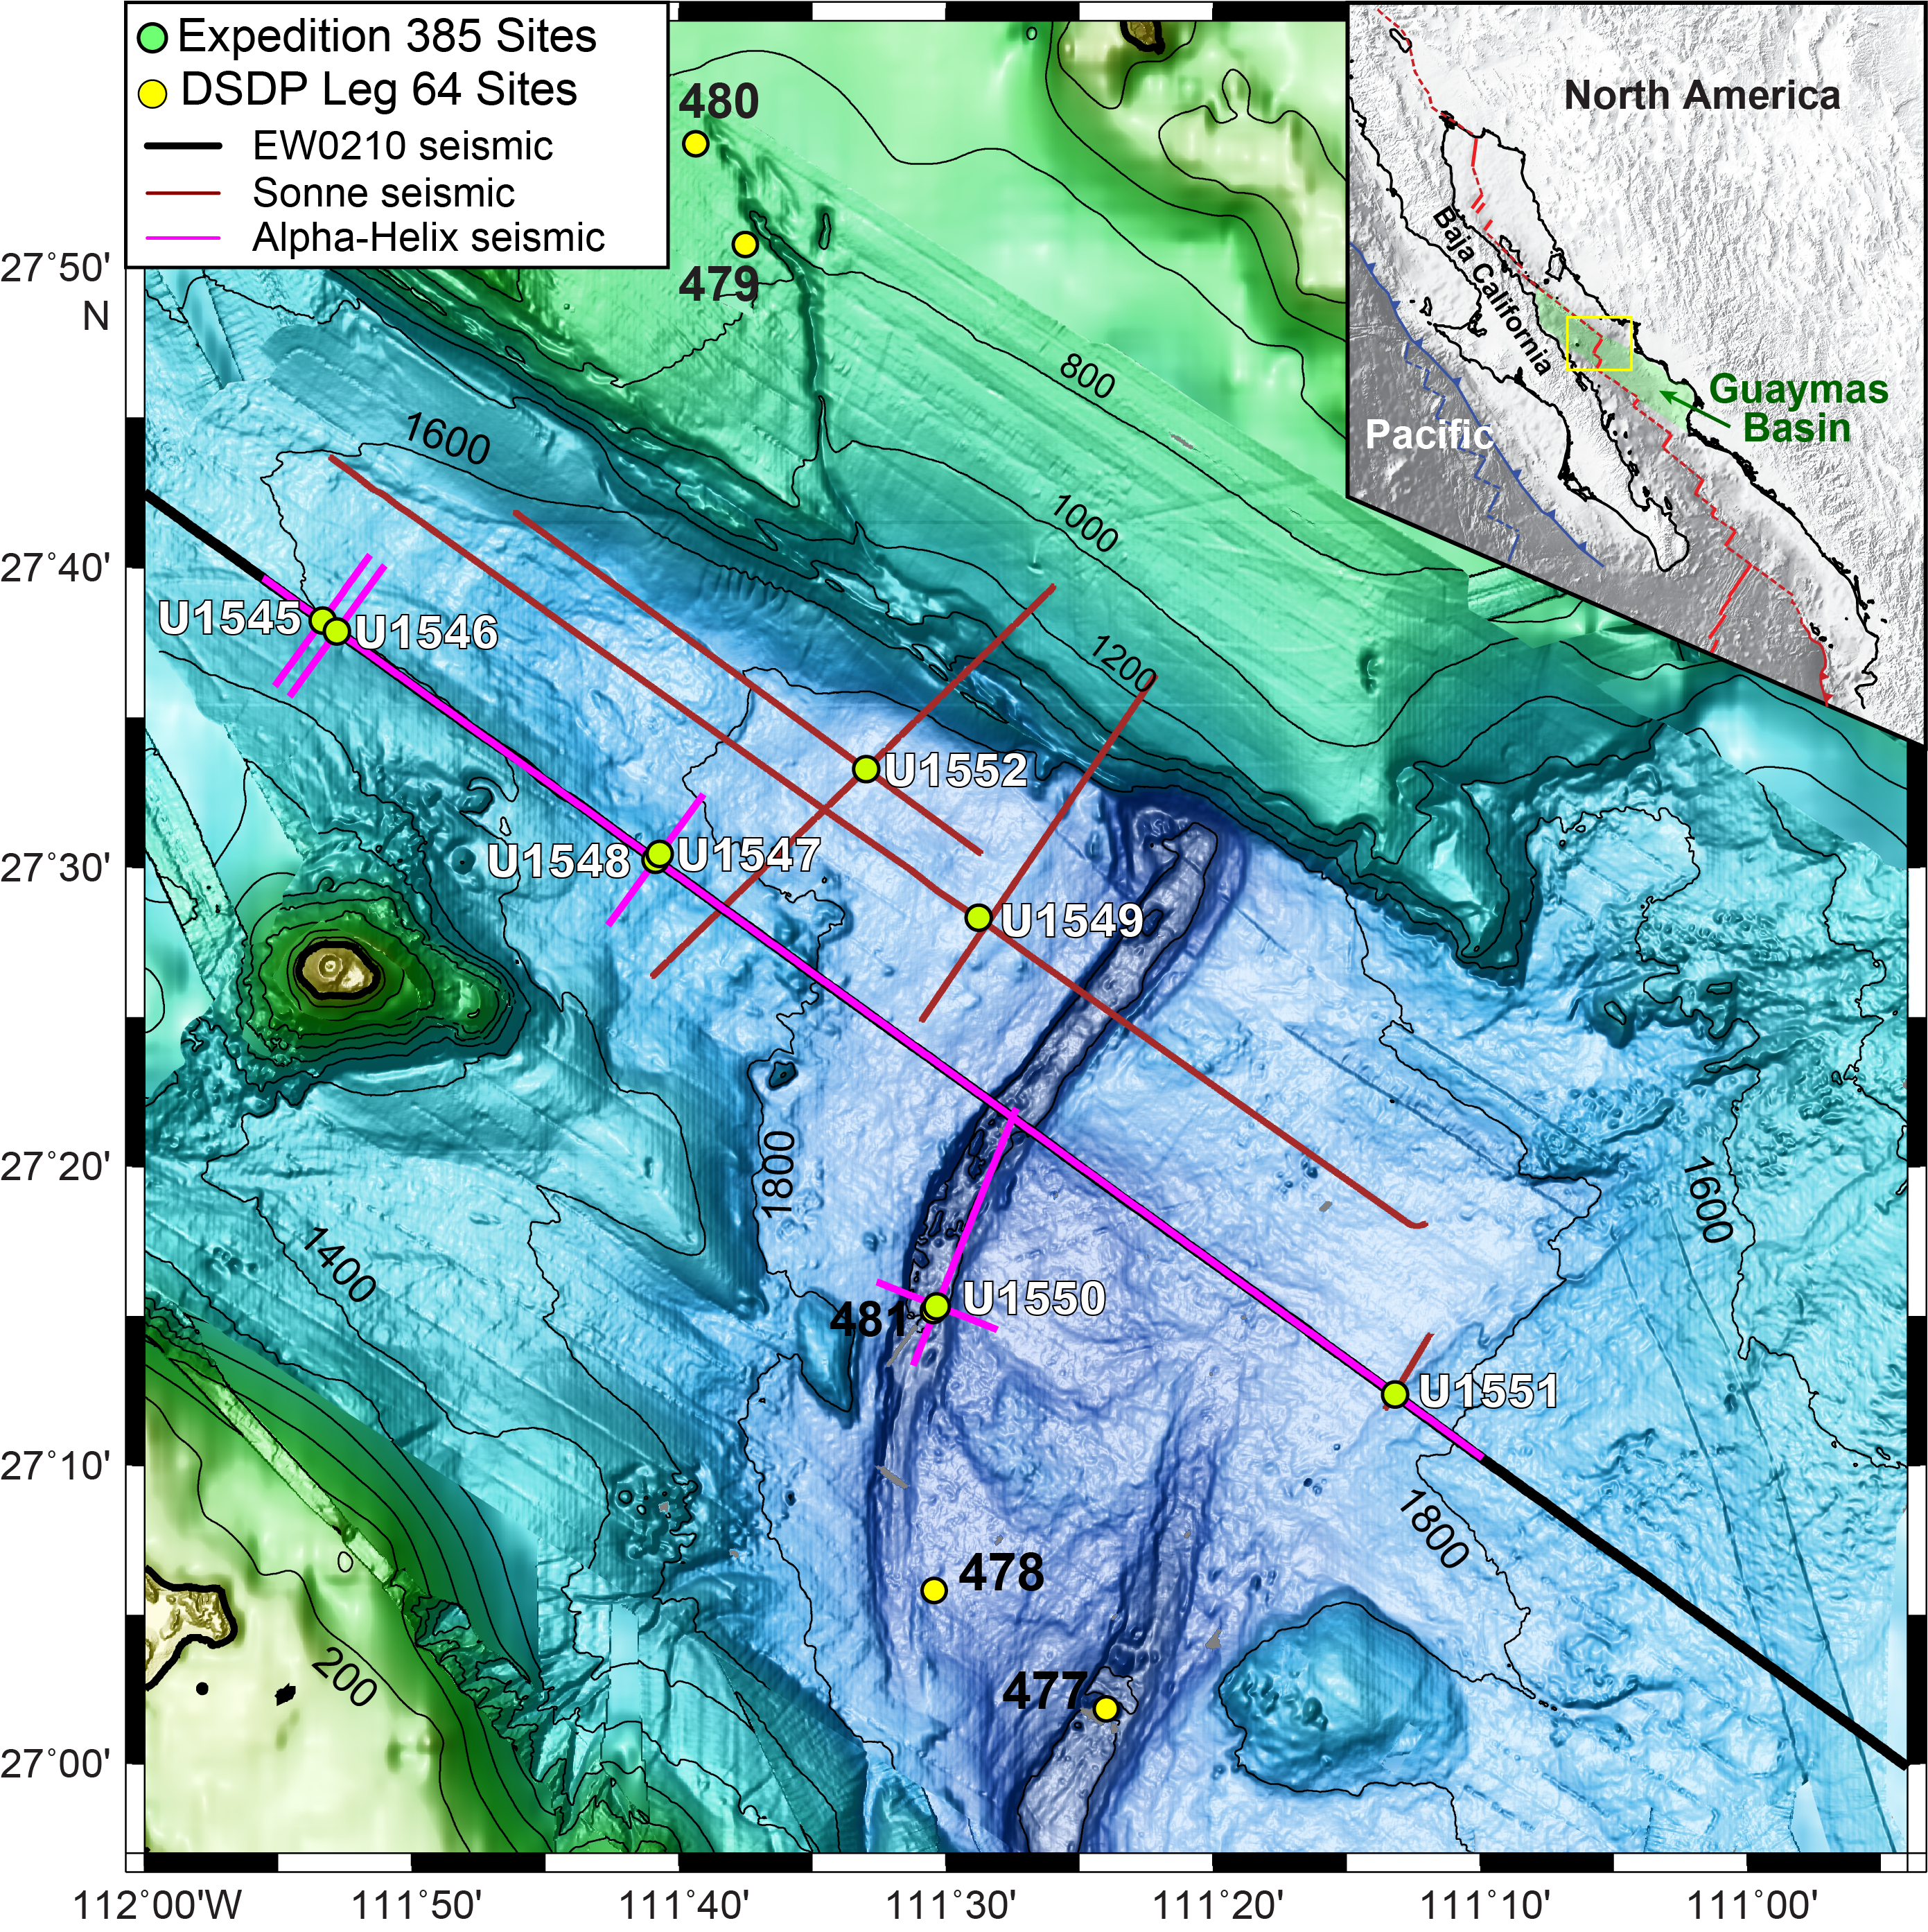
Site U1549 is located ~9.5 km northwest of the northern axial graben of Guaymas Basin (Figure F1) and ~780 m northwest of a mound-shaped seafloor feature (Figure F2) where active cold-seep communities have been documented by preexpedition site surveys. In addition, seismic data at this location were interpreted to show an underlying sill at ~450 meters below seafloor (mbsf) and indicate gas movement along and around a pipe structure (Figure F2). This association of a relatively deep sill, active gas venting, and seafloor communities connects multiple components of the carbon budget of a sill-driven vent/seep system. The sedimentary setting at Site U1549 is intermediate between the biogenic-dominated sedimentation observed at Sites U1545 and U1546 and the dominantly terrigenous deposition documented southeast of the northern axial graben (Site U1551). The primary objectives for Site U1549 are thus to characterize the physical, chemical, and microbial properties of this sedimentologically intermediate setting and to assess the influence of the underlying sill and associated altered sediments on carbon cycling in the subseafloor.
1.2. Operations
Two holes were cored at Site U1549. Hole U1549A is located at 27°28.3317′N, 111°28.7844′W in a water depth of 1840.1 m. In Hole U1549A, we used the advanced piston corer (APC) system to advance from the seafloor to a final depth of 168.0 mbsf with a recovery of 166.9 m (99%). We made formation temperature measurements at several depths using the advanced piston corer temperature (APCT-3) tool. In Hole U1549B, located at 27°28.3383′N, 111°28.7927′W in a water depth of 1841.2 m, we deployed the APC system. Cores penetrated from the seafloor to a final depth of 166.9 mbsf and recovered 164.4 m (99%). Hole U1549B was dedicated to extensive microbial and biogeochemical sampling that required the deployment of perfluorocarbon tracers (PFTs) downhole for all cores to monitor drilling fluid (seawater) contamination. The pace of coring in Hole U1549B was adjusted to accommodate the complex microbial sampling program conducted on the core receiving platform. A total of 51.1 h, or 2.1 days, were spent at Site U1549. An overview of cores, penetration depths, core recovery, and operations schedule for Site U1549 is given in Table T1.
1.3. Principal results
1.3.1. Lithostratigraphy
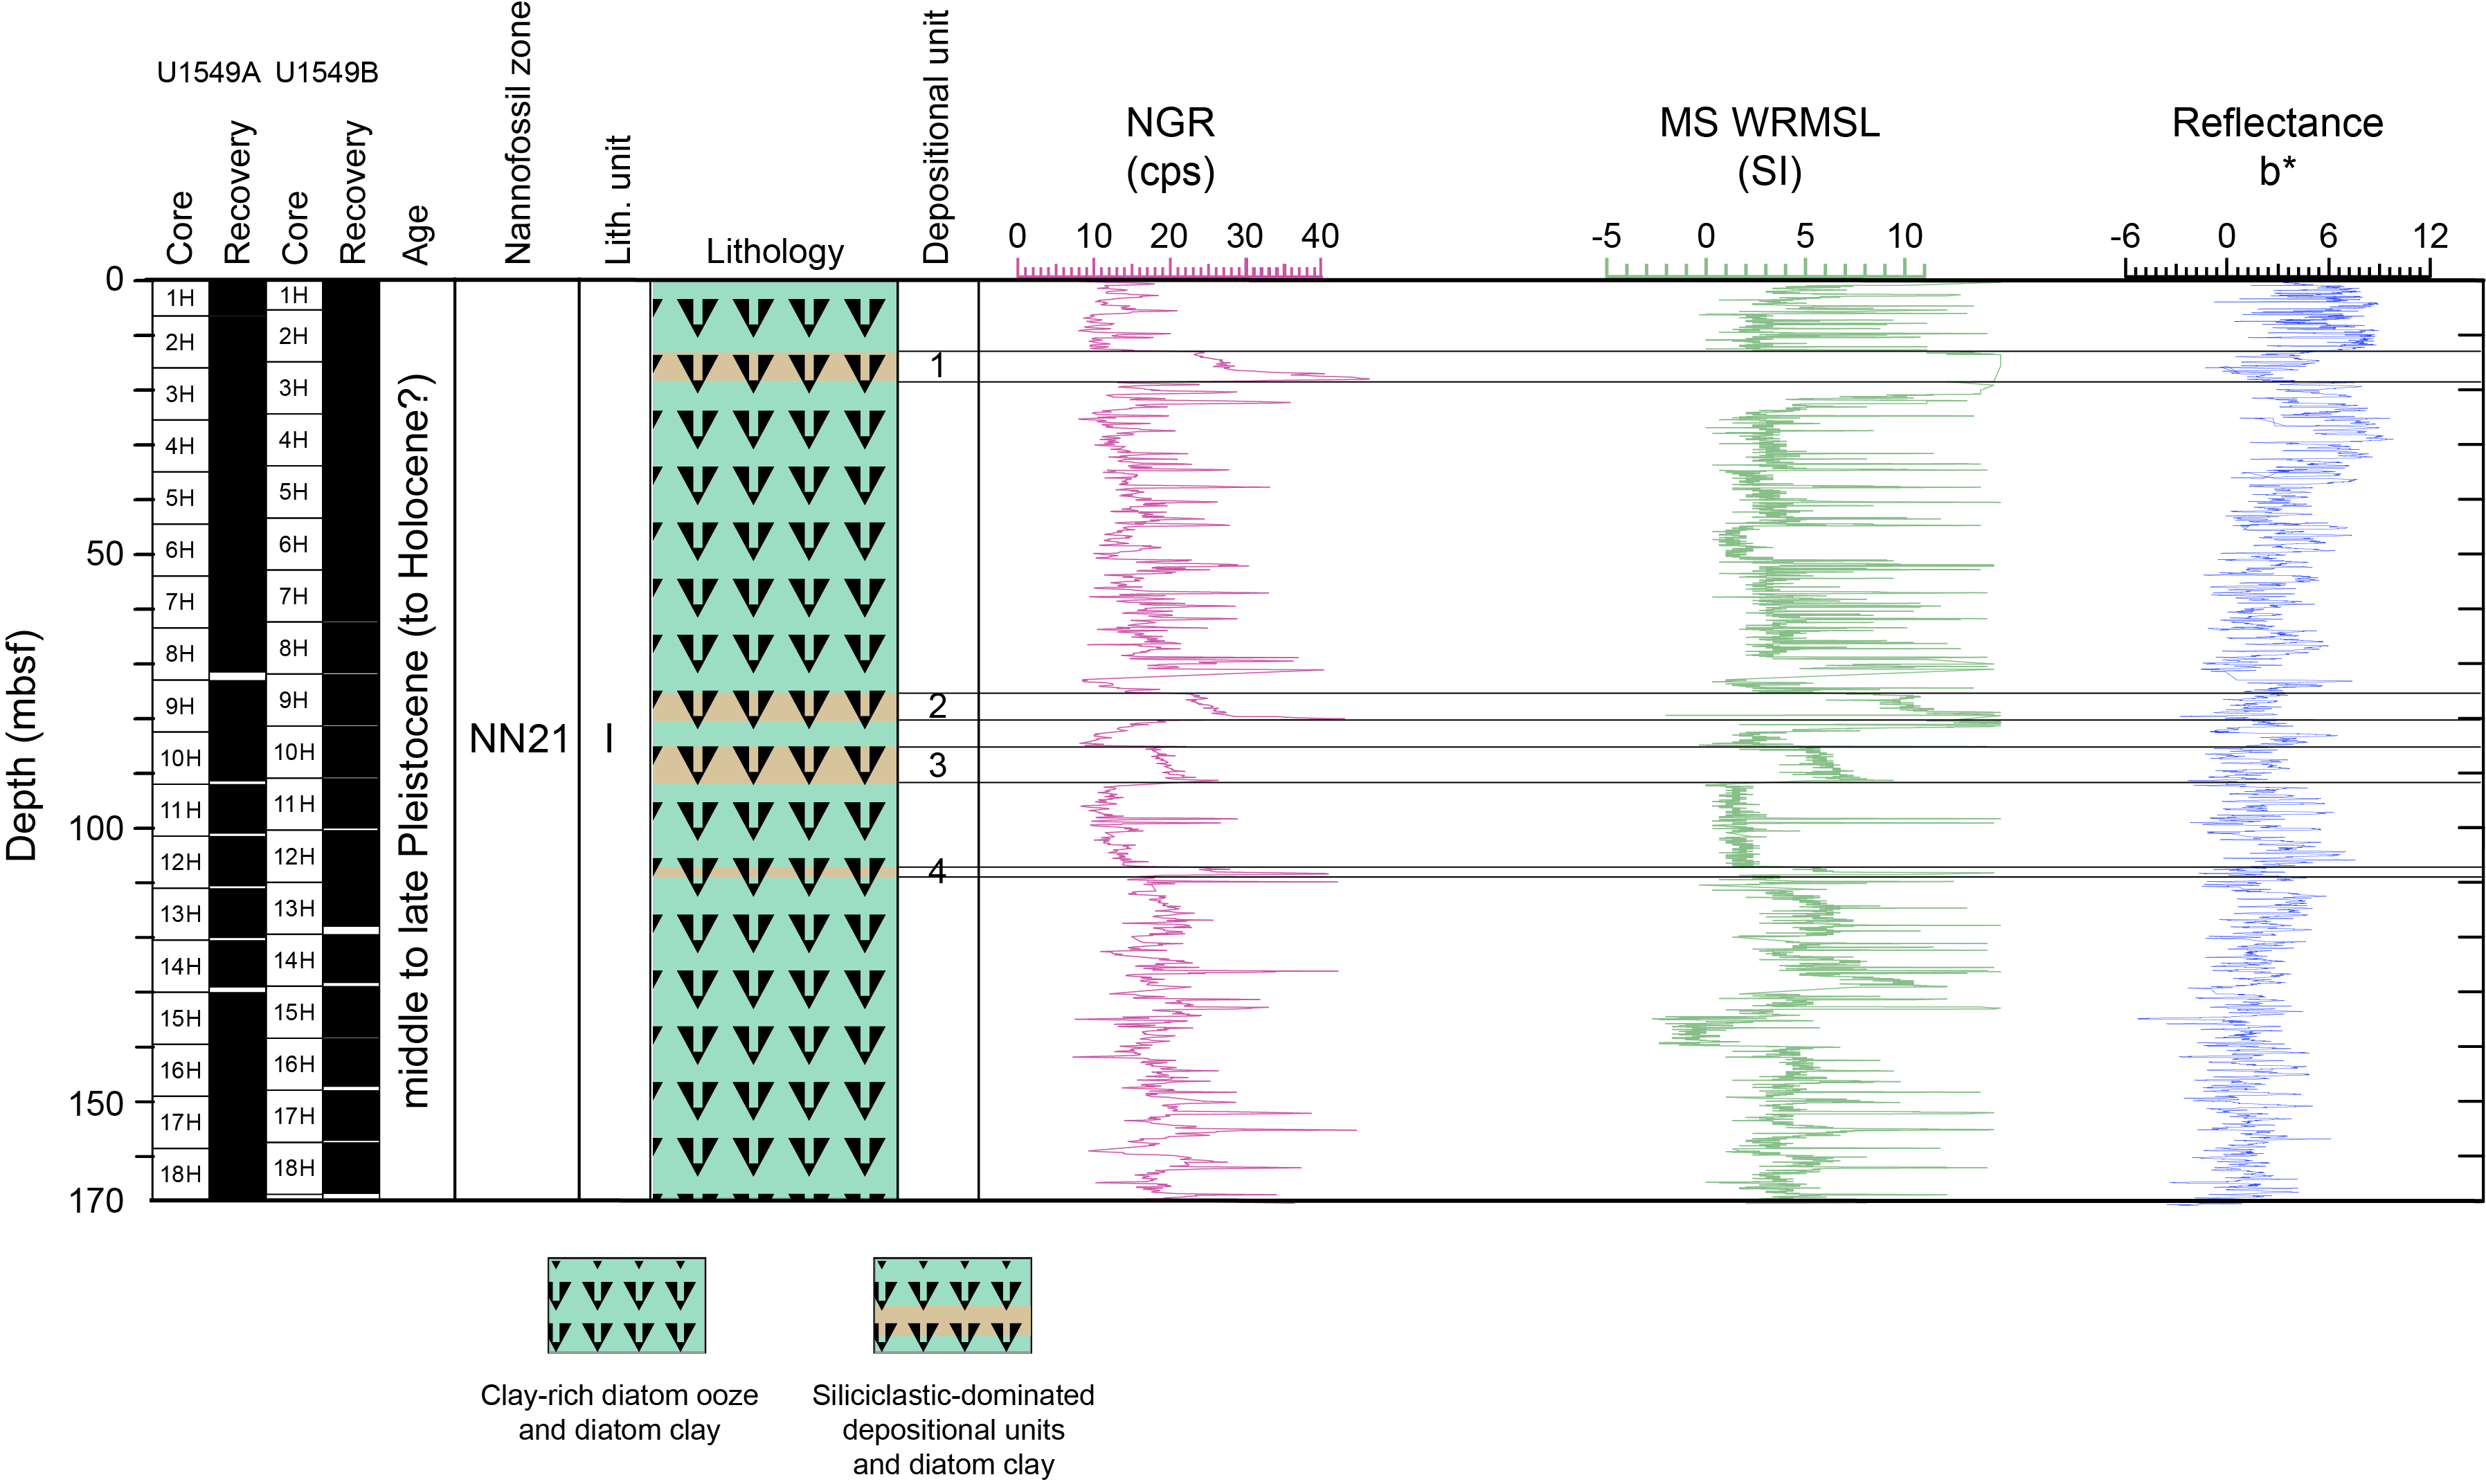
The sediments recovered at Site U1549 are late to middle Pleistocene in age and are mostly biogenic (mainly diatom ooze) with a significant (~10%) proportion of sand- to silt-sized siliciclastic components that occur either mixed with the biogenic component or concentrated in discrete laminae and beds (Figure F4). No major diagenetic changes were observed, probably because of the relatively shallow subseafloor depth reached at this site, leading to the characterization of a single lithostratigraphic unit (Unit I). The most common lithology observed is olive-gray, clay- to silt-rich diatom ooze. Unlike what was observed in the northwestern (Sites U1545 and U1546) and Ringvent (Sites U1547 and U1548) sediment successions, the diatom ooze is primarily nonlaminated. The terrigenous-dominated depositional layers that are intercalated with diatom ooze range from a few centimeters to a meter in thickness with sharp bases that are locally marked by a coarser basal lamina of silt- to sand-sized bioclasts (foraminifers and small bivalves). The thickest beds occasionally have a base of laminated, bioclastic sand with a few coarse siliciclastic particles. Other coarse siliciclastic (silt- to sand-sized) depositional layers were also recognized, and they range from laminae a few millimeters thick to beds as thick as ~6 m. The thickest of these beds are normally graded and associated with basal sand to silty sand that shows scouring at the base. Four exceptionally thick, normally graded terrigenous depositional layers were noted in the lithologic succession. Three of these beds were clearly correlated between Holes U1549A and U1549B and show a characteristic increase in natural gamma radiation (NGR), magnetic susceptibility (MS), and color parameter b*. The depositional layers composed of homogeneous biogenic and siliciclastic components are interpreted to be the products of slope instability and mass-gravity deposition, including hybrid flows.
1.3.2. Structural geology
Structural information was obtained from sedimentary sequences at Site U1549. None of the samples were sufficiently lithified to be measured independently as whole-round pieces. Tilted laminae seen in Cores 385-U1549A-2H and 3H suggest small-scale slump folds, but the rest of Holes U1549A and U1549B mostly have laminae that are roughly perpendicular to the axis of the hole. One chevron fold with a horizontal fold axis was found in interval 385-U1549A-3H-1, 42–47 cm (~16.4–16.5 mbsf). Tilted bedding was noted starting in Section 385-U1549A-16H-1 (at 139.5 mbsf) and continues to deeper levels in Cores 17H and 18H with values typically from 10° to 15°. A few brittle faults were seen at different depths in the section, but overall there is much less faulting in this sedimentary section than at Ringvent Sites U1547 and U1548, northern rift Site U1550, and northwestern Guaymas Basin Sites U1545 and U1546.
1.3.3. Biostratigraphy
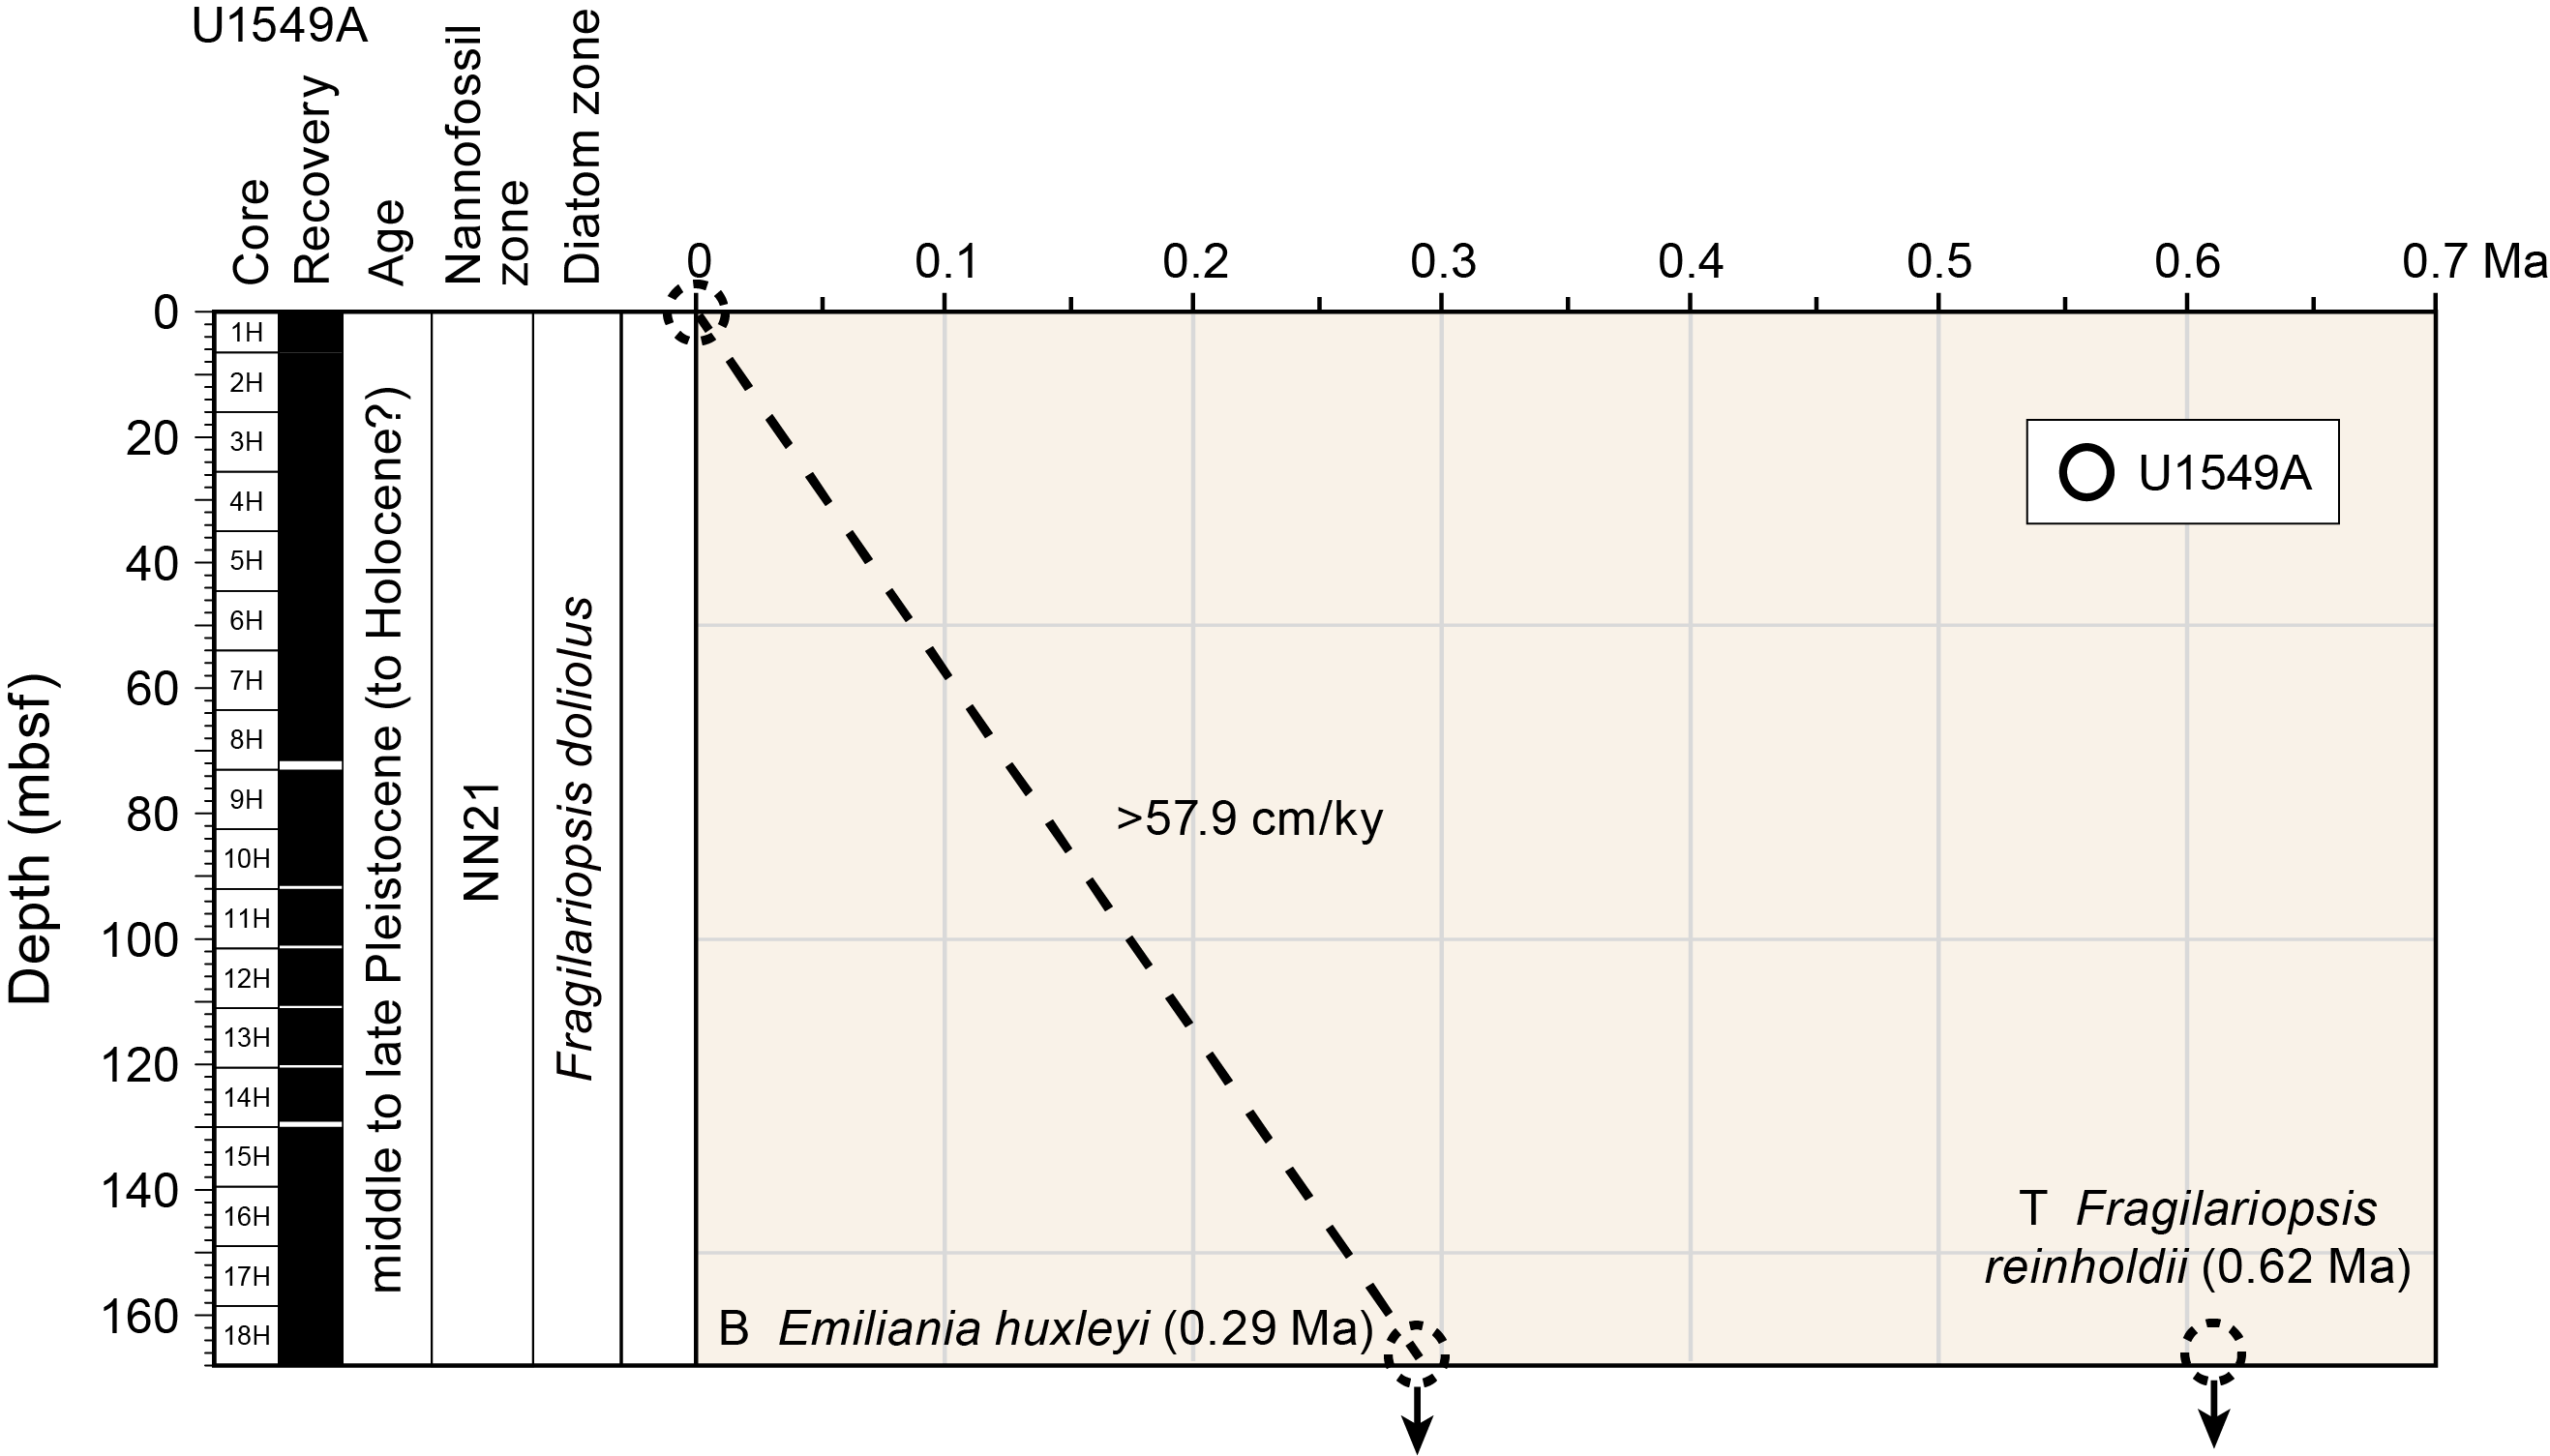
Calcareous nannofossils are abundant to common with good/moderate preservation throughout the entire sampled sequence at Site U1549, and the barren interval seen at Sites U1545–U1548 is not present at this site. Reworked nannofossils include a significant component of Miocene taxa with a greatly reduced contribution of reworked Cretaceous specimens. In general, marine diatoms are dominant to abundant with good/moderate preservation throughout Hole U1549A, except at 63.62 and 71.23 mbsf, where diatoms have a common abundance. Freshwater diatoms in Hole U1549A are much more frequent than at the northwestern and Ringvent sites, particularly at similar depths. This suggests strong influence of terrestrial input. No evidence of diagenetic alteration of diatoms is present in Hole U1549A. The occurrence of Emiliania huxleyi from the top to the bottom of the hole dates the entire sediment sequence to (Holocene–)late–middle Pleistocene, or younger than 0.29 Ma (Hole U1549A = 0–168.35 mbsf). This age assignment is consistent with the absence of Pseudoemiliania lacunosa (last appearance datum [LAD] = 0.44 Ma) and Fragilariopsis reinholdii (LAD = 0.62 Ma) in all examined samples. The estimated average sedimentation rate is >580 m/My (>58.0 cm/ky).
1.3.4. Paleomagnetism
Alternating field (AF) demagnetization up to 20 mT was performed on archive-half sections with the superconducting rock magnetometer (SRM) on all APC sediment cores from Hole U1549A. The drilling-induced overprint was successfully removed from all cores (from the seafloor to ~168 mbsf) upon demagnetization. Inclination values after demagnetization at 20 mT cluster around 46°, which corresponds to the expected geocentric axial dipole (GAD) inclination at the latitude of the site (46.1°). A detailed analysis of the remanence of discrete samples from Hole U1549A shows that the drilling-induced overprint is removed by 10 mT and the characteristic remanent magnetization (ChRM) is in accordance with the SRM measurements. The natural remanent magnetization (NRM) of archive-half sections is higher at ~16–19, ~69.5–70, and 79.5–80 mbsf. These intervals correspond to sandy layers that contain more detrital material. Hole U1549A cores were assigned to the normal Brunhes Chron C1n (younger than 0.78 Ma). The anisotropy of magnetic susceptibility obtained from Hole U1549A sediments is characterized by a mixture of prolate and oblate behavior. No paleomagnetic measurements were carried out in Hole U1549B.
1.3.5. Inorganic geochemistry
To examine biogeochemical profiles associated with microbial diagenesis in greater resolution, a total of 65 interstitial water (IW) samples that were collected by hydraulic pressing of sedimentary whole-round core samples (35 from the seafloor to 160 mbsf) were supplemented by Rhizon sampling of freshly recovered core sections spaced at approximately 1 m intervals (30 from the seafloor to 30 mbsf in Hole U1549A). Based on the sulfate profiles, the sulfate–methane transition zone (SMTZ) is estimated at 30 mbsf in Hole U1549A and 25 mbsf in Hole U1549B, considerably shallower compared to Sites U1545 and U1546. Below the SMTZ, around 100 mbsf, alkalinity reaches a high maximum value of 85 mM and ammonium reaches maximum concentrations near 15 mM. Mg2+ has a higher concentration than seawater (53.5 mM), and its maximum value reaches 65 mM below the SMTZ. In addition, downhole concentration profiles of Li+, B, and H4SiO4 generally display an increasing trend with higher values than those of seawater. The IW chemical signatures at Site U1549 may be predominantly influenced by organic matter degradation related to microbial processes and by sediment-water interactions and mineral precipitation/dissolution processes.
1.3.6. Organic geochemistry
At Site U1549, organic geochemists performed sampling and analysis of gas and solid-phase samples. In Hole U1549A, one headspace gas sample was analyzed per 9.5 m advance for routine hydrocarbon safety monitoring; void gases were quantified and sampled for hydrocarbon content; and the carbon, nitrogen, and sulfur contents of particulate sediment were characterized. In Hole U1549B, hydrocarbon analyses were performed on headspace gas; H2 and CO contents were measured; sediment carbon, nitrogen, and sulfur contents were characterized; and a comprehensive suite of gas and sediment samples was taken for postexpedition analyses. Methane appears below ~25 mbsf, and C2–C6 hydrocarbons are all detectable at depths below 60 mbsf. No anomalous C1/C2 values were observed. From elemental analysis, we inferred that the primary source of organic matter is marine in origin. In Hole U1549B, H2 and CO are present in low concentrations, which suggests that biological cycling is the dominant control on these gases.
1.3.7. Microbiology
Hole U1549B samples represent horizons that inform our understanding of the cycle of carbon driven by fluid flow in the Guaymas Basin subseafloor. Site U1549 is effectively a cold-seep site characterized by mass-gravity flows. Thus, the site has a relatively high proportion of terrigenous material and an attenuated thermal gradient that indicates relatively moderate hydrothermal warming. As such, it provides an opportunity for microbiologists to examine the influence of these gravity flows on in situ microbial diversity and on activities within a hydrothermal setting distal to the immediate influences of emplaced sills and/or extremely hot hydrothermal fluids. Syringe samples for cell counts, 3-D structural imaging, and RNA analyses were taken on the core receiving platform, preserved or frozen, and stored for further analyses. Whole-round core samples were either stored in a −80°C freezer or temporarily stored in a 4°–8°C cold room and processed further for shore-based analyses, as described for Site U1545. Samples for PFT measurements were taken on the core receiving platform using a syringe at six distinct horizons. Cell abundance for selected samples was determined by direct counting with an epifluorescence microscope. Cell abundance was 0.94 × 10⁶ cells/cm3 in bottom seawater and 6.3 × 10⁸ cells/cm3 in seafloor sediments. Cell abundance gradually decreased to below the detection limit of the protocol used for shipboard measurements at approximately 124 mbsf, twice as deep as at Ringvent (Holes U1547B, U1548A, and U1548C).
1.3.8. Petrophysics
Physical properties measured on whole-round and working-half core sections from Holes U1549A and U1549B were compared for lithostratigraphic characterization and correlation of visual core description with physical properties. Four in situ formation temperature measurements were taken with the APCT-3 tool to calculate the geothermal gradient (194°C/km) and heat flow (144 mW/m2). Conductivity measurements show a similar trend with depth in Holes U1549A and U1549B. We identified one main interval that correlates with Lithostratigraphic Unit I. NGR and MS peaks at ~70–100 mbsf correlate with four depositional subunits. These physical properties along with density and P-wave velocity values have a negative correlation with porosity values. Thus, porosity values derived from moisture and density (MAD) measurements show a general decrease with depth. In contrast, shear strength measurements show a linear increase due to the presence of indurated sediments at depth.
2. Background and objectives
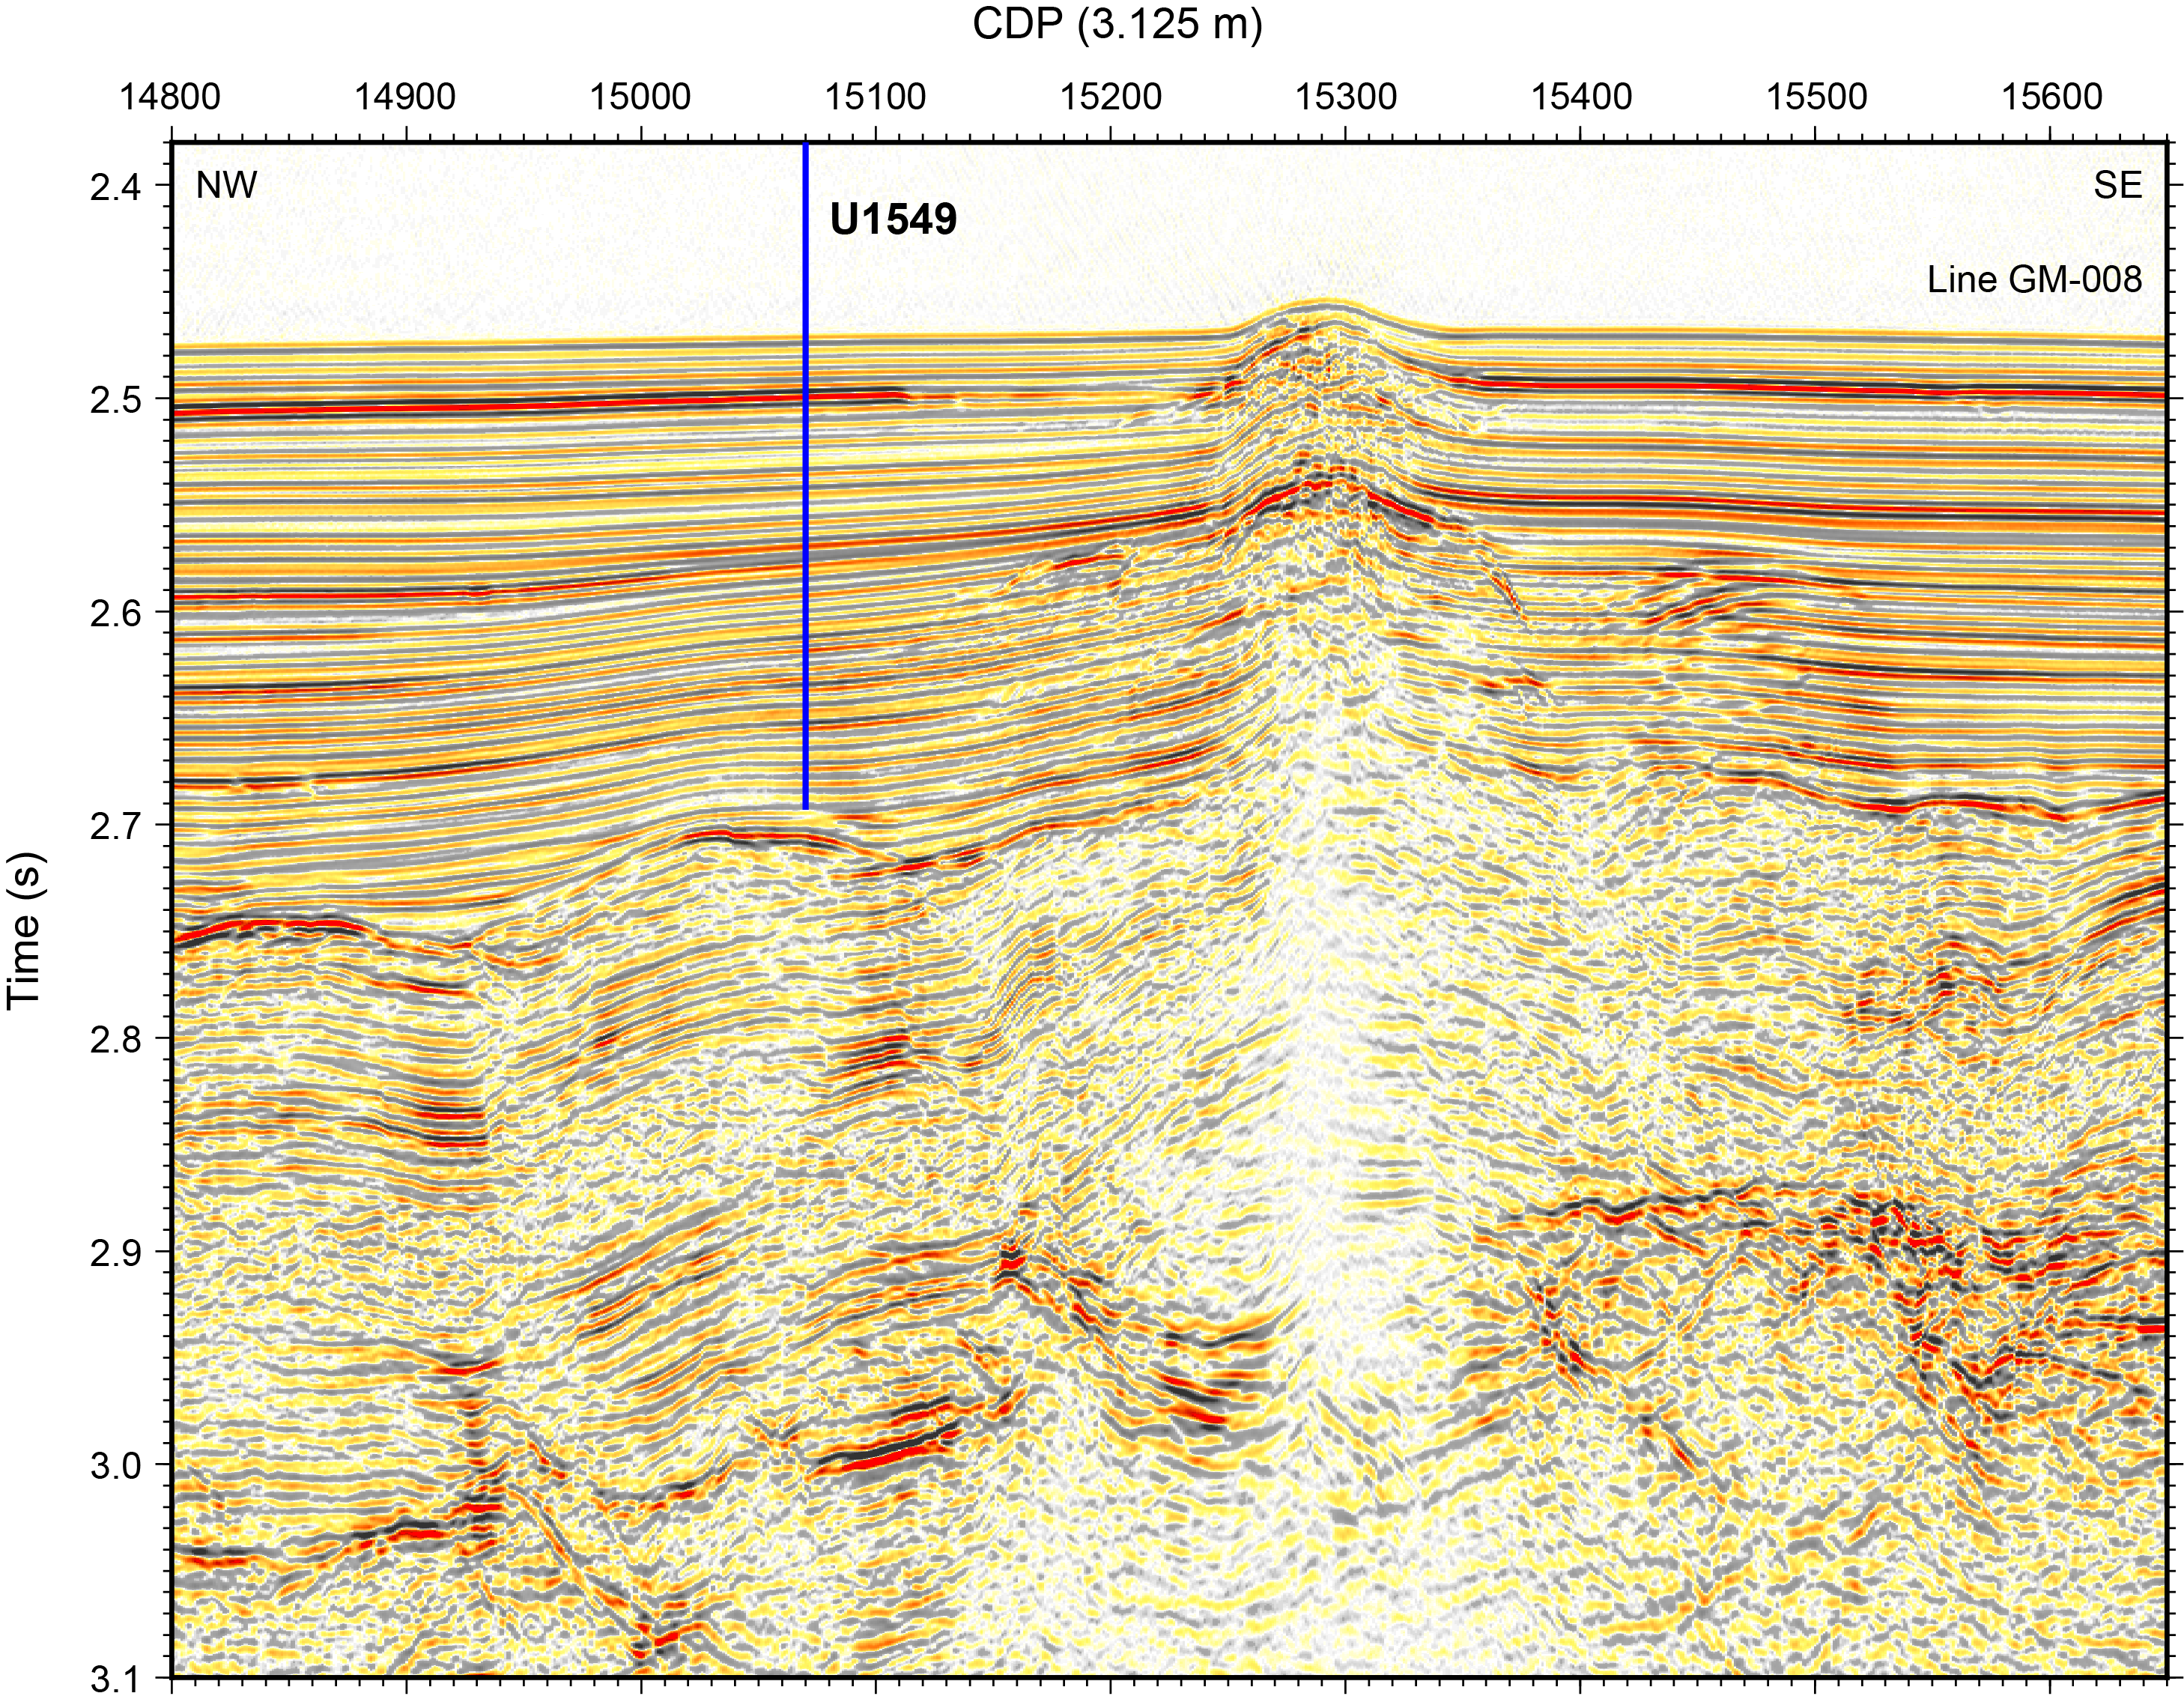
Site U1549 (proposed Site GUAYM-16A) is located at 27.4721°N, 111.4797°W, ~9.5 km distant from the axial graben (Figure F1) and ~780 m northwest of a mound-shaped seafloor feature (Figure F3) where active cold-seep communities (e.g., tube worm colonies and mats of benthic polychaetes) were photographed during research vessel (R/V) Atlantis Leg AT15-54 (Lizarralde et al., 2011), mapped in detail by the autonomous underwater vehicle (AUV) Sentry and the human occupied vehicle (HOV) Alvin during Cruise AT36-07 (Teske et al., 2021g), and imaged with high-resolution multichannel seismic data during R/V Sonne Cruise SO241. This site was originally proposed at the mound itself, where multiple observations are consistent with cold seepage. Key features of the site include an underlying sill at ~450 mbsf that is part of a larger intrusion event marked by a prominent unconformity; a clear indication of gas (as a bright, negative-polarity reflection at ~2.45 s two-way traveltime [TWT] with blanking beneath) along a central pipe; indications of gas in a halo surrounding the pipe structure, seen in Seismic Line GM-008 (e.g., ~2.57 s TWT; common depth points [CDPs] 15190 and 15460) and crossing lines; the observation of methane hydrate and gas bubbles at the seafloor; and an apparent shallow bottom-simulating seismic reflector at ~1.65 s TWT suggestive of shallow methane hydrate and gas accumulation. This association of a relatively deep sill, active gas venting, and seafloor communities connects multiple components of the carbon budget of a sill-driven hydrothermal system, making it attractive as a site for scientific drilling. The localized nature of these same features, however, required the site to be moved to avoid disruption of the fauna and hazards presented by the gas.

The drilled site location presents a reference sedimentary section intermediate between the almost exclusively biogenic sediments of Sites U1545 and U1456 and the predominantly terrigenous sediments southeast of the axial graben. Sediment pore water chemistry here is likely influenced by compaction-driven fluid flow from the underlying sediments, which show clear indication of modification due to a sill intrusion event that had some regional extent. The primary objectives for Site U1549 are thus to characterize the physical, chemical, and microbial properties of this sill-associated cold-seepage setting and to assess the influence of the underlying sills and altered sediments.
2.1. Operations
2.1.1. Site U1549
Site U1549 comprises two holes located northwest of an off-axis seep feature. The original plan for Site U1549 was for two holes to be cored to 172 mbsf each using the APC system with orientation. The first hole was designated to recover cores for lithologic and pore water analysis. The second hole would be dedicated to microbiology sampling. Actual operations were implemented as planned. Hole U1549A was APC cored to a target depth of 168.0 mbsf. In proximal Hole U1549B, APC coring advanced to a target depth of 166.9 mbsf. A total of 51.1 h, or 2.1 days, were spent at Site U1549.
2.1.2. Hole U1549A
We arrived at the coordinates of Site U1549 at 1706 h on 24 October 2019, lowered the thrusters, and switched to dynamic positioning (DP) mode at 1729 h, beginning Site U1549 operations. Upon implementing a precision depth recorder survey that gave a seafloor depth of 1842.1 meters below sea level (mbsl), we made up the APC and extended core barrel (XCB) bottom-hole assembly (BHA) and started lowering the drill string to the seafloor. We picked up the top drive, positioned the bit at 1837.1 mbsl, and spudded Hole U1549A at 2355 h on 24 October. At 0030 h on 25 October, mudline Core 385-U1549A-1H recovered 6.5 m and established a seafloor depth of 1840.1 mbsl. On 25 October, Cores 1H–18H penetrated from the seafloor to a final depth of 168.0 mbsf and recovered 166.9 m (99%) (Table T2) without incident. Nonmagnetic core barrels were deployed, and orientation measurements were made on all cores using the Icefield MI-5 core orientation tool. We took formation temperature measurements on Cores 4H, 7H, 10H, and 13H. Upon reaching the target depth objective of 168.0 mbsf in Hole U1549A, we pulled the drill string out of the hole, and the bit cleared the seafloor at 1515 h on 25 October, ending Hole U1549A. A total of 21.8 hours, or 0.9 days, were spent on Hole U1549A.
2.1.3. Hole U1549B
We moved the vessel 20 m northwest to spud Hole U1549B. We positioned the bit above the seafloor and spudded Hole U1549B at 1640 h on 25 October 2019. Mudline Core 385-U1549B-1H recovered 5.48 m and determined a seafloor depth of 1841.2 mbsl. On 25 October, Cores 1H–18H penetrated from the seafloor to a final depth of 166.9 mbsf and recovered 164.4 m (99%) using the APC system (Table T2). The hole was cored without incident. Nonmagnetic core barrels were used, and orientation measurements were taken on all cores using the Icefield orientation tool. We pumped PFTs for drilling fluid (seawater) contamination monitoring on all cores. The pacing of coring was adjusted to the complex high-resolution microbial and biogeochemical sampling program conducted on the core receiving platform (i.e., one core every ~75 min). Upon accomplishing the sampling and target depth objectives for Hole U1549B, we terminated coring upon recovery of Core 18H. We then pulled the drill string out of the hole, and the bit cleared the seafloor at 1550 h on 26 October. The top drive was set back, and a routine slip-and-cut of the drill line was performed. Once this process was completed, the drill string was recovered and the ship was secured for transit to Site U1550. The ship switched from DP to cruise mode at 2034 h on 26 October, ending Hole U1549B and Site U1549. A total of 29.3 hours, or 1.2 days, were spent on Hole U1549B.
3. Lithostratigraphy
Site U1549 provides insight into sedimentation in the deeper (water depth = ~1840 m), central part of Guaymas Basin near the Sonora margin. It is located near a methane-rich cold seep mound (Teske et al., 2018, 2021g) on an east-sloping basin plane ~9 km northwest of the northern axial graben and south of the Guaymas transform fault in a region not previously explored during Deep Sea Drilling Project (DSDP) Leg 64. Two holes were drilled at this site; Hole U1549A is located ~20 m from Hole U1549B. For each hole, the lithostratigraphic descriptions and analyses were carried out based on the curated depth of the cores (core depth below seafloor, Method A [CSF-A]); all references to depths in the text, figures, and tables refer to CSF-A and use meters below seafloor (mbsf) as a unit. Hole U1549A was drilled to 168 mbsf and a total curated depth of 168.35 mbsf with an overall 99% recovery rate. Hole U1549B penetrated 166.9 m to a total curated depth of 166.8 mbsf with a 99% recovery rate.
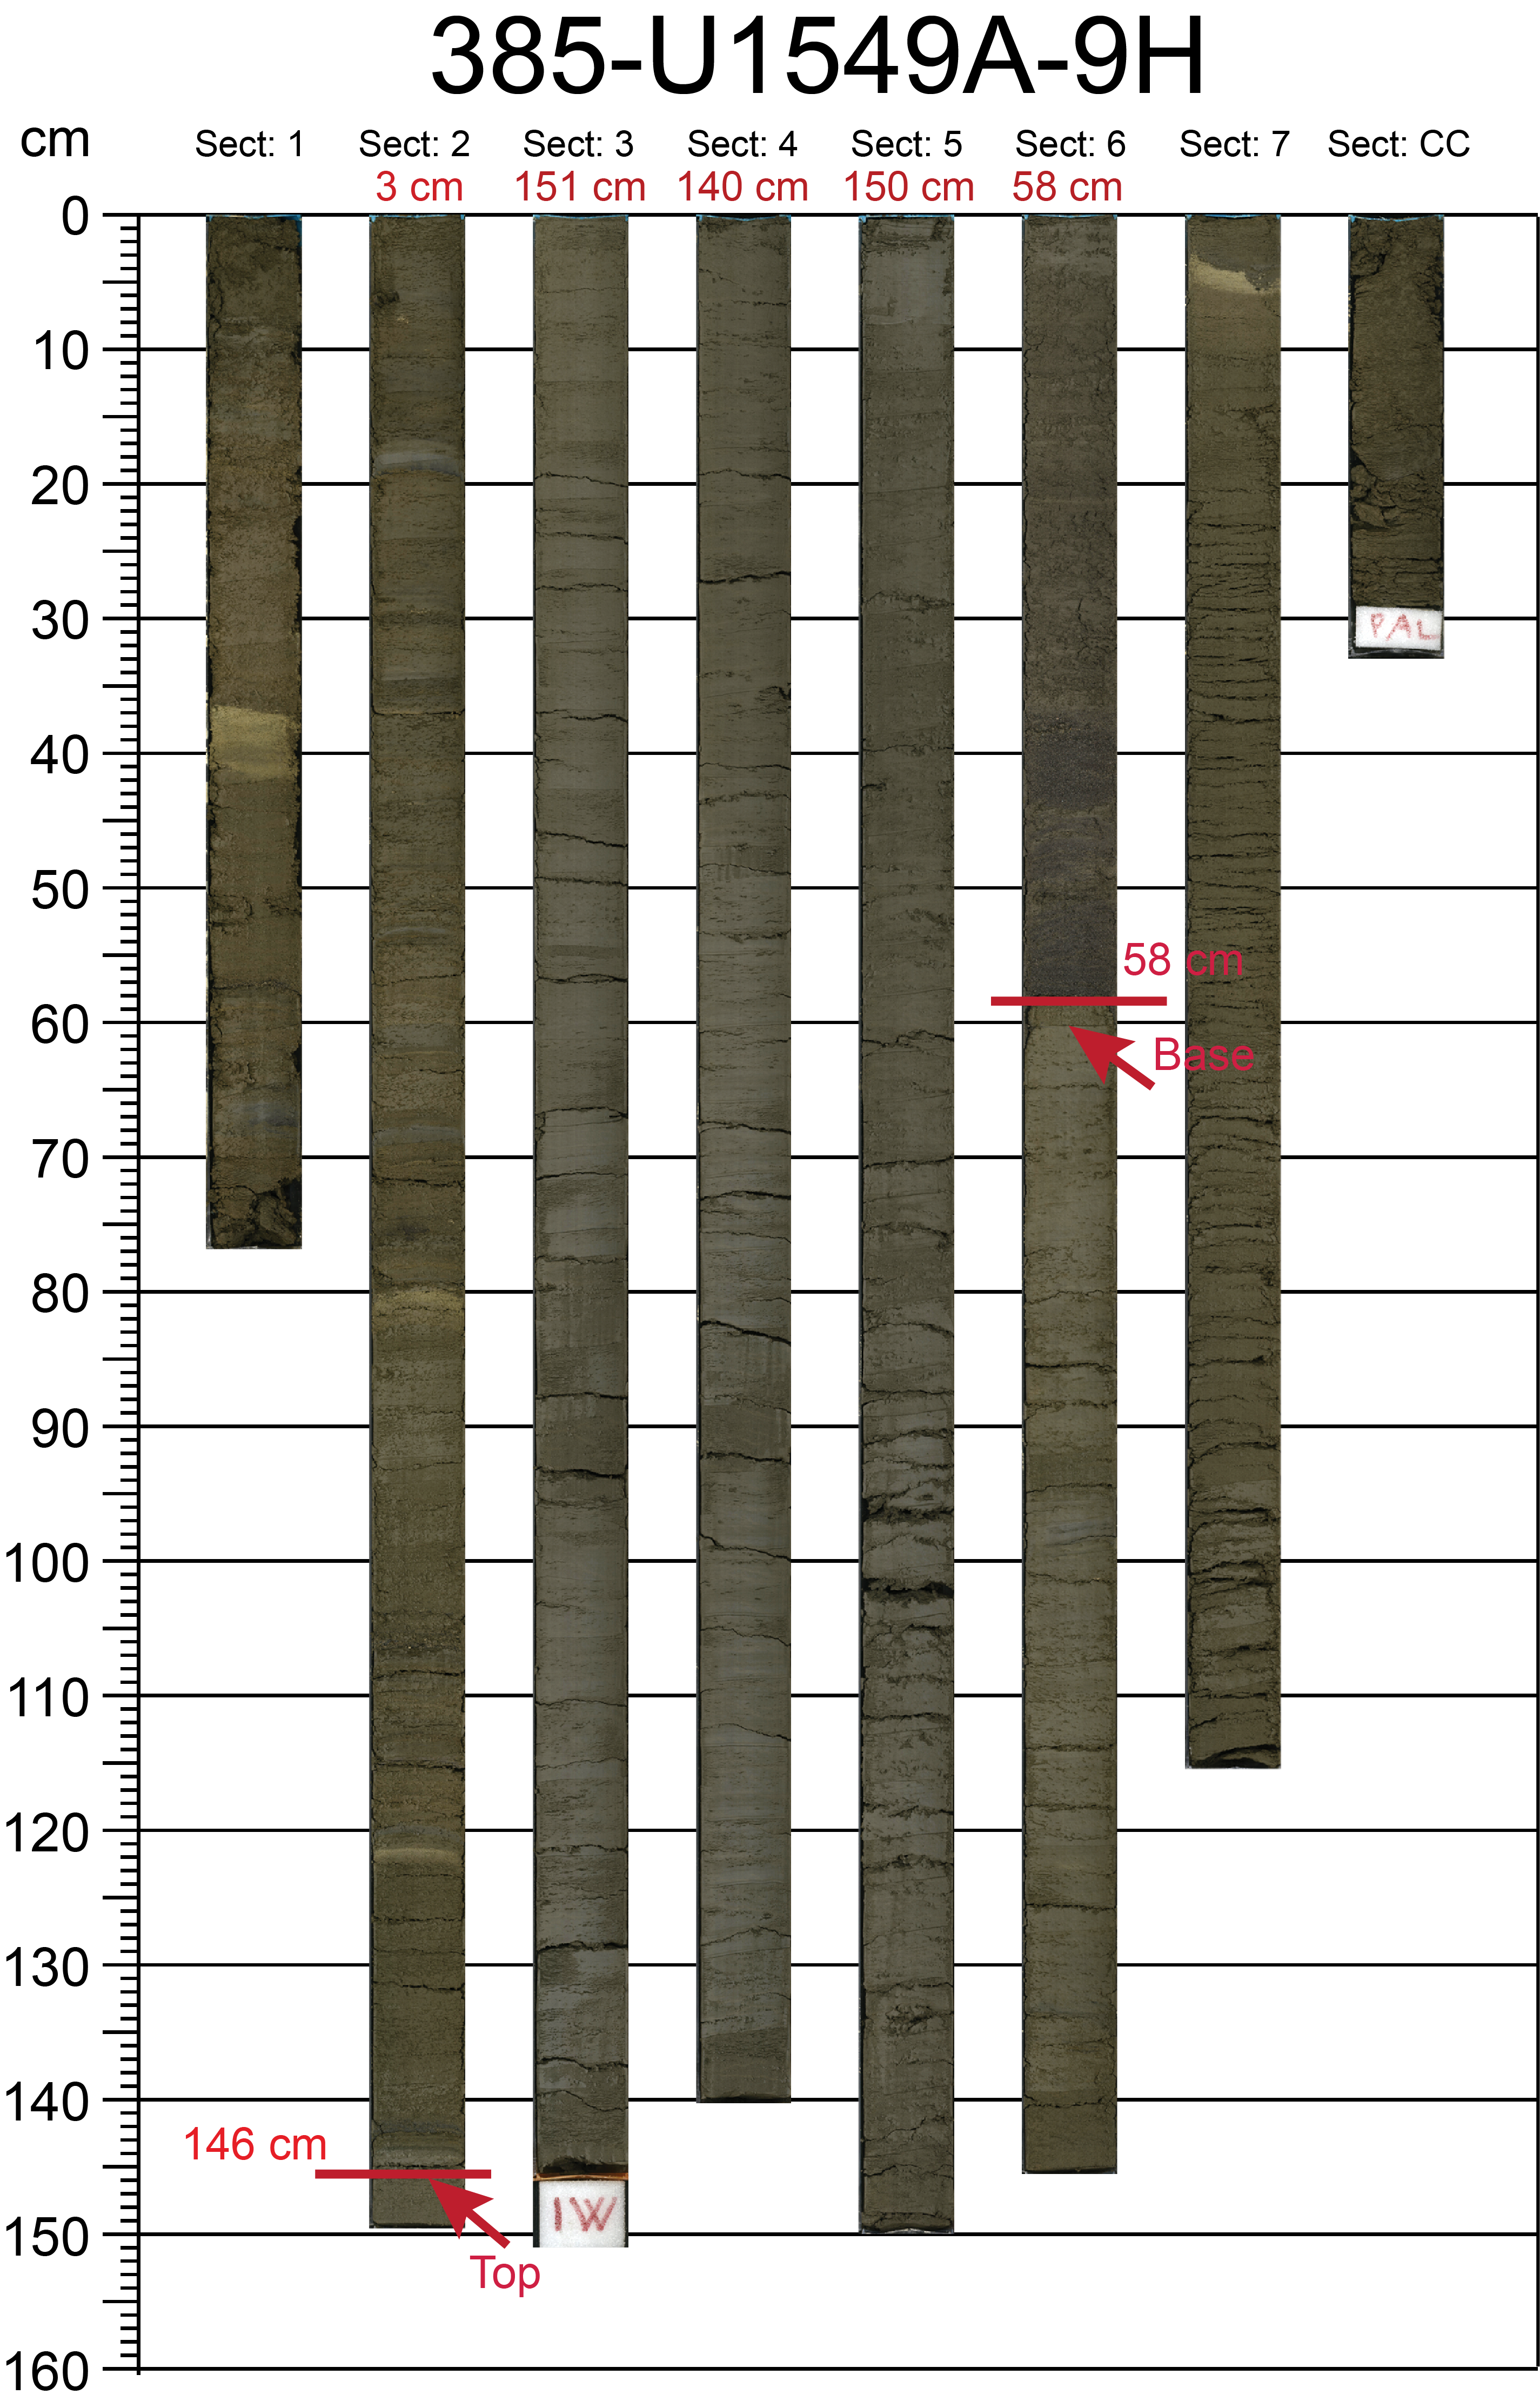
Eighteen cores were collected from each hole using the APC system (core designator H in visual core descriptions). Although the quality of the APC cores was very good, significant gas expansion disrupted some of the sections and resulted in extrusion of core material from the core liner. This extra material was segregated into significantly shorter sections (generally Section 1) for these cores. The short cores often showed evidence of moderate drilling disturbance, as mentioned in visual core descriptions.
The lithologic determinations and interpretations made on cores from the two Site U1549 holes used a combination of visual core description, examination of smear slides with a petrographic microscope, mineralogic analysis using X-ray diffraction (XRD), and carbonate analyses. The interpretation was also aided by analysis of measured physical properties such as MS, NGR, and color reflectance (see Lithostratigraphy and Petrophysics in the Expedition 385 methods chapter [Teske et al., 2021a]). Hole U1549A was dedicated to lithostratigraphic description with minor whole-round core sampling. Hence, most of the observations and the depths of lithologic changes reported are from that hole as compared to Hole U1549B, where significant core intervals were not described because of intense shipboard microbiology and geochemistry sampling.
The sediments recovered at Site U1549 are mostly biogenic (mainly diatom ooze) with a significant (~11%) proportion of sandy to silty laminae and beds compared to the sites drilled at Ringvent and in the northwestern part of Guaymas Basin (Sites U1545–U1548). Note that there is significantly more silt and clay disseminated in associated hemipelagic beds as well. Individual siliciclastic beds at Site U1549 somewhat resemble those encountered at Site U1547, but they show a greater range in thickness (maximum thickness = ~6 m) (Table T3).
The relatively shallow holes at Site U1549 did not show evidence of the diagenetic changes that prompted the division of Lithostratigraphic Unit I into subunits at Sites U1545–U1548. At the bottom of Hole U1549A, there was a slight increase in micrite content (up to 3%) and evidence of recrystallization of nannofossils (as determined by birefringence), which suggested that the bottoms of the holes correspond to the onset of a diagenetic zone characterized by carbonate precipitation that, at the previous sites, resulted in the division of Subunits IA and IB. However, downhole changes in lithology were not significant enough to require division of the recovered cores into more than one lithostratigraphic unit (Unit I) (Figure F4).
3.1. Unit description
3.1.1. Lithostratigraphic Unit I
- Intervals: 385-U1549A-1H-1, 0 cm, to 18H-CC, 33 cm; 385-U1549B-1H-1, 0 cm, to 18H-CC, 28 cm
- Depths: Hole U1549A = 0–168.35 mbsf, Hole U1549B = 0–166.8 mbsf
- Thickness: Hole U1549A = 166.35 m, Hole U1549B = 166.8 m
- Age: (Holocene? to) late to middle Pleistocene
- Lithology: nannofossil-bearing diatom clay, diatom ooze, clay-rich diatom ooze, nannofossil-bearing clay-rich diatom ooze, diatom clay, diatom-rich silty clay to clayey silt, clayey silt, silt, and sand
Lithostratigraphic Unit I is composed of ~168 m of late to middle Pleistocene sediments. The uppermost core consists of moderately olive-brown nannofossil-rich diatom clay (nannofossil-bearing in Hole U1549B) that is homogeneous with open burrows and clam shells. The degree of homogenization by bioturbating organisms can be seen in X-ray images of the archive-half sections (https://zenodo.org; search the International Ocean Discovery Program community for Expedition 385 data). The light olive-gray diatom-rich clayey silt and black sand layers in Core 385-U1549A-1H are harbingers of the multiple similar depositional units in underlying sections that are intercalated within the background (host), laminated to homogeneous (bioturbated) diatom ooze to diatom clay. As seen at Sites U1545–U1548, these depositional units involve various mixtures of biogenic (mainly diatoms) and terrigenous (clay/silt/sand) components. They form end-member (terrigenous/biogenic) and transitional lithologies that show repetitive patterns from which depositional processes, mainly sediment gravity flows (mass flows; i.e., flow of sediment or sediment-fluid mixtures under the action of gravity [Middleton and Hampton, 1973]), can be inferred. These types of deposits are most similar to those documented in the upper two subunits at Site U1547 and in Unit I at Site U1552, which are the most proximal sites to Site U1549 drilled during Expedition 385. Deposit types are characterized by (1) lamination, (2) homogeneity (with white cap and locally a coarse base), or (3) terrigenous content (clay, silt, and silt + sand), as described below (Figure F5).

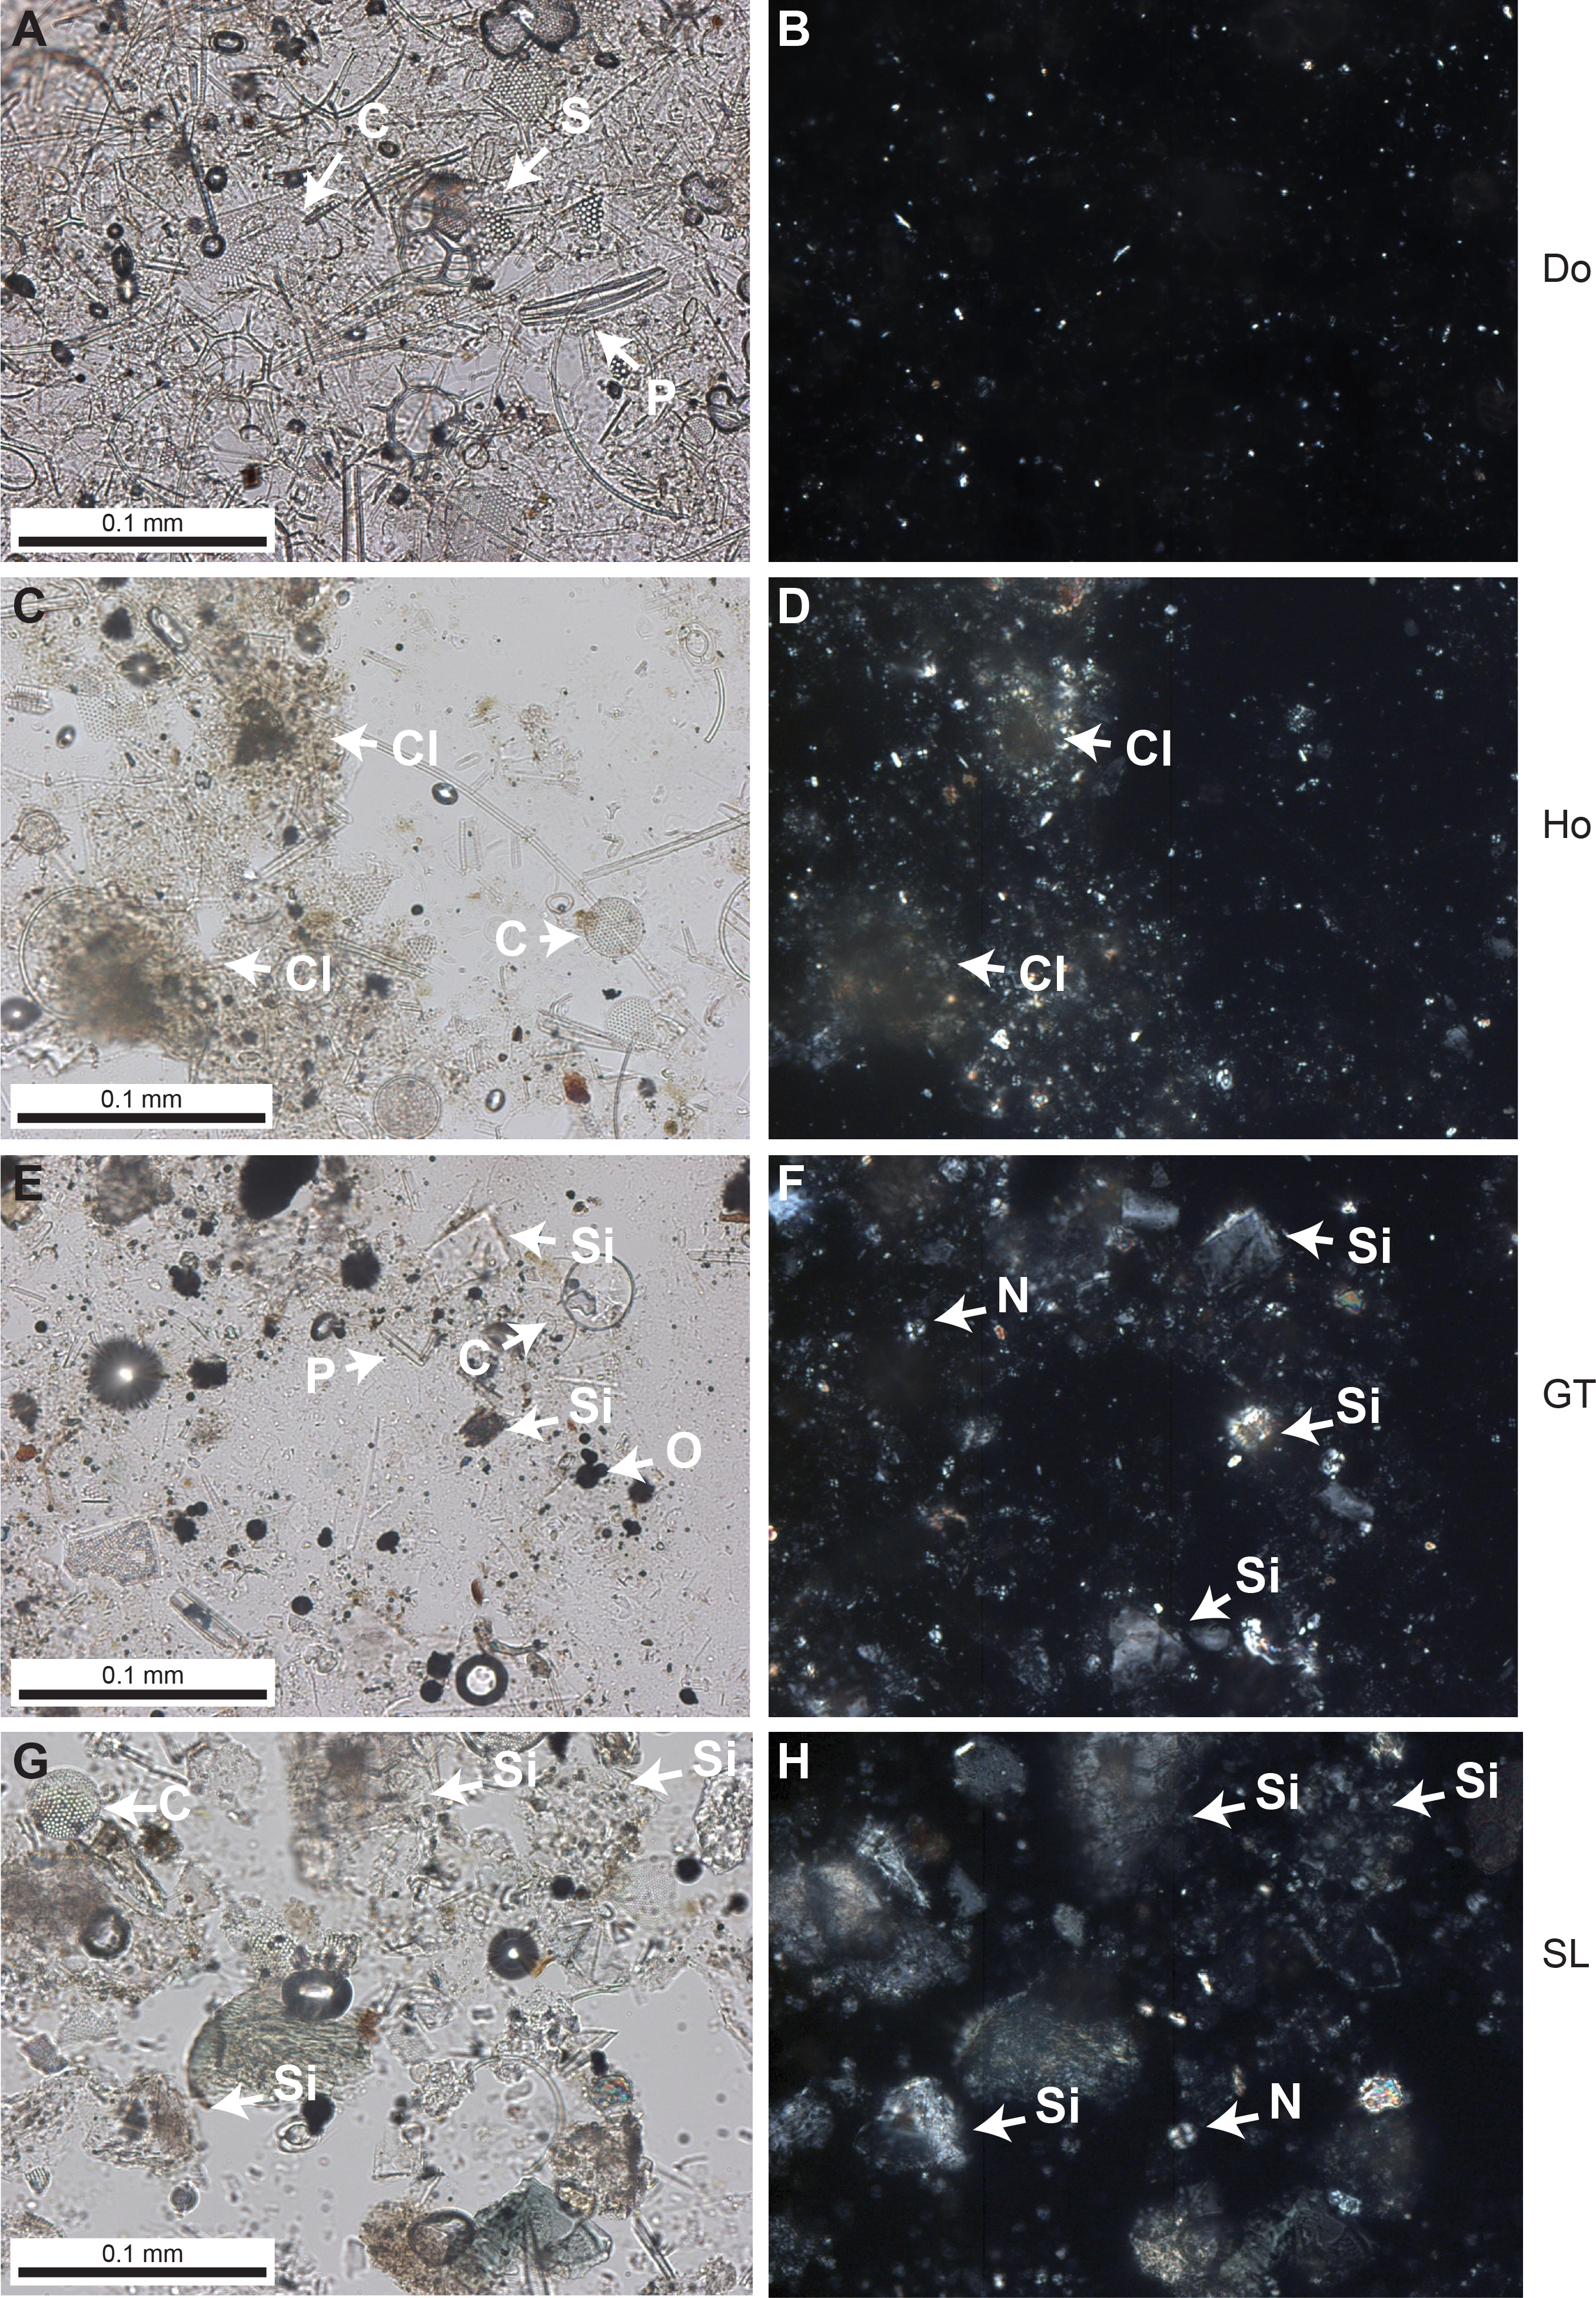
The first deposit type is laminated diatom ooze mixed with clay minerals, a lithology that is less prevalent at Site U1549 compared to northwest Guaymas Basin and Ringvent. It is locally the dominant lithologic component (e.g., Section 385-U1549A-2H-2) or occurs in thinner decimeter-scale intervals that separate thicker gravity-flow deposits. Lamination becomes fainter with depth (e.g., Section 9H-2) and virtually disappears in Cores 15H–18H. The laminae consist mainly of diatom tests mixed with different amounts of clay minerals. The intervals with higher diatom content are generally light olive-gray, whereas the intervals with higher clay content tend to be darker (e.g., olive-gray) with the addition of gray, silt-bearing laminae (Figure F5A–F5B).
The second deposit type comprises intervals of homogeneous olive-gray clay (to silt)-rich diatom ooze capped by a lighter colored interval mainly composed of diatom tests (Figure F5A, F5C). These lithologies are defined using smear slides (Figure F6). Such deposit types range from a few centimeters to decimeters in thickness and have abrupt bases locally marked by a coarser basal lamina of silt- to sand-sized bioclasts (foraminifers and small bivalves). Where thicker, they may exhibit a base of laminated bioclastic sand with some siliciclastic particles (Figure F5D). Because of their abrupt contacts, they can be described as beds and ascribed to single depositional events. For example, Core 385-U1549A-5H contains six of these abrupt-based, light-capped intervals ranging from 20 to 33 cm thick.
The third deposit type is dominantly siliciclastic but includes some admixed biogenic components. These depositional varieties are recognized by their gray to black hues and range from thin laminae (discussed above) (Figure F5B) to thin beds (e.g., Figures F5A, F7) to beds as thick as ~6 m (Table T3). Thin beds begin at abrupt to scoured basal contacts overlain by silt- to clay-rich lithologies (e.g., Figure F5A). Thicker beds are associated with basal sand to silt horizons, locally normally graded, that pass up into first silt-dominated and then clay-rich lithologies in overall fining-upward successions (e.g., Figure F7). The bases of these thicker units also range from abrupt to scoured (Figure F5C, F5E). The thickest terrigenous beds are numbered (1–4) in Figure F4, and details of their occurrence are given in Table T3, including their correlation between Holes U1549A and U1549B. These four beds are also the coarsest in the unit and, from bottom to top, they exhibit decreasing values of NGR and MS and increasing values of the color reflectance parameter b* (Figure F4), representing expected trends associated with fining-upward from sandy basal units to more mud rich lithologies. It is noteworthy that few, if any, of the beds exhibit bioturbated tops (as observed during core description). The sandy bases of thicker beds often transition to intervals of alternating silt- and clay-rich laminae (Figure F5C, F5E). Overall sand/silt percentages are highest in Cores 385-U1549A-2H and 3H (~35% average), 6H–8H (~16% average), and 4H and 16H (~12% average).
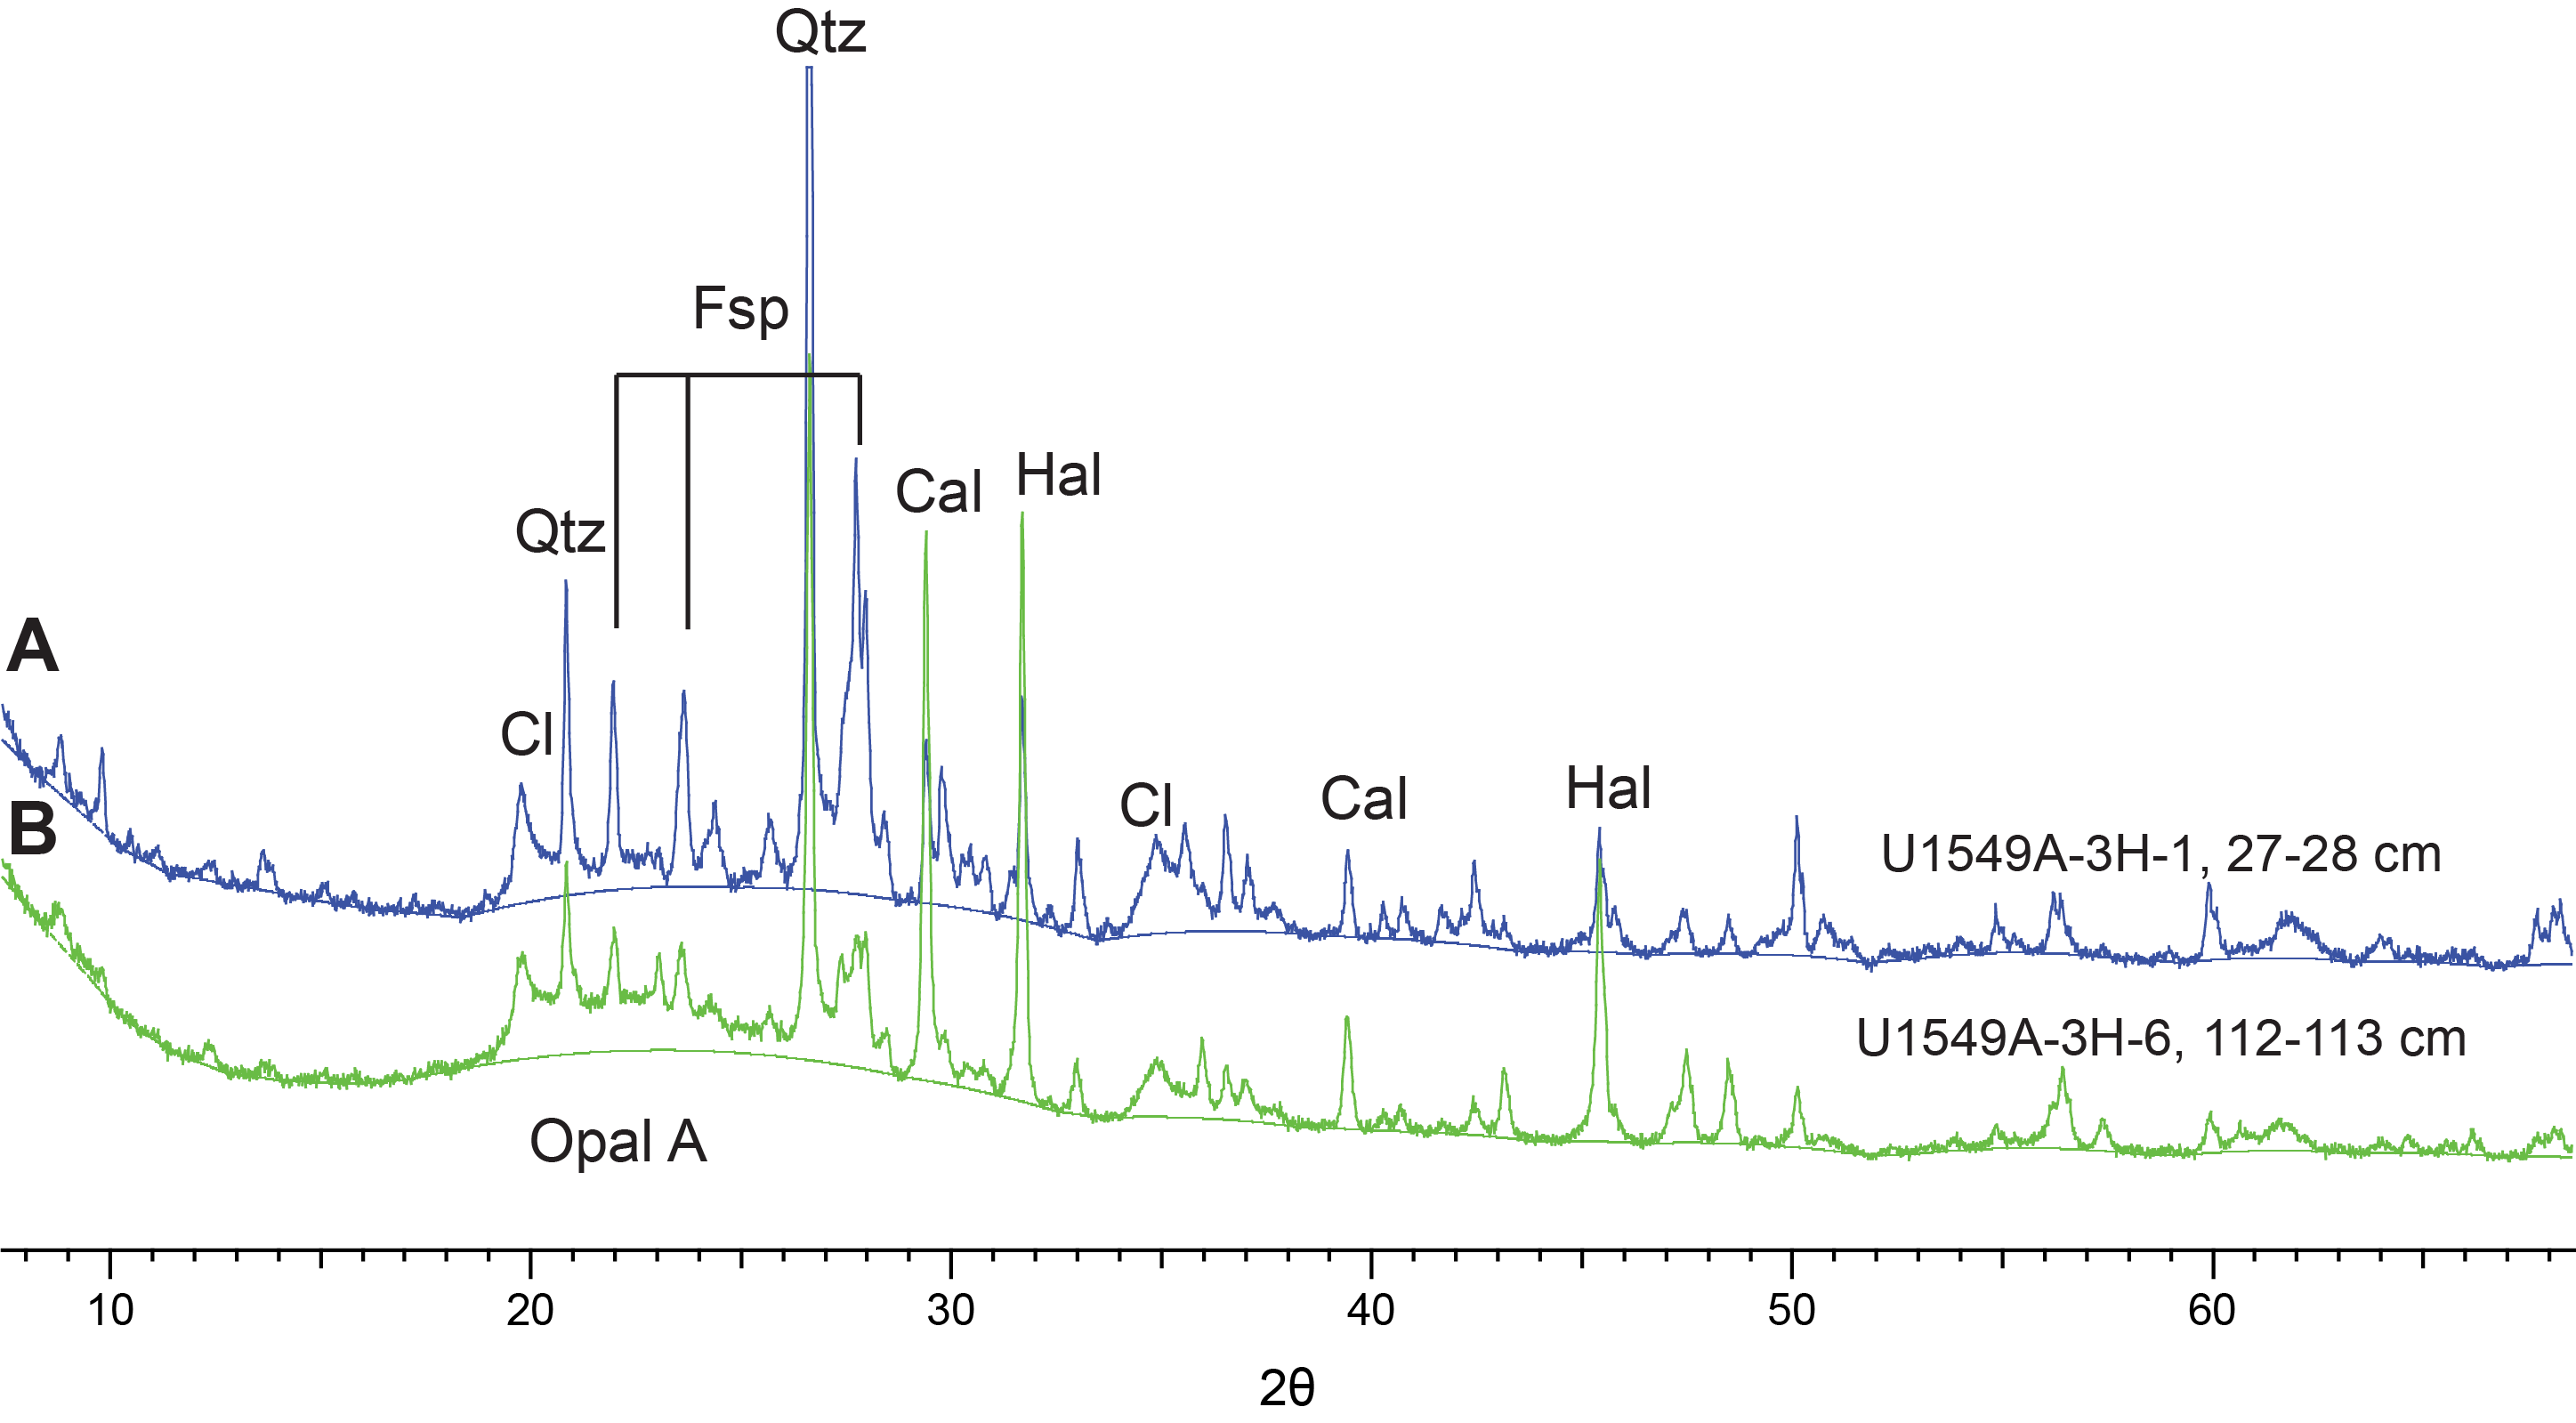
XRD analyses confirm that the clay-rich diatom ooze intervals do not show any diagenetic changes in the silica phase (Figure F8A); opal-A is the dominant silica phase throughout the site, and the main carbonate phase is calcite. According to geochemical analysis, carbonate content averages 6 wt% and ranges as high as 17 wt% across all lithologies (see Organic geochemistry). Smear slide petrography shows that the majority of the carbonate is biogenic, reflecting the presence of nannofossils and foraminifers in the sediment (Figure F6F, F6H), with only accessory micrite of unknown origin (this could be either recrystallized bioclastic fragments or abiotic precipitates). The opal-A silica is of biogenic origin, predominantly derived from diatom tests with traces of other biosiliceous particles (e.g., silicoflagellates, radiolarians, and siliceous sponge spicules) (e.g., Figure F6A–F6B). Organic matter is also present (originating from marine algae and terrestrial plants) and locally significant (see Organic geochemistry). The results of XRD analyses of the intervals dominated by siliciclastic, silt-sized particles corroborate the results of smear slide analysis and indicate the presence of quartz, feldspar, and detrital clay minerals (Figure F8). Smear slide estimates also show the quartz, feldspar, and rock fragment proportions of the sand fraction to be, on average, 10% quartz, 25% feldspar, and 65% rock fragments. Many of the rock fragments, where textures can be discerned, are feldspar-bearing volcanic fragments and may also include altered feldspar. Mica flakes, dense mineral grains, and foraminifer tests are minor sand-sized components. The silt lithologies and silt components appear to be more enriched in quartz and feldspar compared to the sand-sized fraction (Figure F6G–F6H).
3.2. Discussion
The nature and origin of the laminated diatomaceous sediment intervals are discussed in previous chapters (see Lithostratigraphy in the Site U1545, Site U1546, and Site U1547/U1548 chapters [Teske et al., 2021b, 2021c, 2021d]). We call upon the same pelagic to hemipelagic processes (anoxic to suboxic conditions) to have created them at Site U1549. The laminated intervals are not as prevalent at this site, in part owing to the location of the seafloor below or near the bottom of the oxygen minimum zone, which perhaps resulted in more homogenization through bioturbative mixing. Another factor is the presence of numerous mixed homogeneous beds with diatom ooze caps and normally graded gray terrigenous beds, locally with scoured bases, throughout the drilled section. Both could be interpreted as products of slope instability in this tectonically active basin, with the more diatom-rich examples associated with clastic-starved slopes and the siliciclastic examples sourced from slopes with terrigenous input from Sonoran rivers like the Yaqui or runoff from Baja California; alternatively, the differences could be due to segregation of particles by grain size/composition during transport and resedimentation. These elements represent distinctive sedimentological characteristics of gravity flows and in particular hybrid flows because they also locally exhibit compositional banding and alternating sand–mud laminae (Figure F5C, F5E), as described by Davis et al. (2009) for the Paleocene Forties Fan in the North Sea. Mechanisms that might have triggered slope instability include earthquakes and the effects of large storms, such as storm surge and high fluvial discharge triggered by the largest hurricanes that pass over the Gulf of California as discussed by Barbara et al. (2016) and Silverberg et al. (2007). During the latter events, terrigenous sediment can be directly fed into the basin from rivers via suspension plumes or mass-wasting events.
The lithostratigraphies are fairly correlative in the two holes drilled at Site U1549. There are some slight differences in the occurrence of terrigenous layers overall, but the three thickest layers occur at similar depth levels in each hole (see Table T3).
4. Structural geology
Drilling at Site U1549 penetrated Unit I and recovered a sedimentary sequence of diatom ooze, diatom clay, silt, and sand that contains major mass-gravity flow deposits as thick as 6 m. The sequence was not divided into lithostratigraphic subunits at this location because it had the same character at all depths and no criteria for identifying any subunits were observed (see Lithostratigraphy). For all cores, structures were measured and/or described, where present, from the archive-half sections of the cores and their high-resolution visible light photographs. X-ray images were also used for Hole U1549A. No X-ray imaging was conducted for Hole U1549B. None of the samples were sufficiently lithified to be measured independently as whole-round pieces.
4.1. Sedimentary units
Structural information was obtained from sedimentary sequences in each of the two holes at Site U1549. Hole U1549A was lithologically more complete than Hole U1549B and provided the best opportunity for structural observations. In Hole U1549B, some sections were removed for microbiological sampling immediately upon retrieval from the core liners and were therefore not available for structural study. The two holes at Site U1549 are 20 m apart and generally have similar sedimentary stratigraphy.
Bedding and lamination in the intervals dominated by biogenic lithologies in the sedimentary sequence are similar to those described for Site U1545. Some thicker beds of sand to silt dominated by terrigenous input are also present at Site U1549. These usually have scoured basal contacts, which are not reliable as paleohorizontal markers, but they generally grade upward into laminated sequences where orientations could be measured.
4.2. Folds
Tilted laminae seen in Cores 385-U1549A-2H and 3H suggest small-scale slump folds affecting the top 25 m of the sequence, but most of the rest of Hole U1549A as well as Hole U1549B have laminae that are roughly perpendicular to the axis of the drill hole. One chevron fold with a horizontal fold axis was found in interval 385-U1549A-3H-1, 42–47 cm (Figure F9). Tilted bedding was noted starting in Section 16H-1 (at 139.5 mbsf) and continuing in Cores 17H and 18H (~145 mbsf) with values typically ranging from 10° to 15°.

4.3. Brittle fractures and faults
A few brittle faults were seen in the top 100 m in Cores 385-U1549A-2H and 3H and 385-U1549B-11H. Observations from Site U1549 indicate much less faulting in the sedimentary section studied compared to sites at Ringvent (Sites U1547 and U1548), in the north Guaymas rift (Site U1550), and in the northwestern part of Guaymas Basin (Sites U1545 and U1546). Therefore, key stratigraphic packages between the two holes were correlated with reliable accuracy even though the whole-round core intervals sampled for microbiology and geochemistry were not available for use in the structural comparison.
5. Biostratigraphy
Toothpick samples from Hole U1549A were taken and analyzed for calcareous nannofossils and marine diatoms. Both spot samples from working- and archive-half cores and core catcher samples were taken throughout Hole U1549A (6.06–168 mbsf) to constrain biostratigraphic events. Calcareous nannofossils are abundant to common and associated with a good/moderate preservation throughout the entire sampled sequence at Site U1549 (Table T4). The barren interval seen at Sites U1545–U1548 is not present at Site U1549 (see Biostratigraphy in the Site U1545, Site U1546, and Site U1547/U1548 chapters [Teske et al., 2021b, 2021c, 2021d]).
Overall, marine diatoms are dominant and abundant with good and moderate preservation throughout Hole U1549A, except for common abundance in Samples 7H-7, 137 cm (63.62 mbsf), and 8H-7, 110 cm (71.23 mbsf). Freshwater diatoms in Hole U1549A were found much more frequently than at previously drilled Sites U1545–U1548, especially in Samples 385-U1549A-7H-7, 137 cm (63.62 mbsf), and 8H-7, 110 cm (71.23 mbsf), suggesting a strong influence of terrestrial input. No apparent diagenetic alteration of diatoms was found in Hole U1549A (Table T5). Photomicrograph Plate 6 in DIATOMS in Supplementary material shows an overview of some diatom taxa identified in Hole U1549A.
No biostratigraphic datum was defined in the generally continuous succession from the Holocene or the late to middle Pleistocene (Table T6). The occurrence of E. huxleyi throughout the entire sequence to the bottom of the hole dates the sediments of Hole U1549A to be younger than 0.29 Ma (0–168.35 mbsf). This age assignment is consistent with the absence of P. lacunosa (LAD = 0.44 Ma) and F. reinholdii (LAD = 0.62 Ma) in all samples examined. The estimated average sedimentation rate is greater than 580 m/My (>58.0 cm/ky) (Figure F10).
5.1. Calcareous nannofossils
Among the generally well preserved and abundant to common calcareous nannofossils (Table T4), reworked Cretaceous and Miocene taxa are present throughout Hole U1549A. The origin of reworked nannofossils is uncertain, although possible sources may include eroded Cretaceous outcrops in the Colorado River catchment, Cretaceous chalk deposits underlying the Sierra Madre Occidental mountain range, and marine Miocene strata on Isla Tiburón (McDougall and Martínez, 2014; Helenes et al., 2009). The sources of reworked taxa will be analyzed in detail during postexpedition research.
The sediment sequence in Hole U1549A is assigned to Nannofossil Zone NN21 based on the presence of E. huxleyi in all samples of the hole. The corresponding nannofossil biostratigraphic datum, namely, the first appearance (bottom) of E. huxleyi (0.29 Ma), was estimated to occur below the drilled bottom of the sediment sequence in Hole U1549A (Table T4), indicating an age younger than 0.29 Ma for the bottom of Hole U1549A.
5.2. Diatoms
Diatoms are abundant to Sample 385-U1549A-6H-7, 90 cm (53.68 mbsf), with good to moderate preservation. In Samples 7H-7, 137 cm (63.62 mbsf), and 8H-7, 110 cm (71.23 mbsf), diatoms are common and show good preservation (Table T5). In Samples 9H-7, 70 cm (81.85 mbsf), to 12H-7, 50 cm (110.23 mbsf), diatoms are abundant with moderate or good preservation. In Sample 13H-7, 70 cm (118.71 mbsf), diatoms are few with moderate preservation. In Samples 14H-6, 140 cm (128.76 mbsf), to 17H-8, 50 cm (158.09 mbsf), diatoms are abundant with moderate preservation. In the last sample of Hole U1549A (18H-8, 80 cm; 168 mbsf), diatoms are abundant but with poor preservation. Numerous fragments were observed in the smear slides (see photomicrograph Plate 9 in DIATOMS in Supplementary material showing decreasing diatom preservation with increasing degree of diagenesis based on images from Holes U1545A and U1546A). Nevertheless, in most cases they could be identified down to species level (Table T5). No age-diagnostic diatom species were found, suggesting an age younger than 0.62 Ma, as indicated by the top of F. reinholdii (Table T5).
6. Paleomagnetism
Paleomagnetic shipboard measurements included the analysis of the NRM on archive-half sections and discrete samples from Hole U1549A to establish a magnetostratigraphy of the site. Representative discrete samples were collected from every APC core (one sample per core). No paleomagnetic measurements were conducted for Hole U1549B.
6.1. Archive-half section analysis
Archive-half sections from Hole U1549A were demagnetized at 5 cm intervals up to 20 mT. With the exception of a few highly disturbed archive-half sections, all sections from Hole U1549A were analyzed. Paleomagnetic measurements in Hole U1549B were not conducted because of (1) a discontinuous record of the archive-half sections due to complete sampling of whole-round core sections (approximately a few meters per core) for microbiology and geochemistry (see Microbiology, Organic geochemistry, and Inorganic geochemistry in the Expedition 385 methods chapter [Teske et al., 2021a]) and (2) the absence of excursions and reversals in the paleomagnetic record (see Magnetostratigraphy).
In-line AF demagnetization of archive-half sections (Cores 385-U1549A-1H through 18H) indicates a slight drilling overprint that was removed by an AF demagnetization treatment of 5–10 mT. Steeper inclination values before demagnetization are found at ~15–20 mbsf and from ~100 mbsf (Core 12H) downhole (Figure F11A). After demagnetization at 20 mT, inclination values cluster around an average value of 46°, which is similar to the expected GAD inclination value at the latitude of the site (~46.1°) (Figure F11B).
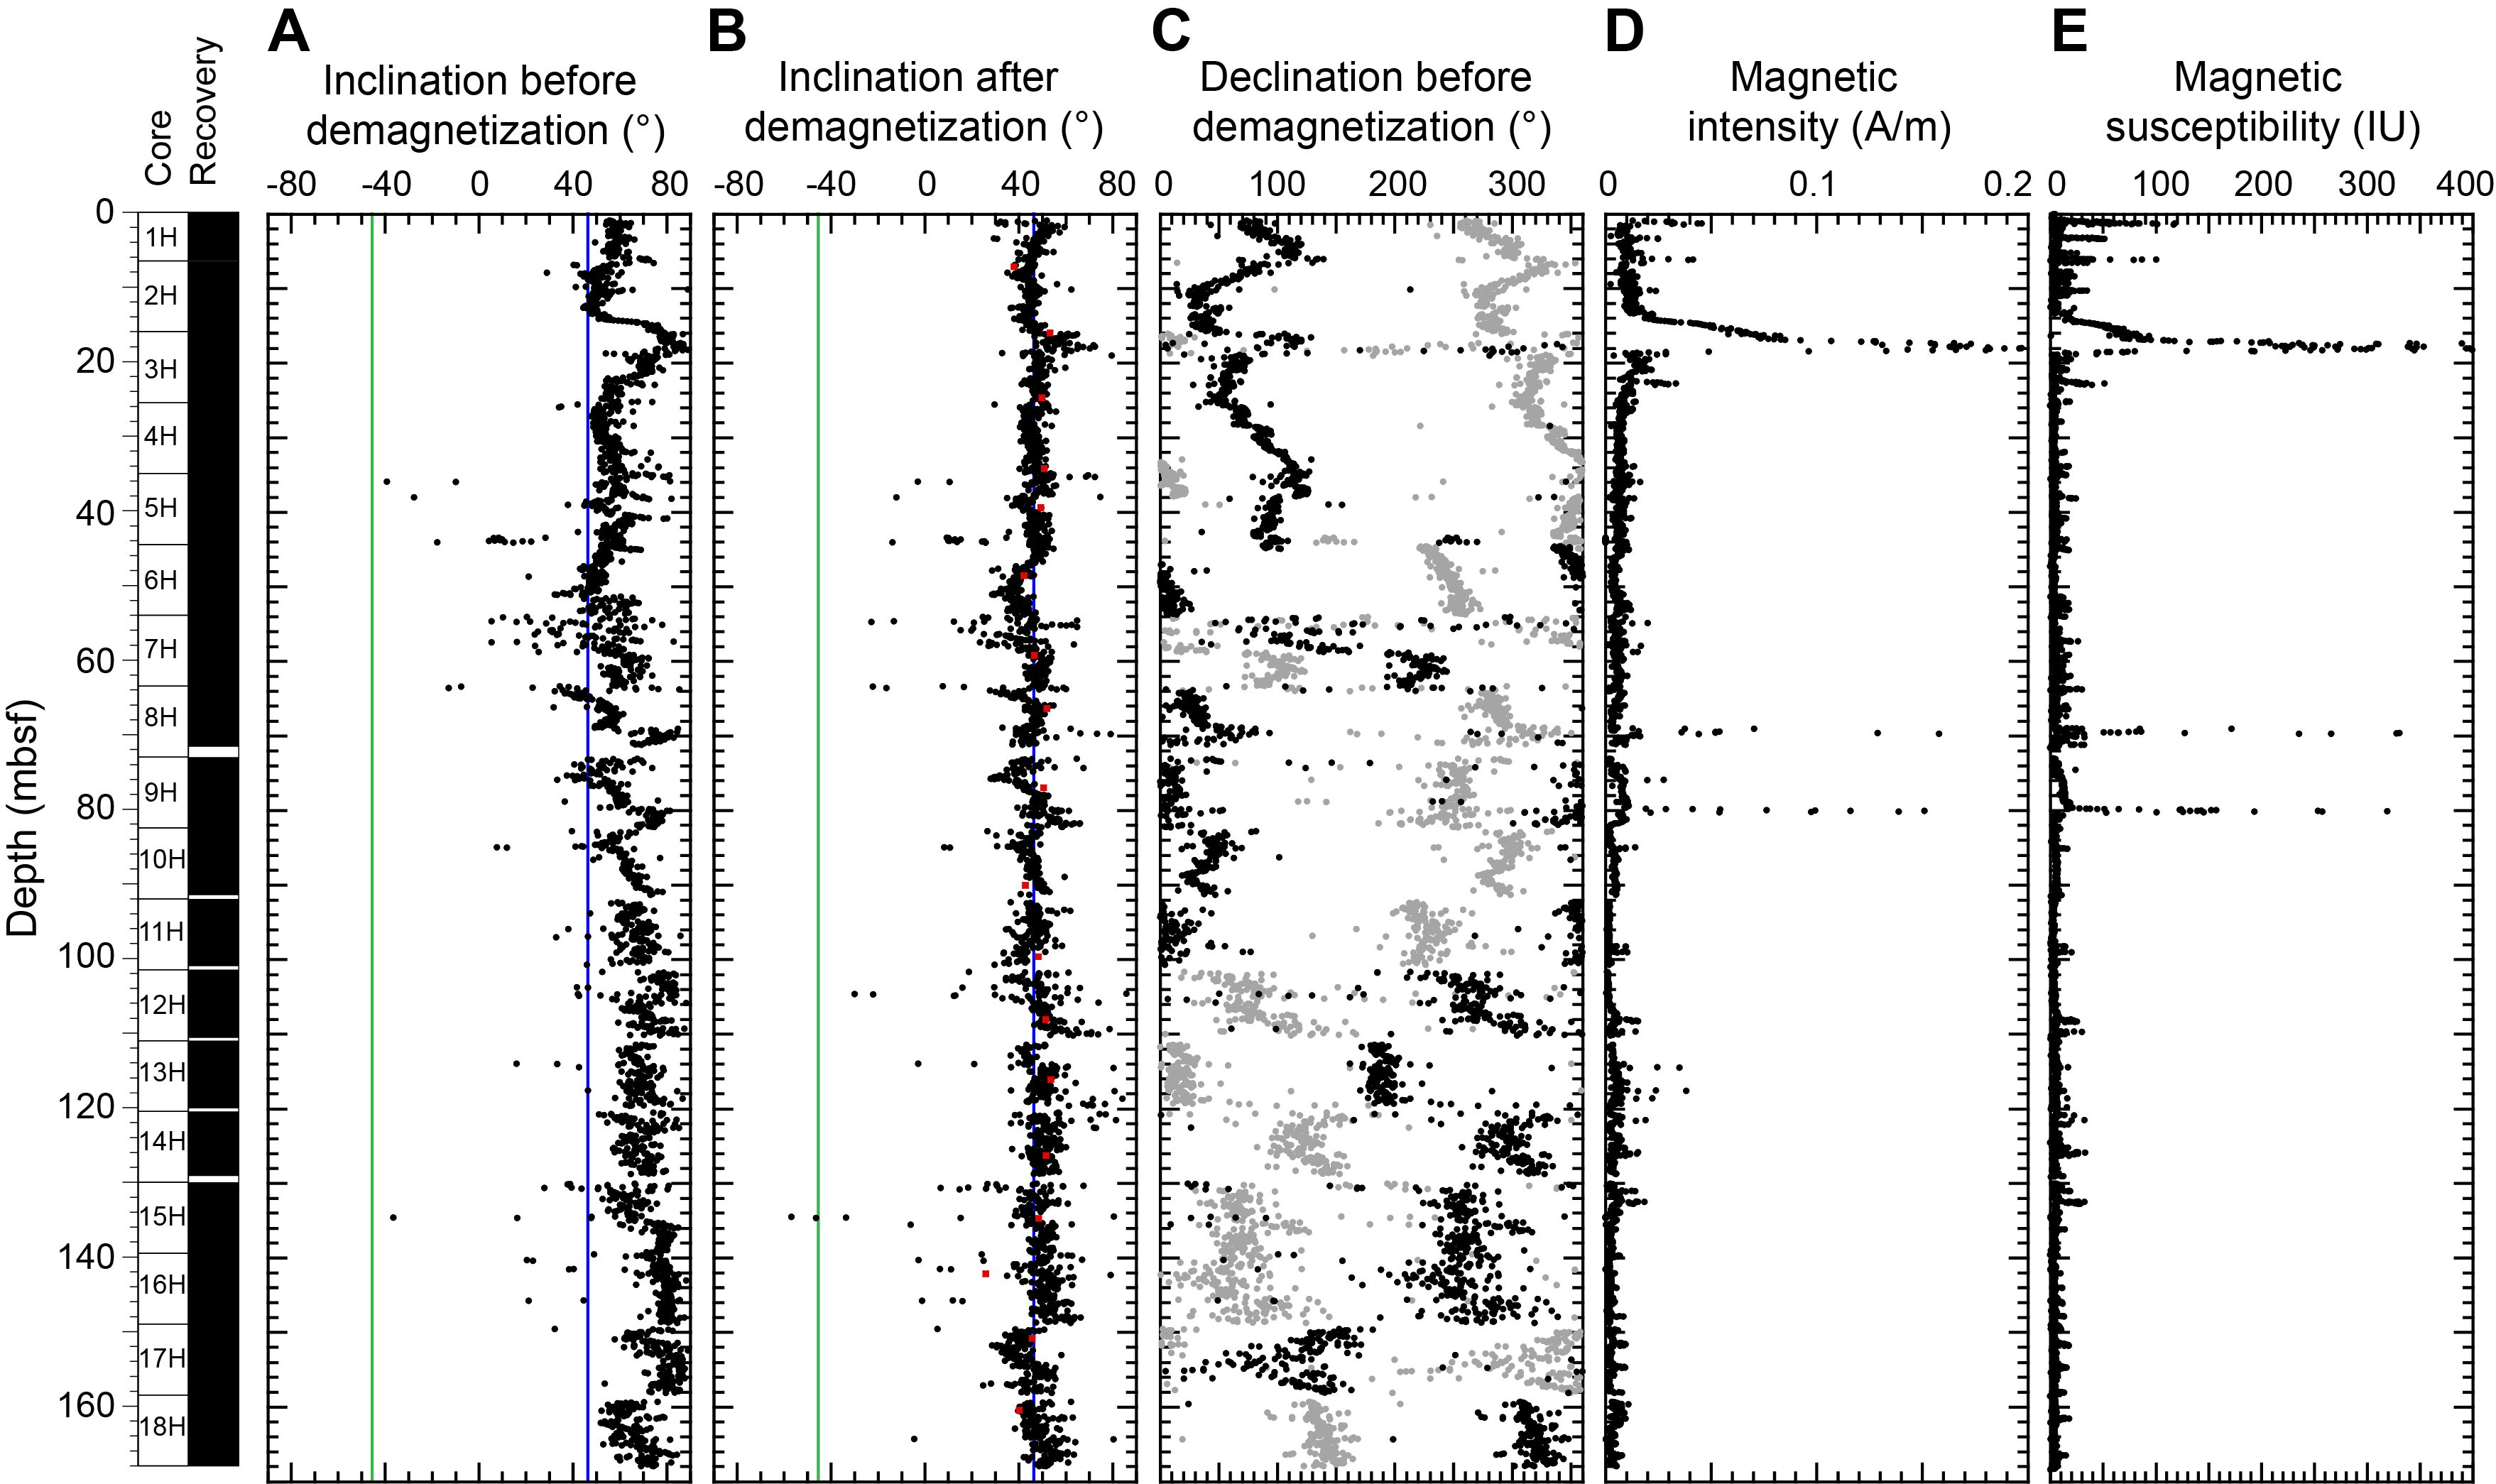
Magnetic intensity in Hole U1549A is generally <0.02 A/m (average = <0.01 A/m) (Figure F11D), which is similar to northwestern Guaymas Basin sites (see the Site U1545 and Site U1546 chapters [Teske et al., 2021b, 2021c]). Peaks of magnetic intensity occur at ~16–19 mbsf (Sections 385-U1549A-3H-1 and 3H-2), ~69.5–70 mbsf (Section 8H-6), and ~79.5–80 mbsf (Sections 9H-5 and 9H-6) with a maximum value of about 0.22 A/m. These intervals correspond to sandy layers (see Lithostratigraphy and the visual core description forms (VCDs) in Core descriptions), which contain more detrital material. Associated peaks in magnetic intensity are mirrored in point magnetic susceptibility (Figure F11E). In contrast to the northwestern Site U1545 and Ringvent Site U1548, no high-gradient, order-of-magnitude decrease of magnetic intensity related to the occurrence of a SMTZ can be observed in shallow cores.
6.2. Discrete sample analysis
For a more detailed study of the remanence in Hole U1549A, discrete samples were taken from the working halves of Cores 1H–18H at intervals of two discrete samples per APC core.
Remanence measurements were made using an AGICO JR-6A spinner magnetometer on a total of eighteen 8 cm3 cube samples (see Figure F21 in the Expedition 385 methods chapter [Teske et al., 2021a]). All of these samples were demagnetized using a stepwise-increasing AF to isolate the ChRM direction using principal component analysis (Kirschvink, 1980). No samples were thermally demagnetized because all discrete samples were taken using plastic sampling boxes.
NRM intensities vary between 1.04 × 10⁻³ A/m for samples taken from the deepest sampled depths and 3.62 × 10⁻² A/m for samples taken at the top of the hole (Table T7). The mean intensity of all samples is 7.84 × 10⁻³ A/m. AF demagnetization was implemented stepwise up to 60 mT, by which point the samples had lost more than 90% of their total magnetization (Figure F12B). Representative demagnetization diagrams (Zijderveld, 1967) are shown in Figure F12A. All reported declination and inclination data are shown in the sample coordinate reference frame; however, because cores are free to rotate in the core barrel, only the inclination data are taken into account for interpretation. Two magnetic components can be identified on the demagnetization diagrams for each discrete sample (Figure F12A). The first component was removed by an AF demagnetization treatment of 5–10 mT and corresponds to drilling overprint. The second component is stable and points toward the origin. This component is of normal polarity for all analyzed discrete samples. The median destructive field ranges from 4.4 to 24.2 mT with a mean of 12.3 mT, which is comparable to results obtained for previous sites. These results suggest a magnetic mineral assemblage dominated by low-coercivity (titano)magnetite. In Hole U1549A, the median destructive field was generally found to be higher at the top of the hole and lower at the bottom (Table T7). This downhole trend to lower coercivity is likely related to a coarsening of the magnetic grain assemblage in the sediment below the SMTZ (e.g., Leslie et al., 1990), which is around 25–30 mbsf (see Inorganic geochemistry). Coarser magnetic grains (especially multidomain grains) are more prone to overprinting (e.g., Dunlop et al., 1997). This trend could explain a stronger overprint observed in archive-half sections from ~50 mbsf downhole.
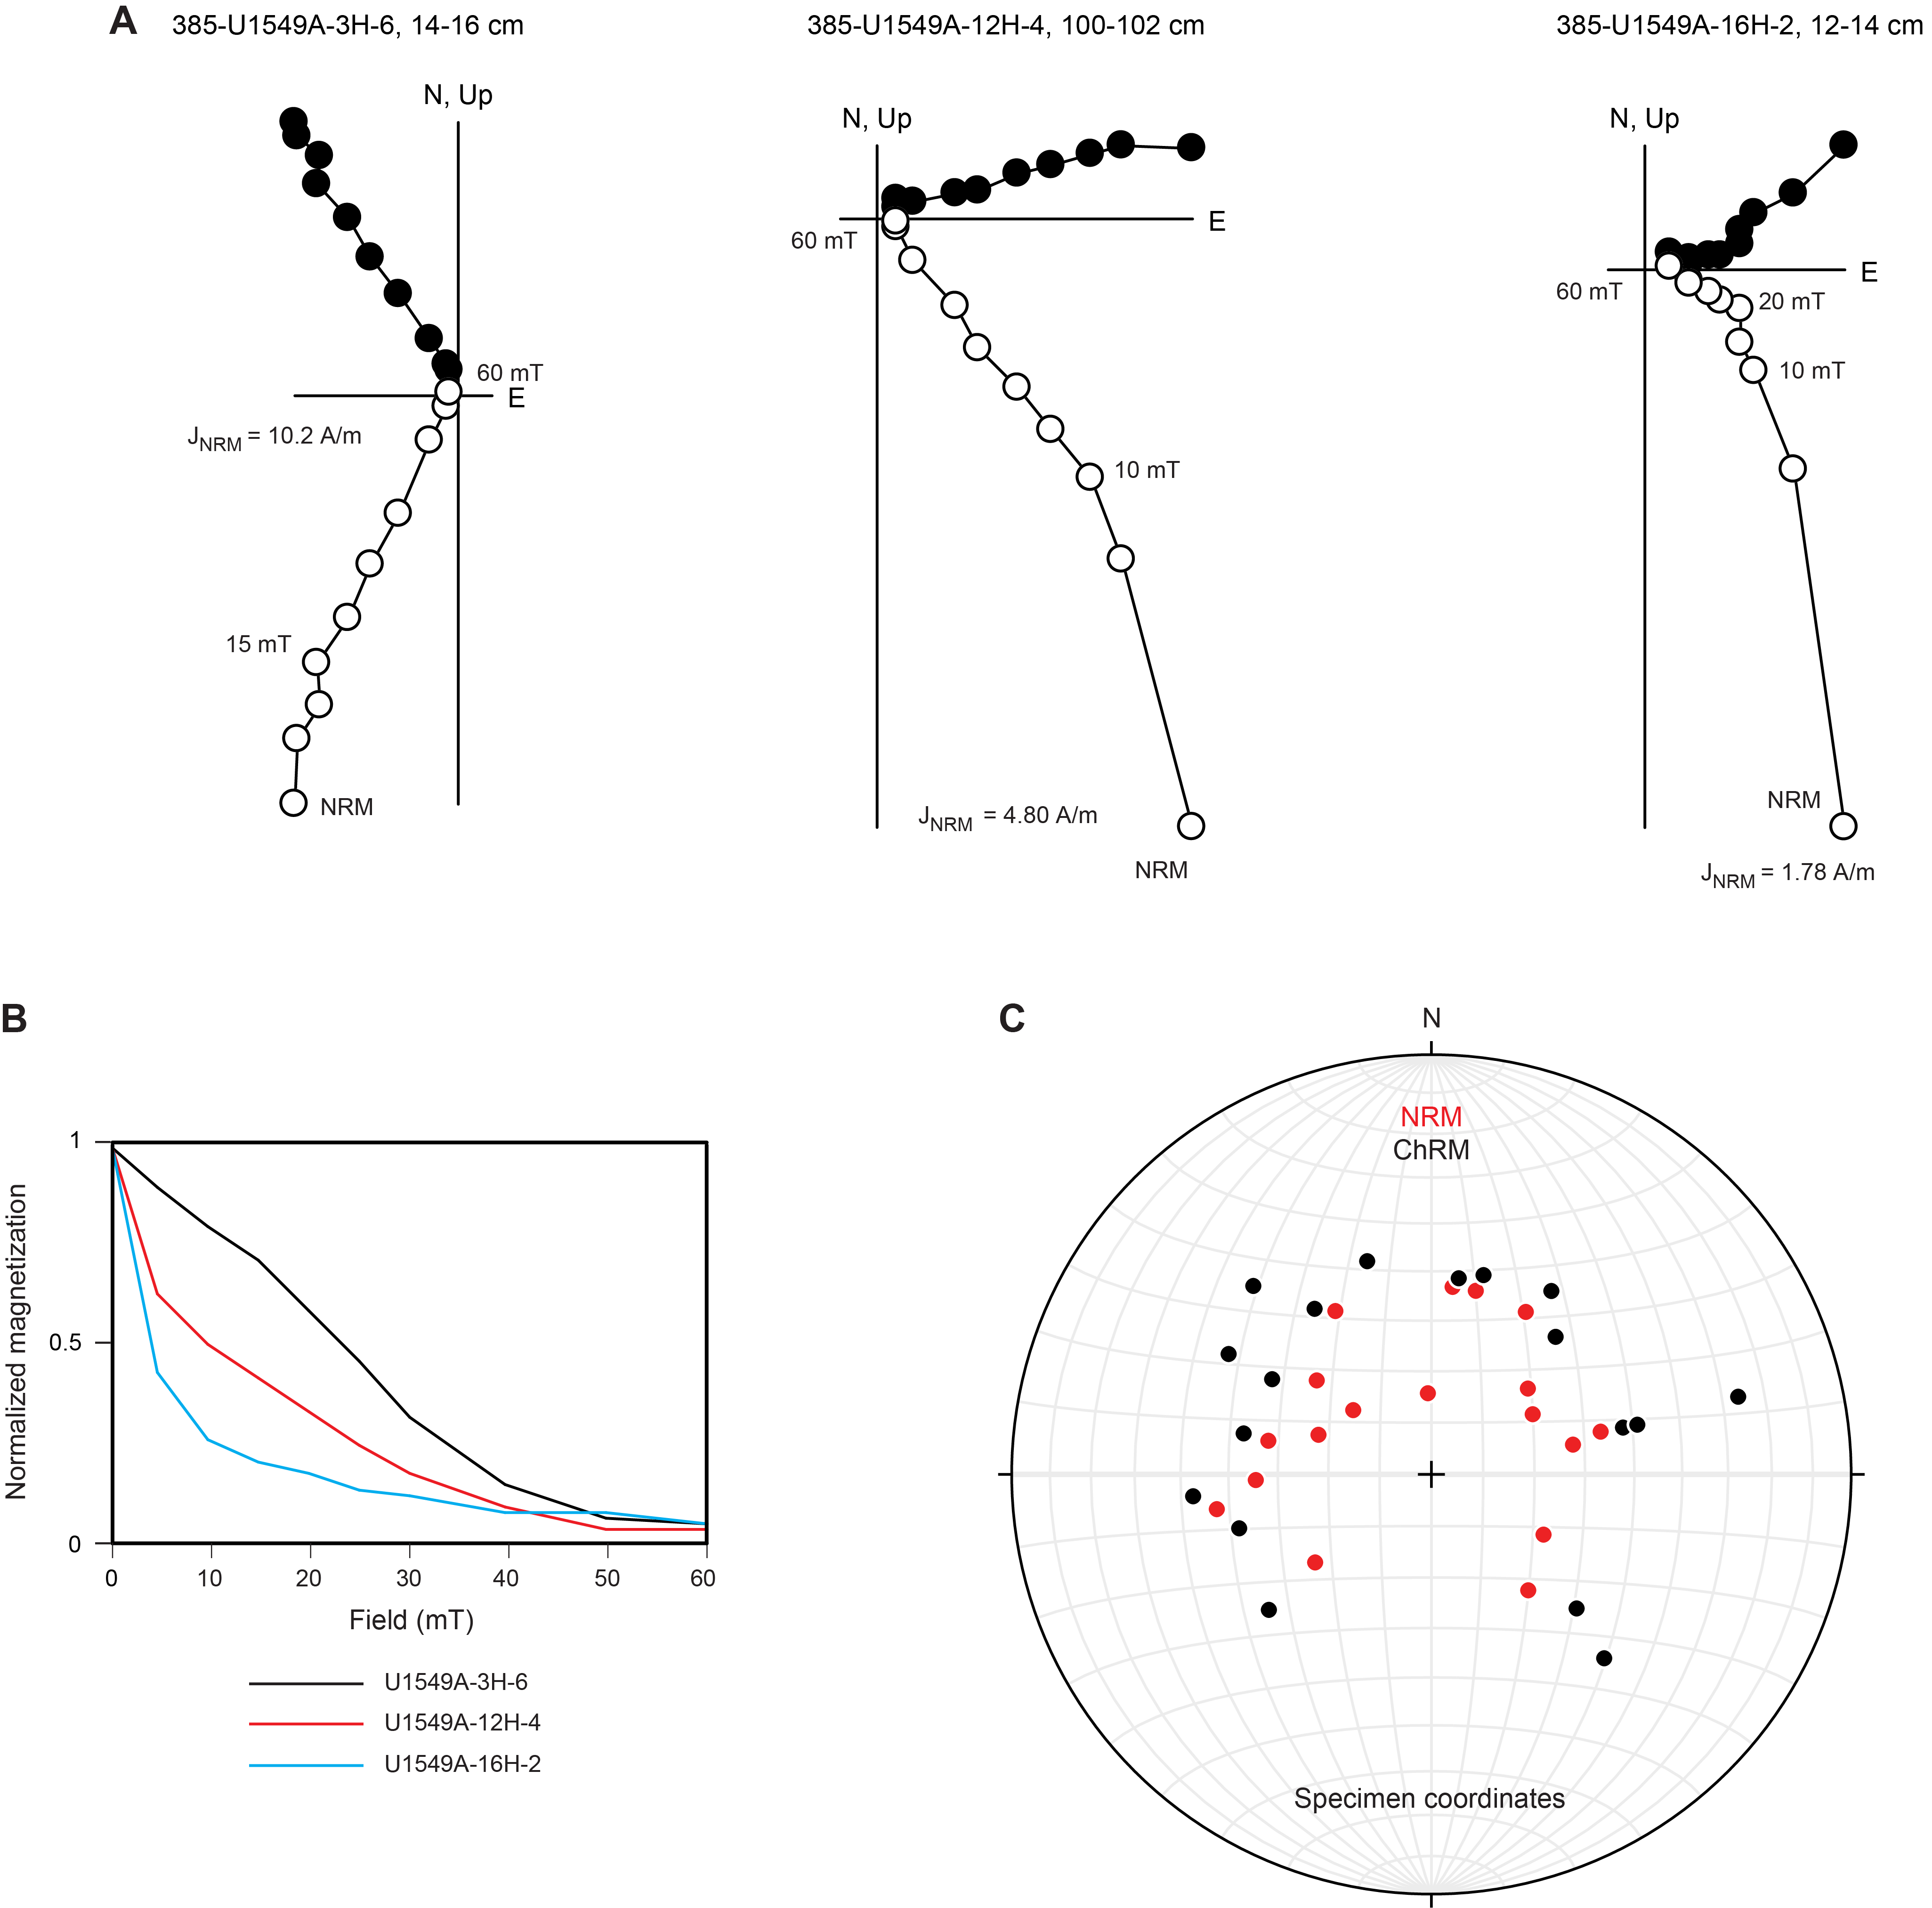
The distributions of the inclinations of the NRM and ChRM of all discrete samples are shown in Figure F12C. The NRM inclinations range from 46.8° to 74.0° with a mean inclination of 60.0° (Figure F12C). After principal component analysis, a mean inclination for the ChRM was calculated using the maximum likelihood method of Arason and Levi (2010) (Table T8). The calculated mean inclination for the ChRM results is 47.08°, which is close to the GAD inclination expected at this location (~46.1°).
6.3. Anisotropy of magnetic susceptibility
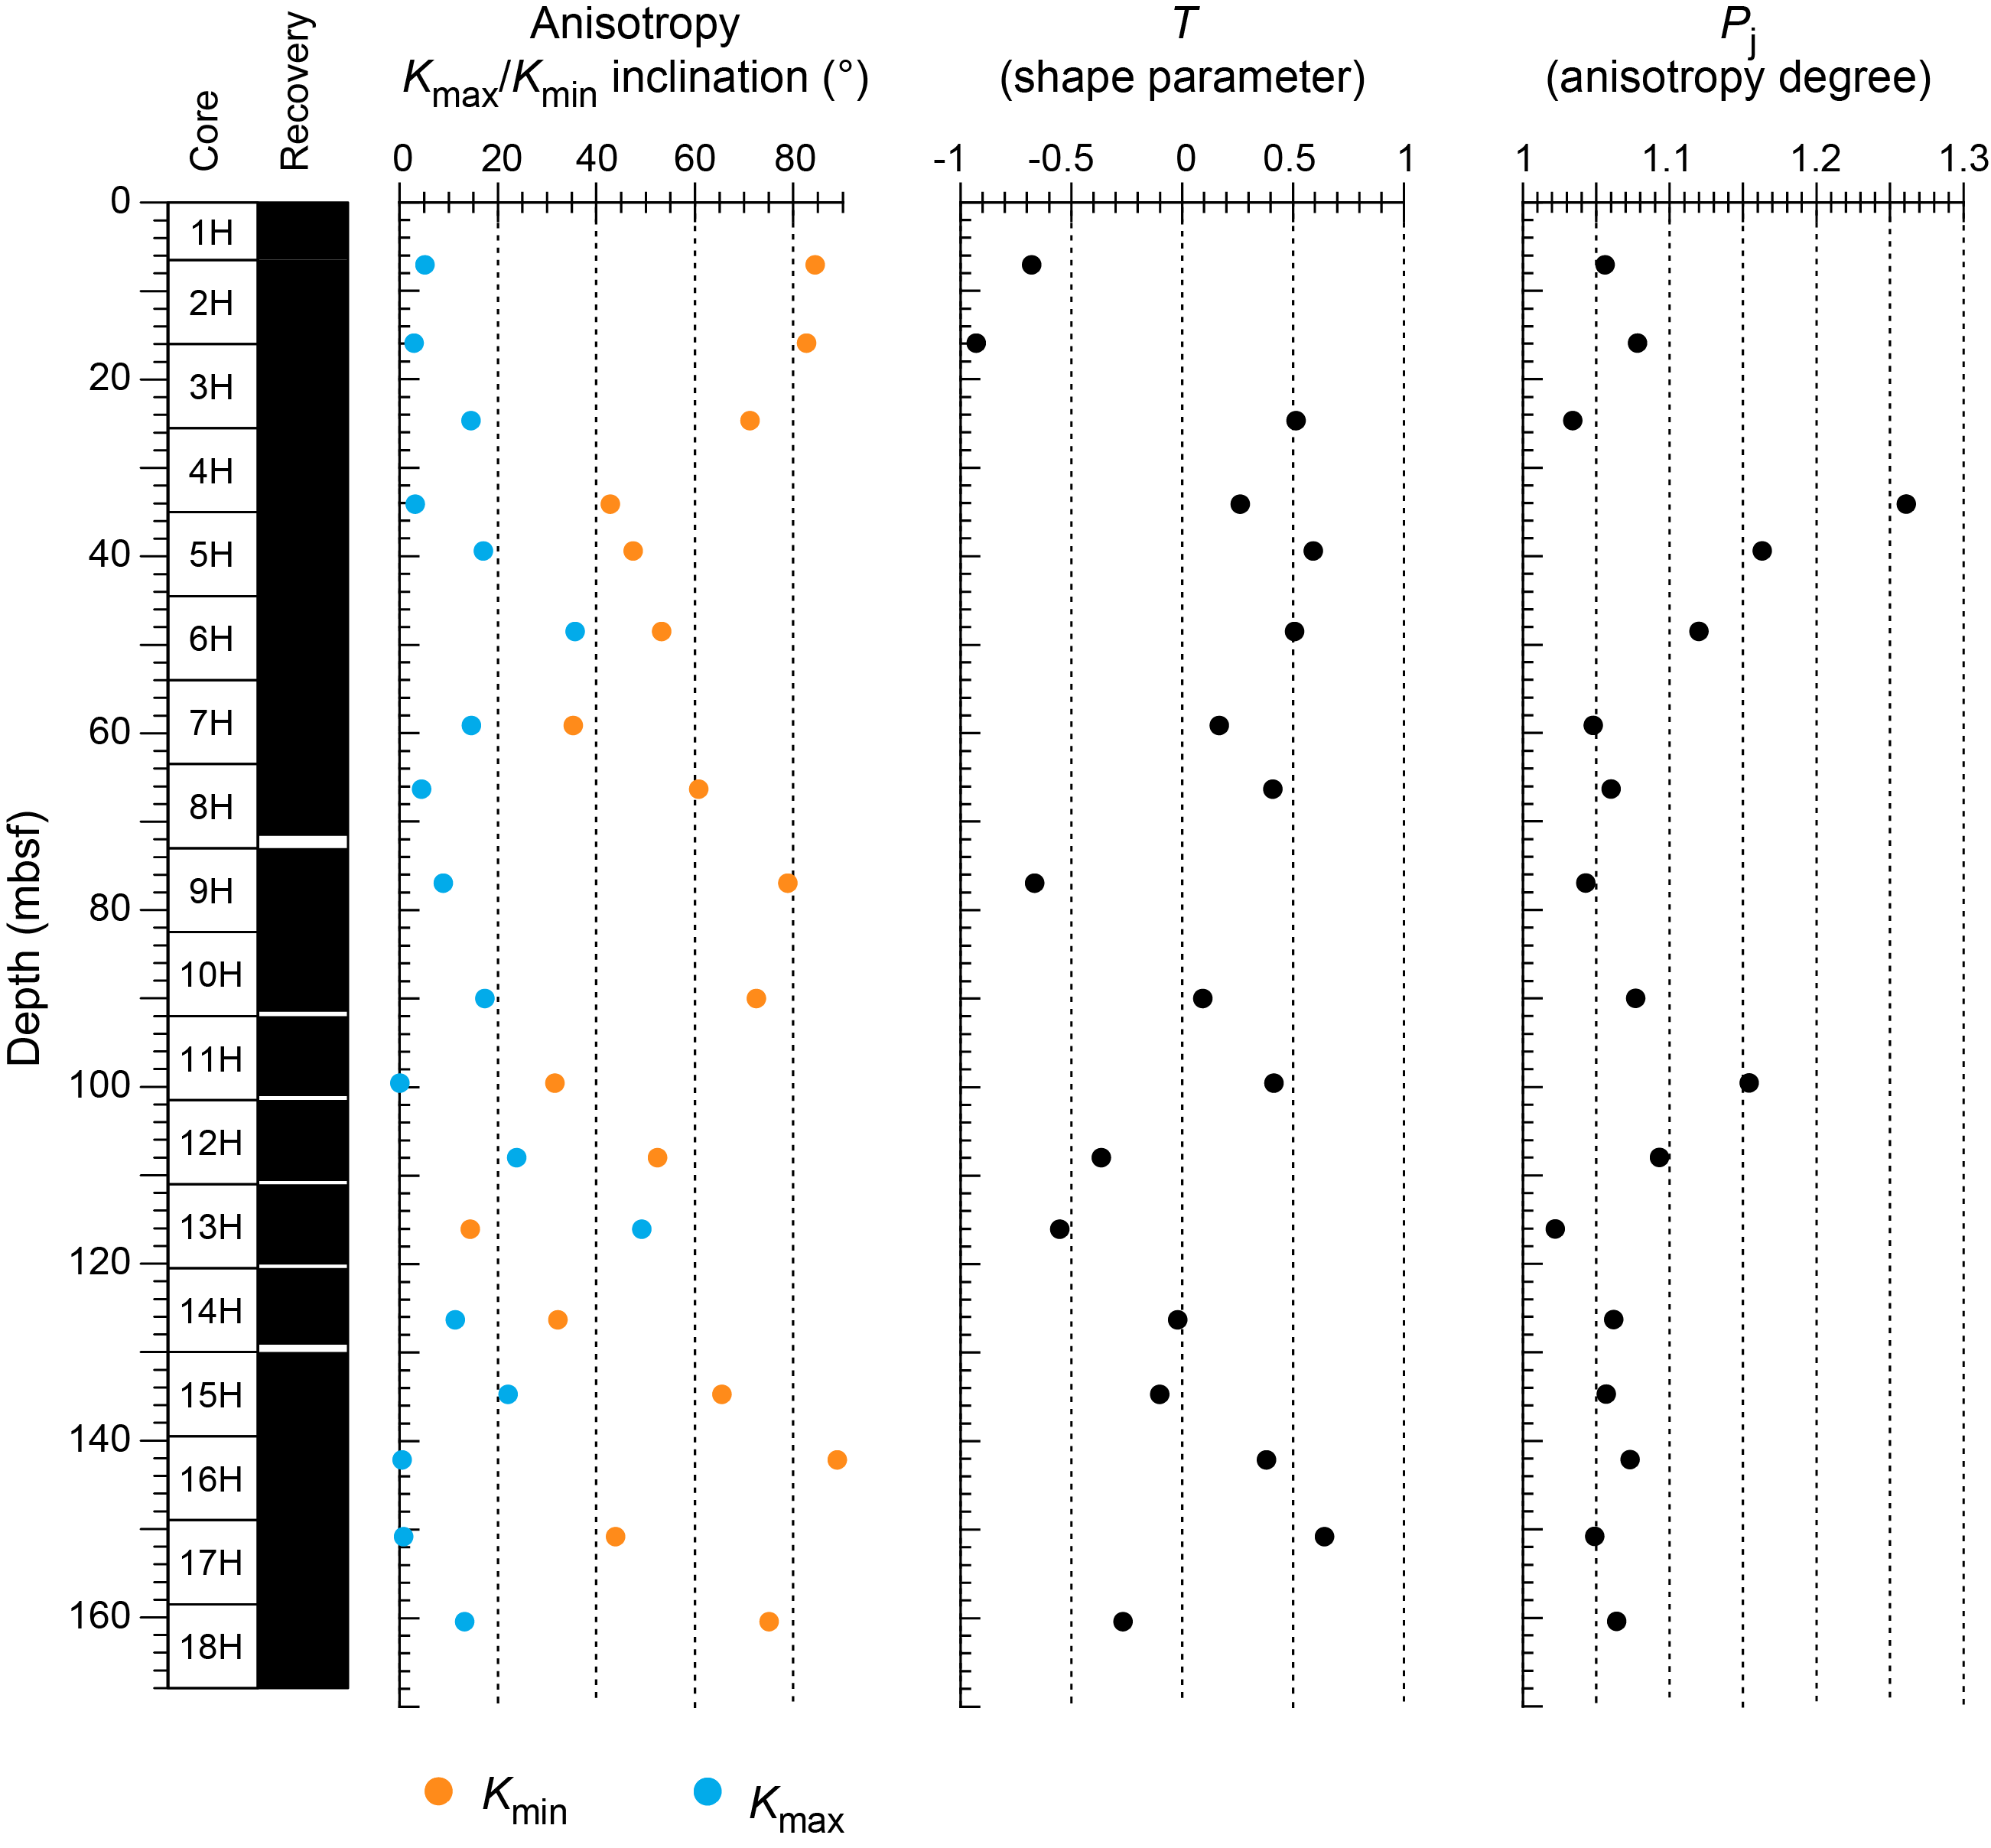
Anisotropy of magnetic susceptibility was measured for all discrete samples from Site U1549 prior to demagnetization to characterize the magnetic fabrics present in the samples. Results for the sediments of Hole U1549A are shown in Figure F13 in the core reference frame. Because these results are unoriented, it is not possible to determine whether there is a preferred magnetic lineation in these rocks; therefore, only the inclination of the anisotropy is taken into account. Sedimentary samples obtained from Hole U1549A show a mixture of prolate and oblate behavior downhole; Kmax (maximum) principal axes are predominantly distributed in the horizontal plane, and Kmin (minimum) principal axes are oriented perpendicular to the sedimentary bedding.
6.4. Magnetostratigraphy
We used the SRM measurements on archive-half sections to determine the polarity at Site U1549. We based our interpretation of the magnetic polarity on the sign of inclination at the maximum AF demagnetization step (20 mT) (Figure F11B). All cores show a positive inclination of ~46°. This is supported by detailed discrete sample analysis (Table T7). Therefore, we assigned the cores to the normal Brunhes Chron (C1n; <0.78 Ma), which is congruent with the biostratigraphic observations (see Biostratigraphy). No magnetic excursions during Chron C1n were observed, although previously published paleomagnetic results from DSDP Leg 64 Site 480 identified the Mono Lake and Laschamp magnetic polarity excursions at ~29–26 ky before present (BP) and ~51–49 ky BP, respectively (Levi and Karlin, 1989).
7. Inorganic geochemistry
7.1. Interstitial water sampling
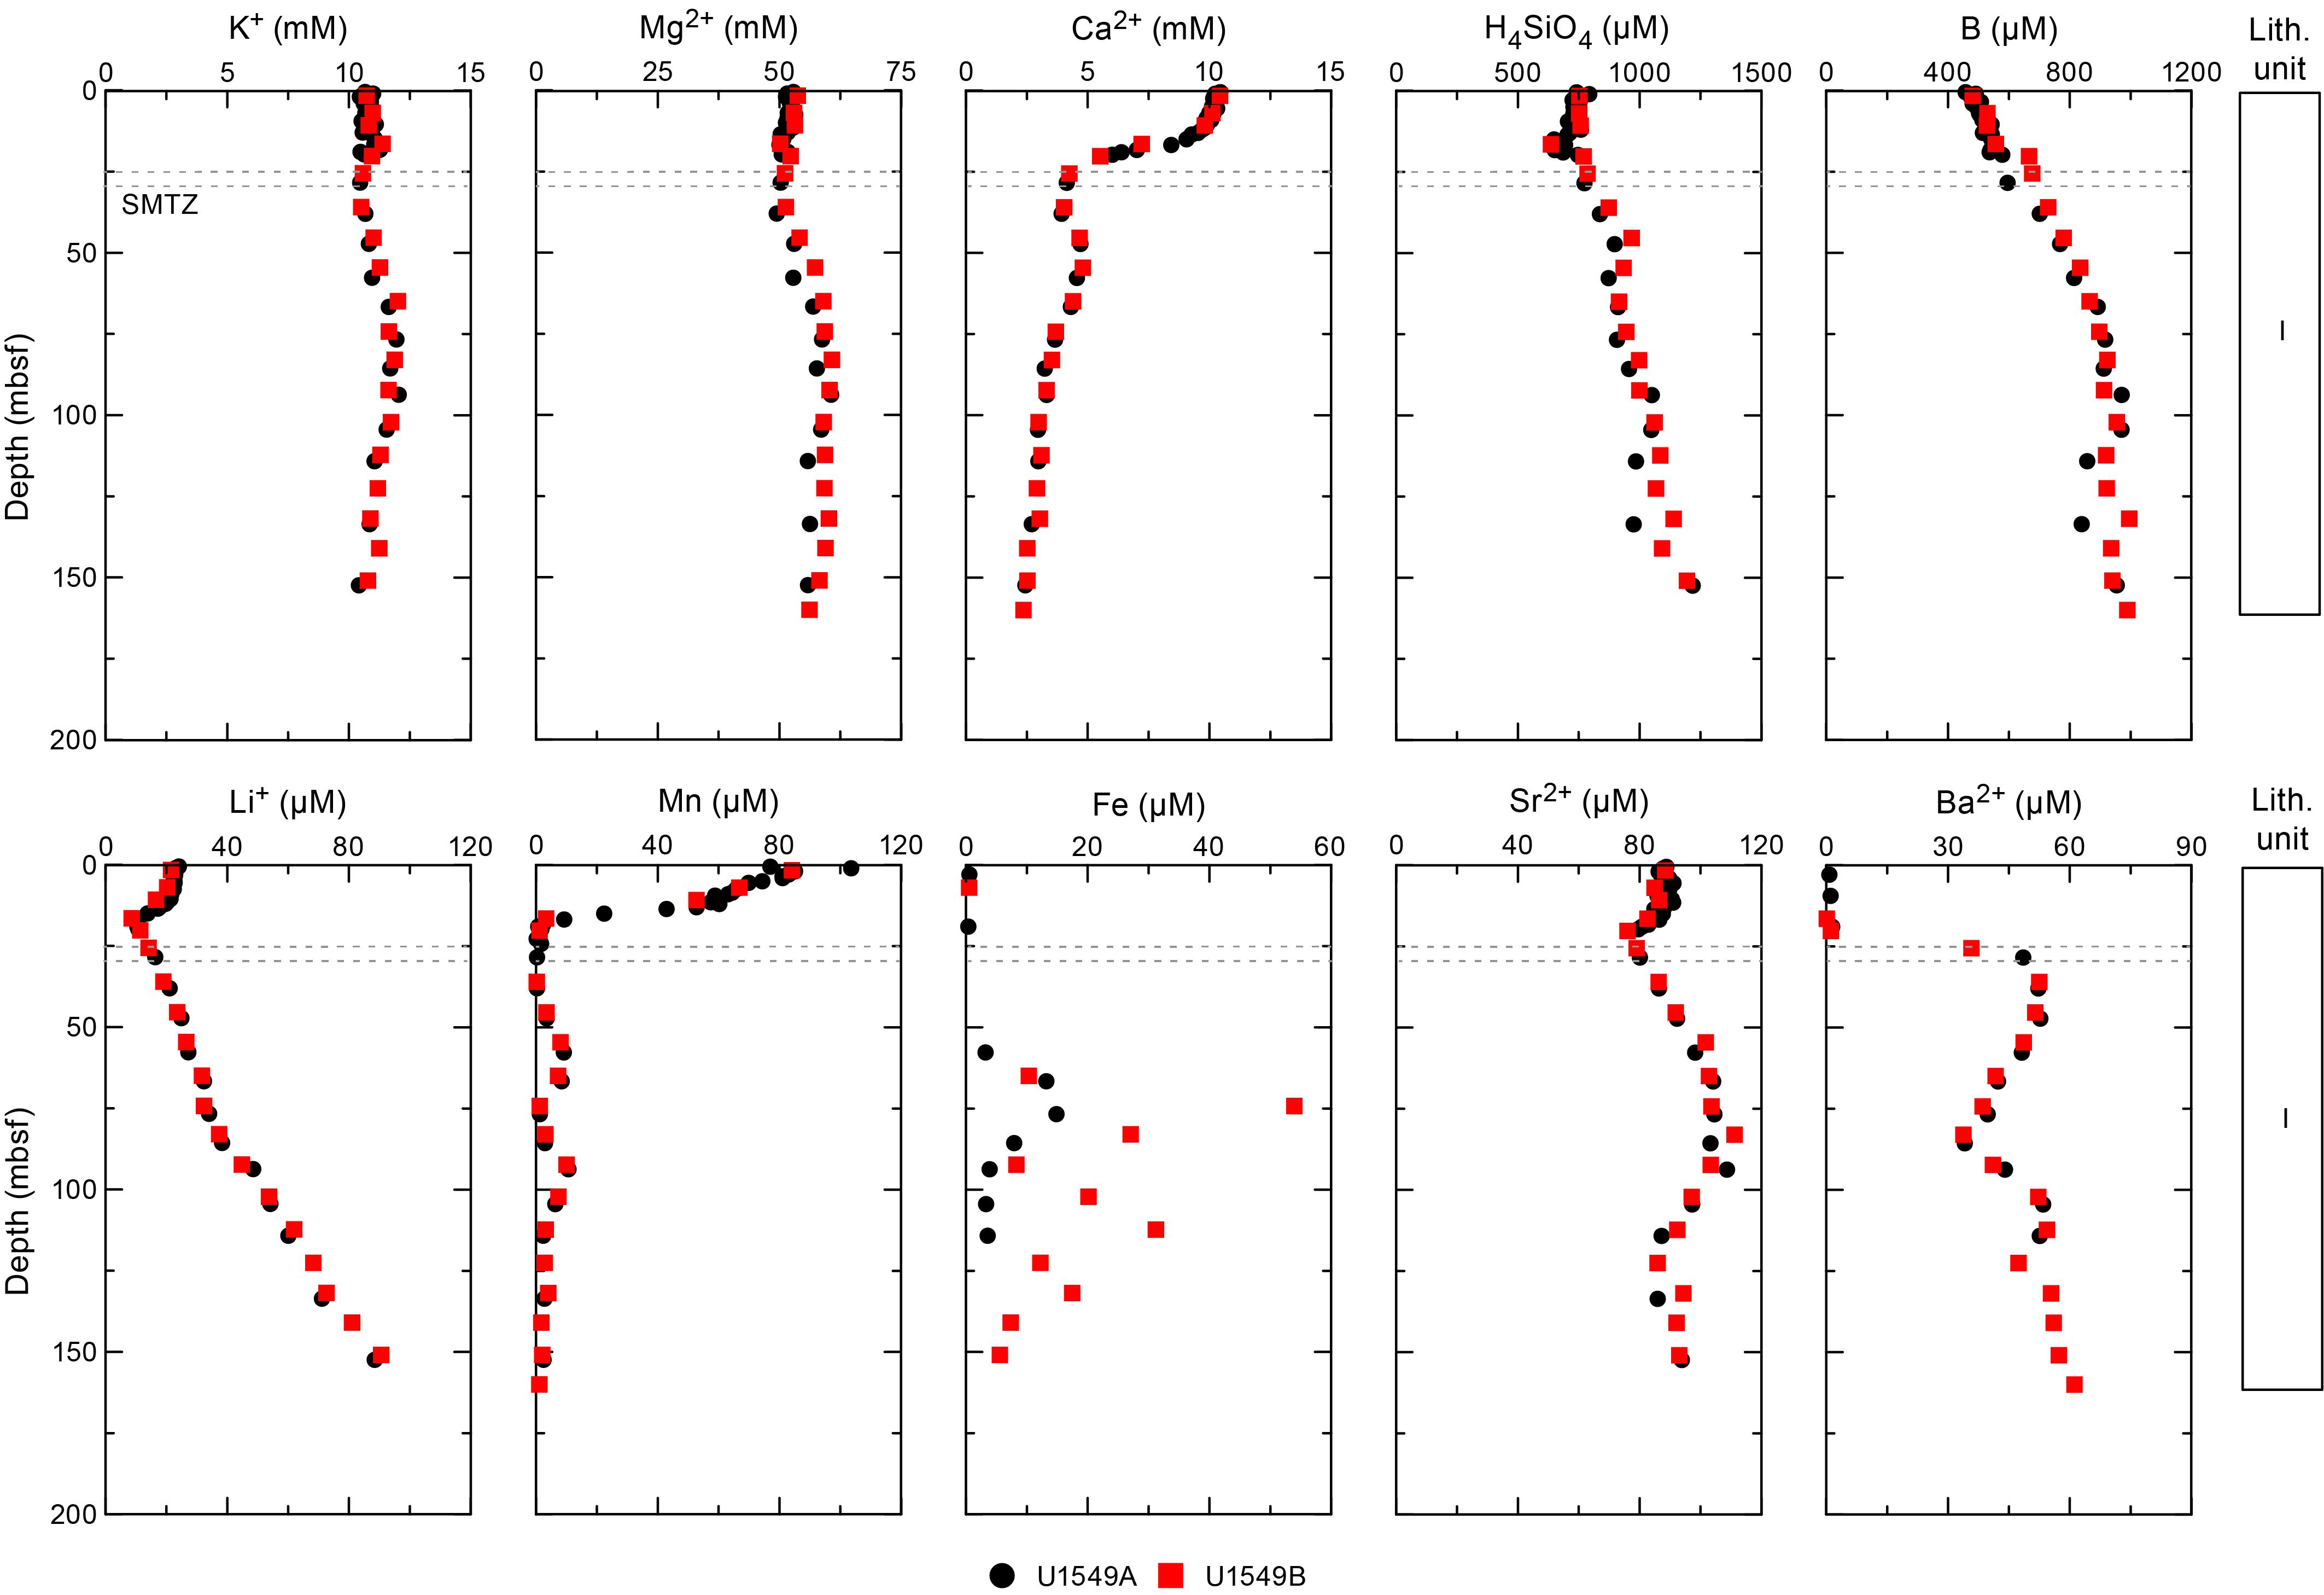
Samples were prepared and squeezed under laboratory atmosphere. A total of 30 IW samples using Rhizon samplers were collected at 0.5 m intervals from the seafloor to 15 mbsf and at 1.5 m intervals from 16.8 to 29.3 mbsf in Hole U1549A (Table T9). This sampling was limited to the first four cores to increase the resolution and to understand chemical processes at shallow depths. Mudline water was collected from Hole U1549A. The chemical composition of the IW and mudline water is listed in Table T9. All downhole profiles of element concentrations are presented in Figure F14.

7.2. Interstitial water results
7.2.1. pH, salinity, chloride, and sodium
pH values show a maximum of 8.2 between the seafloor and 35 mbsf and gradually decrease to 7.7 at the bottom of Holes U1549A and U1549B. Salinity has a constant value (34–35) from the seafloor to 50 mbsf, which is similar to the mudline water (35) from Hole U1549A. However, it sharply increases to 37–38 below 50 mbsf and retains these values downhole. Chloride (Cl−) concentration generally increases with depth and varies between 549 and 571 mM. Sodium (Na+) concentration shows an increasing trend with depth and varies between 455 and 513 mM.
7.2.2. Sulfate, sulfide, alkalinity, ammonium, phosphate, and bromide
Sulfate (SO42−) concentration decreases from 28 to <1 mM in the upper 30 m, and below this depth it remains <0.5 mM in Holes U1549A and U1549B. The curved shape of the profile is well resolved by the Rhizon sampling. Methane concentrations increase markedly around 30 mbsf (>1.2 mM) (see Organic geochemistry). Therefore, the SMTZ is estimated to be around 30 mbsf at this site (Figure F14).
Sulfide concentration (ΣH2S = S2 + HS− + H2S) exhibits two maxima: at 10 mbsf (1.5 mM) and 27–28 mbsf (5.1–5.8 mM). The lower interval exhibiting the maximum sulfide concentration is consistent with the SMTZ.
Alkalinity linearly increases from the seafloor to 19 mbsf (r2 = 0.94) and then approaches a maximum concentration of 84 mM around 100 mbsf before alkalinity slightly decreases to 70 mM at 161 mbsf (Figure F14). Around the SMTZ, alkalinity increases quickly by approximately 3 mM/m between 19 and 29 mbsf in Hole U1549A and between 16 and 20 mbsf in Hole U1549B. During early organic matter diagenesis, sulfate reduction and anaerobic oxidation of methane consume sulfate and generate alkalinity as well as releasing sulfide and phosphate. Below the SMTZ, organic matter is consumed through fermentative degradation that contributes to alkalinity; methanogenesis with different methanogenic substrates does not produce alkalinity (Wallmann et al., 2008).
Ammonium (NH4+) concentration increases linearly from the seafloor to 1.9 mM around 15 mbsf and then increases further to 14 mM at 55 mbsf. Below this depth, concentration ranges from 10 to 17 mM.
Phosphate (PO43−) concentration exhibits two maxima at Site U1549: 356 µM at 45 mbsf and 412 µM at 84 mbsf (Hole U1549B). Similar phosphate maxima were also found at Site U1550, particularly in Hole U1550A (see Inorganic geochemistry in the Site U1550 chapter [Teske et al., 2021e]).
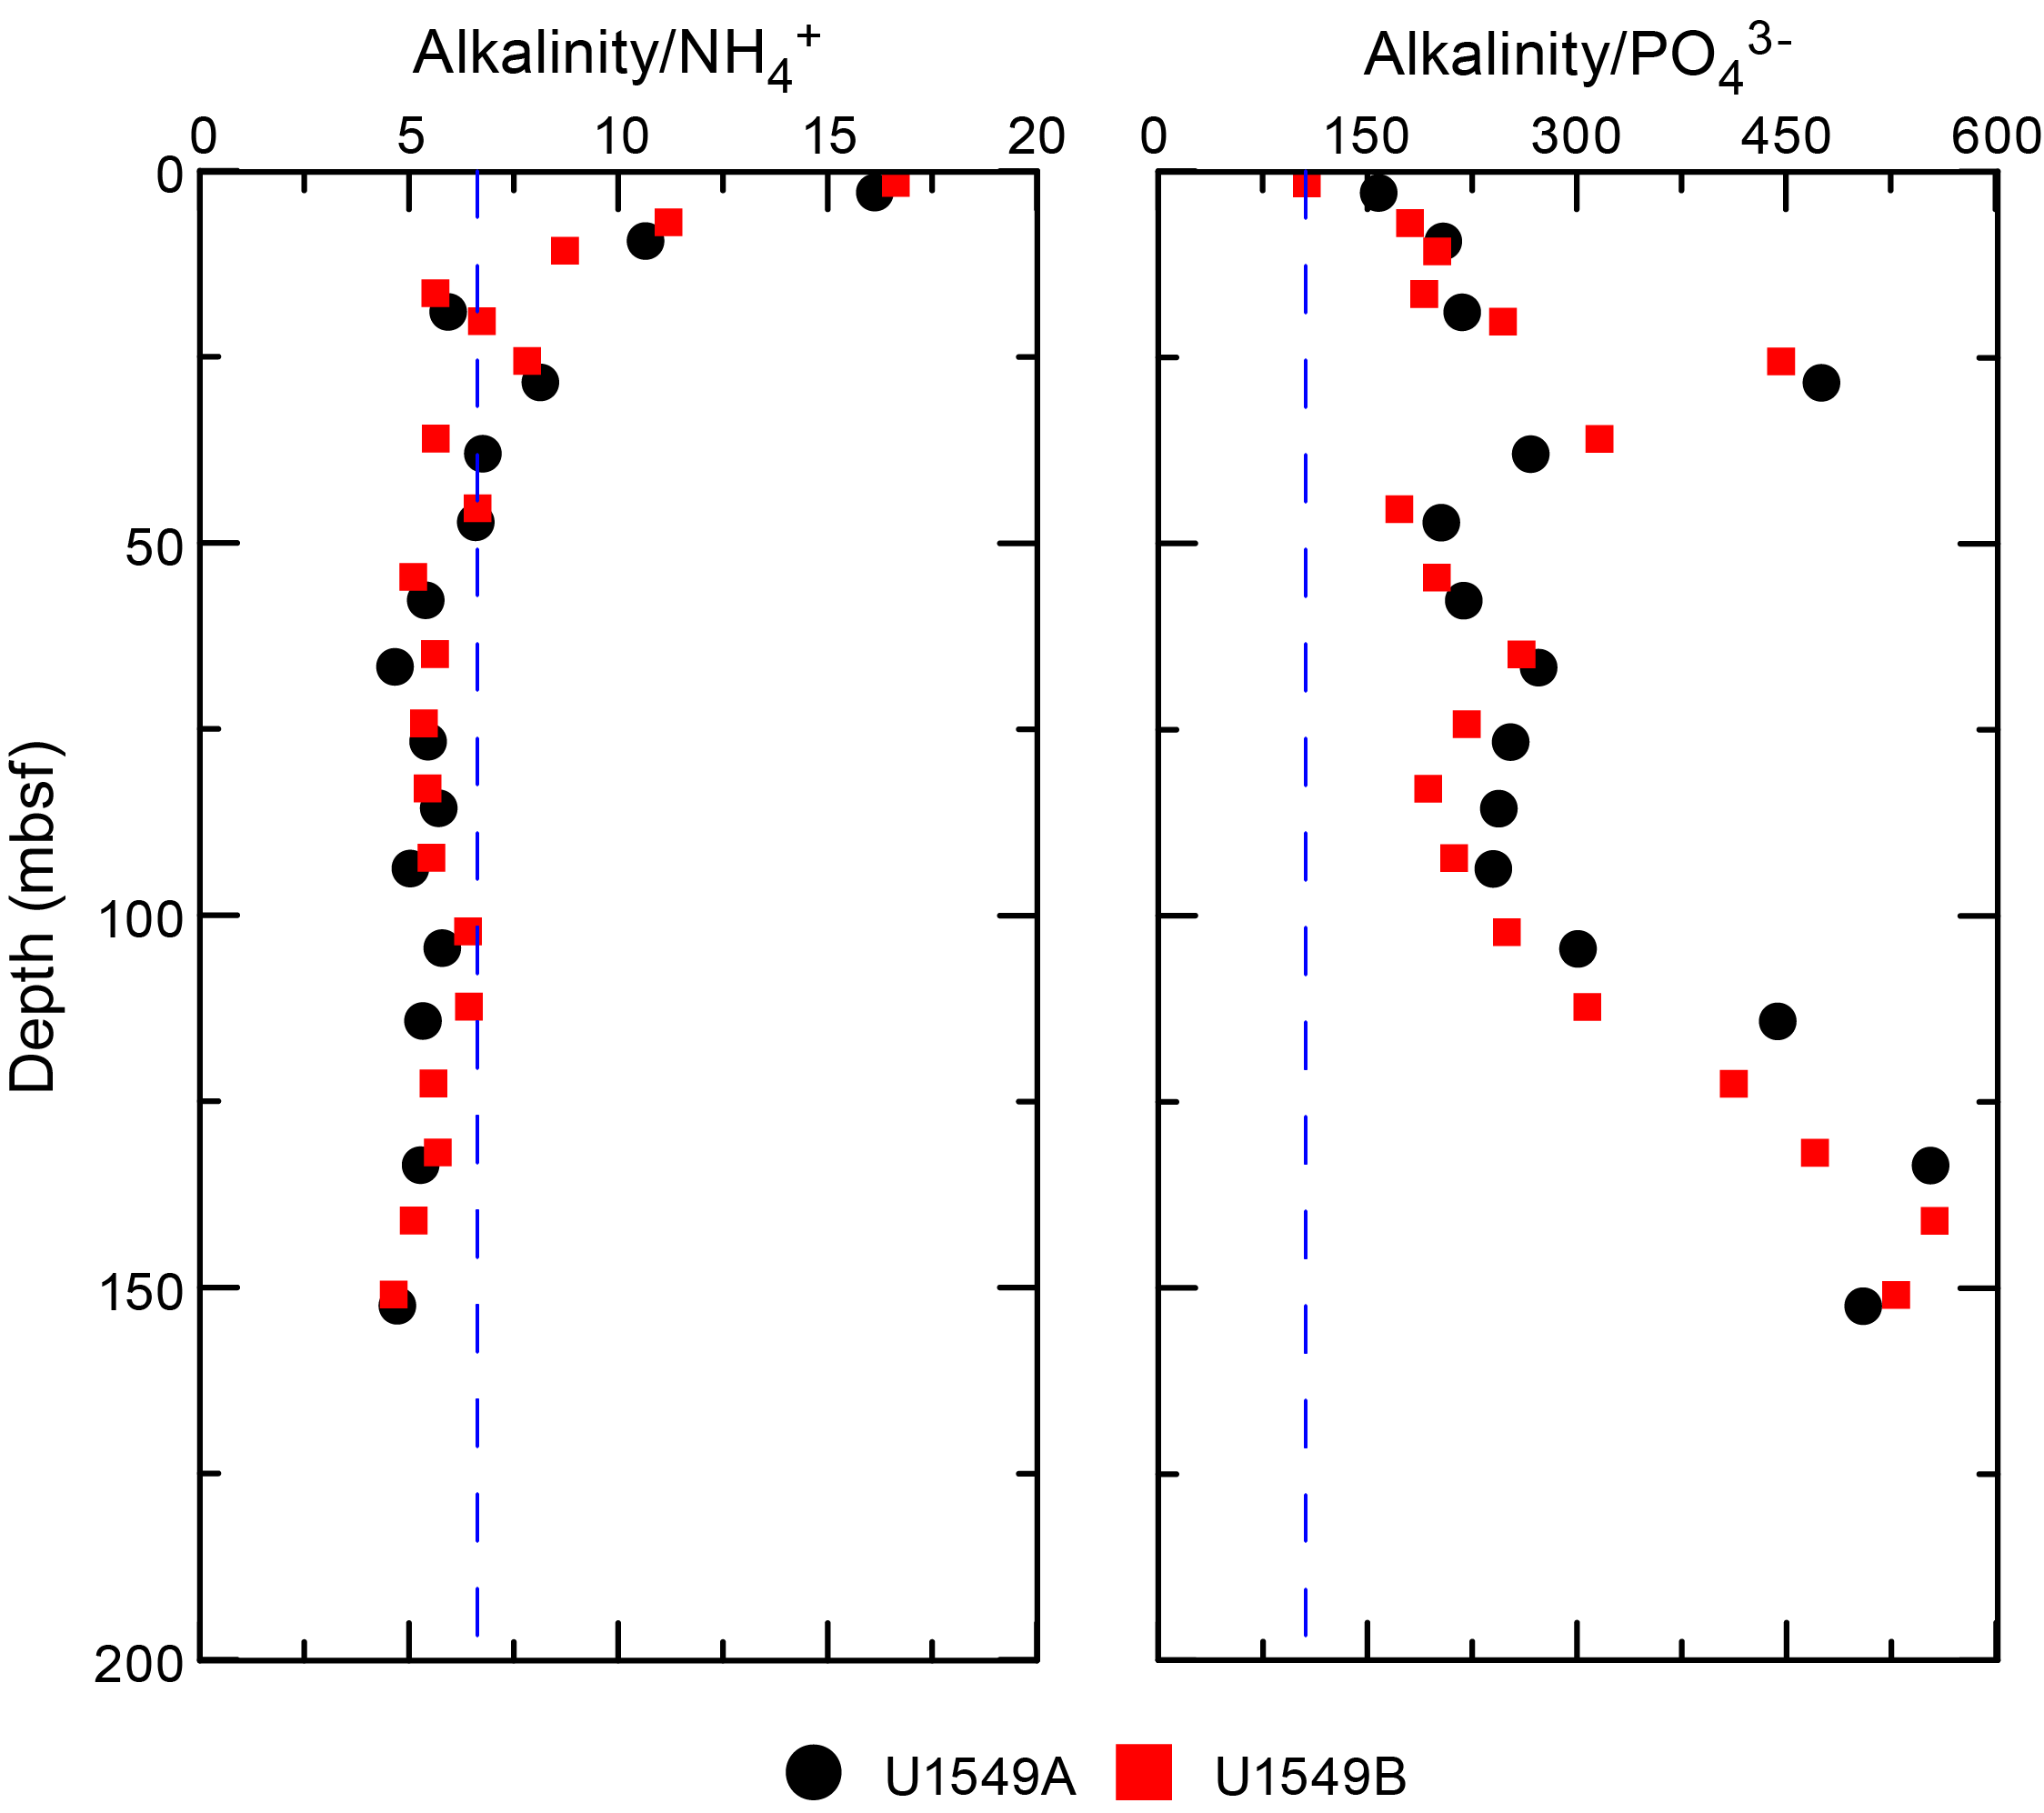
The chemical composition of marine organic matter is characterized by an atomic C:N:P ratio of 106:16:1, commonly referred to as the Redfield ratio (e.g., Burdige, 2006). At Site U1549, most ratios of alkalinity to ammonium (alkalinity/NH4+) range between 4.7 and 8.1 (Figure F15) and are close to the Redfield ratio (C/N = 6.6), suggesting that the ammonium increase is strongly related to organic matter mineralization. Ratios of alkalinity to phosphate (alkalinity/PO43−) range between 200 and 500 (Redfield C/P = 106), and they generally show an increasing downhole trend below 80 mbsf (Figure F15). Phosphate produced by organic matter mineralization is likely to precipitate within the sediment column; extensive phosphate mineral precipitation in marine sediments occurs in extremely eutrophic upwelling areas on continental margins (Schulz and Schulz, 2005).
Bromide (Br−) concentration steadily increases from 0.85 to 1.18 mM from the seafloor to ~120 mbsf and then slightly decreases with depth (Figure F14). This profile reflects Br− release during organic matter mineralization (Tomaru et al., 2007).
7.2.3. Calcium, magnesium, potassium, and silica
Dissolved calcium (Ca2+) concentration varies within a narrow range (10–11 mM) from the seafloor to 10 mbsf and decreases below this depth to 5 mM at 29 mbsf. This trend within the sulfate reduction zone is generally caused by carbonate precipitation (2HCO3− + Ca2+ = CaCO3 + H2O + CO2), although preliminary inorganic carbon data in solid phase show a low carbonate content between 0 and 7% with only a few excursions (see Organic geochemistry). Below 29 mbsf, Ca2+ concentration slowly decreases to 2.7 mM at the bottom of Hole U1549B.
Dissolved magnesium (Mg2+) concentration varies within a narrow range (52–55 mM) from the seafloor to 25 mbsf and then steadily increases to a maximum of 65 mM near 80 mbsf. The maximum Mg2+ concentration of 65 mM is higher than the seawater concentration (53.5 mM) of the mudline water in Hole U1549A. Enriched Mg2+ concentrations were also measured in the Ulleung Basin (71 mM) and have been attributed to silicate mineral alteration (Kim et al., 2016; Torres et al., 2020).
Dissolved potassium (K+) does not show any distinct trend with depth. Values range between 10 and 12 mM.
Dissolved silica (expressed in solution as H4SiO4) varies within a narrow range (700–790 µM) from the seafloor to 29 mbsf. These concentrations in surficial sediments exceed silica concentration in Guaymas Basin bottom water (Campbell and Gieskes, 1984) by factor 4 or 4.5. Subsequently, dissolved silica concentration generally increases further with depth and reaches a maximum value of around 1345 µM at the bottom of Hole U1549B. This increase may point to dissolution of biogenic opal, such as diatom tests and other siliceous microfossils.
7.2.4. Manganese and iron
Manganese (Mn = Mn2+ + Mn4+) concentration shows accumulation to 20 mbsf, and a maximum value of 104 µM was measured in Hole U1549A (Figure F14). This trend highlights the reduction of manganese oxides during organic matter mineralization in the upper part of the sediment column. Below this interval, Mn concentration usually has low values (<3 µM) except for two intervals (47–76 and 90–105 mbsf) where Mn concentration ranges from 3 to 11 µM.
Iron (Fe = Fe2+ + Fe3+) concentration remains <7 µM downhole to 55 mbsf, reaches maximum values of 15 µM at 75 mbsf in Hole U1549A and 53 µM in Hole U1549B, and decreases to <15 µM farther downhole.
7.2.5. Boron, lithium, strontium, and barium
Boron (B; dissolved as borate; B[OH]4−) gradually increases from 460 to 970 µM in the upper 100 m and then varies between 840 and 990 µM below this depth. From the seafloor to 20 mbsf, lithium (Li+) and strontium (Sr2+) concentrations decrease from 23 to 8 µM and 88 to 76 µM, respectively, in Holes U1549A and U1549B (Figure F14). Concentrations for Li+ and Sr2+ in the mudline water measured in Hole U1549A are 23 µM and 87 µM, respectively. Li+ concentration then continuously increases with depth and reaches 106 µM at the bottom of Hole U1549B. Below 20 mbsf, Sr2+ also increases with depth to 111 µM at 85 mbsf and varies within a narrow range (86–97 µM) farther downhole. Barium (Ba2+) concentration is low (<2 µM) from the seafloor to 20 mbsf and then sharply increases, consistent with the position of the SMTZ where sulfate is consumed and Ba2+ is no longer precipitated. Ba2+ reaches 53 µM around 30 mbsf and starts decreasing to values around 35 µM at 85 mbsf. Below 85 mbsf, Ba2+ increases gradually to 61 µM at the bottom of Hole U1549B.
7.3. Concluding remarks
As evidenced by nearly complete sulfate depletion coinciding with a concentration peak for dissolved sulfide (5.8 mM), the SMTZ is located around 25–30 mbsf at Site U1549 (Figure F14). The downhole pore water profiles of alkalinity, magnesium, calcium, lithium, strontium, silica, and barium change conspicuously around the SMTZ. Below the SMTZ, alkalinity has a high maximum value (85 mM) and magnesium is found in higher concentration than in seawater (53.5 mM). In addition, the downhole profiles of lithium, boron, and silica generally display an increasing trend with higher values than those of seawater. Hence, the chemical properties of IW are likely to be influenced by organic matter mineralization related to biogeochemical processes as well as sediment-water interactions associated with marine silicate weathering coupled with methanogenesis and mineral precipitation/dissolution processes.
8. Organic geochemistry
At Site U1549, organic geochemists performed sampling and analysis of gas and solid-phase samples. For Hole U1549A, one headspace gas sample was analyzed per 9.5 m core for routine hydrocarbon safety monitoring; void gases were quantified and sampled for hydrocarbon content; and the carbon, nitrogen, and sulfur contents of particulate sediment were characterized. For Hole U1549B, hydrocarbon analyses on headspace gas were performed; H2 and CO contents were measured; carbon, nitrogen, and sulfur contents of sediment were characterized; and a comprehensive suite of gas and sediment samples was taken for postexpedition analyses.
8.1. Solid-phase carbon, nitrogen, and sulfur contents
Solid-phase sediment samples were analyzed to determine the weight percent of CaCO3, total organic carbon (TOC), total nitrogen (TN), and total sulfur (TS). In Holes U1549A and U1549B, sampling frequency was approximately one sample per 9.5 m core (Table T10). In Hole U1549A, the core description team selected samples from primary and secondary sedimentary components, and in Hole U1549B, material was subsampled from the community gas (COMGAS) whole-round core for correlation to other biogeochemical data to be generated during shore-based analyses. Trends observed in Holes U1549A and U1549B are combined for discussion below.
At Site U1549, CaCO3 content varies around ~6 wt% in the primary lithology of diatom ooze (Figure F16) with no discernible trend. Carbonate-rich layers observed at previous sites are absent here because coring operations did not reach the depth of diagenetic changes marked by the occurrence of carbonate nodules and micrite layers (see Lithostratigraphy). TOC values decrease from 3.7 wt% at 3.5 mbsf to values averaging ~2 wt% by ~35 mbsf. TOC values <1 wt% tend to be associated with silty layers (intervals 385-U1549A-2H-5, 130–131 cm, and 6H-7, 30–31 cm). In Hole U1549A, atomic TOC/TN values average 4.8 with no discernible trend with depth. Hole U1549B differs slightly; the average TOC/TN value is 5.4 from 2.8 to 102.8 mbsf. Below this depth, the average value increases to 9.9. The average TOC/TN value at Site U1549 is lower than at previous sites. Although these values can be indicative of marine algal matter as the source of organic carbon (Meyers, 1994), TOC/TN values lower than 6 are rarely observed in the settling material of Guaymas Basin (Thunell, 1998). Moreover, although TN content and TOC are poorly correlated in Holes U1549A and U1549B, the correlation line has a positive intercept at 0.23 wt% TN (not displayed), which indicates the presence of nitrogen in the mineral phase of the low-TOC samples. For these reasons, the TOC/TN value of the low-TOC samples cannot be used for determining the origin of the organic matter.
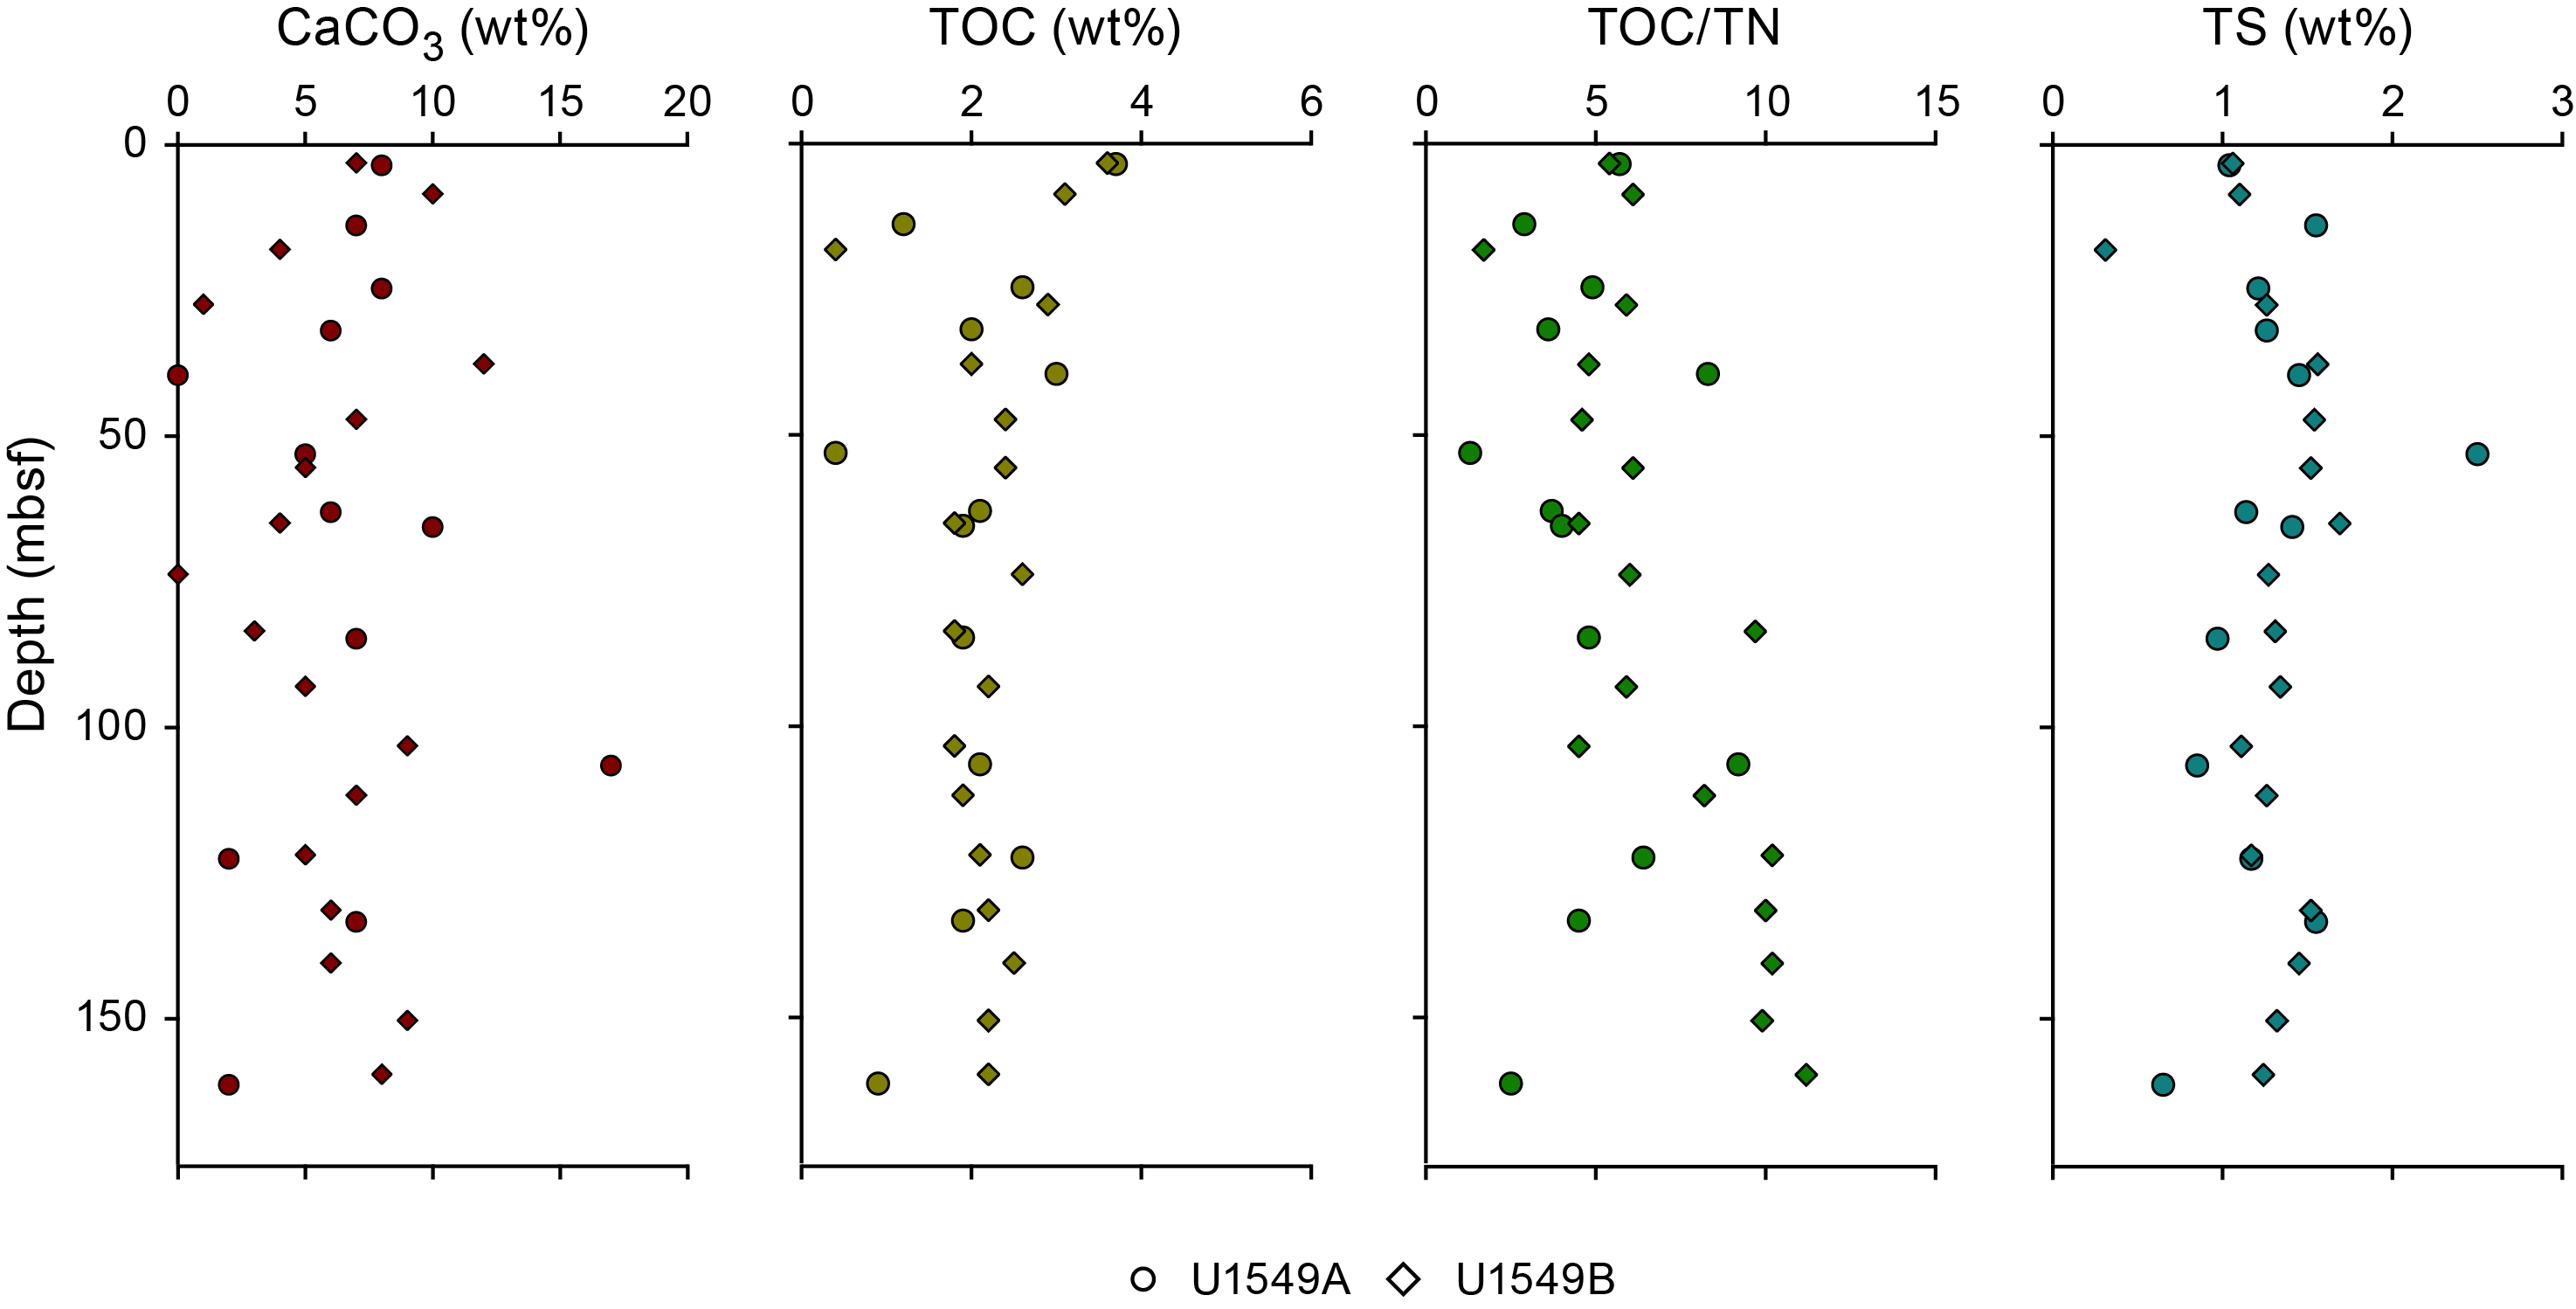
TS content has a value of 1.06 wt% at ~2.8 mbsf, and it slightly increases to values that vary around 1.5 wt% from ~40 to ~65 mbsf. TS content then fluctuates between 0.85 and 1.69 wt% from ~70 to 133 mbsf. Below 133 mbsf, TS content decreases to a value of 0.65 wt% at the bottom of the site. Silt-rich samples collected in Hole U1549A are characterized by higher TS contents than the background sediment, and a minimum TS content of 0.65 wt% is observed in diatom-rich Sample 18H-3, 74–75 cm. TS and TOC are not correlated at this site and show excess sulfur compared to the normal marine trend (Goldhaber and Kaplan, 1974; Berner, 1982) with an average TOC/TS value of 1.8.
8.2. Hydrocarbon gases
Headspace samples were taken from each core to monitor C1–C6 hydrocarbons per the standard safety protocol during drilling (Pimmel and Claypool, 2001). For Holes U1549A and U1549B, 36 headspace samples were analyzed for their parts per million by volume concentration (Table T11) and then corrected by sample weight and porosity to determine the molar concentration of dissolved hydrocarbons (Table T12). Trends observed in Holes U1549A and U1549B are combined for discussion below.
Site U1549 hydrocarbon data are shown in Figure F17. Methane concentrations are below the detection limit to ~25 mbsf. Starting at this depth, methane concentrations sharply increase to a maximum value of 8.82 mM at ~35 mbsf. Methane levels then steadily decrease downhole to ~54 mbsf, and below this depth methane averages ~1.6 mM from ~64 to 85 mbsf. Below this, methane content increases to a local maximum of 5.42 mM at ~104 mbsf, and then values return to an average of ~1.8 mM to the deepest sample recovered at 162.03 mbsf. C2–C6 compounds are below detection limits until the appearance of ethane at ~35 mbsf. In general, all hydrocarbon compounds remain present throughout at the submicromolar to micromolar level. They all smoothly increase to local maxima downhole at slightly different depths for different compounds. Some compounds, such as C2, n-C5, i-C5, and i-C6, have local maxima concurrent with that observed in methane at ~104 mbsf, whereas others, such as C3, n-C4, and i-C4, have maxima at ~74 mbsf. No trend is discernible for n-C6.
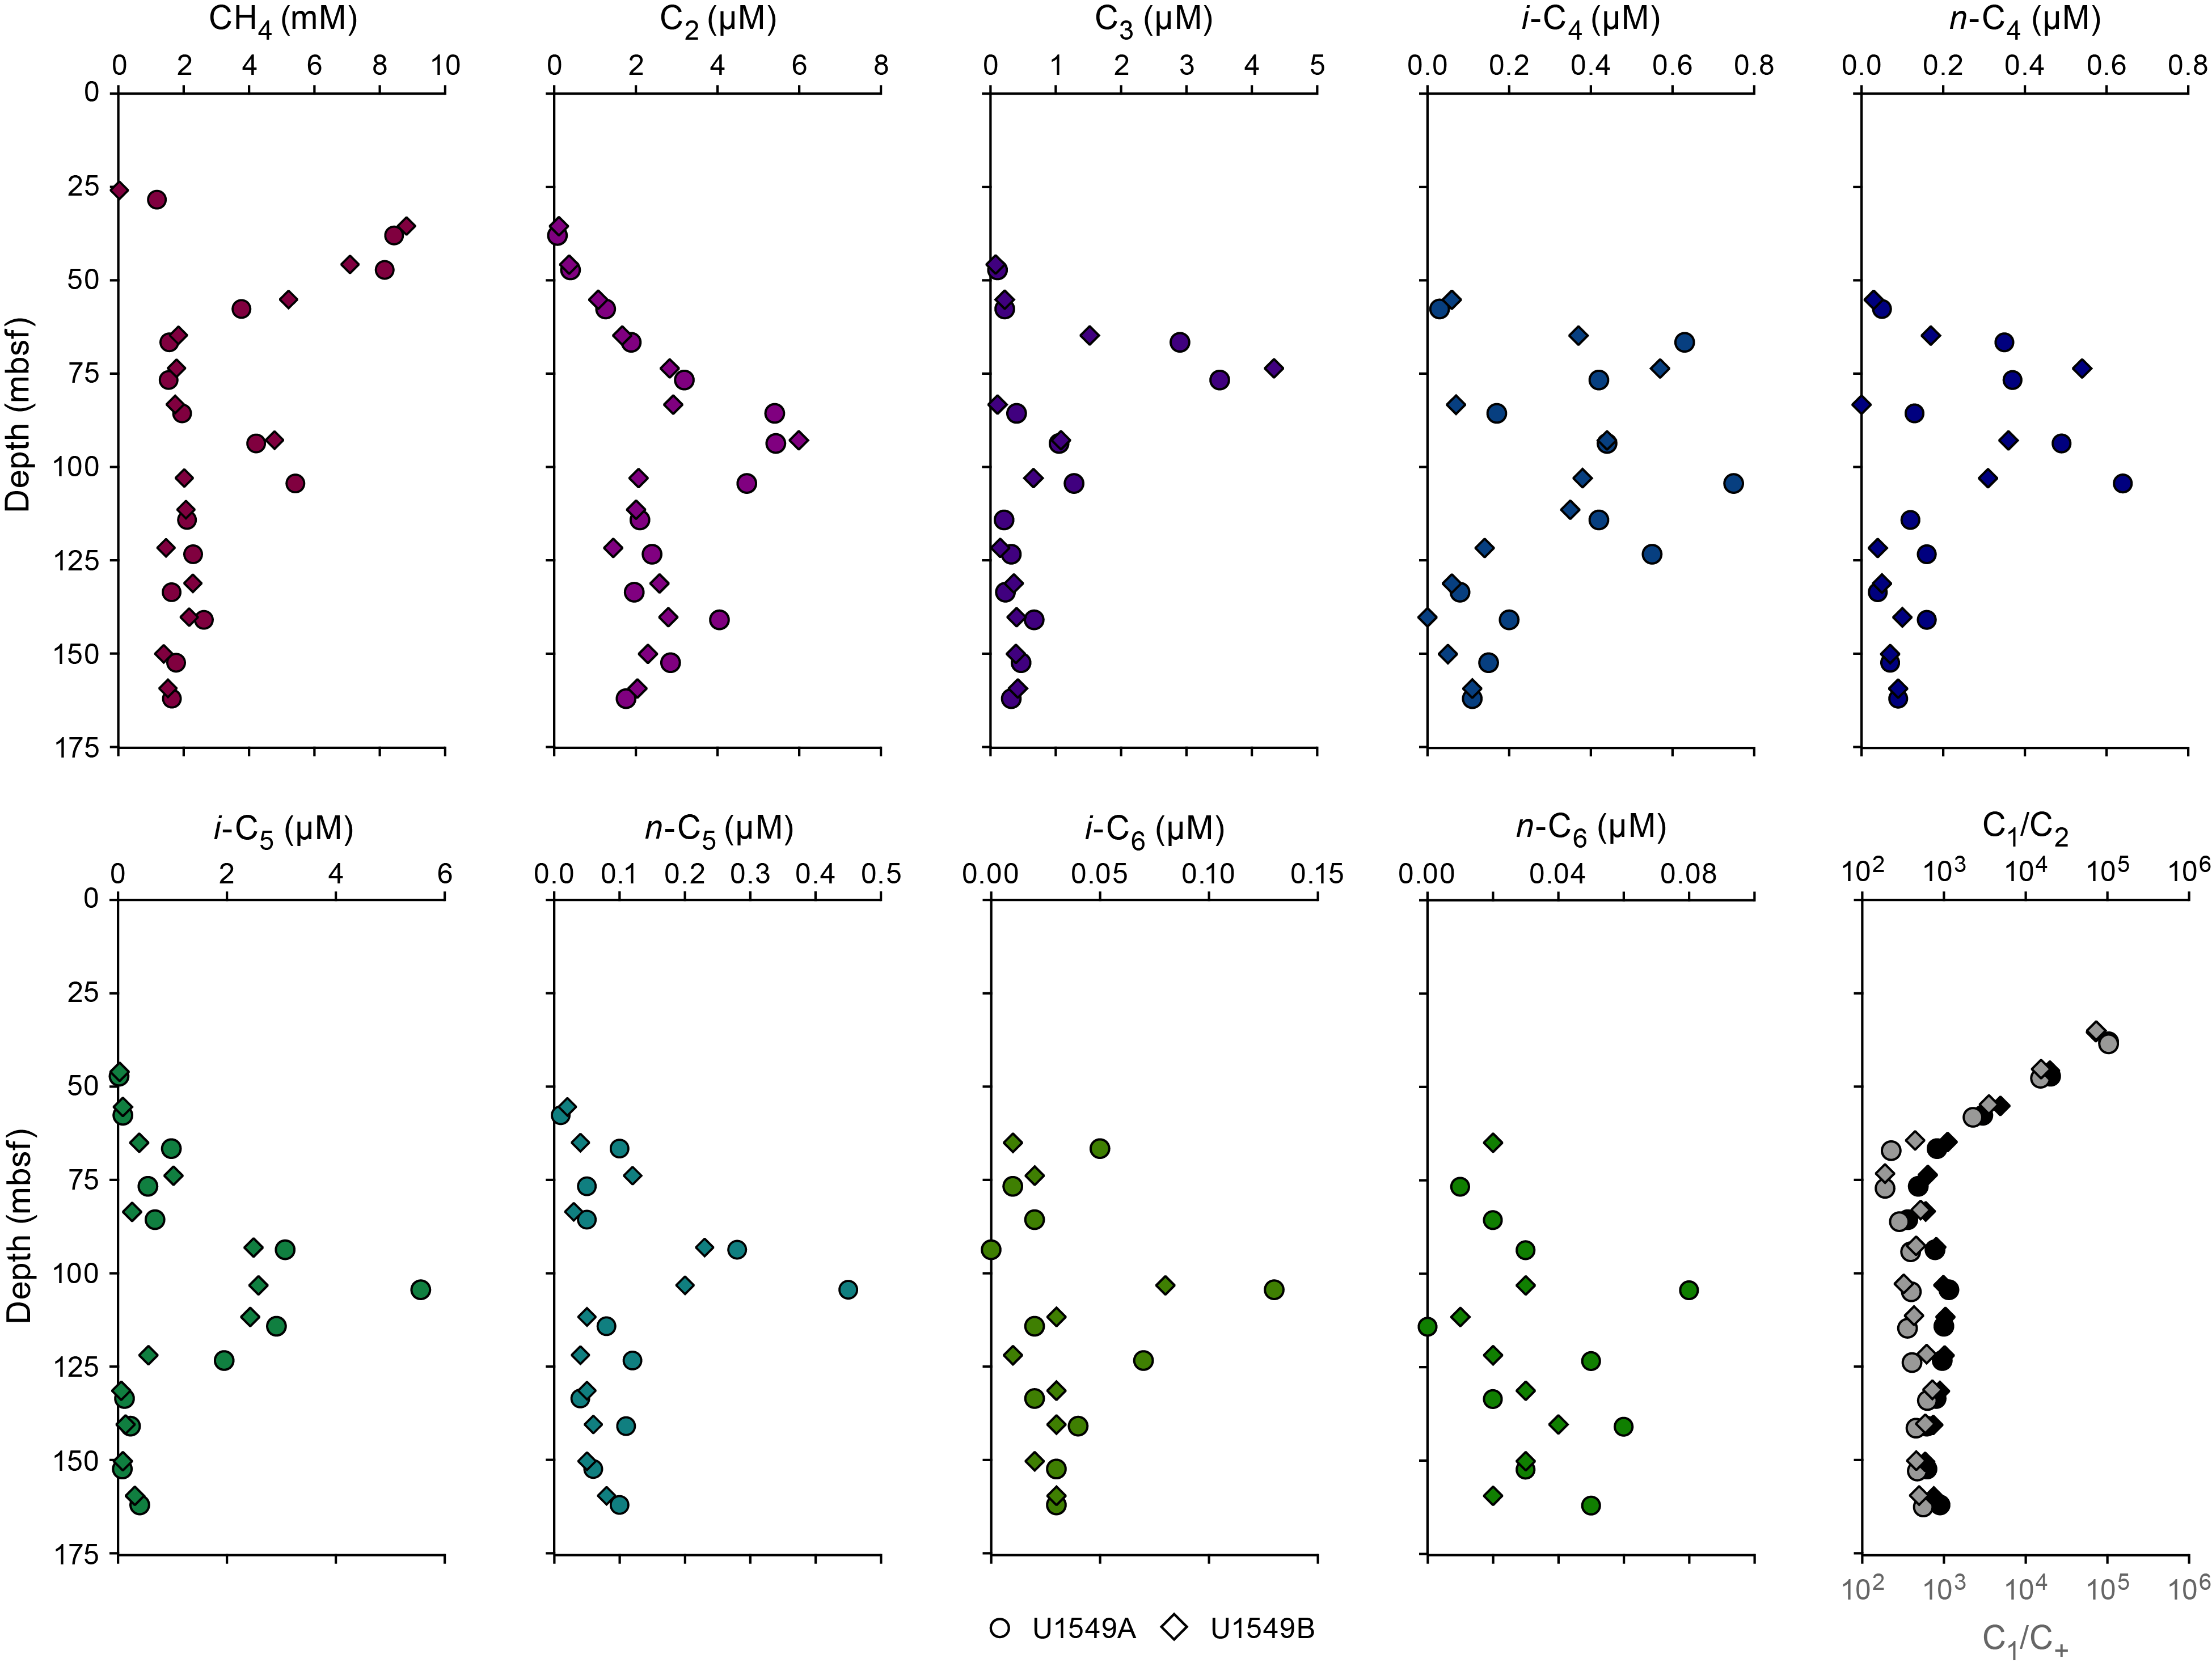
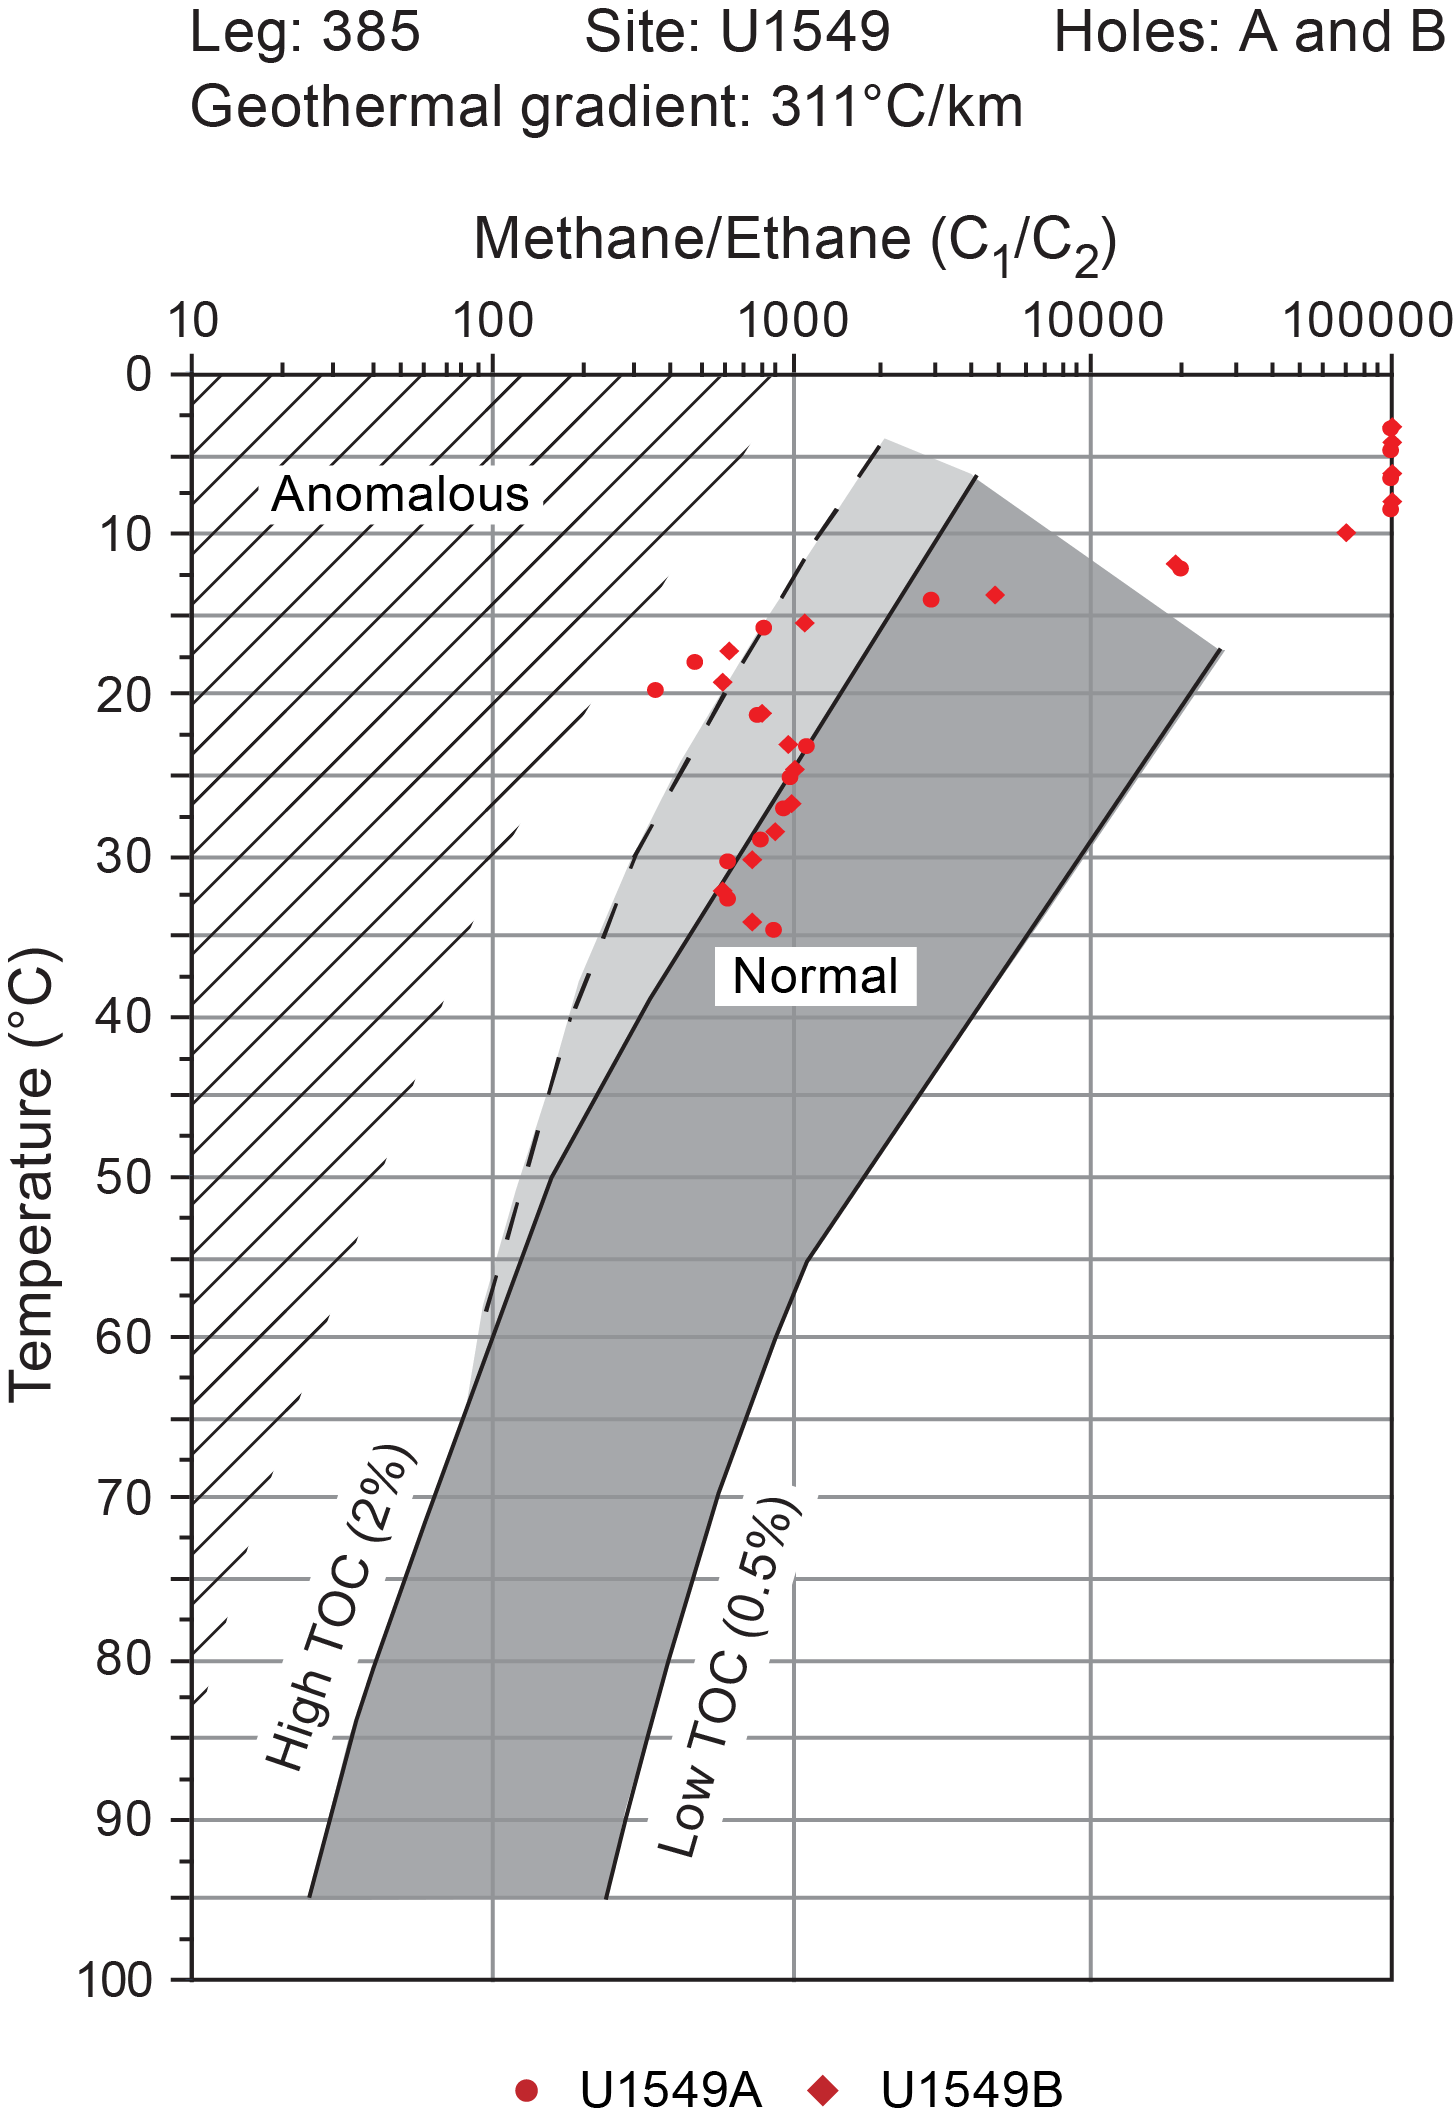
These trends in methane and C+ are reflected in values of C1/C2 and C1/C+ (Figure F17). When hydrocarbons first appear, a maximum C1/C2 value of ~103,000 is observed. C1/C2 gradually decreases to ~360 at ~86 mbsf and then increases to ~1000 at ~104 mbsf. C1/C2 values continue to decrease to ~740 at the bottom of Hole U1549A. Neither C1/C2 nor C1/C+ values have an anomalous relationship with temperature (Figure F18), as defined by Pimmel and Claypool (2001).
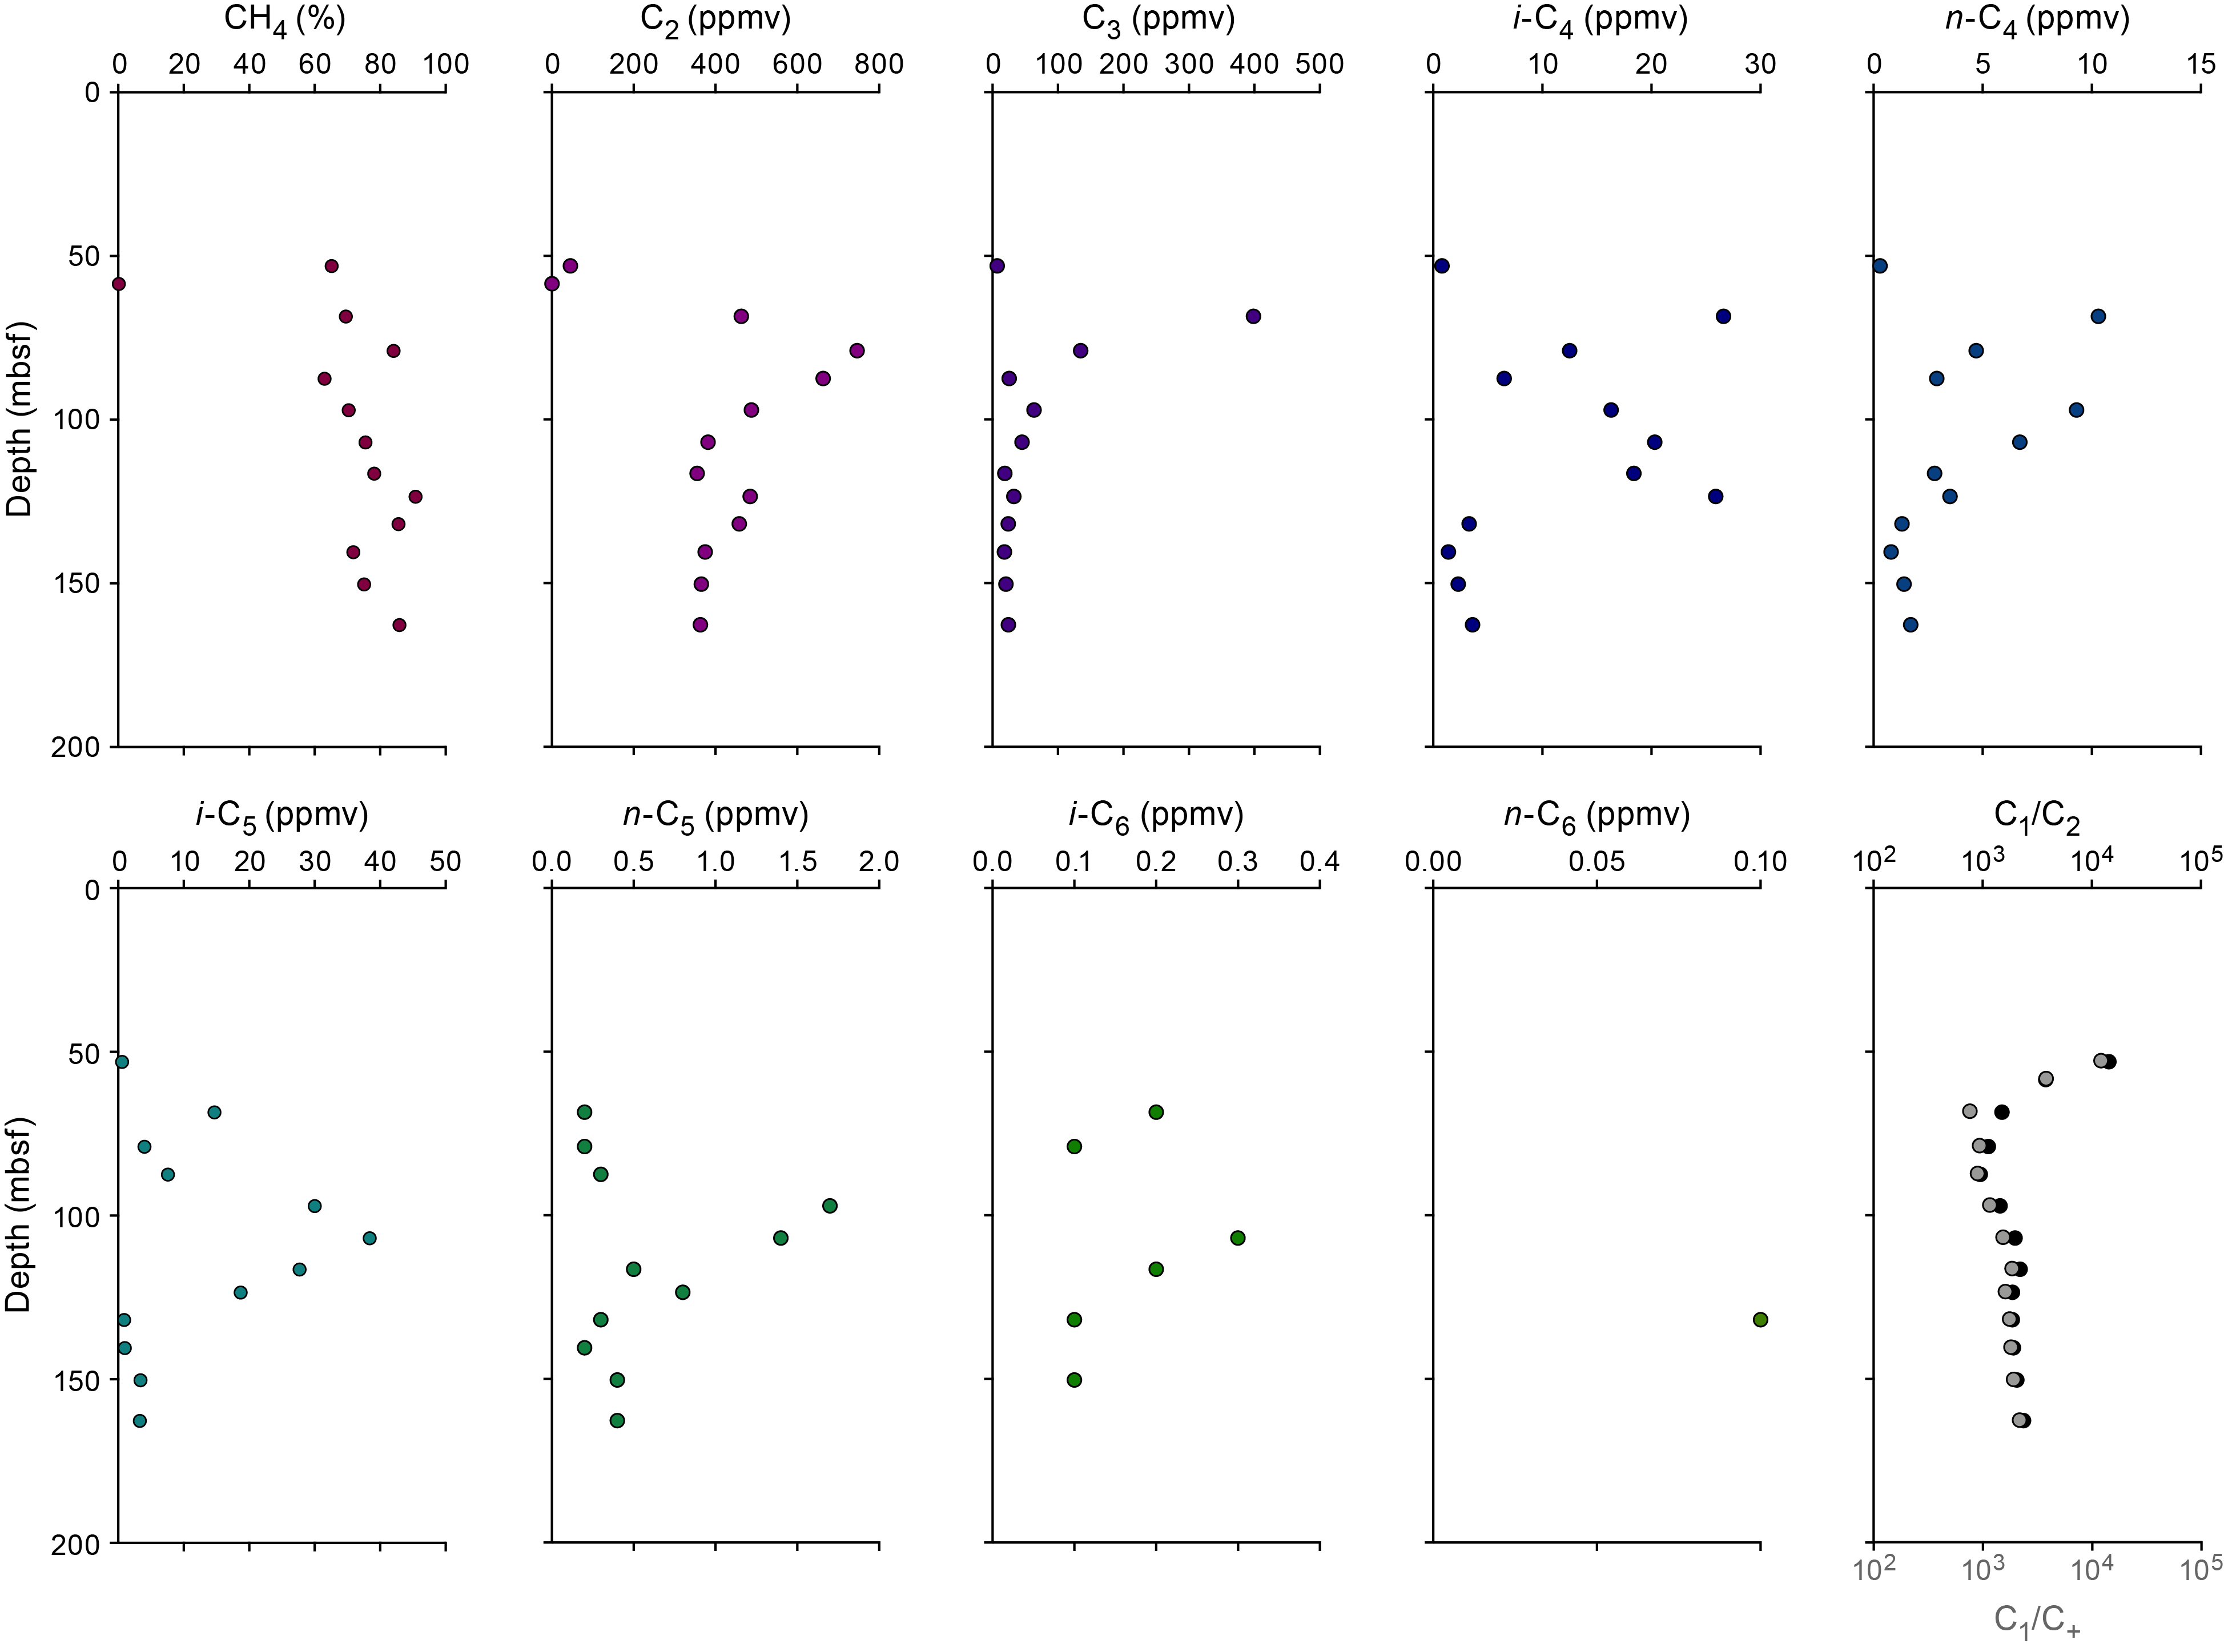
In addition to the headspace measurements described above, 13 void gas samples were taken in Hole U1549A when void spaces were observed on the core receiving platform (Table T13). These samples were analyzed to determine the parts per million by volume concentrations and values of C1/C2 and C1/C+ (Figure F19). Void samples are dominated by methane, which is present at levels ranging from ~63 to 91 vol% with an average of ~77 vol%. Hydrocarbons are present in every interval sampled, and the discernible trends mirror those seen in the headspace samples.
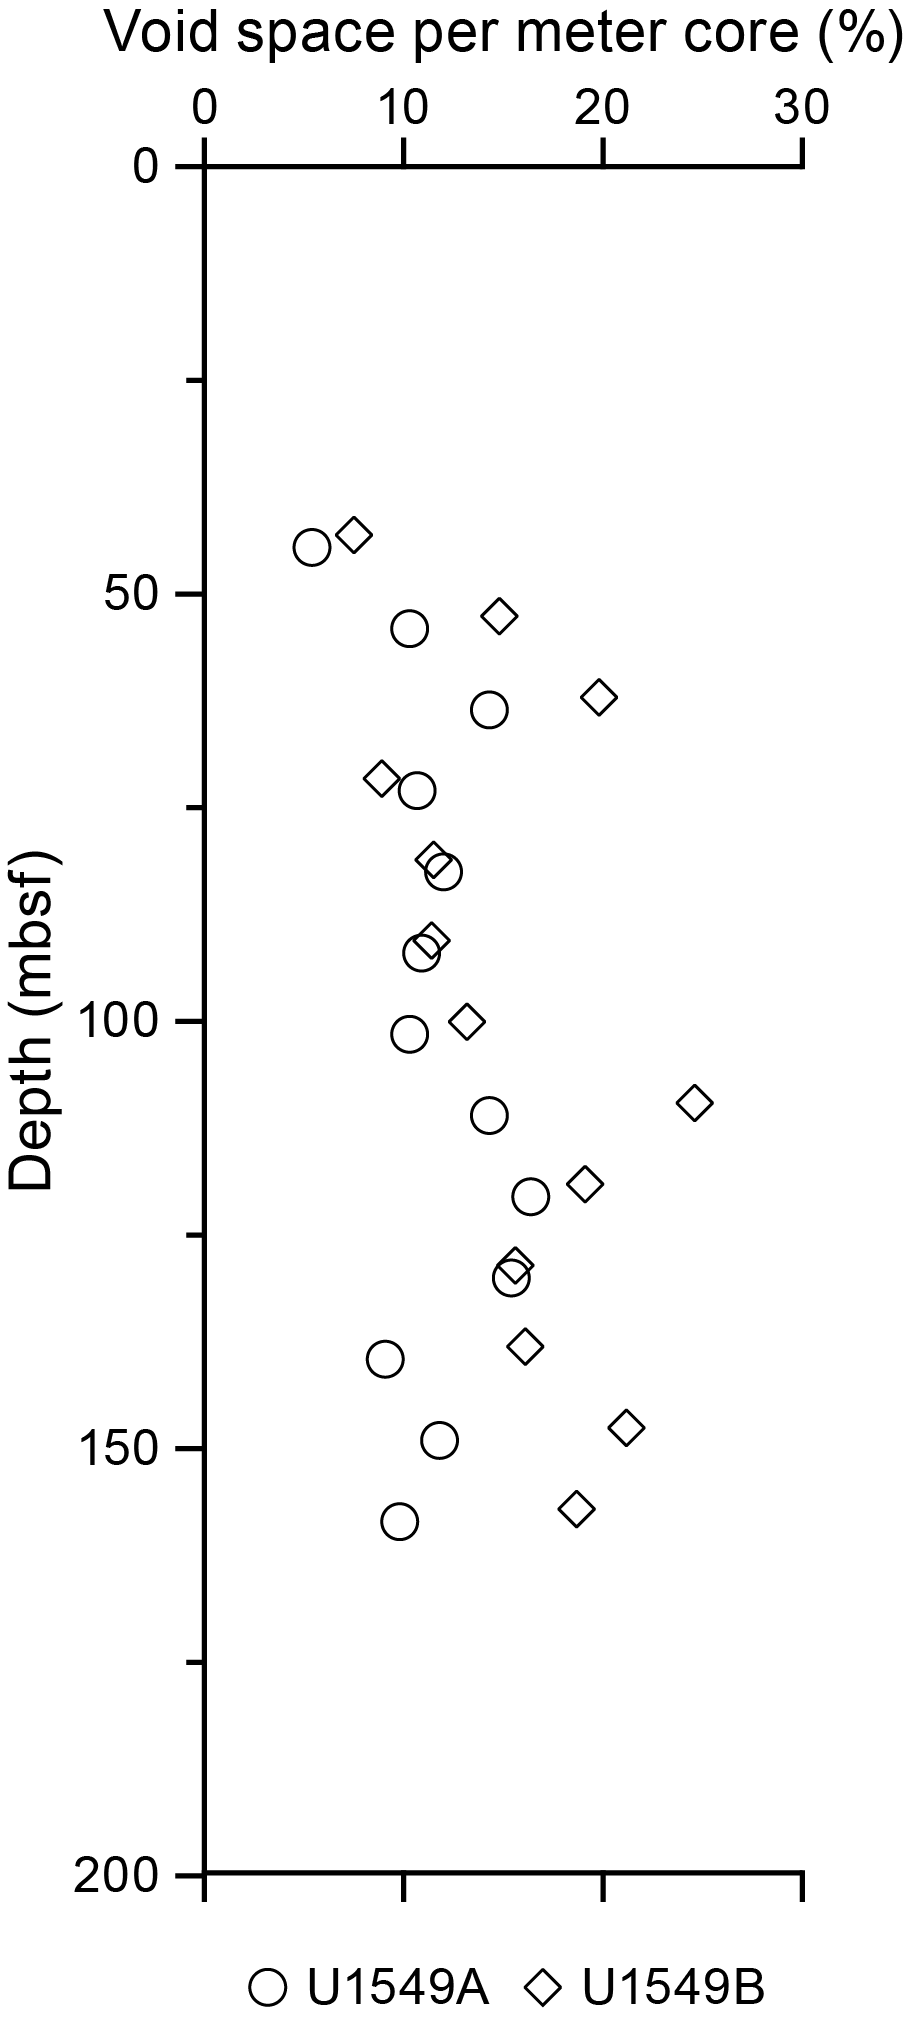
In Holes U1549A and U1549B, the lengths of the void spaces within the core liner created by expanding gases were measured immediately after core recovery on the core receiving platform (Table T14). Voids were present from ~43 to 159 mbsf. The percent of void space per meter core ranges from 5% to 25% and may increase slightly with depth (Figure F20).
8.3. Hydrogen and carbon monoxide
For Hole U1549B, headspace samples were taken from each core to monitor molecular hydrogen (H2) and carbon monoxide (CO). Duplicate samples were collected from depths next to samples for safety gas monitoring of hydrocarbon gases (Table T15). Dissolved H2 and CO were extracted into a defined headspace, the headspace gas was analyzed, and molar concentrations of dissolved H2 and CO were determined as described in Organic geochemistry in the Expedition 385 methods chapter (Teske et al., 2021a). Because of the presence of H2 and CO in the analytical blank, the minimum quantification limits for in situ concentrations of dissolved H2 and CO were 40 and 150 nM, respectively. Concentrations of dissolved H2 vary slightly with depth around an average of ~49 nM (Figure F21). In contrast, CO generally decreases downhole from a maximum of 383 nM at ~1.4 mbsf to below the minimum quantification limit at ~64 mbsf.
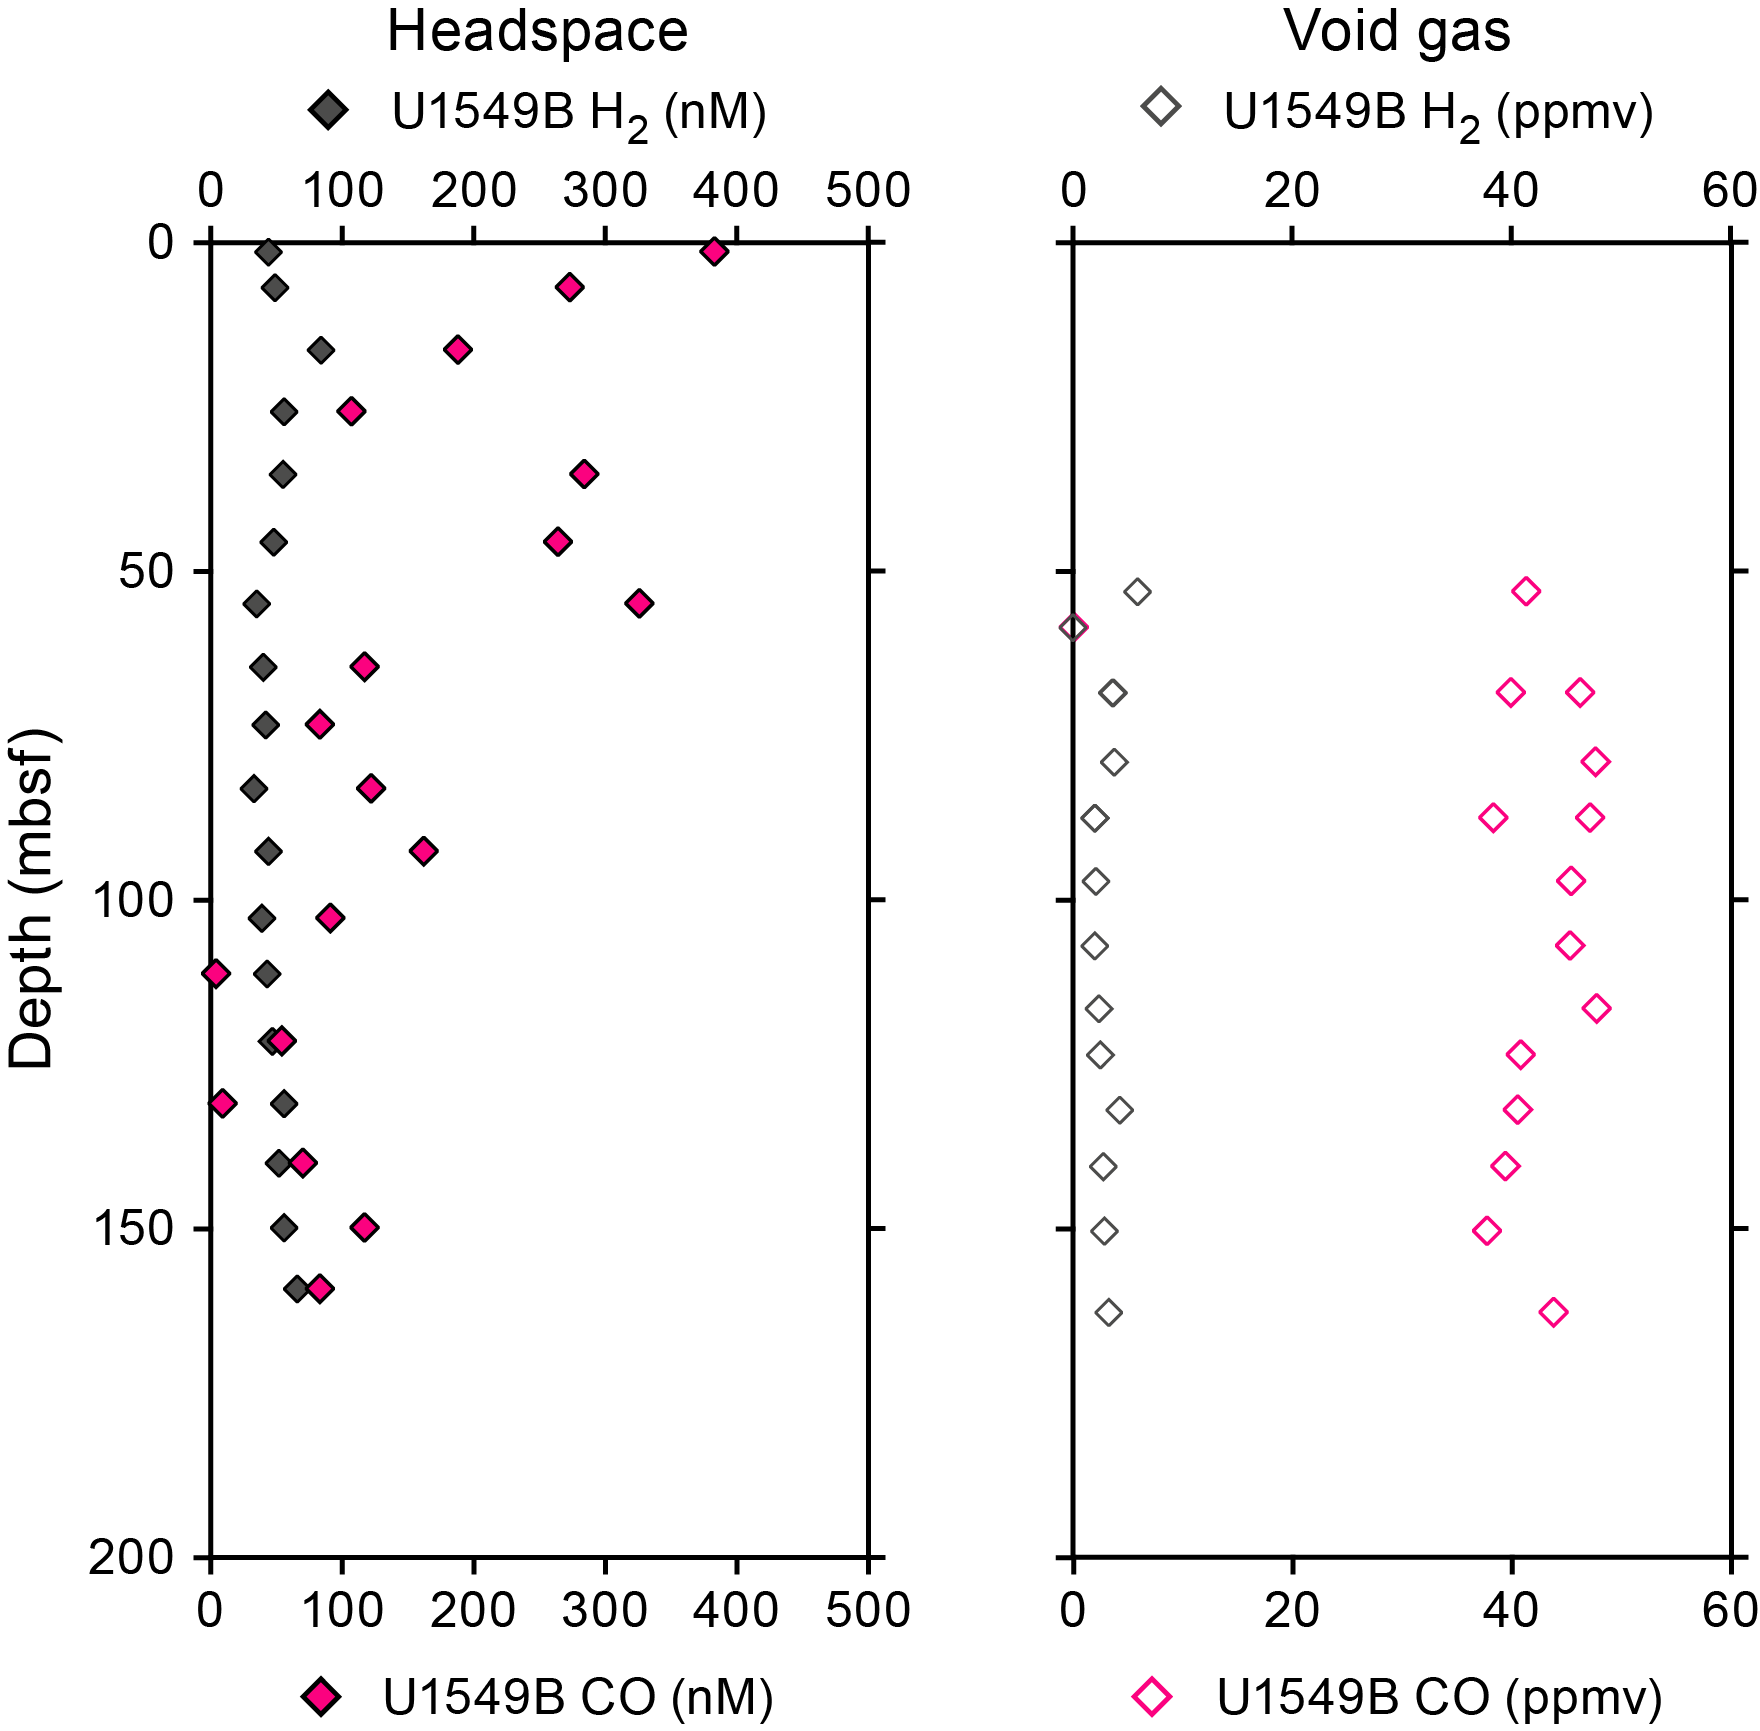
In addition to the headspace measurements described above, 13 void gas samples were collected using a gas-tight syringe and analyzed for H2 and CO content (Table T16; Figure F21). H2 content varies slightly around ~3 ppmv, and CO content varies around ~40 ppmv. No trends have been observed for either H2 or CO.
9. Microbiology
9.1. Sampling
Sediment cores for microbiological studies were obtained from Hole U1549B using the APC system. These samples represent horizons that will inform our understanding of the cycle of carbon driven by fluid flow occurring in the subseafloor of Guaymas Basin. Site U1549 differs from Sites U1545–U1548 in that the mostly biogenic sediments are punctuated by terrigenous intervals deposited as gravity-driven mass flows. The influence of emplaced sills is muted at Site U1549, as reflected in its smaller thermal gradient (26.7°C at 120.5 mbsf; temperature gradient = 194°C/km) (see Petrophysics). Therefore, this site presents an opportunity for microbiologists to examine how microbial diversity and activity are influenced by terrigenous sediment intervals and moderate thermal gradients. Sampling for cell counting, 3-D structural imaging, RNA analyses, and contamination tracing was performed as described in Microbiology in the Expedition 385 methods chapter (Teske et al., 2021a).
Detailed curatorial information about all samples taken (e.g., core, section, interval, and absolute depths of samples) can be retrieved from the Curation and Samples Laboratory Information Management System Online Report (http://web.iodp.tamu.edu/LORE).
9.2. Microbial cell detection and enumeration
9.2.1. Microbial cell counts
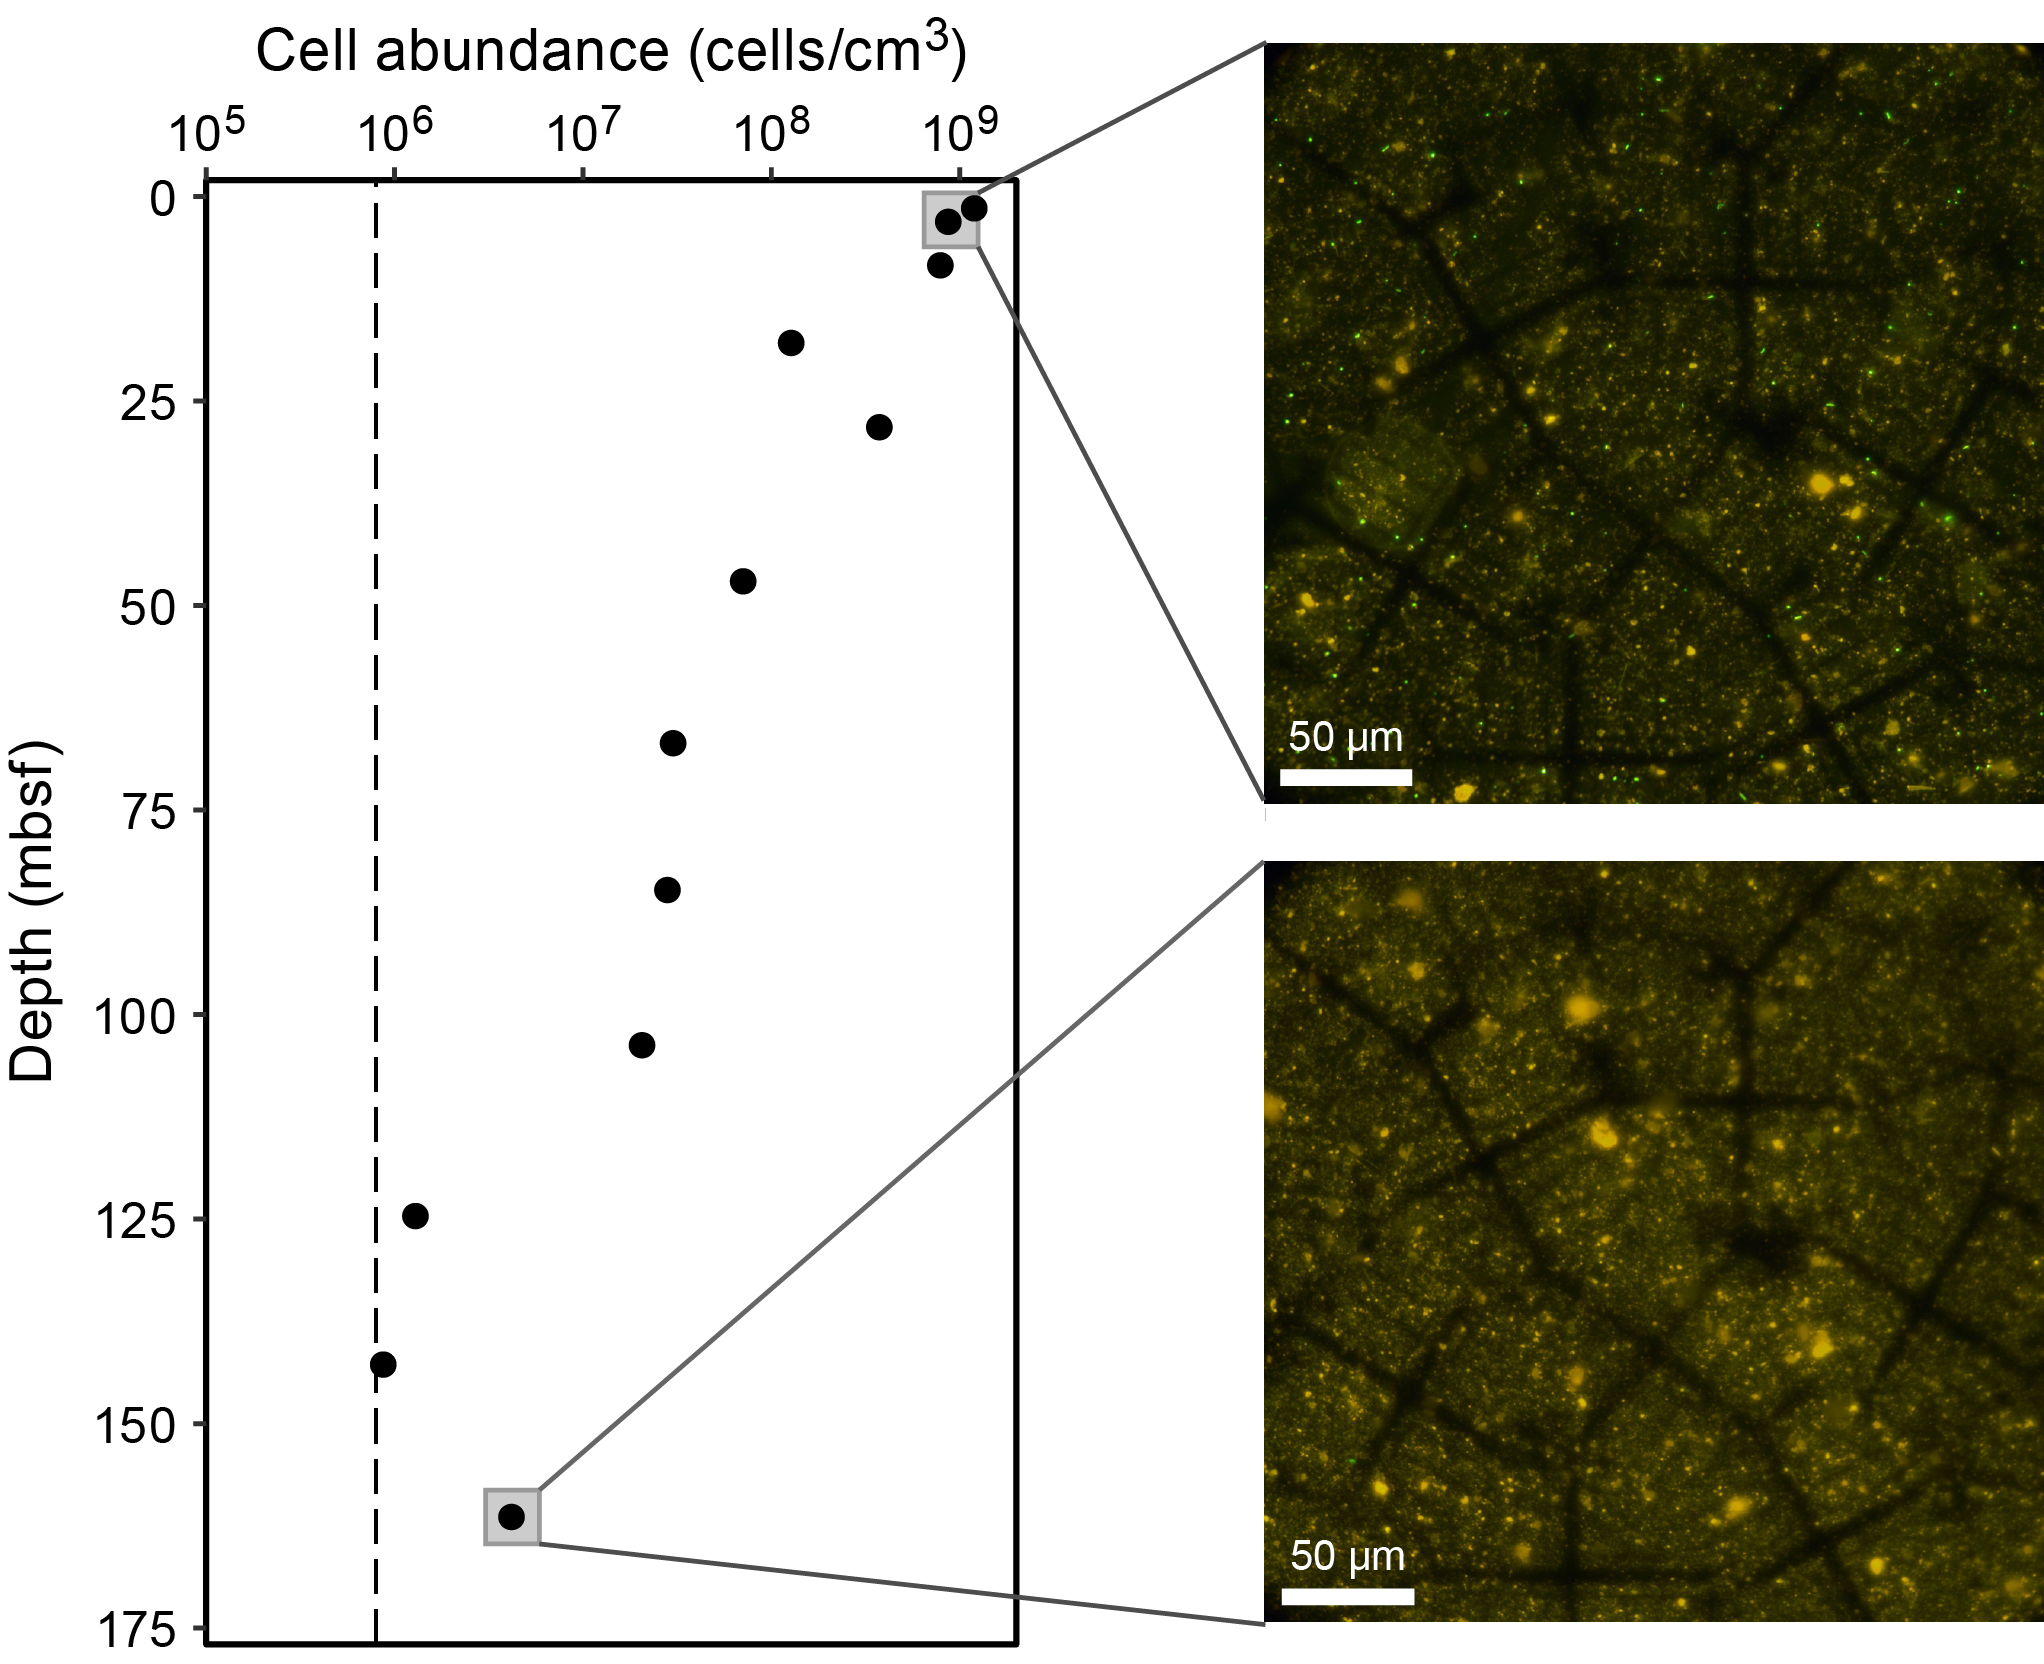
Cell abundance was determined by direct counting with an epifluorescence microscope. For shipboard analysis of sediment, samples (volume = 1 cm3) were aseptically taken from Hole U1549B sections using tip-cut syringes. Selected samples (Sections 385-U1549B-1H-1, 1H-3, 2H-3, 3H-3, 4H-3, 6H-4, 8H-5, 10H-4, 12H-3, 14H-5, 16H-5, and 18H-4) were processed using the noncell extraction protocol described in Microbiology in the Expedition 385 methods chapter (Teske et al., 2021a). Cell abundance was 0.94 × 10⁶ cells/cm3 in bottom seawater and 6.3 × 10⁸ cells/cm3 in seafloor sediments. Below the seafloor, cell abundance gradually decreased to 1.1 × 10⁷ cells/cm3 at approximately 103 mbsf (Figure F22). Cell abundance dropped below the detection limit in Section 14H-5 (124.6 mbsf) and then increased above the detection range (>8.0 × 10⁵ cells/cm3) in Section 18H-4 (161.4 mbsf), the depth of the deepest sample taken in Hole U1549B.
9.2.2. CARD-FISH cell counts of fungi
For catalyzed reporter deposition–fluorescence in situ hybridization (CARD-FISH) cell counts of fungi, samples were processed from Sections 385-U1549B-1H-3, 2H-2, 3H-2, 4H-2, 6H-3, and 9H-3 as described in Microbiology in the Expedition 385 methods chapter (Teske et al., 2021a).
9.2.3. Visualization of fungal cells
For visualizing the 3-D positioning of fungal filaments and yeasts using antibodies to chitin, replicate 5 and 15 cm3 syringe cores of sediment were collected from Section 385-U1549B-2H-2 and processed as described in Microbiology in the Expedition 385 methods chapter (Teske et al., 2021a).
9.3. Microbial activity measurements
9.3.1. Single-cell stable isotope analysis
Whole-round samples taken from Sections 385-U1549B-1H-3, 2H-3, 3H-3, 4H-3, 5H-3, 6H-4, 7H-3, 8H-4, 11H-3, 14H-4, and 17H-4 were immediately stored at ~4°C under anaerobic conditions for potential shore-based incubation and single-cell stable isotope analysis using nanoscale secondary ion mass spectrometry (NanoSIMS) (see Microbiology in the Expedition 385 methods chapter [Teske et al., 2021a]).
9.3.2. Methanogenesis and anaerobic oxidation of methane
Whole-round samples were collected to measure the rates of methanogenesis and anaerobic oxidation of methane at selected sediment horizons (Sections 385-U1549B-3H-2, 4H-2, 5H-3, 7H-3, 9H-4, 13H-3, and 17H-4) and processed as outlined in Microbiology in the Expedition 385 methods chapter (Teske et al., 2021a). Sediment volumes of approximately 5 mL were transferred to modified Hungate tubes in an anaerobic chamber in the microbiology cold room, and triplicate live samples and one killed control were collected for each substrate. In the radiation van, 14C-labeled tracers of methane, bicarbonate, acetate, formate, methanol, and methylamine were injected, and then samples were incubated at 20°C and 30°C for 2 weeks. After incubation, microbial activity was terminated by injecting 4 mL of 2 M NaOH into each sample. Fixed samples were stored at room temperature and shipped to shore for further processing.
9.3.3. Sulfate reduction activity
Immediately after core retrieval, 10 cm long whole-round core samples were cut from a core section and stored at ~4°C under anaerobic conditions. Site U1549 represents a cold seep environment. Hence, the focus of the sampling was shifted from targeting temperature horizons, as at previously drilled sites, to targeting the SMTZ. At this site, every 10 m of core was sampled starting from the sediment surface to a depth slightly below the anticipated SMTZ (~60 mbsf; <20°C). Below that depth, every other core was sampled to 150 mbsf (<40°C). Samples from Sections 385-U1549B-1H-2, 2H-2, 3H-2, 4H-2, 5H-2, 6H-3, 7H-3, 9H-4, 11H-3, 13H-3, 15H-4, and 17H-4 were processed as outlined in Microbiology in the Expedition 385 methods chapter (Teske et al., 2021a).
Incubation temperatures of 20°, 30°, and 40°C were chosen to reflect the approximate in situ temperature gradient of Site U1549. Incubations were terminated after 10 days (see Microbiology in the Expedition 385 methods chapter [Teske et al., 2021a]).
9.4. Bioorthogonal noncanonical amino acid tagging analyses
A bioorthogonal noncanonical amino acid tagging (BONCAT) incubation study was set up using approximately 130 cm3 of near-surface sediment material from Section 385-U1549B-3H-2. This sediment sample was processed as described in Microbiology in the Expedition 385 methods chapter (Teske et al., 2021a).
9.5. Cultivation experiments
9.5.1. Cultivation of mesophilic, thermophilic, and hyperthermophilic methanogenic subsurface microorganisms
Sediment samples from Hole U1549B were selected according to in situ temperature ranges for analyses of potential mesophilic, thermophilic, and hyperthermophilic methanogenic populations (Table T17). Sediment slurries were prepared following protocols established in Microbiology in the Expedition 385 methods chapter (Teske et al., 2021a).
9.5.2. Cultivation experiments for fungi
For each sample from Sections 385-U1549B-1H-3, 2H-2, 3H-2, 4H-2, 6H-3, and 9H-3, two enrichment cultures were initiated for fungi as described in Microbiology in the Expedition 385 methods chapter (Teske et al., 2021a).
10. Petrophysics
Measurements of physical properties on whole-round cores and working- and (subordinate) archive-half sections were compared between Holes U1549A and U1549B for lithostratigraphic characterization and correlation with core description information. These holes were cored to ~168 mbsf (Hole U1549A) and ~167 mbsf (Hole U1549B). These cored intervals are described as one lithostratigraphic unit. NGR and MS peaks at ~70–100 mbsf can be correlated with four different depositional subunits. These physical properties, along with density and P-wave velocity, have a negative correlation in porosity and rheological parameters. Porosity data derived from MAD measurements show a general decrease with depth, whereas shear strength measurements reveal a linear increase with depth and increasing induration. Four in situ formation temperature measurements were made using the APCT-3 tool for the calculation of geothermal gradient and heat flow. Conductivity measurements on cores from Holes U1549A and U1549B show similar trends with depth.
10.1. Data acquisition
Core laboratory measurements of physical properties were made on core sections and samples from Holes U1549A and U1549B. Measured properties and measurement procedures are listed in Tables T17 and T18 in the Expedition 385 methods chapter (Teske et al., 2021a). MAD measurements were made on samples taken every 20 m for Hole U1549A and every 10 m for Hole U1549B. The higher sampling resolution scheme for Hole U1549B was implemented in coordination with samples taken for safety monitoring of hydrocarbon gases (see Organic geochemistry).
10.2. Downhole temperature and thermal conductivity
10.2.1. Downhole temperature
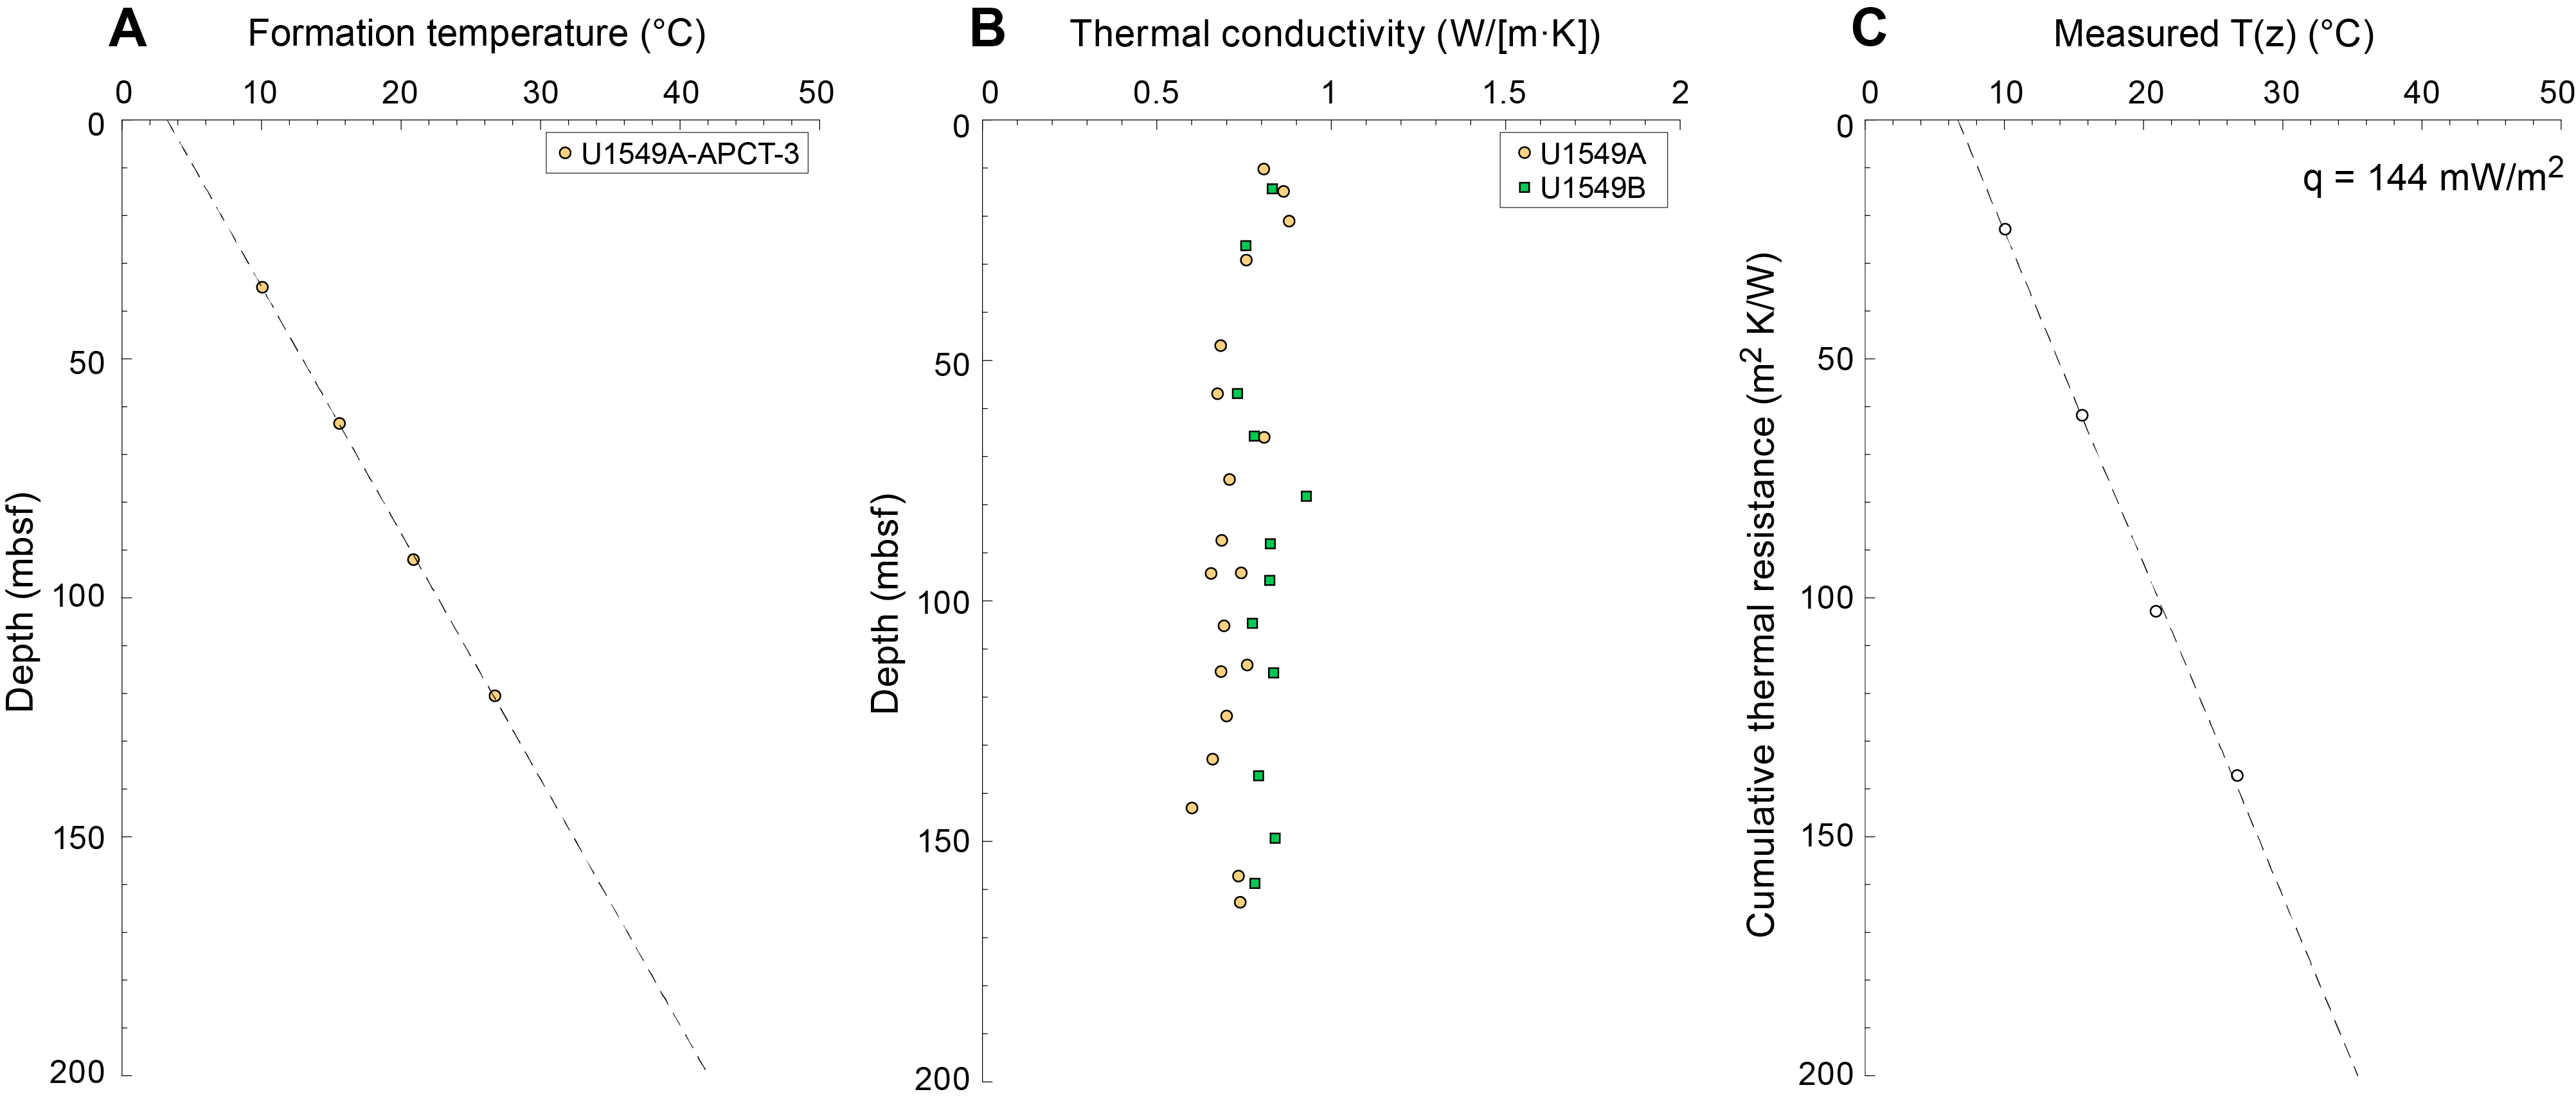
Four in situ formation temperature measurements were conducted using the APCT-3 tool (see Petrophysics in the Expedition 385 methods chapter [Teske et al., 2021a]). Measured temperature values range from 10.06°C at 63.5 mbsf (Core 385-U1549A-4H) to 26.73°C at 120.5 mbsf (Core 10H) (Table T18). These values indicate that the formation temperature increases with depth along a linear geothermal gradient of 194°C/km (Figure F23A). The slope of the linear fit between cumulative thermal resistance and formation temperature (Figure F23C) indicates a heat flow of 144 mW/m2.
10.2.2. Thermal conductivity
Thermal conductivity for Holes U1549A and U1549B varies between ~0.66 and ~0.93 W/(m·K) with a mean of 0.76 ± 0.08 W/(m·K) (Figure F23B). Trends in measured thermal conductivity with depth are similar for Holes U1549A and U1549B (Figure F23B).
10.3. Density (core and grain)
MAD bulk density agrees well with gamma ray attenuation (GRA) bulk density (Figure F24B). Density increases over the uppermost ~20 m to a maximum value of ~1.55 g/cm3 and then decreases to ~1.22 g/cm3 at ~22 mbsf. From this depth to the bottom of both holes, values are mainly constant around a mean of 1.25 ± 0.13 g/cm3 (Figure F24B).
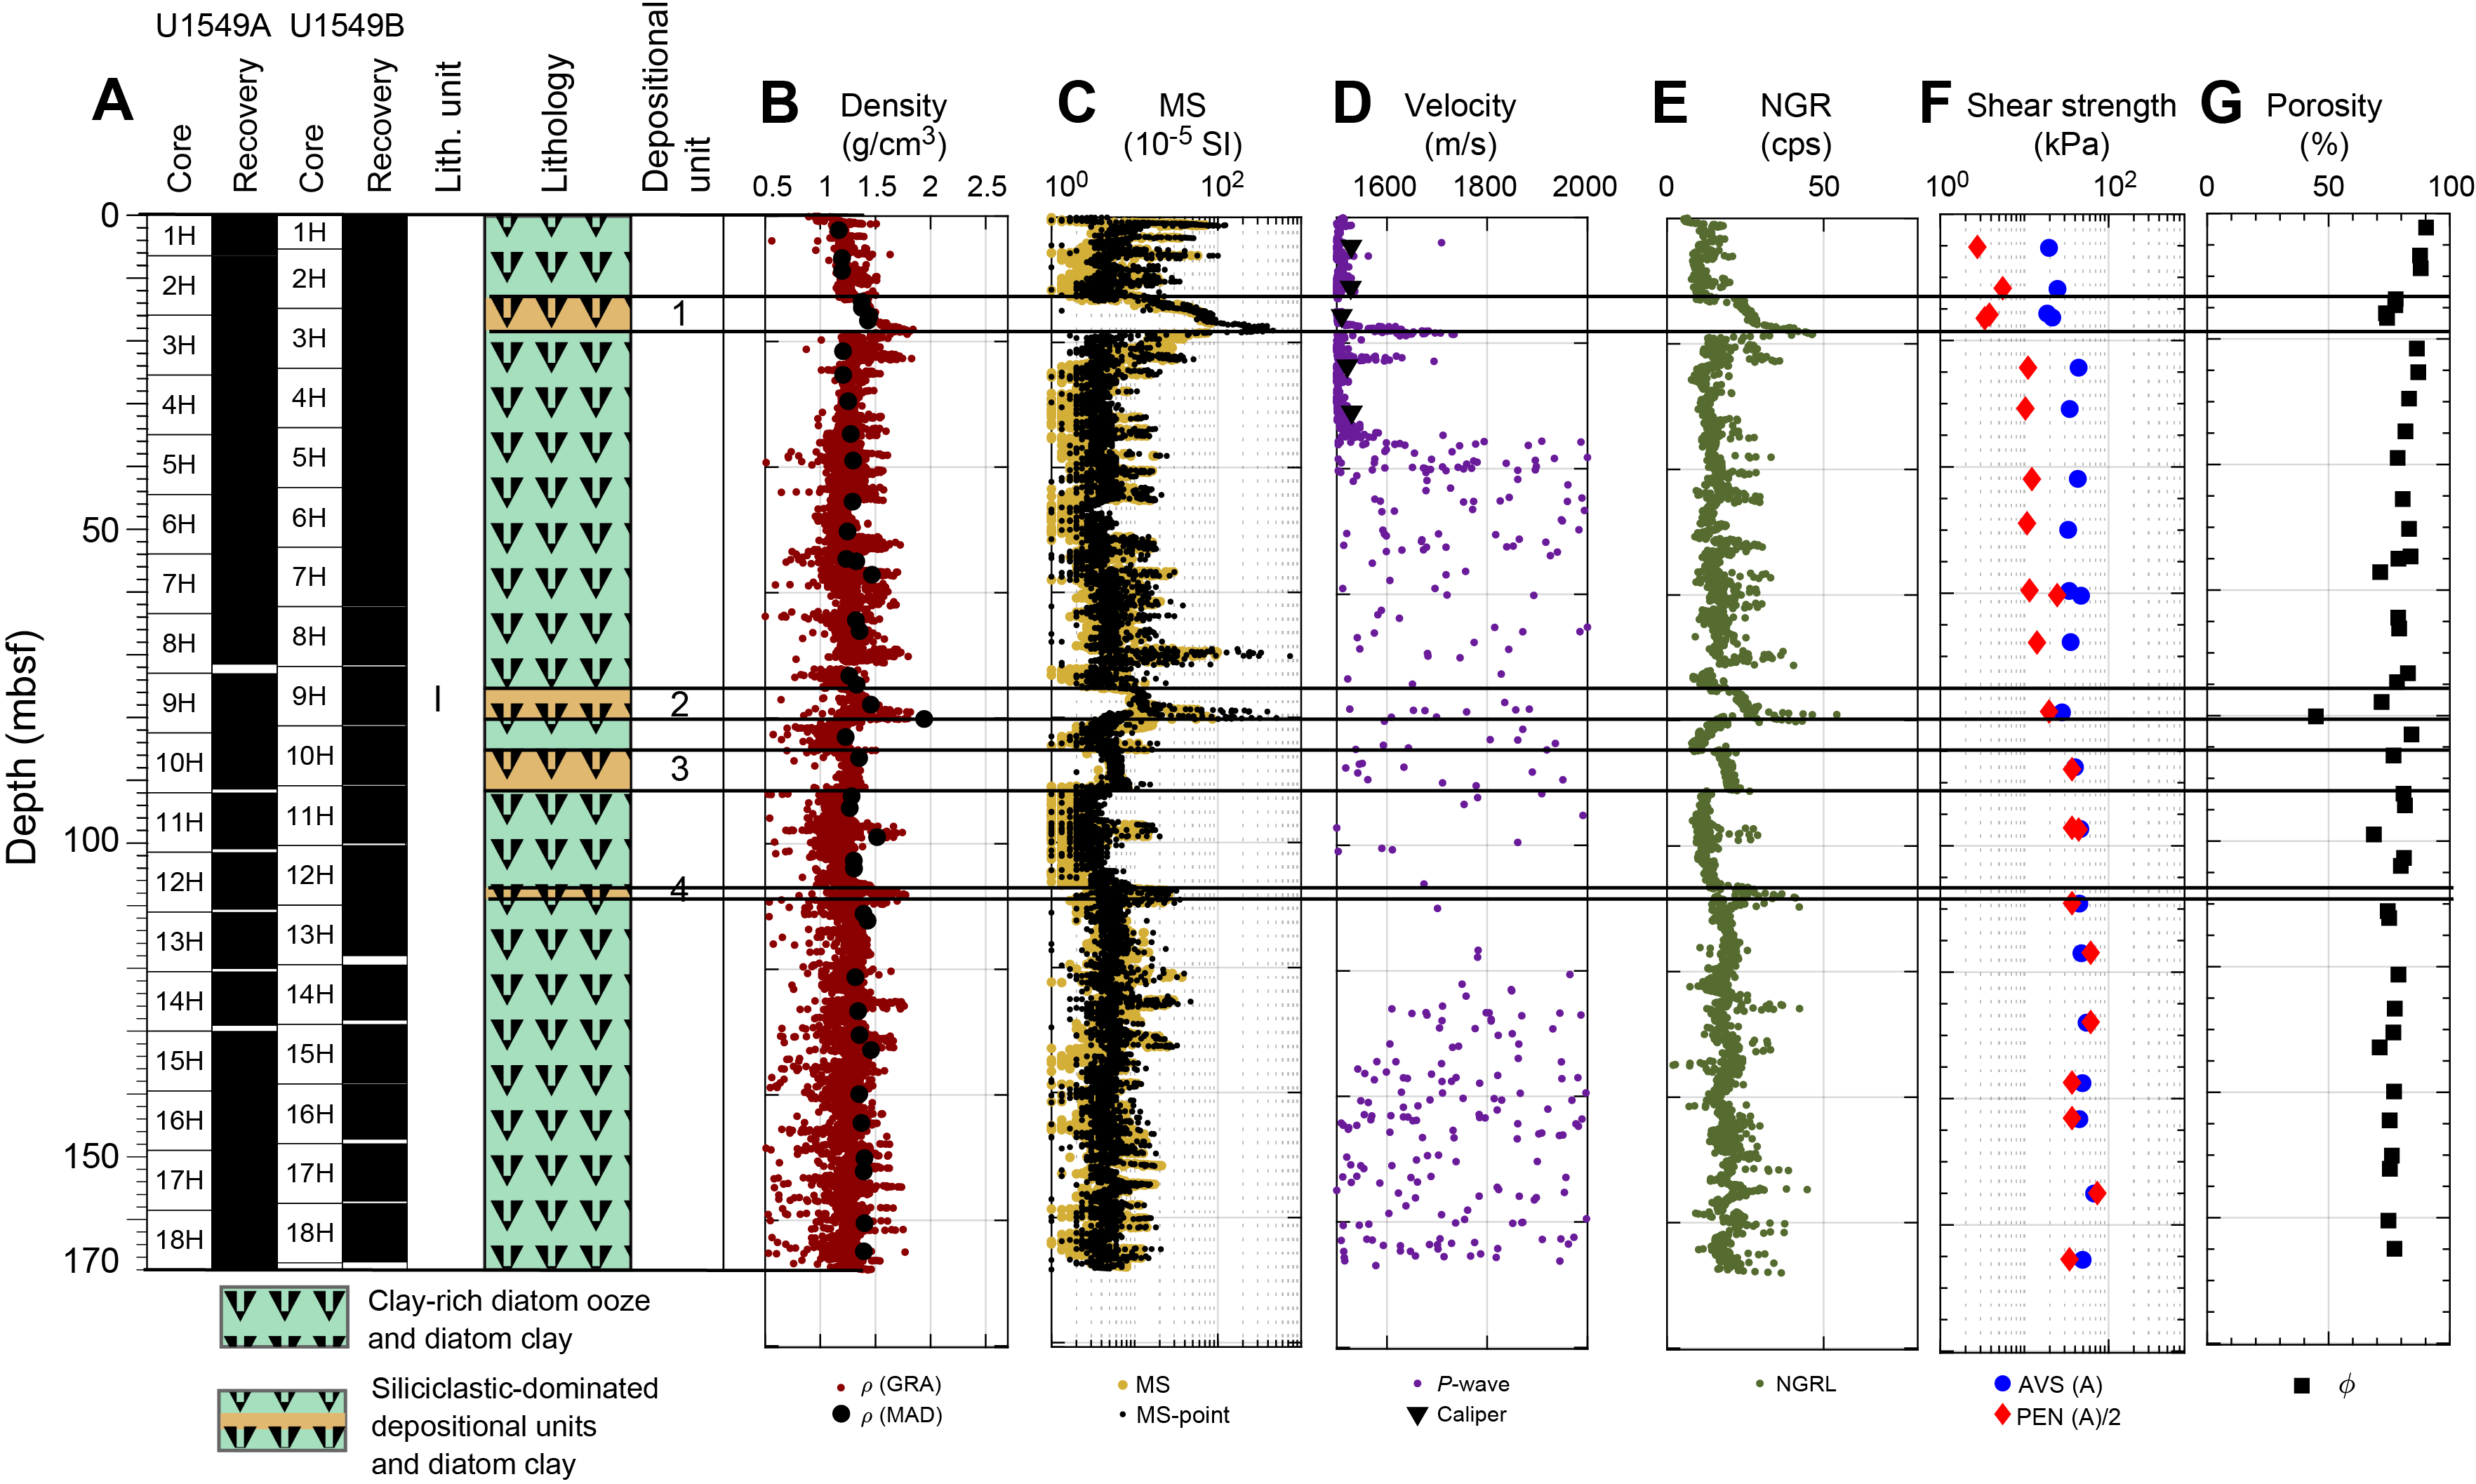
The peak in density of ~1.82 g/cm3 at ~80 mbsf is observed in both GRA bulk density and MAD sample measurements in Hole U1549A. The peaks in density observed at ~20 and 80 mbsf are both in good agreement with other physical properties observed at the same depth (e.g., NGR and MS).
Step changes in density are correlated with NGR and MS data at 20–45, 45–57, 57–70, 70–80, 80–84, and 84–91 mbsf. These variations correspond to changes in lithology and/or deposition (e.g., silt-rich interval at 70–80 mbsf within a diatom ooze–dominated subunit). RGB spectra indicate that variations in the colors within this sedimentary sequence reflect the observed step variations in density, NGR, and MS data.
10.4. Magnetic susceptibility
MS values measured with two distinct instruments, the Whole-Round Multisensor Logger (WRMSL) and Section Half Multisensor Logger (SHMSL), are in good agreement. There is also good agreement in measured values between holes along the entire profile (Figure F24C). Values in both holes are mainly constant to ~166 mbsf. Several large peaks are observed at ~20, 70, and 80 mbsf that have maximum values of ~70 × 10−5 SI, 98 × 10−5 SI, and 67 × 10−5 SI, respectively. All three peaks are consistent with high values in density and NGR; the first and last peaks show negative correlation with porosity and rheology.
10.5. Sonic velocities
P-wave velocities measured using the WRMSL and the Section Half Measurement Gantry (SHMG) caliper for the uppermost sediments are close to the velocity of seawater (~1500 m/s) from ~10 to 30 mbsf (Figure F24D). Whole-round and caliper measurements are in good agreement in this interval. Peaks observed at ~18 and 20 mbsf show a maximum of 1630 and 1740 m/s, respectively. These two peaks are in good agreement with other physical properties (e.g., NGR and density). At depths greater than ~35 mbsf, measured P-wave velocities are not representative of in situ conditions because of voids, cracks, and small fractures in the recovered sediment.
10.6. Formation natural gamma radiation
Here we compare NGR data measured on cores from Holes U1549A and U1549B (Figure F24E). NGR values for whole-round sections from Holes U1549A and U1549B are constant around ~12 counts/s in the first ~15 mbsf. After a steep increase from ~12 to 24.5 counts/s at 13 mbsf, another increase is observed at ~15–20 mbsf, where NGR shows a maximum value of ~28 counts/s. To ~80 mbsf, values are constant around ~16 counts/s and initially drop to ~8 counts/s below that depth. They then increase to 20 counts/s at ~90 mbsf. Below this depth, values increase linearly to ~21 counts/s to ~120 mbsf and then NGR counts vary around ~19 counts/s to the bottom of both holes.
The variations of NGR values with depth noted above are well correlated with general trends observed in the density, porosity, and MS data. Peaks in NGR observed at ~20 and ~80 mbsf correlate with high values in density, and MS and are negatively correlated with porosity and shear strength. P-wave velocity shows an increase at ~20 mbsf that correlates with the rest of the data. Additional positive peaks in NGR relative to the background trend are observed at ~70, ~98, ~108, ~126, and ~131 mbsf, correlating with positive peaks in GRA bulk density and MS. These correlated peaks occur at 10–20 m intervals between ~40 and ~140 mbsf.
10.7. Rheology
Shear strength measurements (Figure F24F) performed on Site U1549 section halves show a linear increase from 18 kPa just below the seafloor to ~34 kPa at ~60 mbsf. After a decrease to ~28 kPa at ~80 mbsf, shear strength values increase slightly and vary around a mean of ~50 kPa to the bottom of Hole U1549A.
Shear strength values derived from pocket penetrometer (PEN) compressive strength measurements (i.e., the PEN measurement value divided by 2) (Figure F24F) are only reliable and comparable to the automated vane shear (AVS) at depths below ~80 mbsf. Below this depth, values increase to a maximum of 75 kPa at ~150 mbsf. Variations in compressive strength below ~120 mbsf are due to indurated and cracked sediment.
10.8. Porosity
Porosity derived from MAD measurements (Figure F24G) decreases from 90% to 74% at ~16 mbsf and shows a negative correlation with NGR bulk density, MS, and P-wave velocity. This correlation can also be made at ~80 mbsf, where porosity decreases to ~73% in Hole U1549A. At ~18–80 mbsf and from ~80 mbsf to the bottom of both holes, porosity is mainly constant at ~78%–80%.
10.9. Data integration and lithology correlation
We identify one main depth interval that relates to a specific lithostratigraphic unit. The sediments and sedimentary rocks recovered at Site U1549 are mostly laminated and primarily contain a mix of clay-rich diatom ooze, silt-rich diatom clay, and sand layers (see Lithostratigraphy). Peaks in physical properties for NGR, density, MS, and P-wave velocity, together with the negative correlation in porosity and rheology at ~20 mbsf, are related to gravity flows containing sand-rich layers (see Lithostratigraphy). The two peaks at ~70 and ~80 mbsf observed in NGR, density, and MS, also expressed as negative correlations in porosity and rheology, are related to clayey silt, sand, and, in the case of the latter, silt layers.
References
Arason, P., and Levi, S., 2010. Maximum likelihood solution for inclination-only data in paleomagnetism. Geophysical Journal International, 182(2):753–771. https://doi.org/
Barbara, L., Schmidt, S., Urrutia-Fucugauchi, J., and Pérez-Cruz, L., 2016. Fuerte River floods, an overlooked source of terrigenous sediment to the Gulf of California. Continental Shelf Research, 128:1–9. https://doi.org/
Berner, R.A., 1982. Burial of organic carbon and pyrite sulfur in the modern ocean: its geochemical and environmental significance. American Journal of Science, 282(4):451–473. https://doi.org/
Burdige, D.J., 2006. Geochemistry of Marine Sediments: Princeton, NJ (Princeton University Press). https://digitalcommons.odu.edu/
Campbell, A.C., and Gieskes, J.M., 1984. Water column anomalies associated with hydrothermal activity in the Guaymas Basin, Gulf of California. Earth and Planetary Science Letters, 68(1):57–72. https://doi.org/
Davis, C., Haughton, P., McCaffrey, W., Scott, E., Hogg, N., and Kitching, D., 2009. Character and distribution of hybrid sediment gravity flow deposits from the outer Forties Fan, Palaeocene Central North Sea, UKCS. Marine and Petroleum Geology, 26(10):1919–1939. https://doi.org/
Dunlop, D.J., Özdemir, Ö., and Schmidt, P.W., 1997. Paleomagnetism and paleothermometry of the Sydney Basin 2. Origin of anomalously high unblocking temperatures. Journal of Geophysical Research: Solid Earth, 102(B12):27285–27295. https://doi.org/
Goldhaber, M.B., and Kaplan, I.R., 1974. The sulfur cycle. In Goldberg, E.D. (Ed.), The Sea (Volume 5): Marine Chemistry: New York (Wiley), 569–655.
Helenes, J., Carreño, A.L., and Carrillo, R.M., 2009. Middle to late Miocene chronostratigraphy and development of the northern Gulf of California. Marine Micropaleontology, 72(1):10–25. https://doi.org/
Kim, J.-H., Torres, M.E., Haley, B.A., Ryu, J.-S., Park, M.-H., Hong, W.-L., and Choi, J., 2016. Marine silicate weathering in the anoxic sediment of the Ulleung Basin: evidence and consequences. Geochemistry, Geophysics, Geosystems, 17(8):3437–3453. https://doi.org/
Kirschvink, J.L., 1980. The least-squares line and plane and the analysis of palaeomagnetic data. Geophysical Journal International, 62(3):699–718. https://doi.org/
Leslie, B.W., Lund, S.P., and Hammond, D.E., 1990. Rock magnetic evidence for the dissolution and authigenic growth of magnetic minerals within anoxic marine sediments of the California continental borderland. Journal of Geophysical Research: Solid Earth, 95(B4):4437–4452. https://doi.org/
Levi, S., and Karlin, R., 1989. A sixty thousand year paleomagnetic record from Gulf of California sediments: secular variation, late Quaternary excursions and geomagnetic implications. Earth and Planetary Science Letters, 92(2):219–233. https://doi.org/
Lizarralde, D., Soule, S.A., Seewald, J.S., and Proskurowski, G., 2011. Carbon release by off-axis magmatism in a young sedimented spreading centre. Nature Geoscience, 4:50–54. https://doi.org/
Martini, E., 1971. Standard Tertiary and Quaternary calcareous nannoplankton zonation. In McKee, E.D., and Weir, G.W. (Ed.), Trace Elements Investigations Report, 269: Washington, DC (US Department of the Interior). https://doi.org/
McDougall, K., and Martínez, A.Y.M., 2014. Evidence for a marine incursion along the lower Colorado River corridor. Geosphere, 10(5):842–869. https://doi.org/
Meyers, P.A., 1994. Preservation of elemental and isotopic source identification of sedimentary organic matter. Chemical Geology, 114(3–4):289–302. https://doi.org/
Middleton, G.V., and Hampton, M.A., 1973. Mechanics of flow and deposition. In Middleton, G.V. and Hampton, M.A. (Ed.), Turbidites and Deep Water Sedimentation. SEPM Pacific Section Short Course, Anaheim 1973, 1–38.
Pimmel, A., and Claypool, G., 2001. Introduction to shipboard organic geochemistry on the JOIDES Resolution. Ocean Drilling Program Technical Note, 30. https://doi.org/
Schulz, H.N., and Schulz, H.D., 2005. Large sulfur bacteria and the formation of phosphorite. Science, 307(5708):416–418. https://doi.org/
Silverberg, N., Shumilin, E., Aguirre-Bahena, F., Rodríguez-Castañeda, A.P., and Sapozhnikov, D., 2007. The impact of hurricanes on sedimenting particulate matter in the semi-arid Bahía de La Paz, Gulf of California. Continental Shelf Research, 27(19):2513–2522. https://doi.org/
Teske, A., Lizarralde, D., and Höfig, T.W., 2018. Expedition 385 Scientific Prospectus: Guaymas Basin Tectonics and Biosphere. College Station, TX (International Ocean Discovery Program). https://doi.org/
Teske, A., Lizarralde, D., Höfig, T.W., Aiello, I.W., Ash, J.L., Bojanova, D.P., Buatier, M.D., Edgcomb, V.P., Galerne, C.Y., Gontharet, S., Heuer, V.B., Jiang, S., Kars, M.A.C., Khogenkumar Singh, S., Kim, J.-H., Koornneef, L.M.T., Marsaglia, K.M., Meyer, N.R., Morono, Y., Negrete-Aranda, R., Neumann, F., Pastor, L.C., Peña-Salinas, M.E., Pérez Cruz, L.L., Ran, L., Riboulleau, A., Sarao, J.A., Schubert, F., Stock, J.M., Toffin, L.M.A.A., Xie, W., Yamanaka, T., and Zhuang, G., 2021a. Expedition 385 methods. In Teske, A., Lizarralde, D., Höfig, T.W. and the Expedition 385 Scientists, Guaymas Basin Tectonics and Biosphere. Proceedings of the International Ocean Discovery Program, 385: College Station, TX (International Ocean Discovery Program). https://doi.org/
Teske, A., Lizarralde, D., Höfig, T.W., Aiello, I.W., Ash, J.L., Bojanova, D.P., Buatier, M.D., Edgcomb, V.P., Galerne, C.Y., Gontharet, S., Heuer, V.B., Jiang, S., Kars, M.A.C., Khogenkumar Singh, S., Kim, J.-H., Koornneef, L.M.T., Marsaglia, K.M., Meyer, N.R., Morono, Y., Negrete-Aranda, R., Neumann, F., Pastor, L.C., Peña-Salinas, M.E., Pérez Cruz, L.L., Ran, L., Riboulleau, A., Sarao, J.A., Schubert, F., Stock, J.M., Toffin, L.M.A.A., Xie, W., Yamanaka, T., and Zhuang, G., 2021b. Site U1545. In Teske, A., Lizarralde, D., Höfig, T.W., and the Expedition 385 Scientists, Guaymas Basin Tectonics and Biosphere. 385: College Station, TX (International Ocean Discovery Program). https://doi.org/
Teske, A., Lizarralde, D., Höfig, T.W., Aiello, I.W., Ash, J.L., Bojanova, D.P., Buatier, M.D., Edgcomb, V.P., Galerne, C.Y., Gontharet, S., Heuer, V.B., Jiang, S., Kars, M.A.C., Khogenkumar Singh, S., Kim, J.-H., Koornneef, L.M.T., Marsaglia, K.M., Meyer, N.R., Morono, Y., Negrete-Aranda, R., Neumann, F., Pastor, L.C., Peña-Salinas, M.E., Pérez Cruz, L.L., Ran, L., Riboulleau, A., Sarao, J.A., Schubert, F., Stock, J.M., Toffin, L.M.A.A., Xie, W., Yamanaka, T., and Zhuang, G., 2021c. Site U1546. In Teske, A., Lizarralde, D., Höfig, T.W. and the Expedition 385 Scientists, Guaymas Basin Tectonics and Biosphere. Proceedings of the International Ocean Discovery Program, 385: College Station, TX (International Ocean Discovery Program). https://doi.org/
Teske, A., Lizarralde, D., Höfig, T.W., Aiello, I.W., Ash, J.L., Bojanova, D.P., Buatier, M.D., Edgcomb, V.P., Galerne, C.Y., Gontharet, S., Heuer, V.B., Jiang, S., Kars, M.A.C., Khogenkumar Singh, S., Kim, J.-H., Koornneef, L.M.T., Marsaglia, K.M., Meyer, N.R., Morono, Y., Negrete-Aranda, R., Neumann, F., Pastor, L.C., Peña-Salinas, M.E., Pérez Cruz, L.L., Ran, L., Riboulleau, A., Sarao, J.A., Schubert, F., Stock, J.M., Toffin, L.M.A.A., Xie, W., Yamanaka, T., and Zhuang, G., 2021d. Sites U1547 and U1548. In Teske, A., Lizarralde, D., Höfig, T.W., and the Expedition 385 Scientists, Guaymas Basin Tectonics and Biosphere. Proceedings of the International Ocean Discovery Program, 385: College Station, TX (International Ocean Discovery Program). https://doi.org/
Teske, A., Lizarralde, D., Höfig, T.W., Aiello, I.W., Ash, J.L., Bojanova, D.P., Buatier, M.D., Edgcomb, V.P., Galerne, C.Y., Gontharet, S., Heuer, V.B., Jiang, S., Kars, M.A.C., Khogenkumar Singh, S., Kim, J.-H., Koornneef, L.M.T., Marsaglia, K.M., Meyer, N.R., Morono, Y., Negrete-Aranda, R., Neumann, F., Pastor, L.C., Peña-Salinas, M.E., Pérez Cruz, L.L., Ran, L., Riboulleau, A., Sarao, J.A., Schubert, F., Stock, J.M., Toffin, L.M.A.A., Xie, W., Yamanaka, T., and Zhuang, G., 2021e. Site U1550. In Teske, A., Lizarralde, D., Höfig, T.W., and the Expedition 385 Scientists, Guaymas Basin Tectonics and Biosphere. Proceedings of the International Ocean Discovery Program, 385: College Station, TX (International Ocean Discovery Program). https://doi.org/
Teske, A., Lizarralde, D., Höfig, T.W., and the Expedition 385 Scientists, 2021f. Supplementary material, https://doi.org/
Teske, A., Wegener, G., Chanton, J.P., White, D., MacGregor, B., Hoer, D., de Beer, D., et al., 2021g. Microbial communities under distinct thermal and geochemical regimes in axial and off-axis sediments of Guaymas Basin. Frontiers in Microbiology, 12:633649. https://doi.org/
Thunell, R.C., 1998. Seasonal and annual variability in particle fluxes in the Gulf of California: a response to climate forcing. Deep Sea Research Part I: Oceanographic Research Papers, 45(12):2059–2083. https://doi.org/
Tomaru, H., Lu, Z., Snyder, G.T., Fehn, U., Hiruta, A., and Matsumoto, R., 2007. Origin and age of pore waters in an actively venting gas hydrate field near Sado Island, Japan Sea: interpretation of halogen and 129I distributions. Chemical Geology, 236(3):350–366. https://doi.org/
Torres, M.E., Hong, W.-L., Solomon, E.A., Milliken, K., Kim, J.-H., Sample, J.C., Teichert, B.M.A., and Wallmann, K., 2020. Silicate weathering in anoxic marine sediment as a requirement for authigenic carbonate burial. Earth-Science Reviews, 200:102960. https://doi.org/
Wallmann, K., Aloisi, G., Haeckel, M., Tishchenko, P., Pavlova, G., Greinert, J., Kutterolf, S., and Eisenhauer, A., 2008. Silicate weathering in anoxic marine sediments. Geochimica et Cosmochimica Acta, 72(12):2895–2918. https://doi.org/
Zijderveld, J.D.A., 1967. AC demagnetization of rocks: analysis of results. In Runcorn, S.K.C., Creer, K.M., and Collinson, D.W. (Eds.), Methods in Palaeomagnetism: Amsterdam (Elsevier), 254–286.