Planke, S., Berndt, C., Alvarez Zarikian, C.A., and the Expedition 396 Scientists
Proceedings of the International Ocean Discovery Program Volume 396
publications.iodp.org
https://doi.org/10.14379/iodp.proc.396.106.2023
Sites U1569 and U15701
![]() S. Planke,
S. Planke,
![]() C. Berndt,
C. Berndt,
![]() C.A. Alvarez Zarikian,
C.A. Alvarez Zarikian,
![]() A. Agarwal,
A. Agarwal,
![]() G.D.M. Andrews,
G.D.M. Andrews,
![]() P. Betlem,
P. Betlem,
![]() J. Bhattacharya,
J. Bhattacharya,
![]() H. Brinkhuis,
H. Brinkhuis,
![]() S. Chatterjee,
S. Chatterjee,
![]() M. Christopoulou,
M. Christopoulou,
![]() V.J. Clementi,
V.J. Clementi,
![]() E.C. Ferré,
E.C. Ferré,
![]() I.Y. Filina,
I.Y. Filina,
![]() J. Frieling,
J. Frieling,
![]() P. Guo,
P. Guo,
![]() D.T. Harper,
D.T. Harper,
![]() M.T. Jones,
M.T. Jones,
![]() S. Lambart,
S. Lambart,
![]() J. Longman,
J. Longman,
![]() J.M. Millett,
J.M. Millett,
![]() G. Mohn,
G. Mohn,
![]() R. Nakaoka,
R. Nakaoka,
![]() R.P. Scherer,
R.P. Scherer,
![]() C. Tegner,
C. Tegner,
![]() N. Varela,
N. Varela,
![]() M. Wang,
M. Wang,
![]() W. Xu,
W. Xu,
![]() S.L. Yager2
S.L. Yager2
1 Planke, S., Berndt, C., Alvarez Zarikian, C.A., Agarwal, A., Andrews, G.D.M., Betlem, P., Bhattacharya, J., Brinkhuis, H., Chatterjee, S., Christopoulou, M., Clementi, V.J., Ferré, E.C., Filina, I.Y., Frieling, J., Guo, P., Harper, D.T., Jones, M.T., Lambart, S., Longman, J., Millett, J.M., Mohn, G., Nakaoka, R., Scherer, R.P., Tegner, C., Varela, N., Wang, M., Xu, W., and Yager, S.L., 2023. Sites U1569 and U1570. In Planke, S., Berndt, C., Alvarez Zarikian, C.A., and the Expedition 396 Scientists, Mid-Norwegian Margin Magmatism and Paleoclimate Implications. Proceedings of the International Ocean Discovery Program, 396: College Station, TX (International Ocean Discovery Program). https://doi.org/10.14379/iodp.proc.396.106.2023
2 Expedition 396 Scientists’ affiliations.
1. Background and objectives
Site U1569 and the ribbon of four boreholes that comprise Site U1570 are located on the Mimir High at a 2171–2270 m water depth. Mimir High is a transform margin high on the Vøring Transform Margin (see Figure F1 in the Site U1565 chapter [Planke et al., 2023b]). Transform margin highs are characteristic structural elements of transform margins found, for example, offshore Ghana/Côte d’Ivoire, Western Australia, and the Falkland Margin (Basile and Allemand, 2002; Mercier de Lépinay et al., 2016; Baby et al., 2018; Lorenzo and Wessel, 1997). They are characterized by very narrow ocean continent boundaries and late uplift of the continental crust when the adjacent spreading center passes. Several processes are involved in the formation of transform margin highs. They include differential thermal subsidence, lateral heat transport, and possibly associated lithospheric erosion contributing to this uplift, as well as erosion-enhanced uplift (Vågnes, 1997; Basile and Allemand, 2002).
The Vøring Transform Margin is characterized by diminished breakup-related extrusive volcanism compared to the juxtaposed rifted margin segments of the Vøring and Møre Margins (Berndt et al., 2001a). Nevertheless, thin extrusive basalts, intrusions, and a high-velocity lower crustal body have also been documented for the Vøring Transform Margin (Gernigon et al., 2021; Mjelde et al., 2009). The reduced magmatic crustal thickening may be the result of lateral heat transport from the rifted Møre Margin into the continental Vøring Basin to the north lowering the ambient mantle temperature and resulting in reduced melt supply (Berndt et al., 2001b). As a result, the basalt cover on the Vøring Transform Margin is generally thin and even absent on the Mimir High (Figure F1). However, an erosional truncation at the top of the high does not preclude the possibility that they originally existed and were eroded at the time of transform margin high uplift.
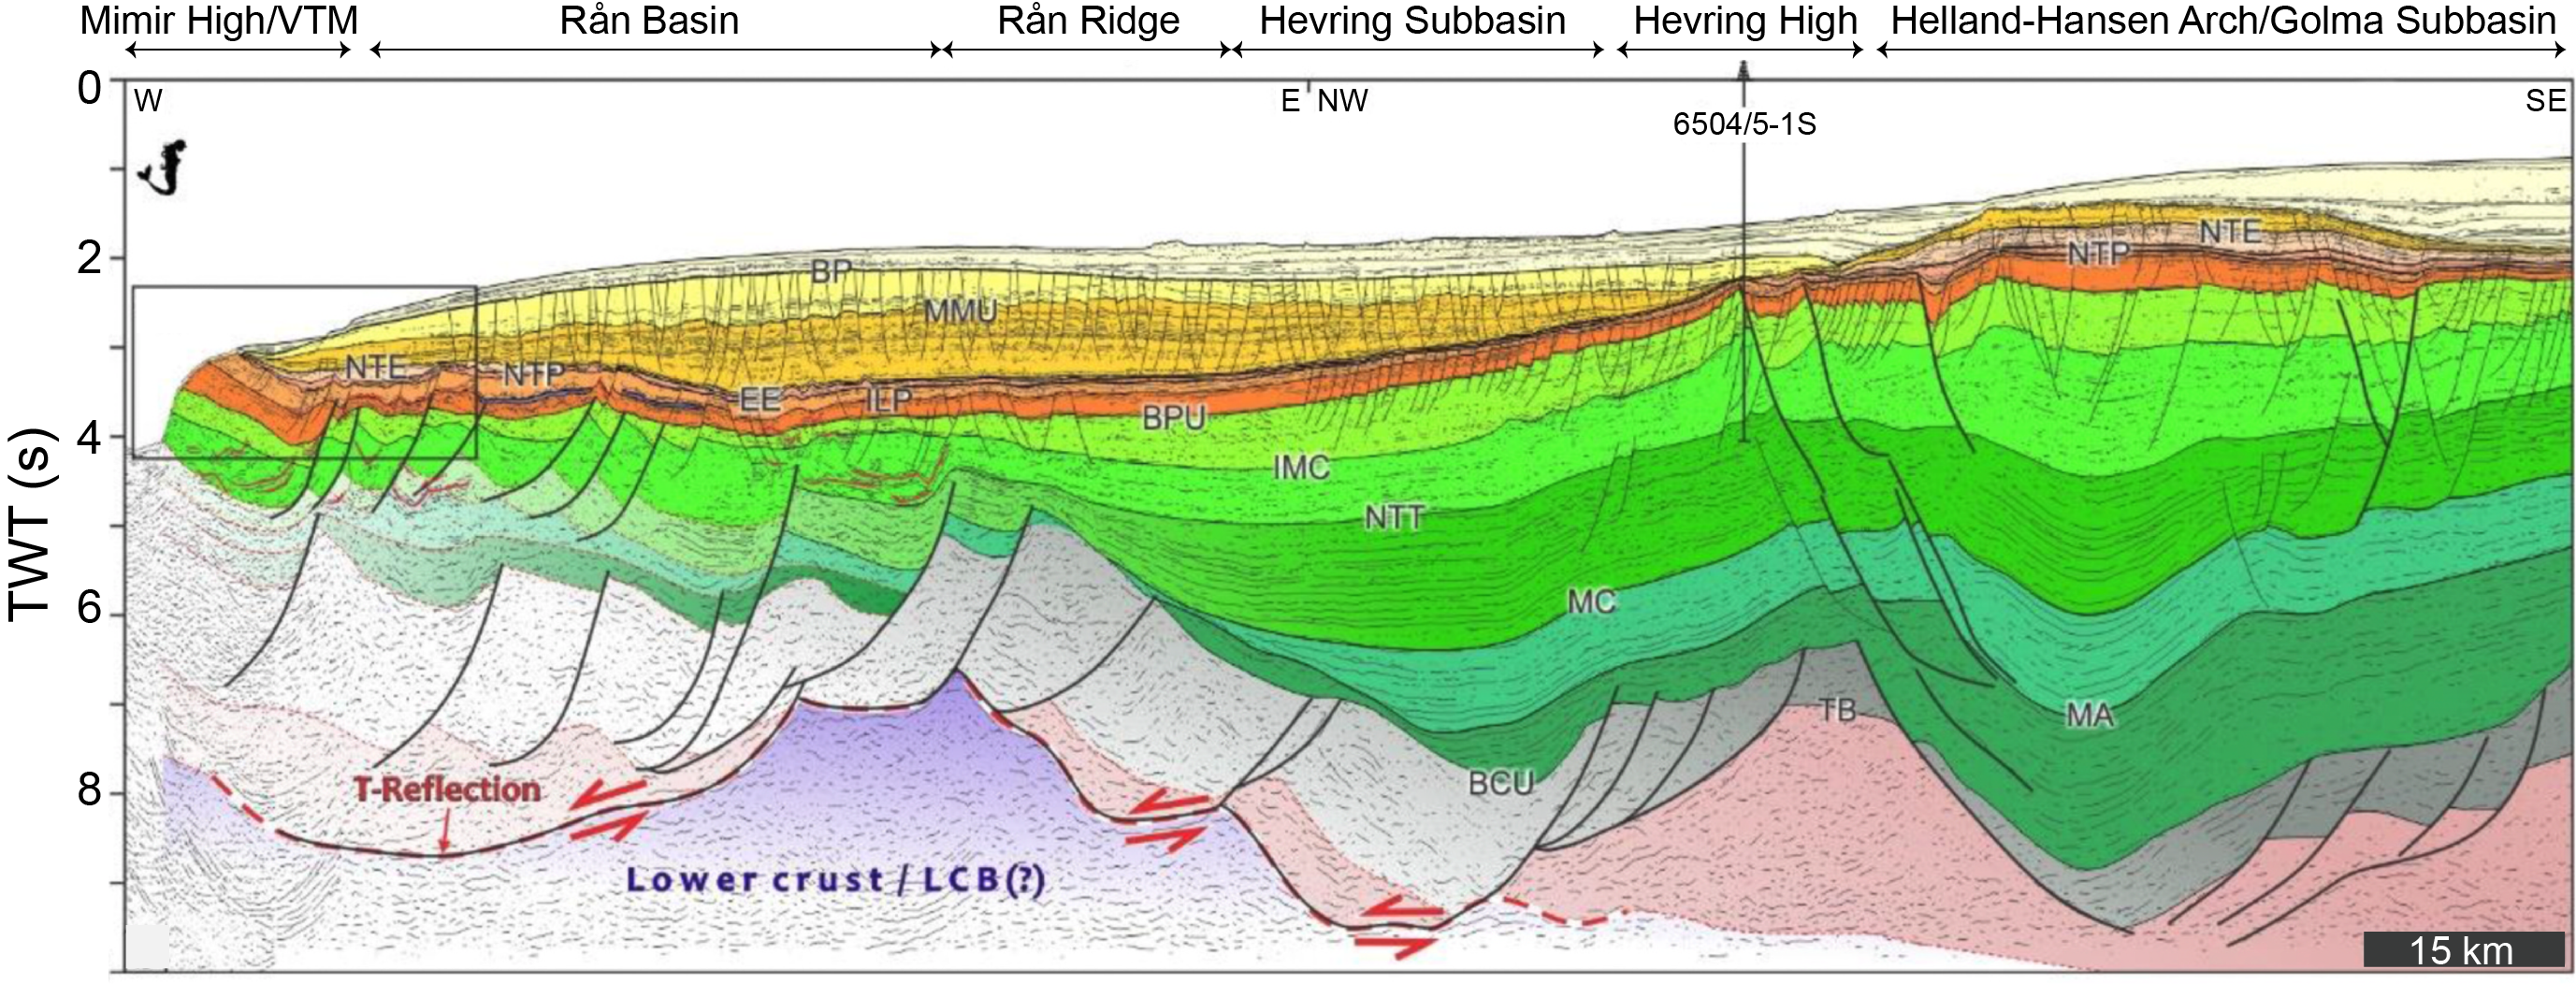
Figure F1. Crustal transect from Mimir High through Vøring Basin.
The absence of the basalt cover makes the Mimir High an exceptional place to study the stratigraphic successions below the breakup basalts and the effects of sill intrusions. The closest wells (i.e., 6504/5-15 and 6603/5-16) are more than 100 km away, and the stratigraphy at the Vøring Transform Margin is not well defined. Most of the available information is from two seafloor sampling cruises conducted in 2000 and 2013 using gravity corers, dredges, and a remotely operated vehicle (Polteau et al., 2020). The samples document Upper Cretaceous to Lower Eocene successions and outcropping doleritic sills with columnar jointing. The recovered late Campanian and early Maastrichtian sediments were deposited in a coastal to shallow marine setting, whereas the Paleocene samples indicate deep marine conditions with abrupt shoaling and formation of the Mimir High in the Early Eocene. Seismic data clearly show several large sill intrusions that affected this part of the margin and that the strata generally dips from the Mimir High to the northeast (Figure F2).
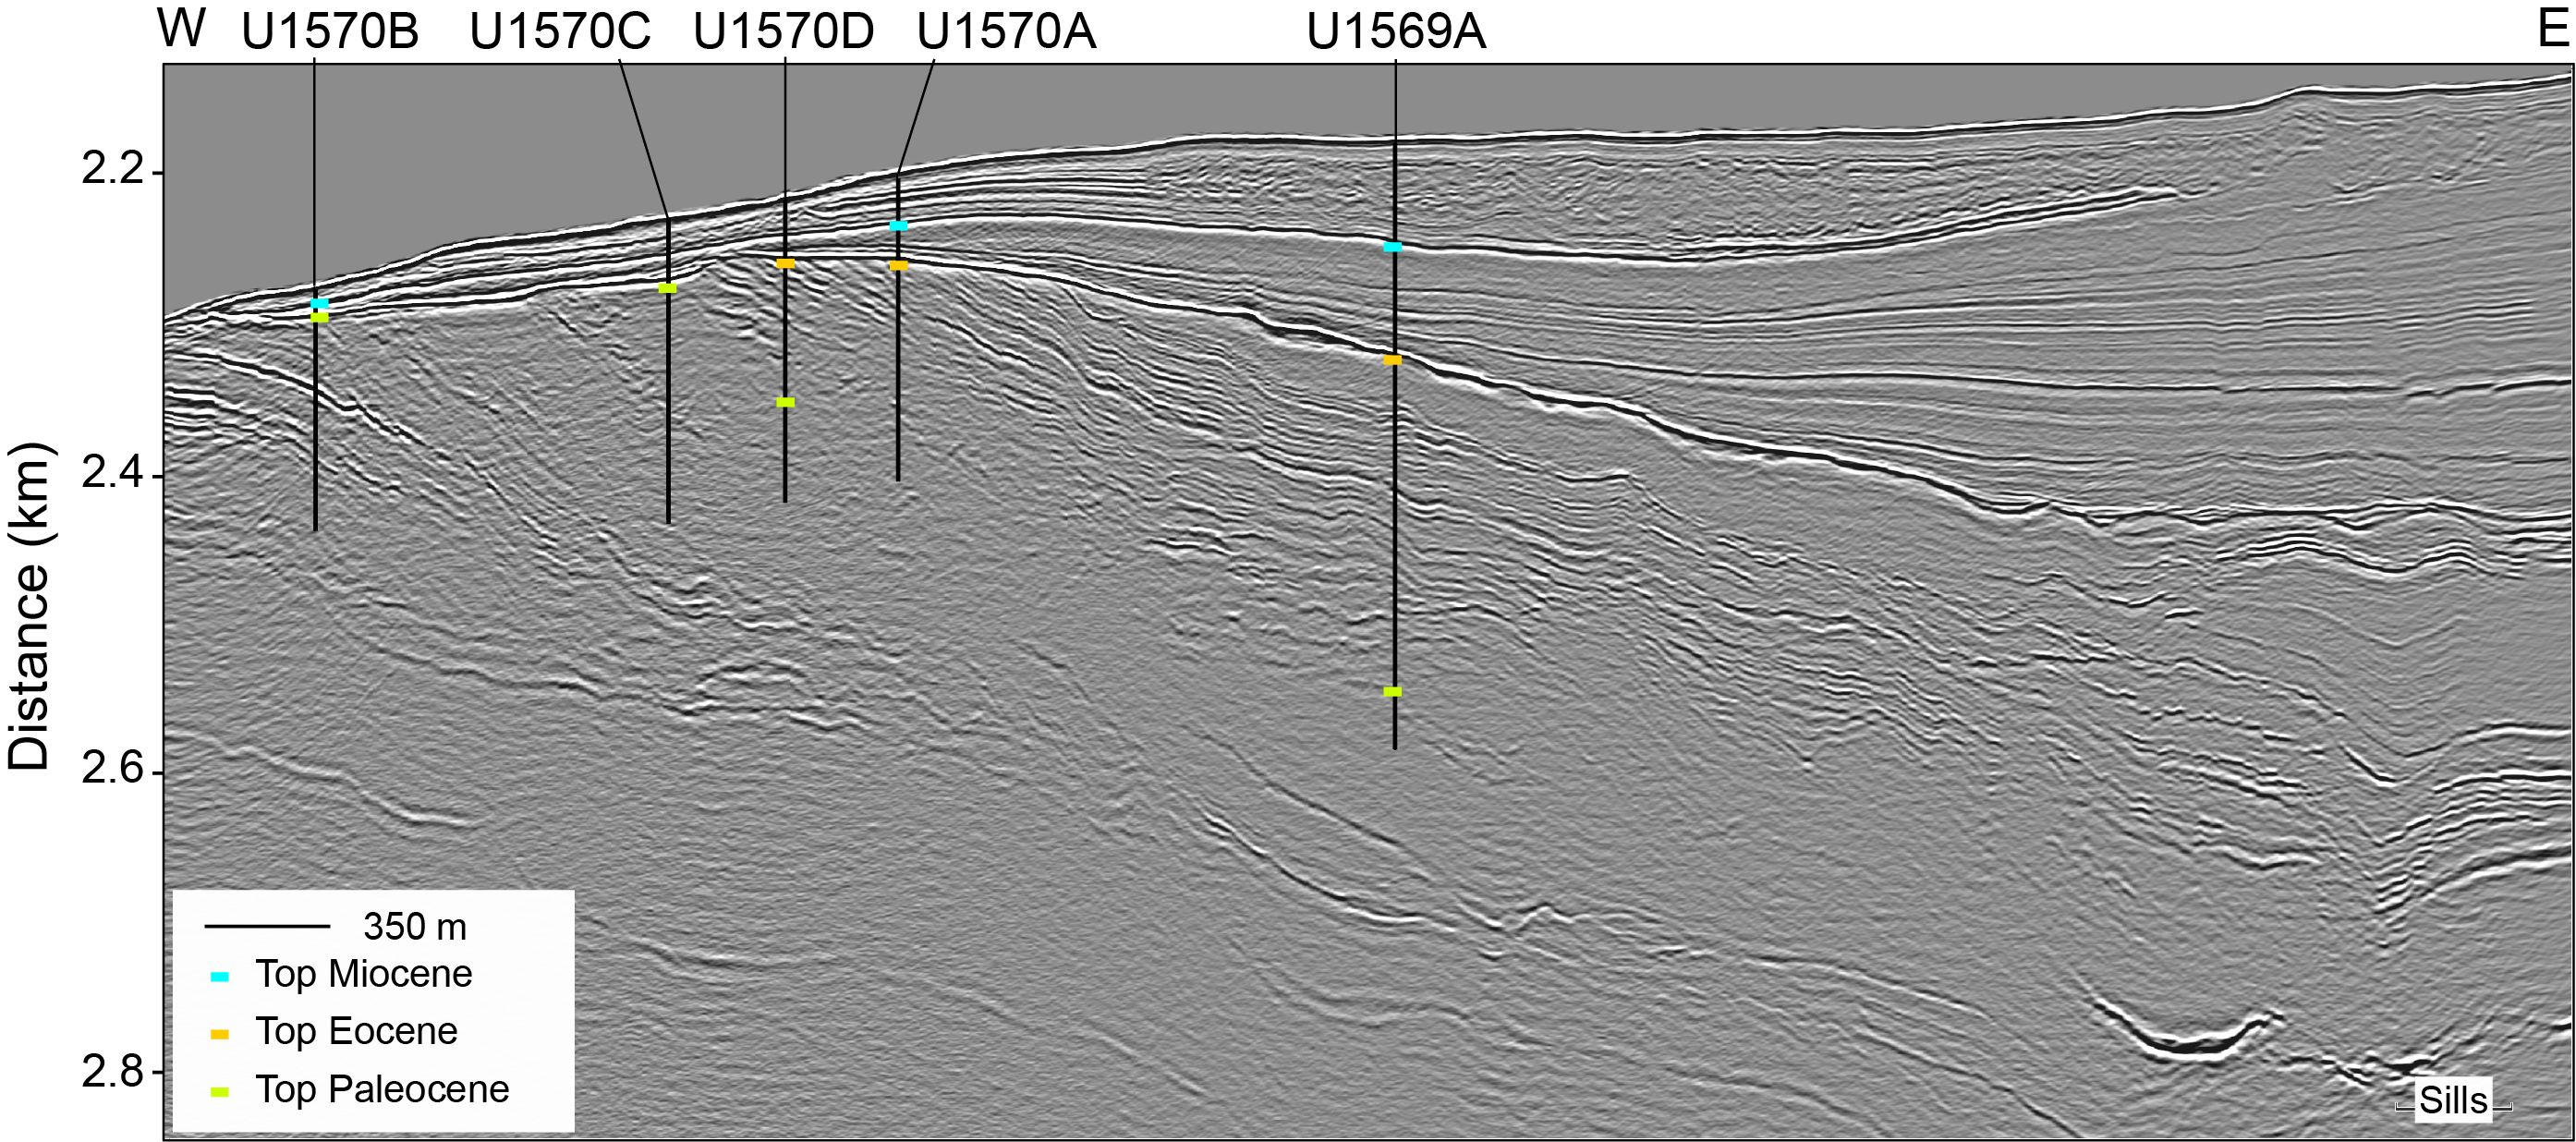
Figure F2. Depth-converted line through Mimir High seismic cube.
The first objective of Sites U1569 and U1570 was to confirm the stratigraphy and tie it in with reflection seismic data to constrain the vertical movements of this margin segment as an input for geodynamic melt production models. In particular, the timing of uplift and any further constraints on the amount of crustal stretching are important.
The second objective of Sites U1569 and U1570 was to constrain the paleoenvironmental conditions during the Paleocene–Eocene Thermal Maximum (PETM). Seismic interpretation suggests that the Mimir High was a depocenter during the Eocene, and we expected to encounter an expanded section of Paleocene and Eocene sediments, including the PETM. In particular, we hoped to obtain further constraints on the timing, duration, and environmental changes due to rapid warming and subsequent cooling during the Eocene. Because the seismic data show vent systems similar to those at Sites U1567 and U1568 at the foot of the Mimir High, it seemed likely that any PETM section at Sites U1569 and U1570 also recorded the nearfield geochemical signatures of venting (e.g., signs for changes in pH and vent ejecta).
The third objective of Sites U1569 and U1570 was to characterize the Cretaceous and Paleogene sediments and their potential for releasing hydrocarbons when intruded by sills. Here, the key parameter is the amount of total organic carbon (TOC) in the sediments that may be transformed to greenhouse gases by contact metamorphosis.
In the case that any sill intrusions should be sampled by drilling at the sites, a further objective was to constrain the melting conditions. This includes the composition of the magma host rock and in particular the temperatures at which melting took place. However, in the absence of unequivocal seismic observations that would indicate the presence of sills, reaching this last objective seemed unlikely.
2. Operations
2.1. Site U1569
The original plan for Site U1569 called for dual coring of key stratigraphic intervals including a hole to 300 meters below seafloor (mbsf) to be cored using the advanced piston corer (APC) and extended core barrel (XCB) systems and a second hole to 800 mbsf to be cored using the rotary core barrel (RCB) system. In case we could not properly sample the complete stratigraphic target at Site U1569, four offset holes of 200 m each were proposed along a transect of outcropping strata extending west of Site U1569, where deep stratigraphic targets are present at shallower subseafloor depths, as an alternative drilling strategy.
Hole U1569A was cored to the shortened depth of 404.6 mbsf. Coring ended at 0130 h (all times are provided in UTC + 0 h) on 30 August 2021 after reaching our scientific target and penetrating 50 m into the Late Paleocene. We estimate that the base of the Paleocene could be much deeper, and to improve core recovery of the Paleocene/Eocene boundary we ended coring in Hole U1569A in favor of sampling the older strata at a much shallower depth at Site U1570. Coring the PETM strata at a shallower location also allowed us to sample less mature PETM sediments with better microfossil preservation. After conditioning the hole for logging, the RCB bit was dropped at the bottom of Hole U1569A, the hole was displaced with 125 bbl of 10.5 lb/gal mud, and the end of the pipe was set at 84.0 mbsf. The triple combination (triple combo) tool string was rigged up and deployed to log Hole U1569A. The initial logging run failed to pass a bridge at 127.4 mbsf. With very little open hole to log, the tools were pulled back to the surface and logging operations were terminated. After the conclusion of logging, the drill string was pulled back to the surface. The remaining top half of the mechanical bit release (MBR) cleared the rotary table at 2220 h, ending Hole U1569A and Site U1569. A total of 74.25 h or 3.1 days were recorded at Site U1569. A total of 44 RCB cores were retrieved from the site, 5 of which were half-length advances. The RCB system was used to core 404.6 m, and 144.91 m of core was recovered (36%) (Table T1).
2.1.1. Hole U1569A
The rig floor was cleared for operations at 1759 h on 27 August 2021, and the crew began to make up the RCB bottom-hole assembly (BHA). By 2015 h, a 172.1 m BHA was assembled with the RCB C-4 bit. An MBR was installed above the bit. A precision depth recorder (PDR) reading estimated a water depth of 2182.4 meters below rig floor (mbrf) (2171.1 meters below sea level [mbsl]). The rig crew lowered the drill pipe to 2163.0 mbrf (2151.7 mbsl), filling it with water every 20 stands. Before beginning coring operations, the drilling equipment was serviced. The top drive was picked up and spaced out to spud Hole U1569A. A dressed nonmagnetic RCB core barrel was dropped and pumped down to land in the outer core barrel. Hole U1569A was spudded at 0245 h on 28 August. The PDR water depth appeared to match the driller’s tag depth and was used for the official water depth for the hole.
RCB coring continued with full core advances from the seafloor through Core 396-U1569A-30R at 293.1 mbsf. Cores 31R–34R were drilled with half-length advances to improve recovery. From 322.5 mbsf to the hole’s total depth of 404.6 mbsf, full advances were used for coring. Hole U1569A was ended after Core 44R was obtained. The final core for Hole U1569A was on deck at 0320 h on 30 August. The RCB core barrels were secured. The hole was swept clean of cuttings with a 50 bbl sweep of high-viscosity mud. After circulating the mud through the hole, the rotary shifting tool (RST) was run in on the coring line to release the RCB C-4 coring bit. The bit was released, and the RST was run again to reposition the bit shifting sleeve back to the circulating position in the MBR. After shifting the sleeve in the MBR, the RST was pulled back to the surface and the sinker bars were removed. The volume of the hole was displaced with 125 bbl of 10.5 lb/gal mud. The drill string was pulled back to 361.6 mbsf with the top drive installed. High torque was experienced at the bottom of the hole before pulling pipe. The top drive was set back, and the drill string was pulled back to 84 mbsf. The rig floor personnel and the Schlumberger engineer met to review safety issues surrounding the upcoming logging operations, and the rig floor was rigged up for downhole logging.
Our first logging run consisted of the triple combo tool string. A downhole log was performed from just above the seafloor to 127.4 mbsf, where an obstruction was encountered. After numerous unsuccessful attempts to break through, logging was terminated. The tools were back at the surface at 1400 h and were rigged down by 1505 h on 30 August. No damage was found to any of the logging tools from the single deployed tool string. The logging equipment was secured on the rig floor for tripping operations. The drilling knobbies were removed from the drill string, and it was pulled out of the hole to 2145 mbrf (2133.7 mbsl), clearing the seafloor at 1554 h. The pipe trip was halted to perform a routine slip and cut of the drilling line. At 1800 h, the pipe trip to the surface resumed.
The transit to Site U1570 began under dynamic positioning (DP) mode while the drill string was being recovered after the failed logging activity at Site U1569. The distance between sites is approximately 1514 m, and the vessel was in position over the new hole coordinates at 2038 h on 30 August, before the drill string was retrieved. The four stands of drill collars were racked back in the derrick, and the outer core barrel components were disassembled, inspected, and laid out. The top half of the MBR cleared the rig floor at 2220 h, ending Site U1569. The time spent on Hole U1569A was 74.25 h or 3.1 days.
2.2. Site U1570
The coring plan at Site U1570 was the same for all four holes: core to 200 mbsf and sample the Paleocene/Eocene boundary interval at considerably shallower depths than at Site U1569. Three of the four holes were completed to 200 mbsf, and one was terminated at 163.6 mbsf after we determined that the science objective for the hole had been met. All four holes were drilled with the RCB coring system with a combination of half-length (4.6 m) and full-length (9.6 m) advances. The half-length advances were used to maximize core recovery in zones of interest at the expense of the additional wireline time. Coring in the final hole (U1570D) was ended after reaching the Environmental Protection and Safety Panel (EPSP) approved depth of 200 mbsf. After conditioning Hole U1570D for wireline logging, the RCB bit was released at the bottom of the hole and the end of pipe was set at 76.0 mbsf. The triple combo and the Formation MicroScanner (FMS)-sonic tool strings were successfully deployed to the full depth of the hole. After the conclusion of logging, the drill string was pulled back to the surface. The BHA was racked back in the derrick, and the outer core barrel was disassembled and inspected. The rig floor was secured at 2348 h on 5 September 2021, and the bridge was notified that operations were complete at Site U1570. A total of 112 RCB cores were taken at the site. The RCB system was used to core 763.6 m, and 270.09 m of core was recovered (35.4%). A total of 147.50 h or 6.2 days were recorded while at Site U1570 (Table T2).
2.2.1. Hole U1570A
Coring operations in Hole U1570A began at 2220 h on 30 August 2021 at 2196.1 mbsl. The rig crew finished inspecting the outer core barrel components and began to make up the RCB BHA with a new MBR and bit. By 0000 h on 31 August, the 172.1 m BHA was assembled. A PDR for the site indicated an estimated water depth of 2207.7 mbrf. The rig crew lowered the drill pipe to 2164 mbrf, filling the drill pipe with water every 20 stands. The top drive was picked up and spaced out to spud Hole U1570A. A dressed nonmagnetic RCB core barrel was dropped and pumped down to land in the outer core barrel. Hole U1570A was spudded at 0620 h on 31 August. The PDR water depth matched the driller’s tag depth and was used for the official water depth for Hole U1570A.
RCB coring continued with full-length core advances from the seafloor to 54.5 mbsf (Core 396-U1570A-6R). Cores 7R–36R were cored with half-length advances to improve recovery. Hole U1570A was terminated at the EPSP approved depth of 200.0 mbsf after Core 36R. The final core for Hole U1570A was on deck at 1035 h on 1 September. The RCB core barrels were secured. The drilling knobbies were removed from the drill string, and it was pulled up with the top drive still installed to 160.3 mbsf. The top drive was set back, and the bit was raised clear of the seafloor at 1159 h on 1 September, ending Hole U1570A. The bit was then raised to 2151.7 mbsl, and the vessel was moved in DP mode 1760 m west to Hole U1570B along the EPSP approved ribbon that defined the boundaries of Site U1570. The time spent on Hole U1570A was 39.75 h or 1.7 days.
2.2.2. Hole U1570B
While transiting to Hole U1570B, the top drive was picked up and the drilling equipment was serviced. The bit was spaced out to spud Hole U1570B, and a dressed nonmagnetic RCB core barrel was dropped and pumped down to land in the outer core barrel. The second hole at the site was spudded at 1610 h on 1 September 2021 at a PDR depth of 2270.9 mbsl, and coring continued until 2345 h on 2 September. Cores 1R–25R were drilled from the seafloor to 163.6 mbsf, and 71.42 m of material was recovered (43.7%). Hole U1570B was terminated after the coring objective was completed. Cores 5R–20R were cored with half-length advances to improve core recovery. After coring ended, the top drive was set back and the bit was pulled clear of the seafloor at 0100 h on 3 September, ending Hole U1570B. The bit was raised to 2197 mbsl, and the vessel moved east in DP mode to Hole U1570C. The time spent on Hole U1570B was 37.0 h or 1.5 days.
2.2.3. Hole U1570C
At 0234 h on 3 September 2021, the vessel had moved 1075 m east to Hole U1570C. A reading with the PDR estimated a water depth of 2225.1 mbsl. The hole was spudded at 0405 h, and the PDR water depth matched the driller’s tagged depth; it was therefore used for the official water depth for the hole. RCB coring continued with full core advances from the seafloor through Core 7R at 63.7 mbsf. Cores 8R–11R were drilled with half-length advances to 83.6 mbsf to improve recovery. Cores 12R–23R were full-length advance RCB cores to 200.0 mbsf. Hole U1570C was terminated at the EPSP approved depth of 200.0 mbsf after Core 23R was cut. The final core for Hole U1570C was on deck at 2310 h on 3 September. The total core recovered was 49.6 m (recovery = 25%). After the final core was retrieved, the drill string was raised, clearing the seafloor at 0030 h on 4 September and ending Hole U1570C. The bit was pulled back to 2196.7 mbsl, and the drilling knobbies were installed through the guide horn. The vessel was moved 350 m east in DP mode to Hole U1570D, which was positioned approximately halfway between Holes U1570A and U1570C. The time spent on Hole U1570C was 23.50 h or 1.0 days.
2.2.4. Hole U1570D
Hole U1570D began at 0030 h on 4 September 2021 when the bit cleared the seafloor from Hole U1570C. A PDR for the hole indicated an estimated water depth of 2208.1 mbrf. After arriving at Hole U1570D, the top drive was picked up. The bit was spaced out, and a dressed nonmagnetic RCB core barrel was dropped and pumped down to land in the outer core barrel. Hole U1570D was spudded at 0250 h on 4 September. The official water depth for Hole U1570D was a driller’s tagged depth of 2207.7 mbsl.
RCB coring continued with full core advances from the seafloor through Core 396-U1570D-9R at 80.9 mbsf. Cores 10R–23R were cored with half-length advances to 149.2 mbsf to improve recovery. Cores 24R–26R were taken with full-length advances using the RCB system to 200.0 mbsf. The final core for Hole U1570D, Core 28R, was on deck at 0230 h on 5 September. The RCB core barrels were secured. The hole was swept clean of cuttings with a 50 bbl sweep of high-viscosity mud and then displaced with 65 bbl of 10.5 lb/gal mud. The top drive was set back, and the drill string was pulled back to 76.0 mbsf for wireline logging. After positioning the end of the pipe with knobbies through the guide horn, the rig floor was rigged up for logging. The rig floor personnel and the Schlumberger engineer held a toolbox meeting to review safety issues surrounding the upcoming logging operations.
Our first logging run consisted of the triple combo tool string with the Magnetic Susceptibility Sonde (MSS). The tools were assembled, tested, and deployed at 0820 h on 5 September. A down log was performed from just above the seafloor to almost the full depth of the hole (~199.8 mbsf). The hole was logged up for a full-length open hole calibration pass, the tools were run back to the bottom, and the hole was logged up with the modified triple combo tool string through the drill string to the seafloor. The caliper was closed prior to entering the drill string. The tools were at the surface at 1220 h and were rigged down by 1255 h on 5 September.
The second wireline logging string was the FMS-sonic tool, which was rigged up and ready to deploy at 1320 h. The tool string was lowered, and a down log with the FMS calipers closed began just above the seafloor to 199.3 mbsf. Natural gamma radiation (NGR) was logged through the drill pipe to identify the seafloor to match the depth results on the first logging run. The hole was at almost the same depth as the previous logging run. At total depth, the first up log was started and logged from 199.3 to ~116 mbsf with the FMS calipers open. The tools were run back to the bottom. The second up log was started, the calipers were opened, and the hole was logged to the seafloor. The calipers were closed just prior to entering the drill pipe. The tool string was pulled back to the surface and rigged down by 1715 h on 5 September. At 1815 h, all logging tools were rigged down and the logging wireline was secured. No damage was found to any of the logging tools from either of the tool strings.
The drilling knobbies were removed from the drill string, the drill string was pulled to the surface, and all drilling equipment was secured, ending Hole U1570D. The DP operator was notified that the drill floor was secured and that Hole U1570D operations were complete at 2348 h on 5 September. The thrusters were raised in preparation for departure and transit to the next site. The time spent on Hole U1570D was 47.25 h or 2.0 days.
3. Lithostratigraphy
Sites U1569 and U1570 consist of five holes on the northeastern flank of the Mimir High, a transform margin high. The holes sample outcropping stratigraphy along a 5 km transect where Paleogene-age seismic reflections truncate at the seafloor. The succession recovered at the two sites (Figure F3) is divided into 10 lithostratigraphic units (Table T3). As expected from the bedding dip and the horizontal unconformity evident in the seismic profile, none of the five holes includes all 10 units (see Figure F4 for detailed lithologic columns for each hole). Unit boundaries are identified based on lithologic change and supported by physical properties and biostratigraphy (see Lithostratigraphy in the Expedition 396 methods chapter [Planke et al., 2023a]). Where recovery is high, boundaries between units are well established. Where core recovery is low, unit boundaries are placed at the top of the underlying unit.
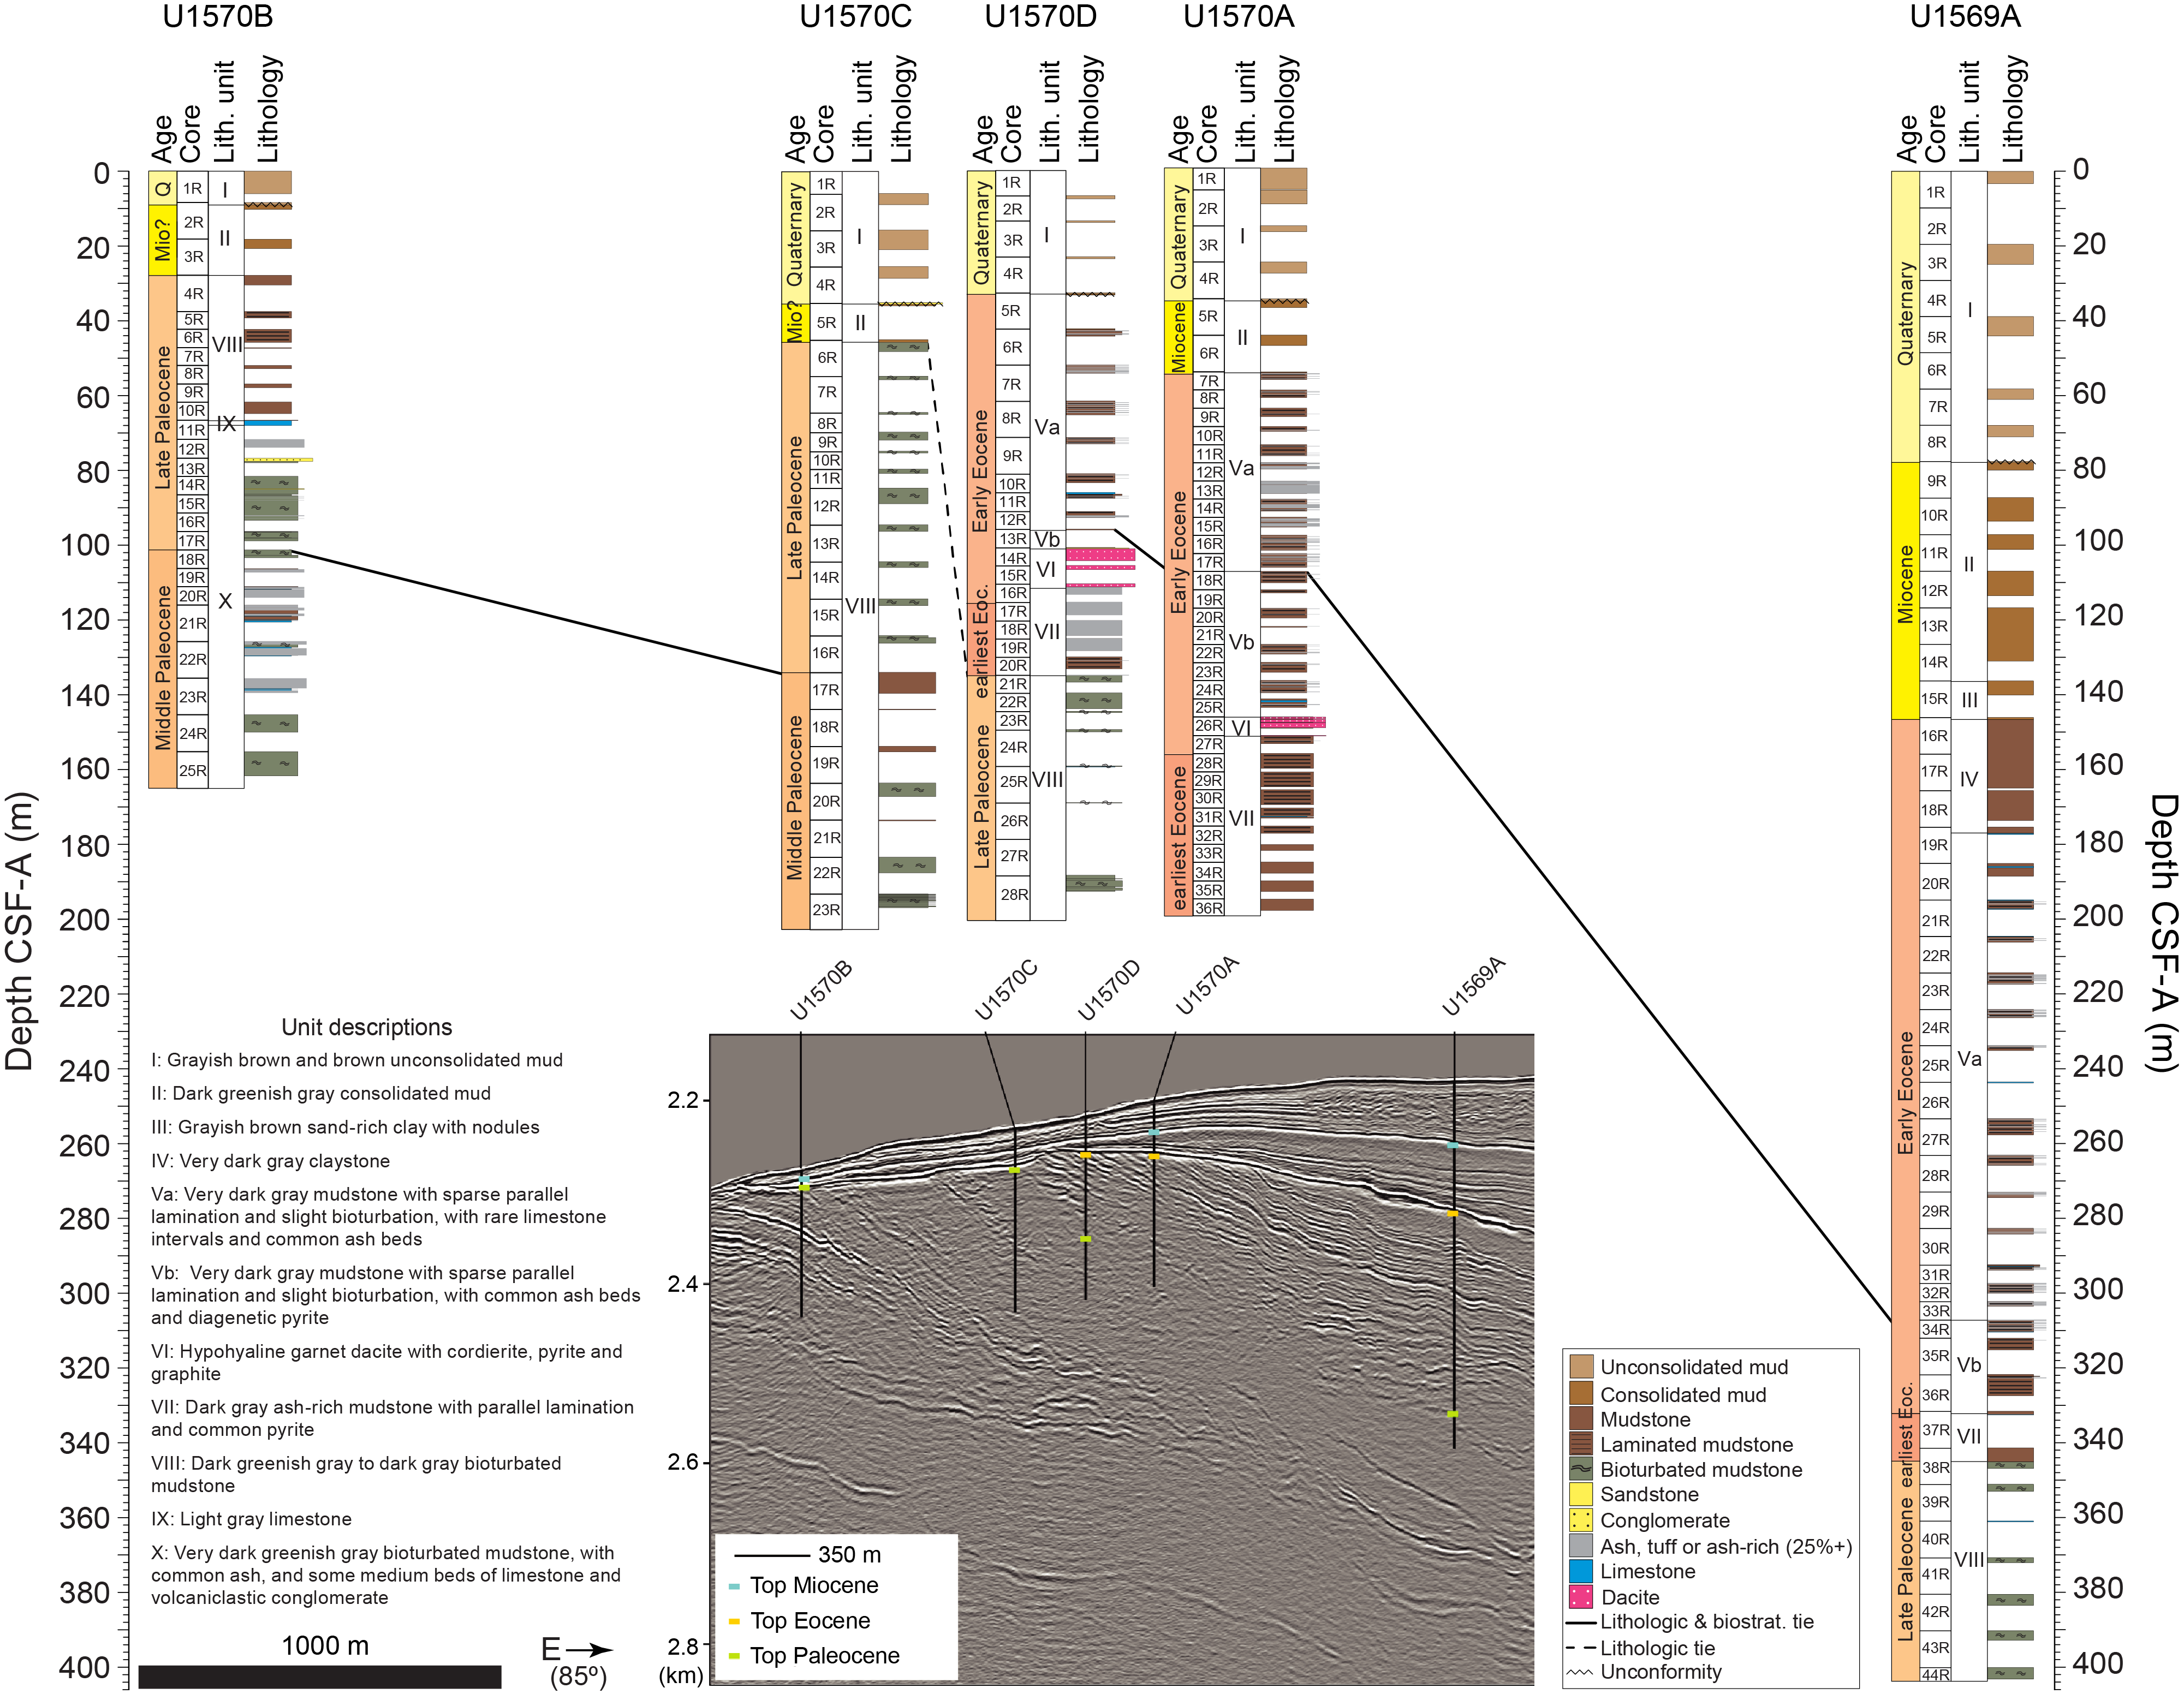
Figure F3. Lithostratigraphic summary.
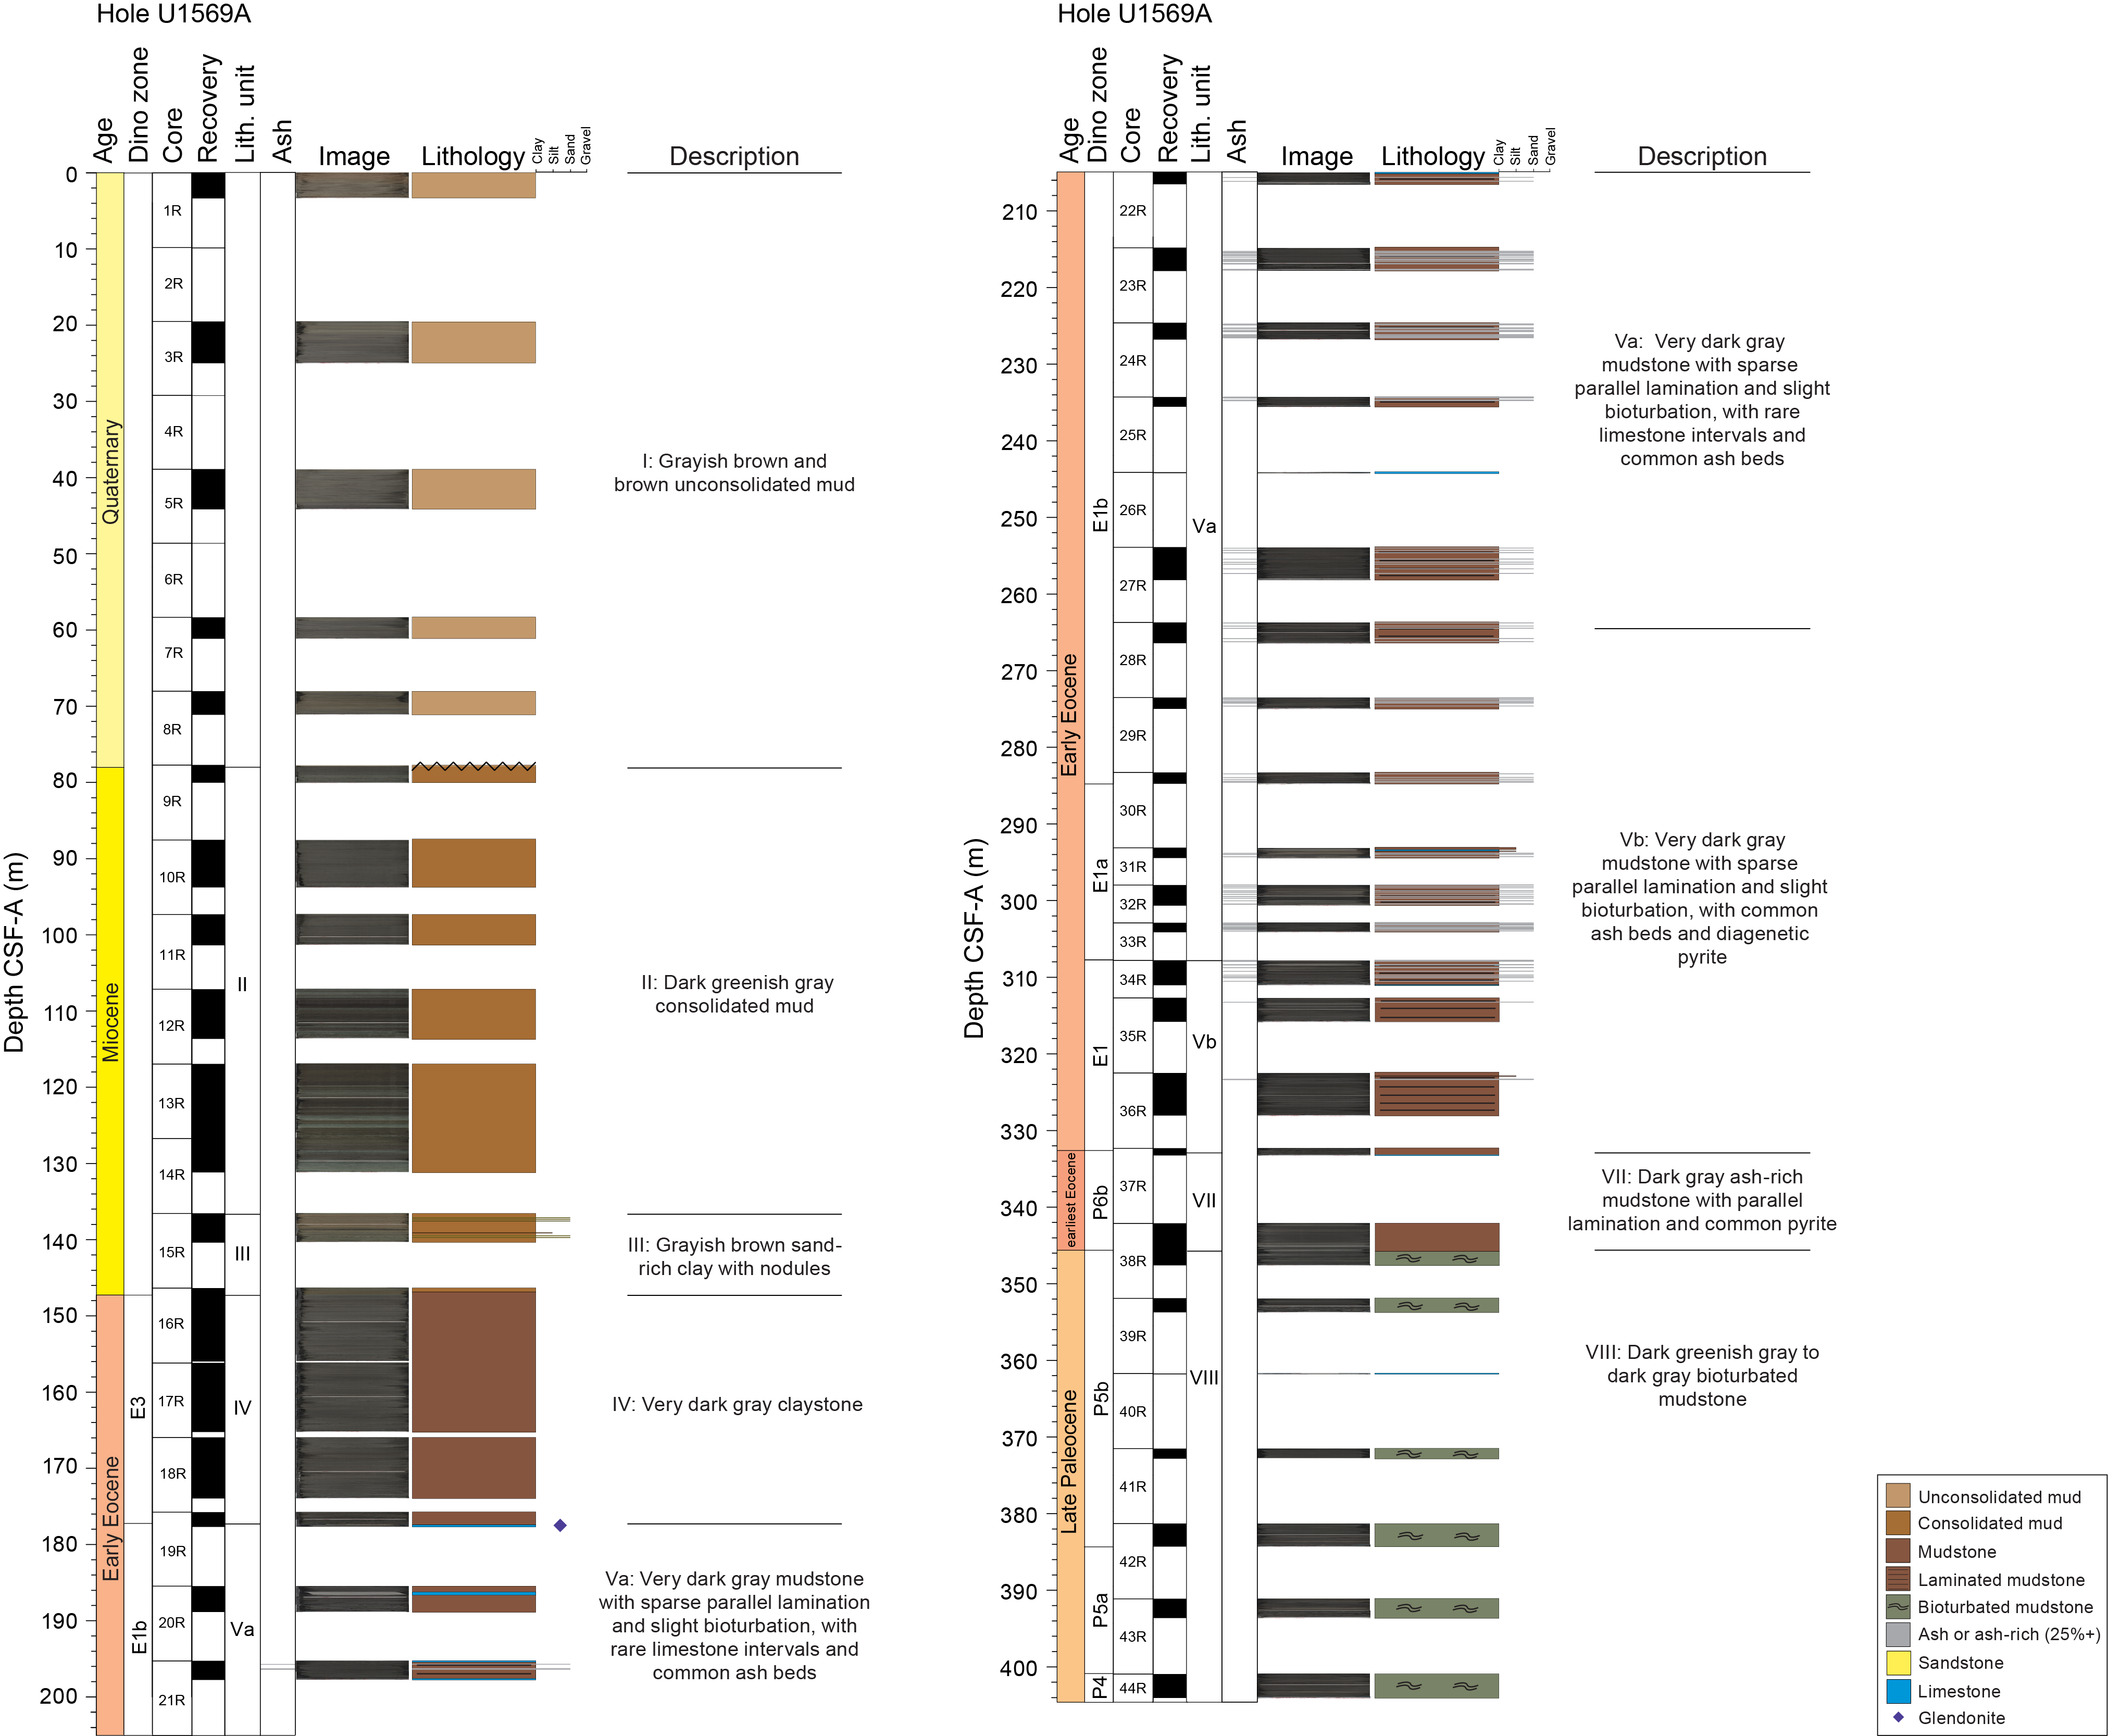
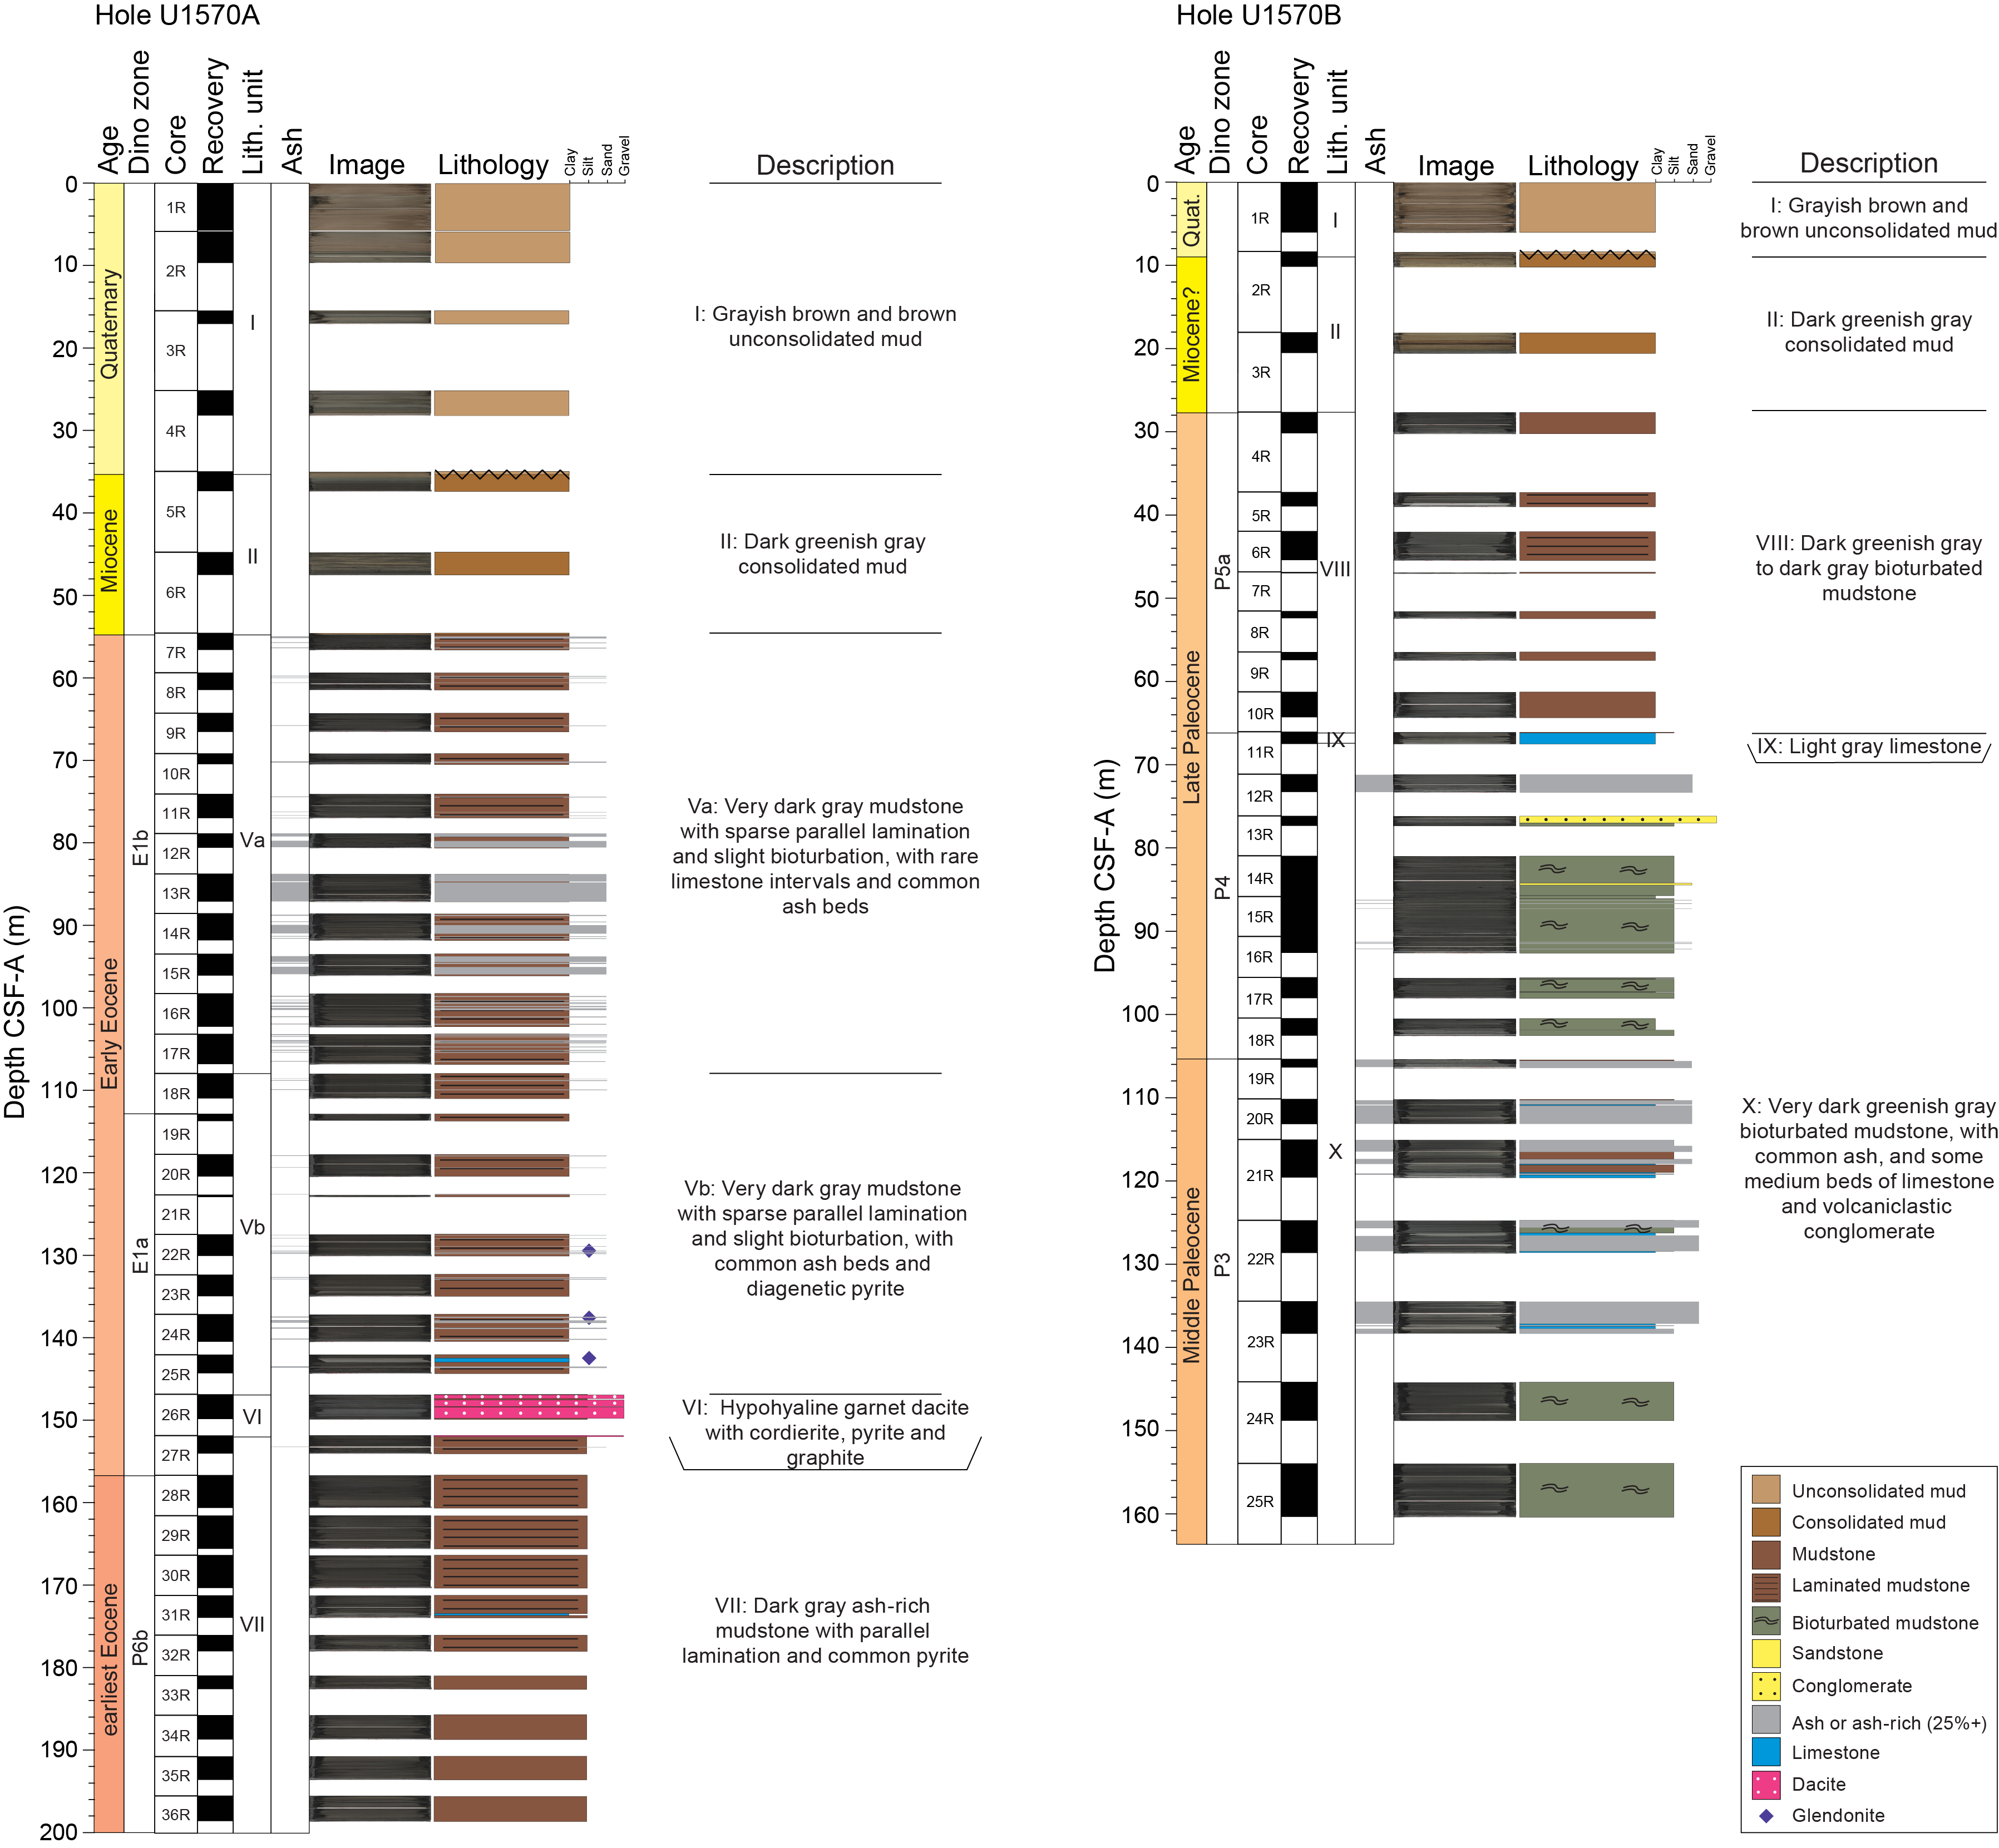
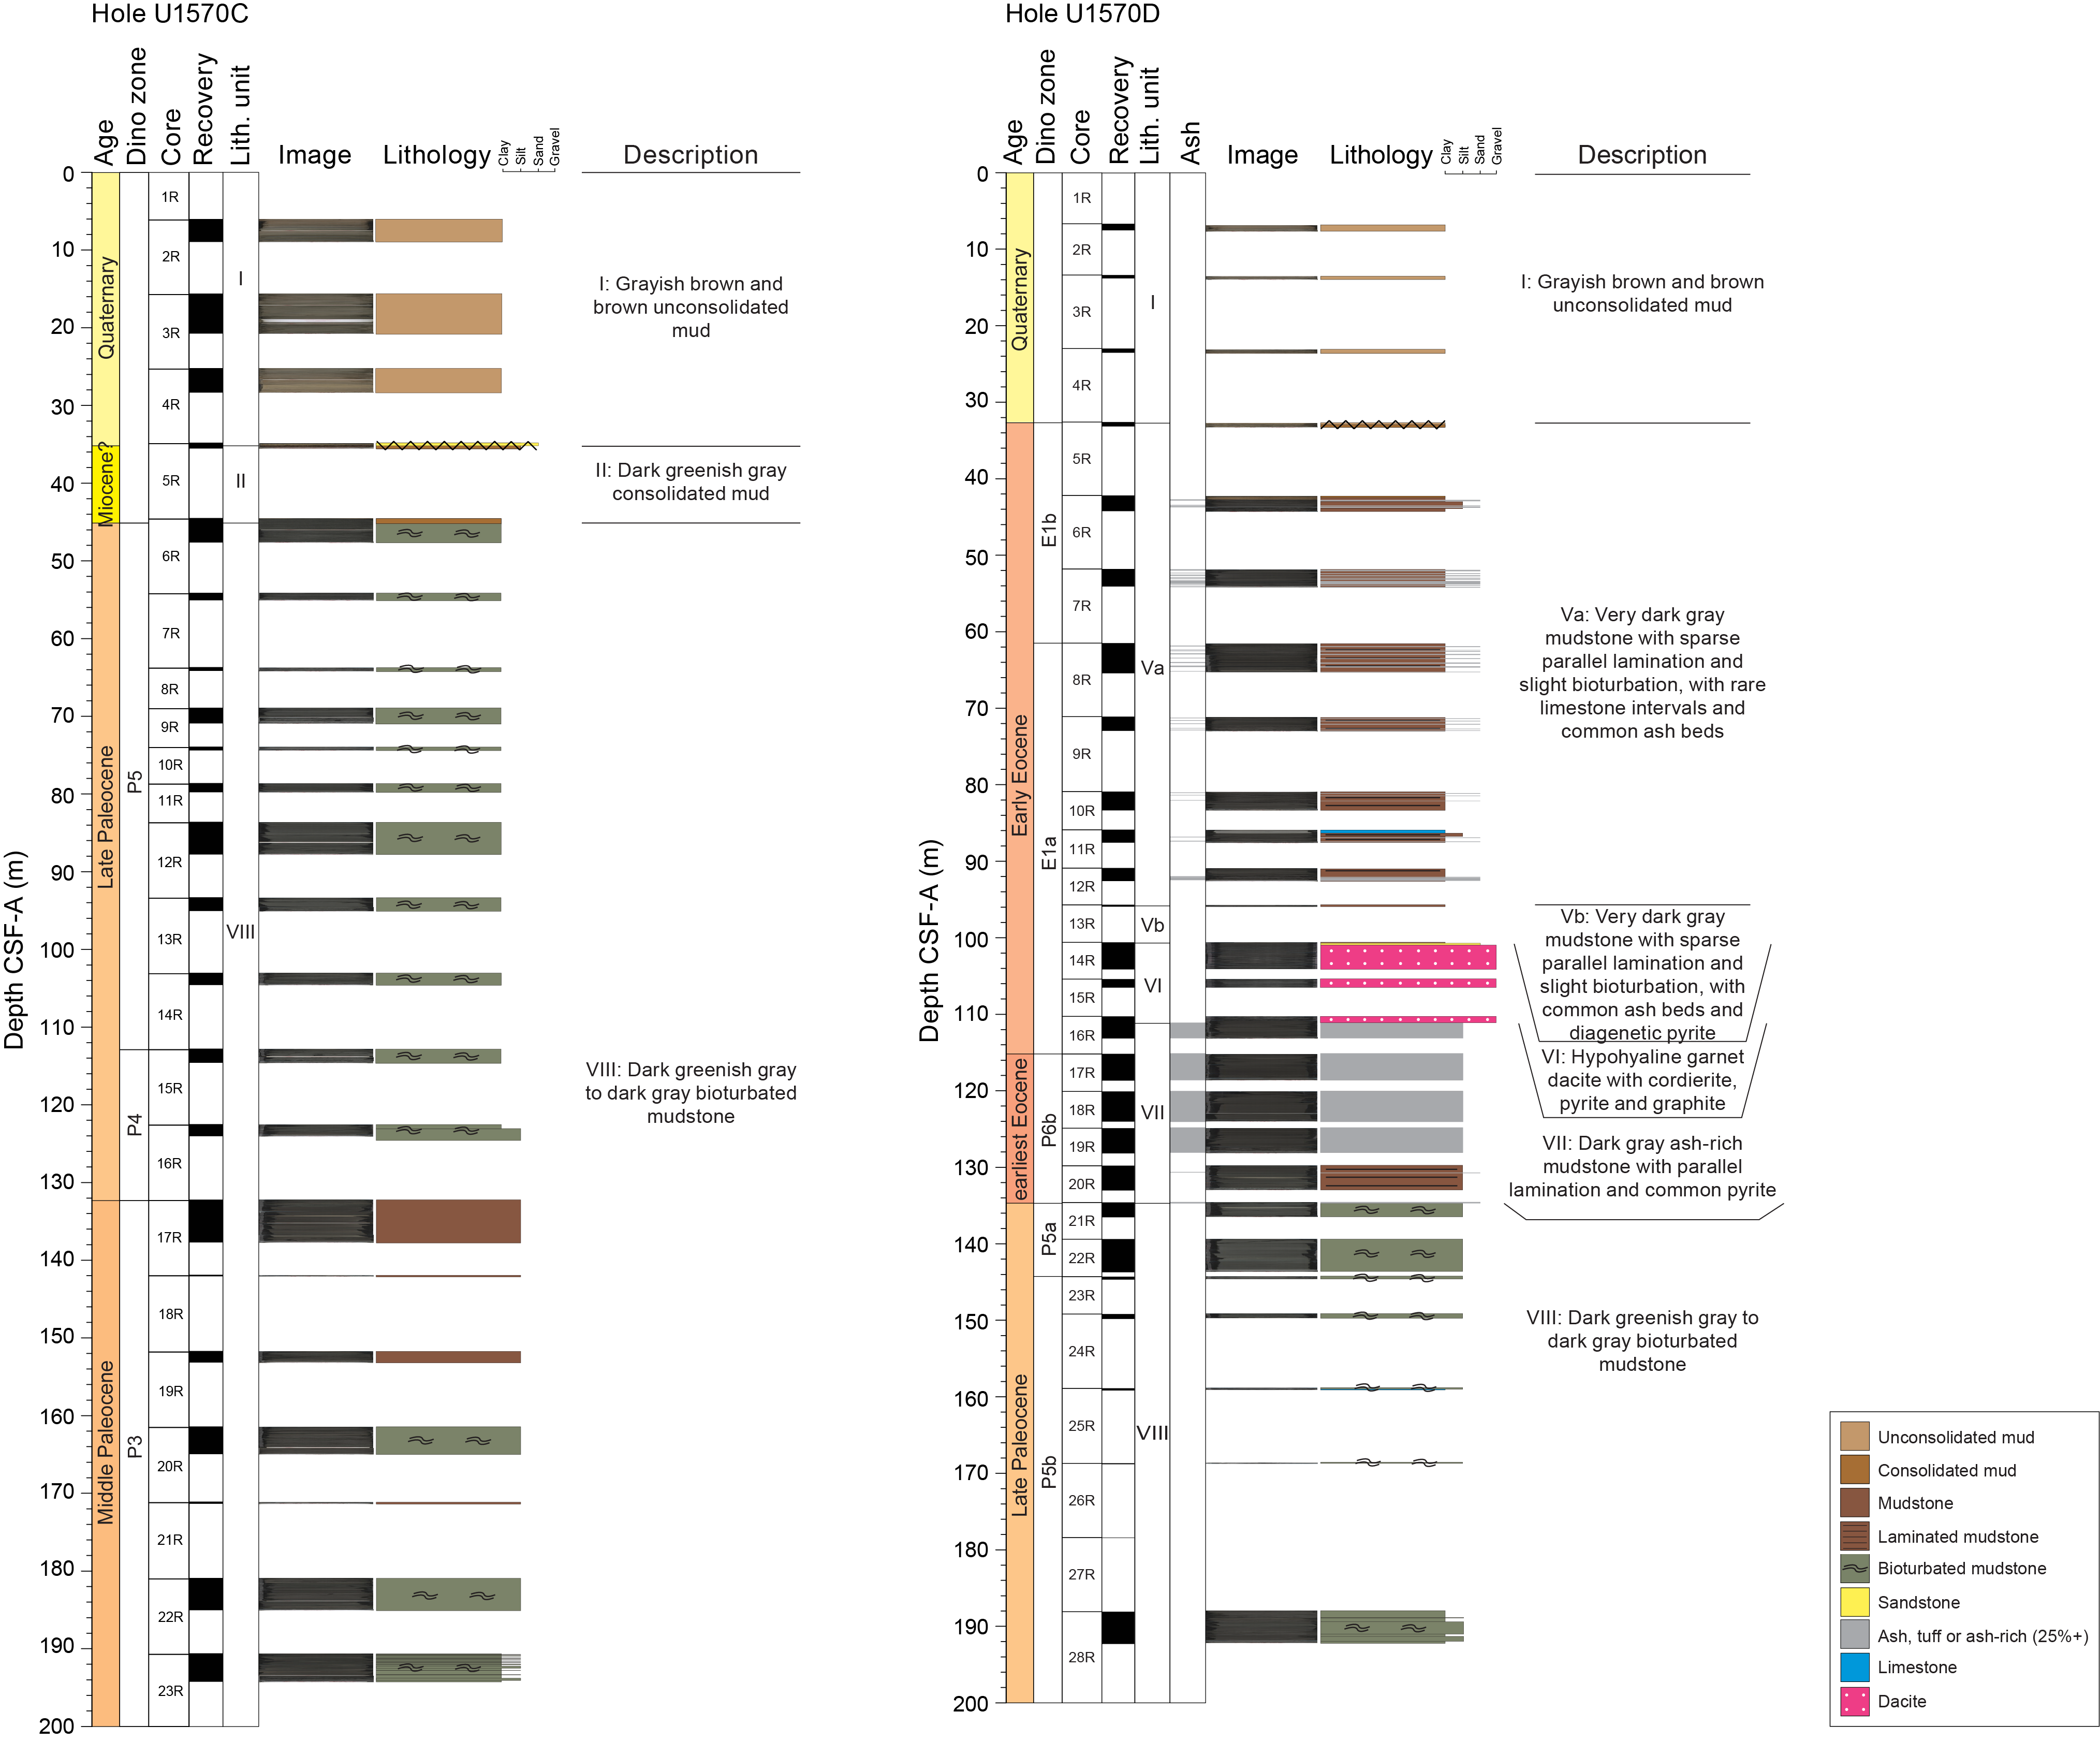
Figure F4. Lithostratigraphic columns.
The lithology of the units at Sites U1569 and U1570 is as follows:
- Unit I is grayish brown and brown unconsolidated mud.
- Unit II consists of dark greenish gray consolidated mud that is locally slightly bioturbated.
- Unit III is grayish brown sand-rich clay with nodules.
- Unit IV is very dark gray claystone.
- Unit V is divided into Subunits Va and Vb.
- Subunit Va is very dark gray mudstone with sparse parallel lamination and slight localized bioturbation, as well as rare limestone intervals and common ash beds.
- Subunit Vb is very dark gray mudstone with sparse parallel lamination and slight localized bioturbation, as well as common ash beds and diagenetic pyrite. The criteria for the subunit divisions in Unit V are discussed in more detail below.
- Unit VI is hypohyaline garnet dacite with cordierite, pyrite, and graphite.
- Unit VII is dark gray ash-rich mudstone with parallel lamination and common pyrite.
- Unit VIII is dark greenish gray to dark gray bioturbated mudstone.
- Unit IX is light gray limestone.
- Unit X is very dark greenish gray bioturbated mudstone with common ash and some medium beds of limestone and volcaniclastic conglomerate.
The lithostratigraphic highlights of Sites U1569 and U1570 are as follows:
- An unconformity (>10 My of missing time) is present at the top of Unit II. Biostratigraphy suggests that unconformities are also present below Unit II in Holes U1570A–U1570C and below Unit III in Hole U1569A, separating the Neogene and Paleogene, and differ in terms of hiatus duration.
- PETM sediments were recovered in Holes U1569A, U1570A, and U1570D, although the onset of the PETM was likely not reached in Hole U1570A.
- Hypohyaline garnet dacite with cordierite, pyrite, and graphite was recovered in Holes U1570A and U1570D (Unit VI) overlying PETM sediments.
- A light gray calcareous limestone with a thickness of 1.34 m was recovered in Hole U1570B (Unit IX).
- Trace glendonite, a calcite pseudomorph after ikaite, is observed in Units IV and V.
3.1. Lithostratigraphic Unit I
- Intervals: 396-U1569A-1R-1, 0 cm, to 9R-1, 10 cm; 396-U1570A-1R-1, 0 cm, to 5R-1, 21 cm; 396-U1570B-1R-1, 0 cm, to 2R-1, 66 cm; 396-U1570C-2R-1, 0 cm, to 5R-1, 25 cm; 396-U1570D-2R-1, 0 cm, to 5R-1, 13 cm
- Depths: Hole U1569A = 0.00–77.80 m core depth below seafloor, Method A (CSF-A); Hole U1570A = 0.00–35.11 m CSF-A; Hole U1570B = 0.00–8.96 m CSF-A; Hole U1570C = 6.00–35.05 m CSF-A; Hole U1570D = 6.70–32.73 m CSF-A
- Age: Pleistocene
Lithostratigraphic Unit I is the only unit present in all five holes. This unit primarily consists of unconsolidated grayish brown to brown to very dark gray clay with silt. Sand-rich clay intervals are common throughout. Planktonic foraminifers are common in some beds of the uppermost interval and become rarer downhole. Ice-rafted debris, including dropstones of varying lithology (e.g., claystone, metamorphic rocks, and granite) are present in Unit I, although they are often difficult to observe because they commonly sit below the split-core surface. Some intervals contain trace amounts of visible organic matter, including wood fragments, sometimes coalified as in Hole U1569A.
3.2. Lithostratigraphic Unit II
- Intervals: 396-U1569A-9R-1, 10 cm, to 14R-CC, 22 cm; 396-U1570A-5R-1, 21 cm, to 7R-1, 20 cm; 396-U1570B-2R-1, 66 cm, to 3R-CC, 18 cm; 396-U1570C-5R-1, 25 cm, to 5R-CC, 18 cm
- Depths: Hole U1569A = 77.80–131.14 m CSF-A; Hole U1570A = 35.11–54.70 m CSF-A; Hole U1570B = 8.96–20.48 m CSF-A; Hole U1570C = 35.05–35.32 m CSF-A
- Age: Miocene
Lithostratigraphic Unit II is characterized by consolidated clay with silt. The color of this unit varies among the different holes from greenish gray, grayish brown, reddish brown, yellowish brown, and pale yellow to dark gray with nodules observed in some of the holes (e.g., Hole U1570B) (Figure F5C). In Hole U1569A, slight bioturbation is observed toward the bottom interval. The lithologic transition from Unit I to Unit II in Holes U1569A and U1570A contains an irregular horizontal contact, abrupt color change, and increase in consolidation of the clay (Figure F5A, F5B). In Holes U1570A–U1570C, the contact below Unit II is unconformable with significant missing time (>10 My).
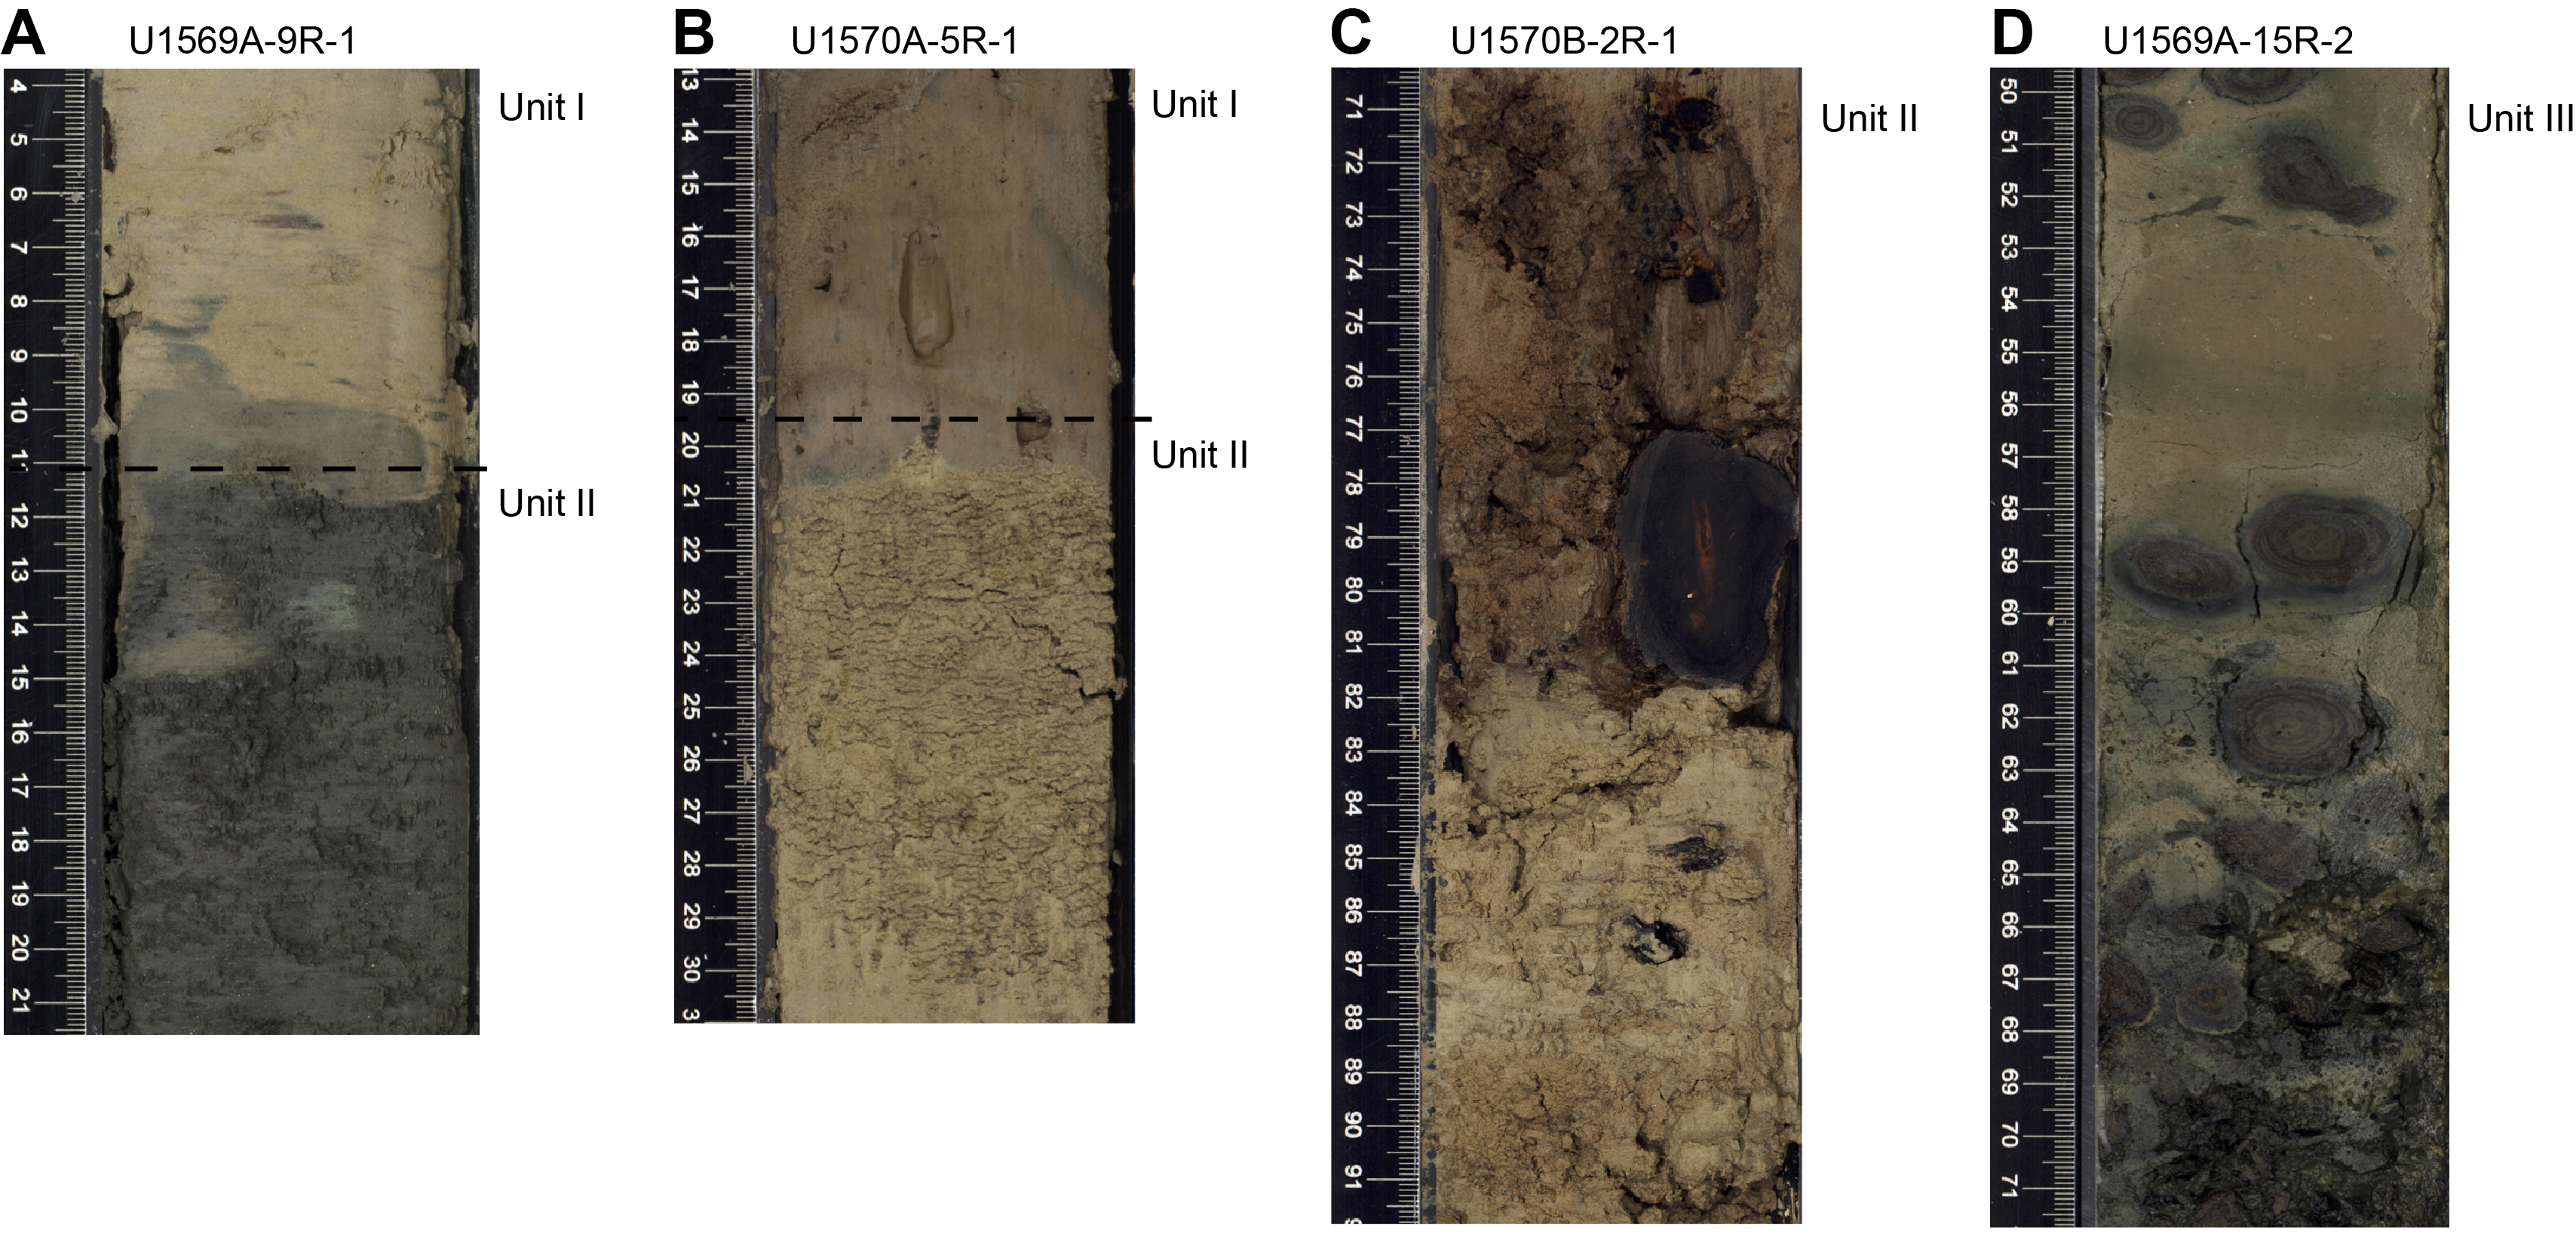
Figure F5. Lithologic characteristics, Units I–III.
3.3. Lithostratigraphic Unit III
Lithostratigraphic Unit III consists of consolidated clay with silt and multicentimeter-scale concentric nodules with high density, confirmed by physical properties (Figure F5D). This unit is only present in Hole U1569A. Some intervals of sand-rich clay are observed, and the color varies from grayish brown to dark gray and dark greenish gray. The bottom of Unit III contains thin parallel laminations. The contact between these units is horizontal and erosive with an abrupt color change from darker to lighter gray.
3.4. Lithostratigraphic Unit IV
- Interval: 396-U1569A-16R-1, 96 cm, to 19R-CC, 0 cm
- Depth: 147.26–177.33 m CSF-A
- Age: middle Early Eocene (Ypresian)
Lithostratigraphic Unit IV, which is only observed in Hole U1569A, consists of very dark gray mudstone with moderate bioturbation. A change from consolidated clay to claystone marks the transition from Unit III to Unit IV. Near the bottom of the unit, a concretion of glendonite, a calcite pseudomorph after ikaite (e.g., Greinert and Derkachev, 2004), with well-developed crystal facies is observed (Figure F6). Unit IV represents the latest interval of Eocene age recovered at Sites U1569 and U1570 (i.e., Dinocyst Zone E3) (Bujak and Mudge, 1994). The transition from Unit III to Unit IV contains a hiatus from the Miocene (Unit II and potentially Unit III) to the middle Early Eocene (Unit IV).
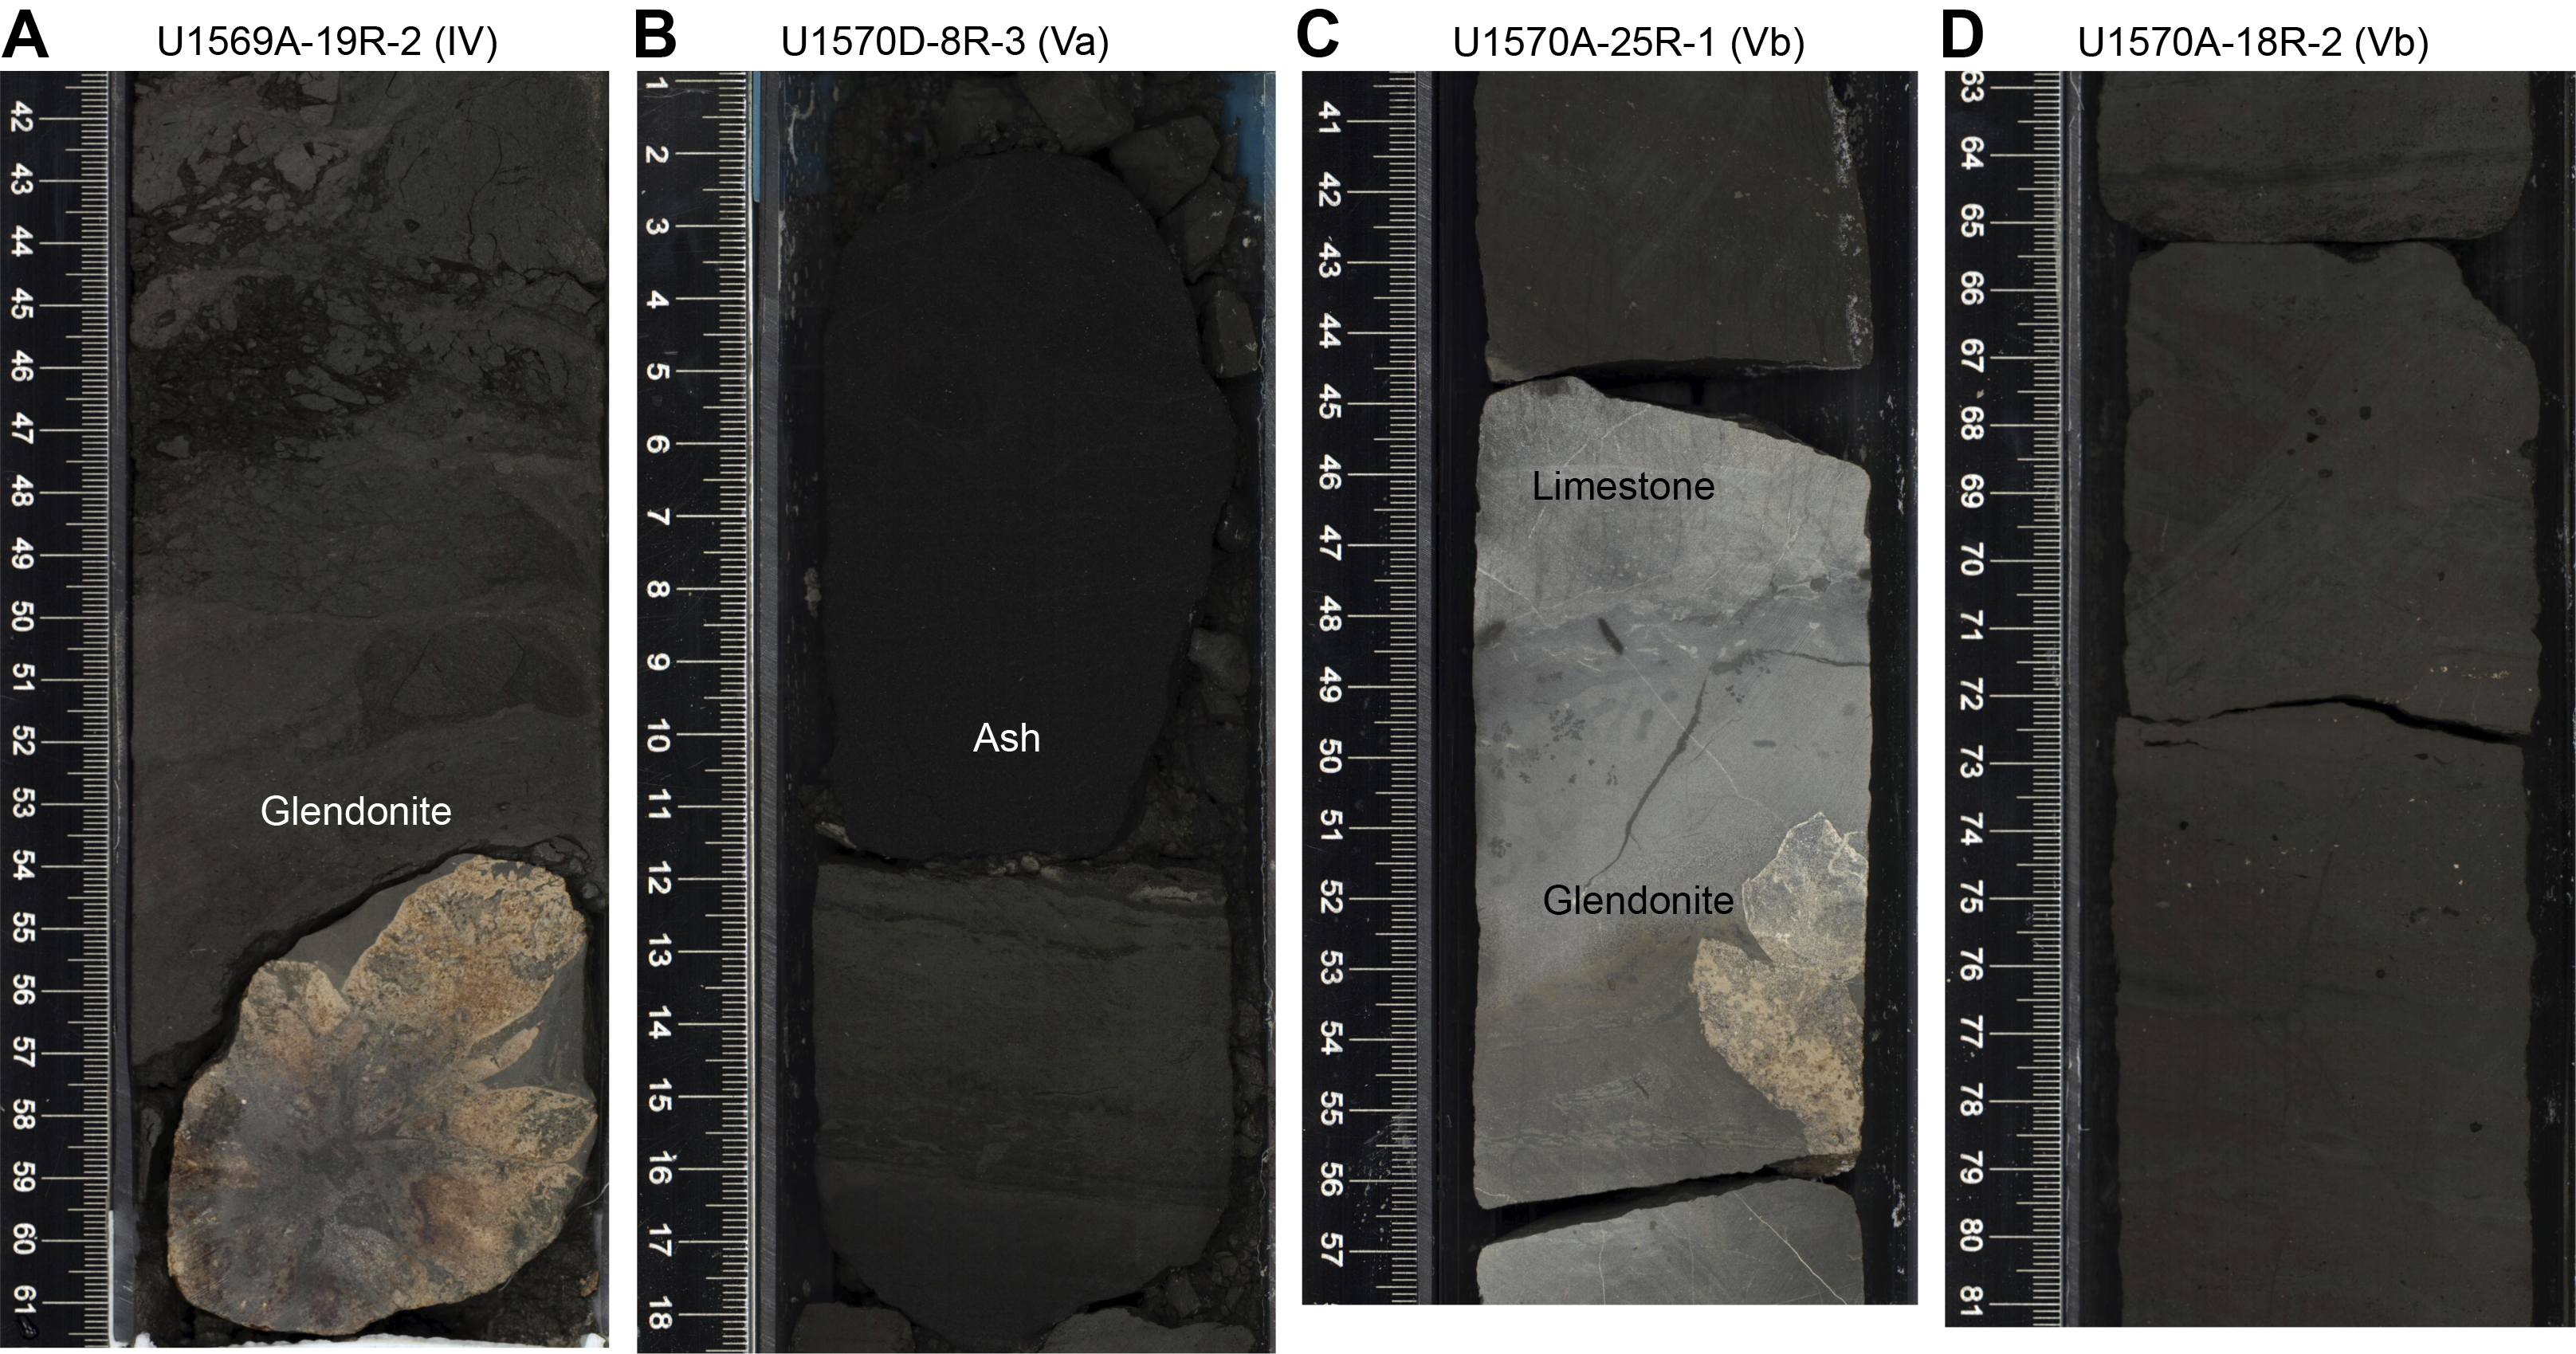
Figure F6. Lithologic characteristics, Unit IV and Subunits Va and Vb.
3.5. Lithostratigraphic Unit V
- Intervals: 396-U1569A-19R-CC, 0 cm, to 37R-1, 33 cm; 396-U1570A-7R-1, 20 cm, to 26R-1, 4 cm; 396-U1570D-5R-1, 13 cm, to 14R-1, 15 cm
- Depths: Hole U1569A = 177.33–332.63 m CSF-A; Hole U1570A = 54.70–146.84 m CSF-A; Hole U1570D = 32.73–100.75 m CSF-A
- Age: Early Eocene (Ypresian)
Lithostratigraphic Unit V is characterized by alternating layers of very dark gray claystone with silt and black ash, as well as intervals of gray to light gray limestone (Figure F6B–F6D). Unit V is divided into two subunits based on a distinct change in the degree of ash alteration and physical properties. In Holes U1569A, U1570A, and U1570D, a decrease in magnetic susceptibility (MS) coincides with an increase in macroscopically observable pyrite. Portable X-ray fluorescence (pXRF) measurements on the ash beds show increasing values in the concentration of light elements (weight percent) from Subunit Va to Subunit Vb, suggesting some degree of ash alteration, which is confirmed with microscopic observations. FeO (weight percent) content decreases from Subunit Va to Subunit Vb. Faint parallel lamination, slight bioturbation, and dewatering structures are observed in some intervals.
3.5.1. Subunit Va
- Intervals: 396-U1569A-19R-CC, 0 cm, to 34R-1, 0 cm; 396-U1570A-7R-1, 20 cm, to 18R-1, 0 cm; 396-U1570D-5R-1, 13 cm, to 13R-1, 22 cm
- Depths: Hole U1569A = 177.33–307.80 m CSF-A; Hole U1570A = 54.70–107.90 m CSF-A; Hole U1570D = 32.73–95.92 m CSF-A
Lithostratigraphic Subunit Va consists of alternating beds of very dark gray claystone with silt and thinly bedded black ash (Figure F6B). Faint parallel lamination and dewatering structures are common in this subunit, and localized wavy lamination structures are present. Many ash beds contain normal grading (fining upward). In Hole U1569A, rare intervals of limestone are present, one of which includes glendonite (Figure F6A). An interval of limestone in Section 19R-CC marks the boundary between Unit IV and Subunit Va.
3.5.2. Subunit Vb
- Intervals: 396-U1569A-34R-1, 0 cm, to 37R-1, 33 cm; 396-U1570A-18R-1, 0 cm, to 26R-1, 4 cm; 396-U1570D-13R-1, 22 cm, to 14R-1, 15 cm
- Depths: Hole U1569A = 307.80–332.63 m CSF-A; Hole U1570A = 107.90–146.84 m CSF-A; Hole U1570D = 95.92–100.75 m CSF-A
Lithostratigraphic Subunit Vb consists of alternating intervals of very dark gray claystone with silt and dark gray to black ash. As in Subunit Va, faint parallel lamination, dewatering structures, and normally graded (fining-upward) ash beds are common. However, in this subunit, diagenetic pyrite is more common than in Subunit Va (e.g., Hole U1569A), ashes tend to be more highly altered, and alteration increases downhole (Figure F6C). This alteration is confirmed using pXRF analysis, which indicates an increase in light elements downhole across the Subunit Va–Vb transition. Lithologic changes are also evident in physical properties measurements that indicate a decrease in MS across Unit V. In Hole U1570A, rare glendonite is present, one of which is in a limestone bed (Core 25R) (Figure F6D). Small-scale faults (centimeter to subcentimeter lamination/bed offset) are present in Hole U1570A.
3.6. Lithostratigraphic Unit VI
- Intervals: 396-U1570A-26R-1, 4 cm, to 27R-1, 14 cm; 396-U1570D-14R-1, 15 cm, to 16R-2, 8 cm
- Depths: Hole U1570A = 146.84–151.94 m CSF-A; Hole U1570D = 100.75–110.91 m CSF-A
- Age: Early Eocene (Ypresian)
Lithostratigraphic Unit VI is present in Holes U1570A and U1570D and represents the only igneous unit for these two sites (Figure F7). Potential reworking of this unit may have been recovered from Section 396-U1569A-35R-CC in clay-rich sand.
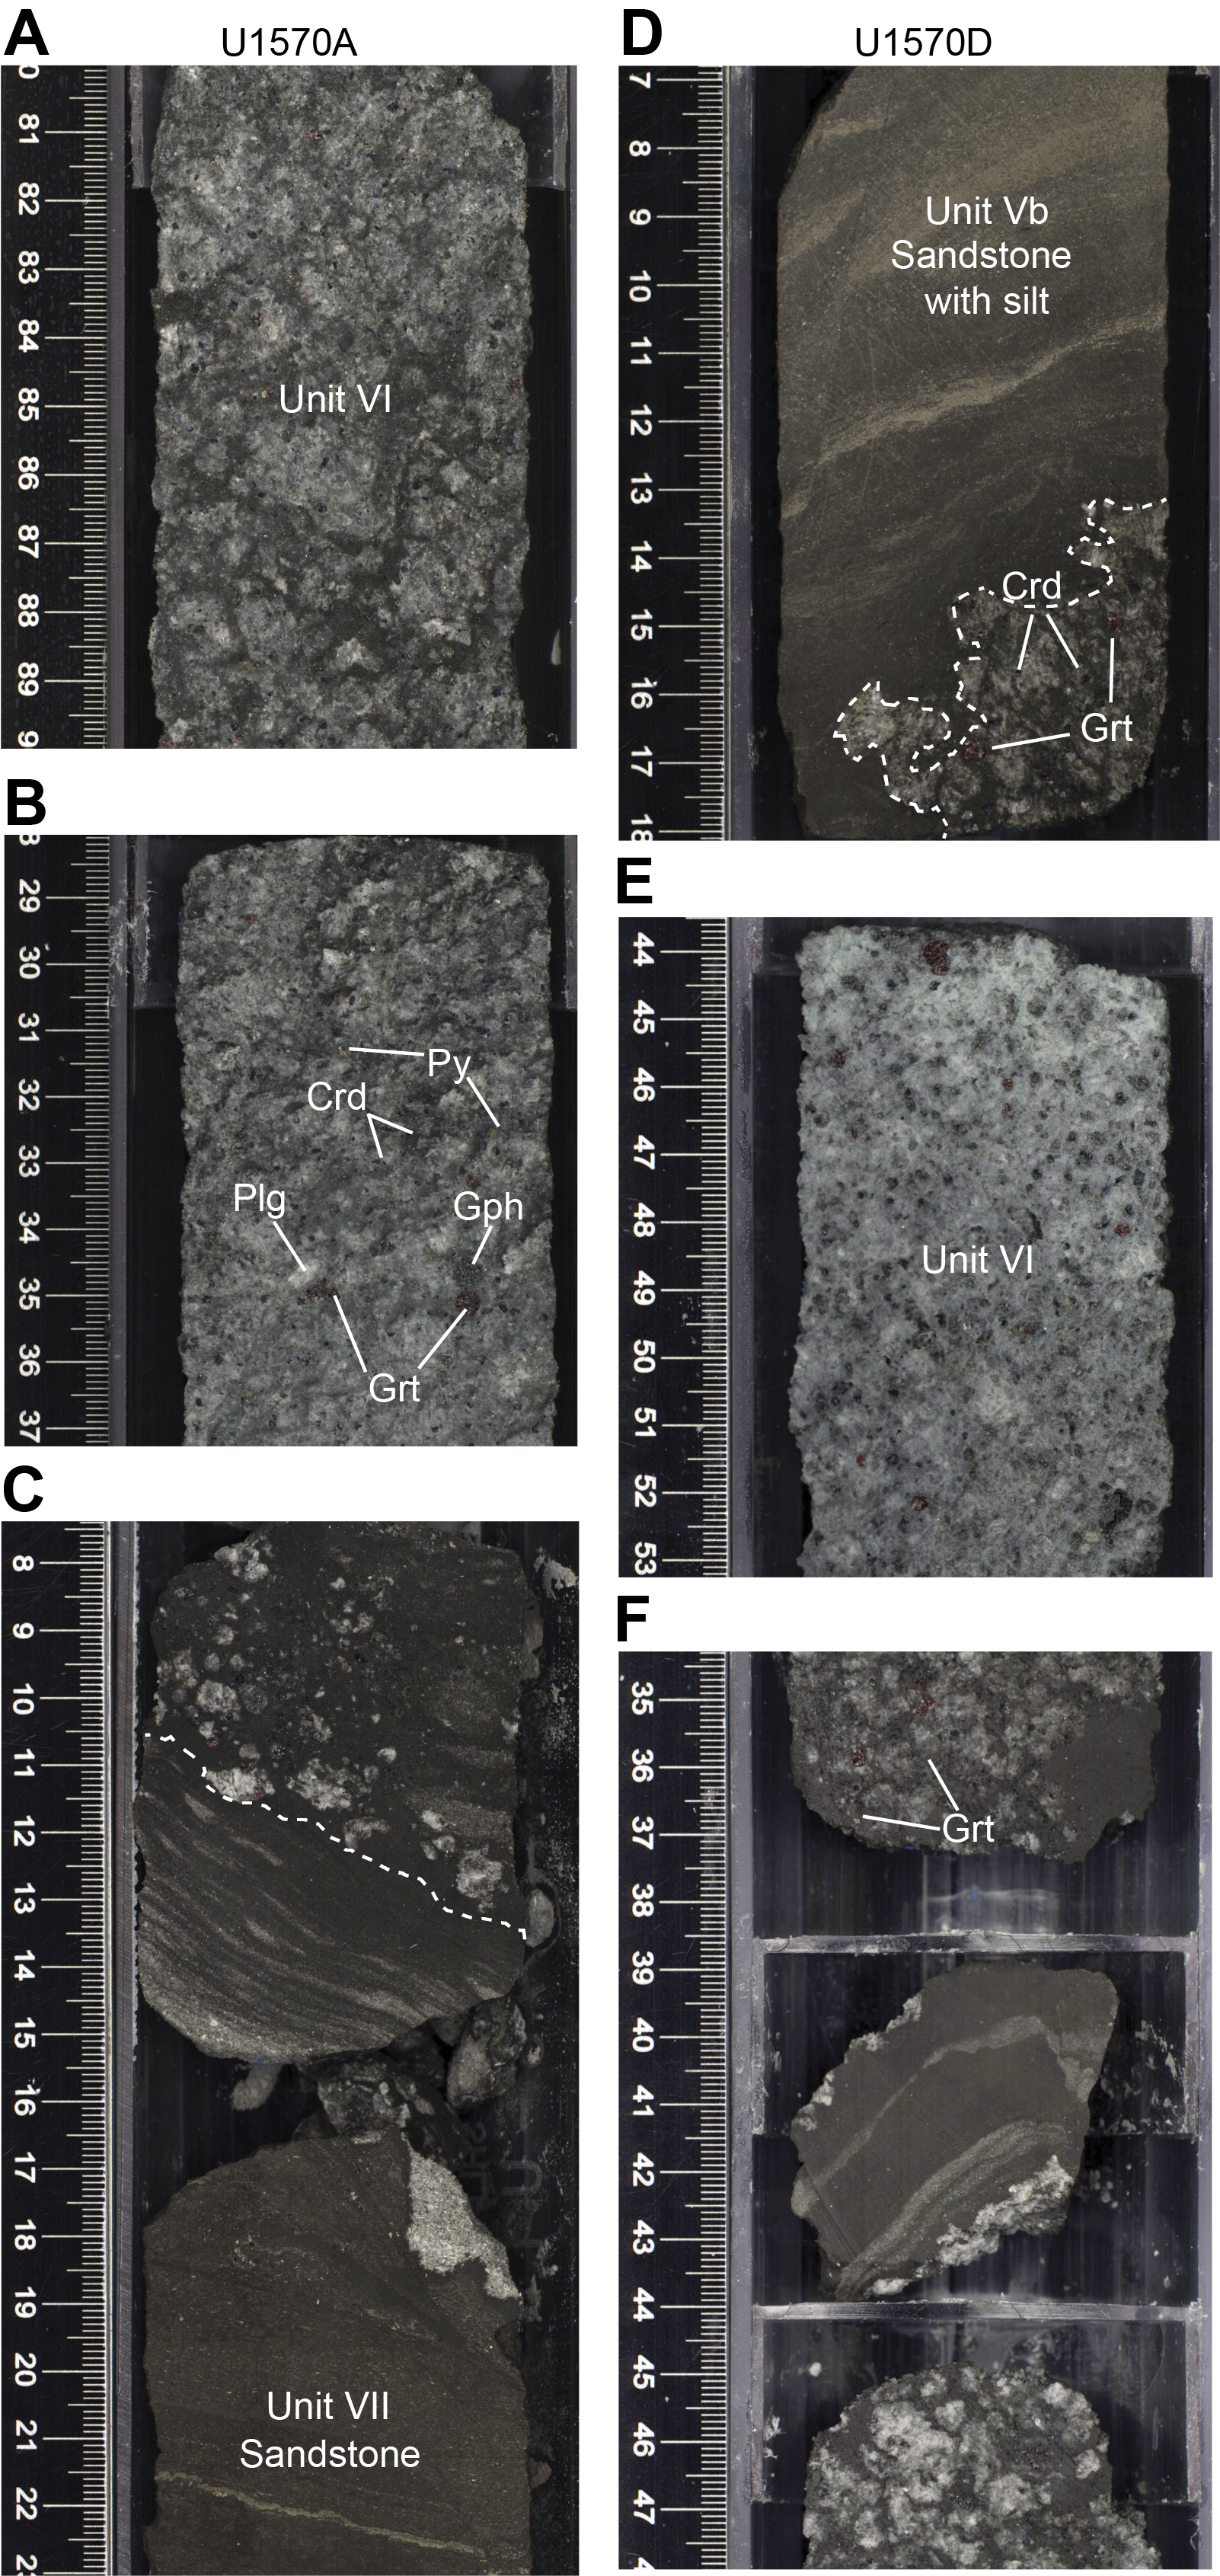
Figure F7. Unit VI relations with Subunit Vb and Unit VII.
This igneous unit consists of light gray dacite with mainly glass, plagioclase, and minor pyroxene crystals. Euhedral millimeter-sized grains of garnet, cordierite, and graphite are heterogeneously distributed across the dacite. Across both holes, the discrete dacite flows contain localized mingling with dark sand-rich silt (Figure F7). A couple of small (2–5 cm) intervals of siltstone and claystone are also found between the discrete flows. Dinocyst zonations of mingled sediments at the top and bottom of the dacite flow indicate an Early Eocene age.
The contact surface between Units V and VI was recovered in both holes (Sections 396-U1570A-26R-1, 4 cm, and 396-U1570D-14R-1, 15 cm) (Figure F7). The first retrieval of Unit VI was at 146.84 m CSF-A in Hole U1570A (Core 26R). The unit continues to 151.94 m CSF-A, where a sharp contact with Unit VII is recovered (Figure F7). In Hole U1570D, the contact between Subunit Vb and Unit VI is recovered at 100.75 m CSF-A, where it is interpreted to be baked. Unit VI continues to 110.91 m CSF-A in this hole.
3.6.1. Petrology
3.6.1.1. Macroscopic observations
Unit VI is a highly vesicular, glassy, peraluminous dacitic lava flow. Phenocrysts of euhedral garnet (~1–3 mm), cordierite (~0.5–2 mm), plagioclase (~0.5–1 mm), and graphite (~0.5 mm) are observed (Figure F8). Phenocrysts are also found in the dark sand that locally mingles with the dacitic flow (Figures F7D, F7F, F8).
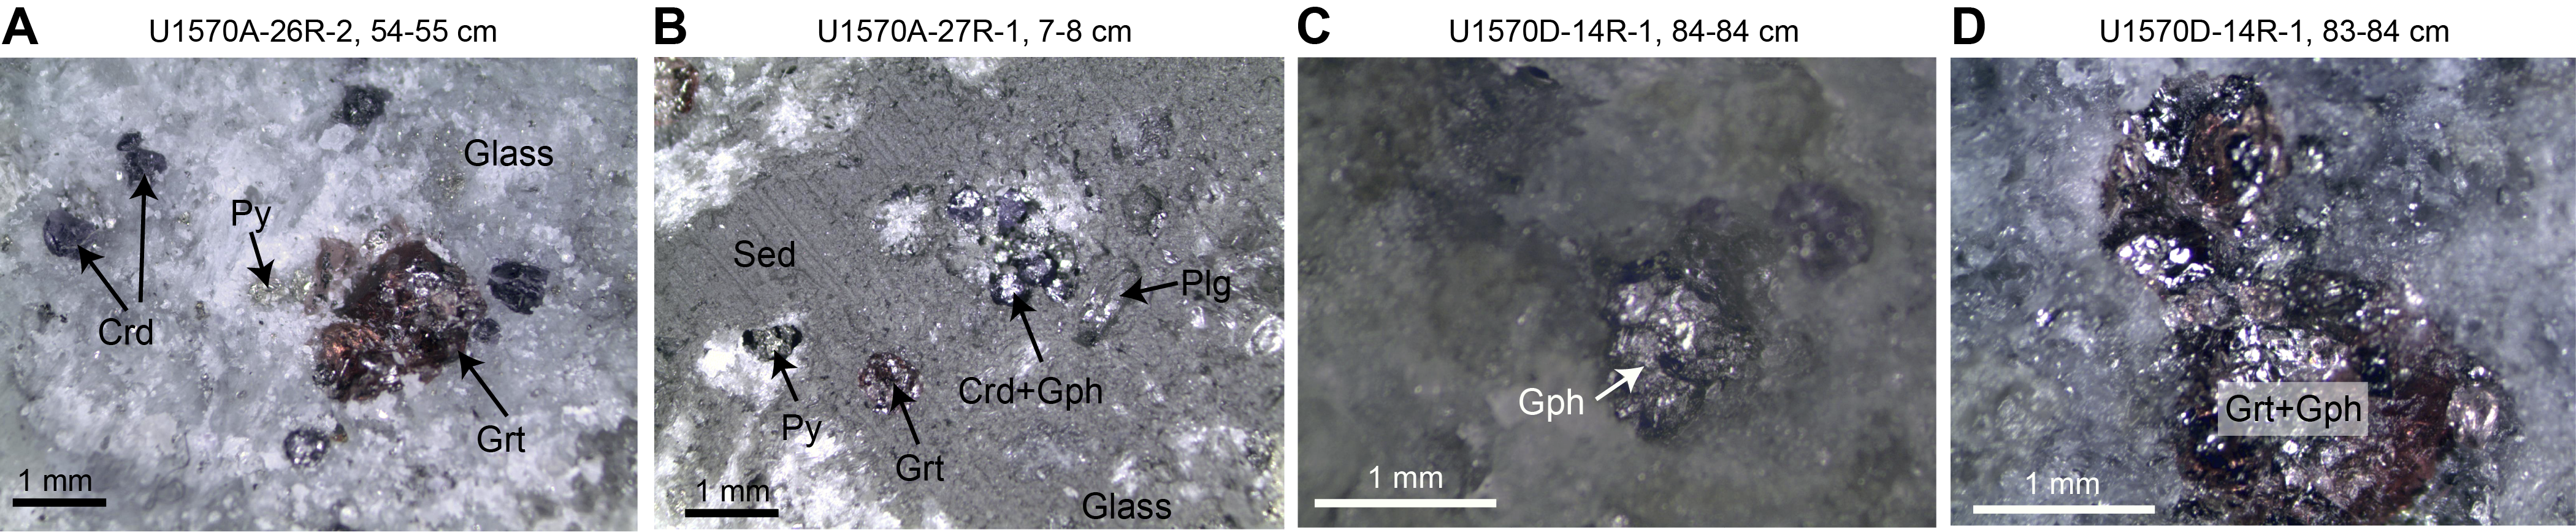
Figure F8. Igneous Unit 1 mineralogy.
3.6.1.2. Microscopic observations
The groundmass is mostly composed of glass (>65%) showing pumiceous texture (i.e., extremely elongate and folded vesicles; Figure F9A, F9B), with microlites of plagioclase and rare biotite and zircon. Phenocrysts include plagioclase, cordierite, garnet, and graphite (Figure F8). Graphite also commonly appears as thin deposits on the phenocrysts (Figures F9). Secondary pyrite grains are present in the rocks (Figures F9, F10, F11). The plagioclase phenocrysts show oscillatory zoning (Figure F9). Minor phenocrysts of clinopyroxene and quartz are also observed. The mingling process between the dark sand and the dacite results in a glass-rich sand with subcentimeter dacitic enclaves with pumiceous texture (Figure F9D).
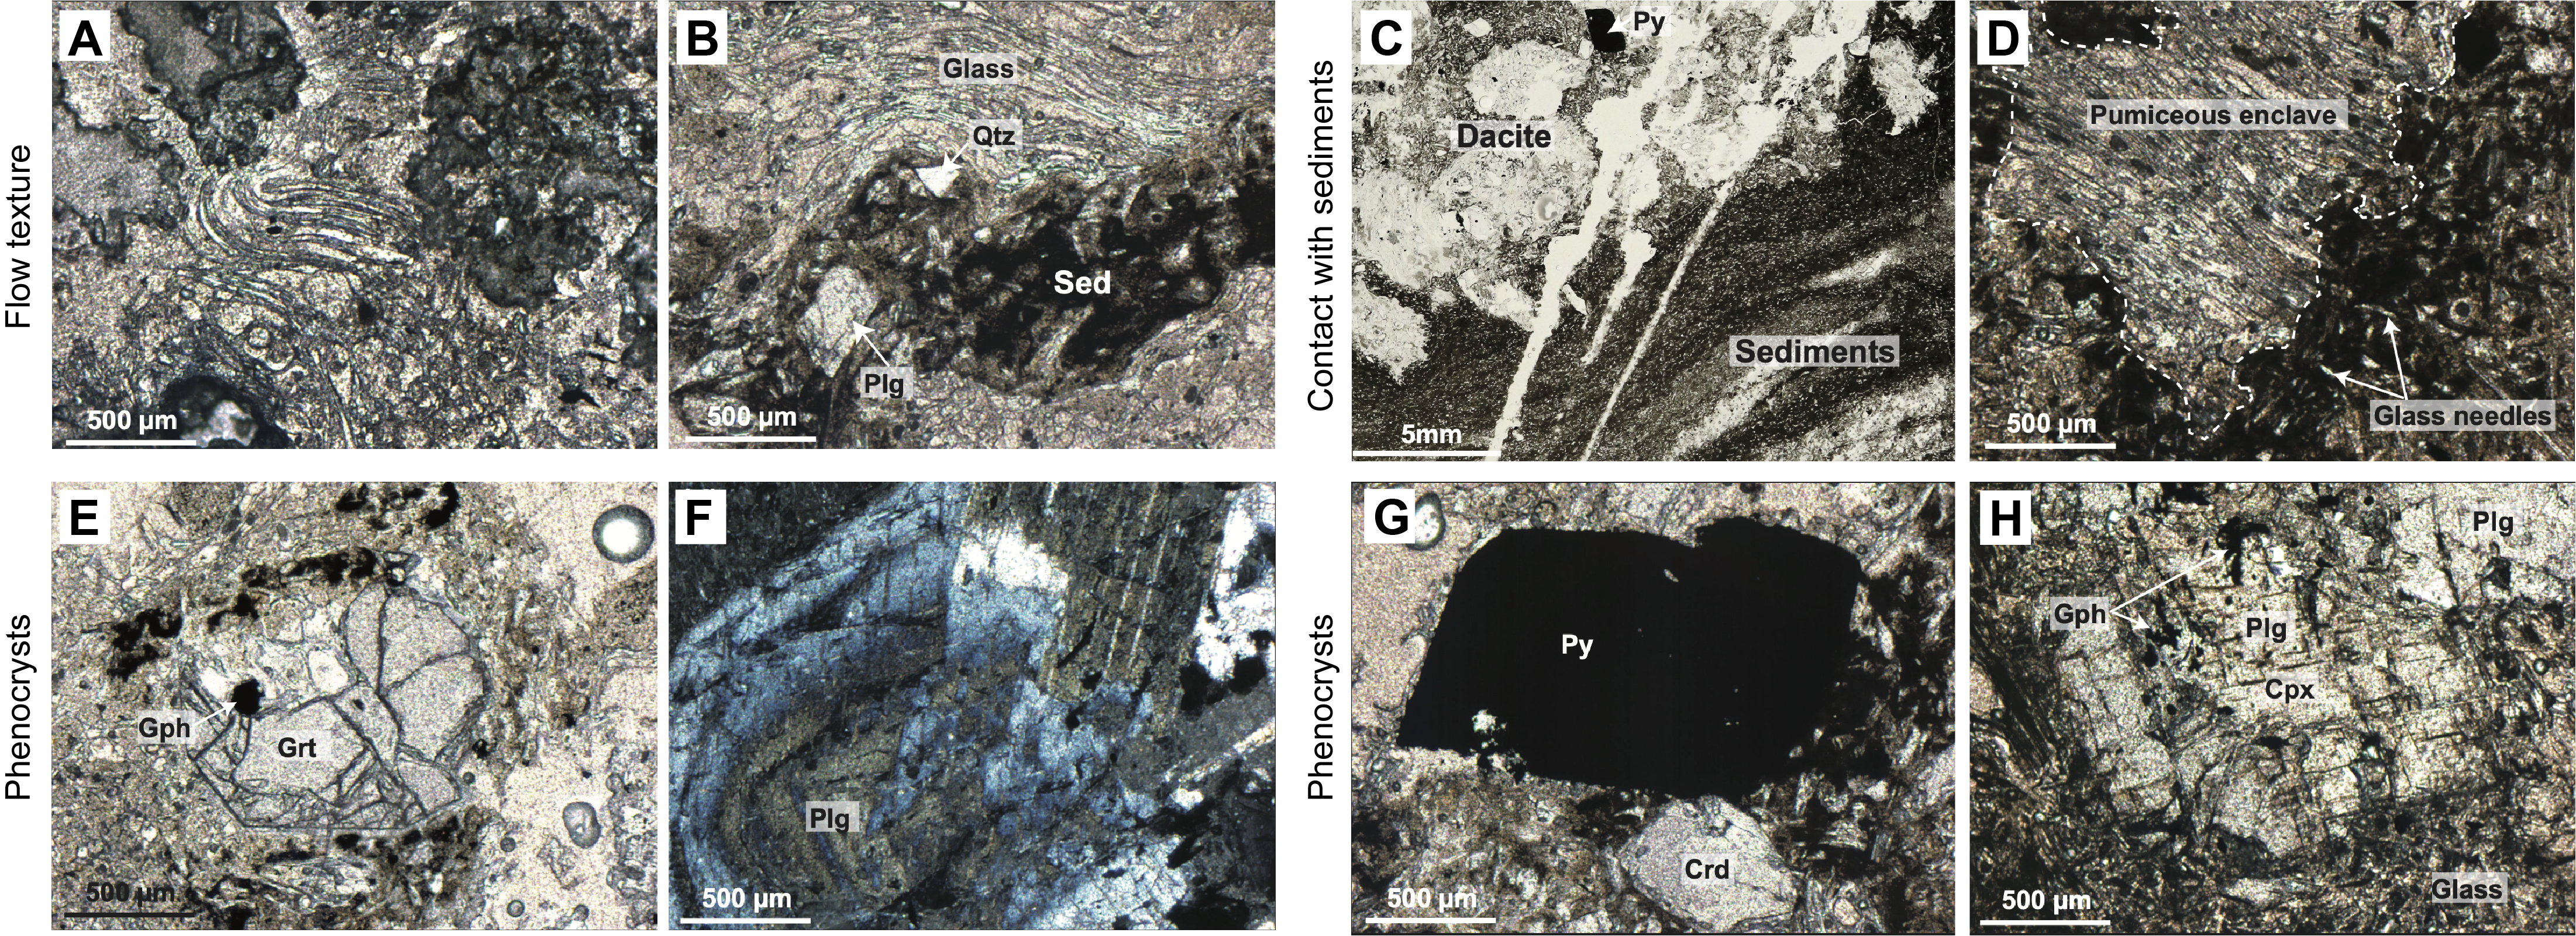
Figure F9. Igneous Unit 1 microstructure.
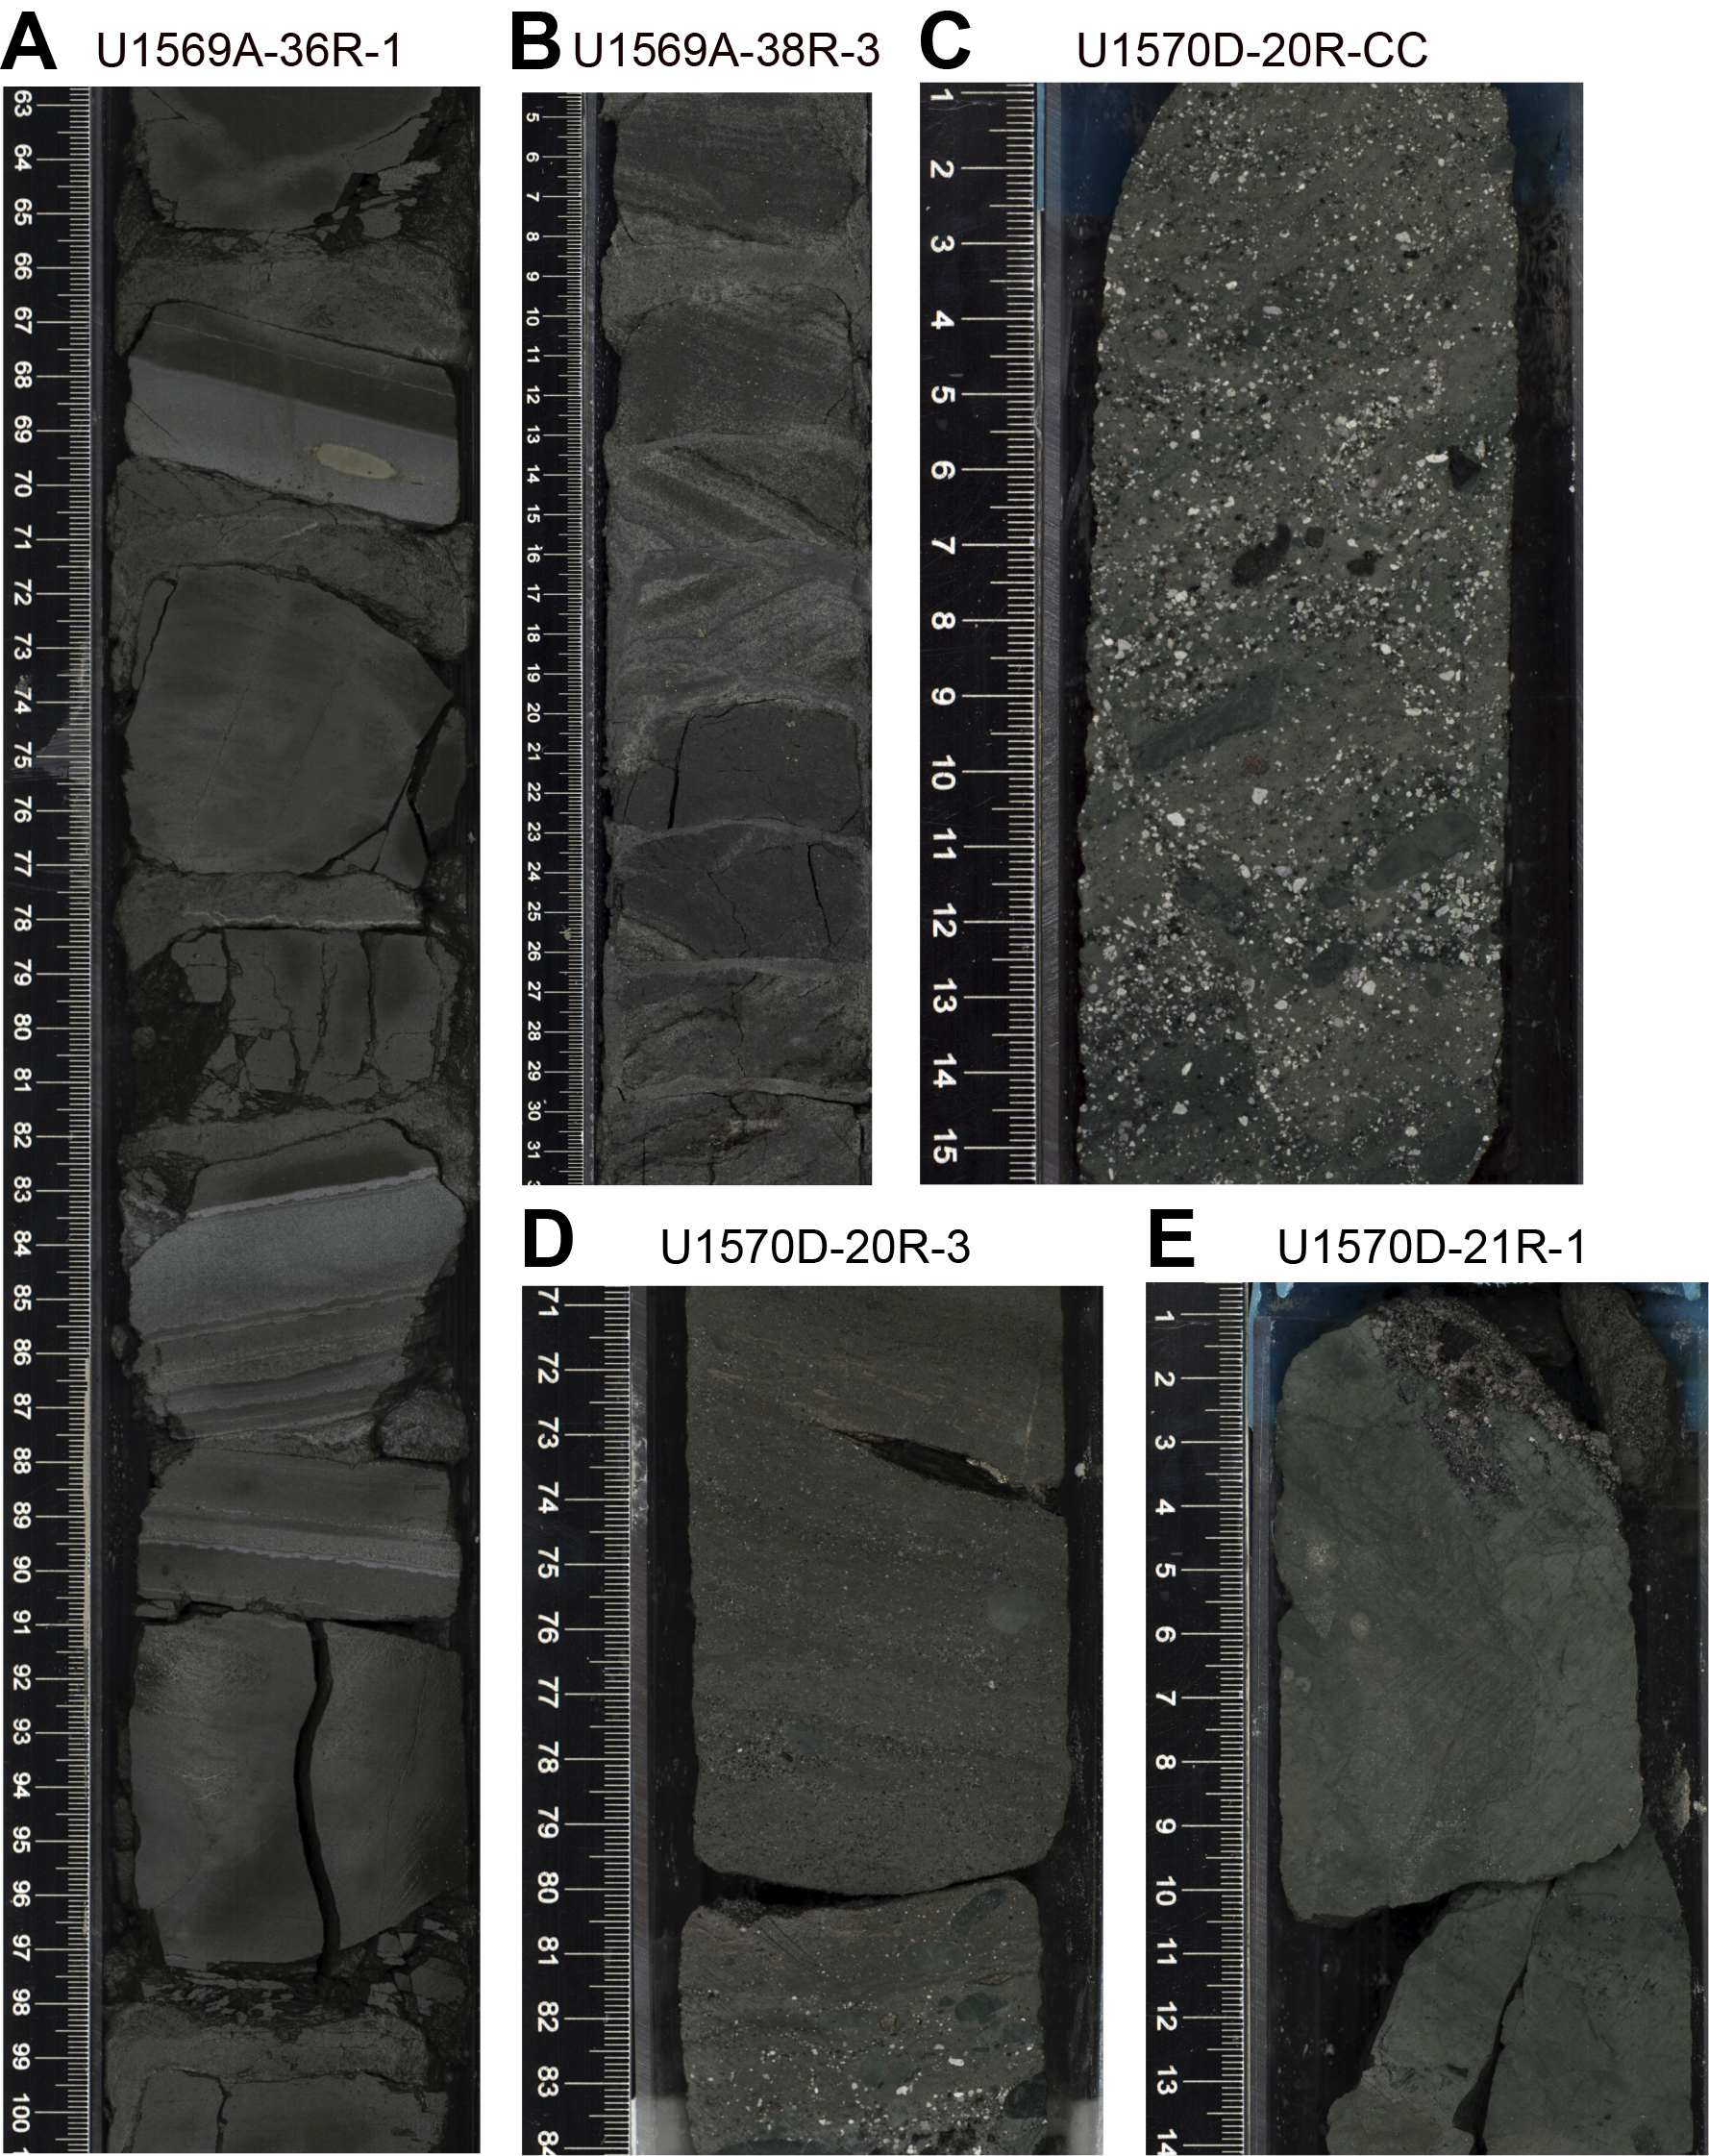
Figure F10. Lithologic characteristics, Units VII and VIII.
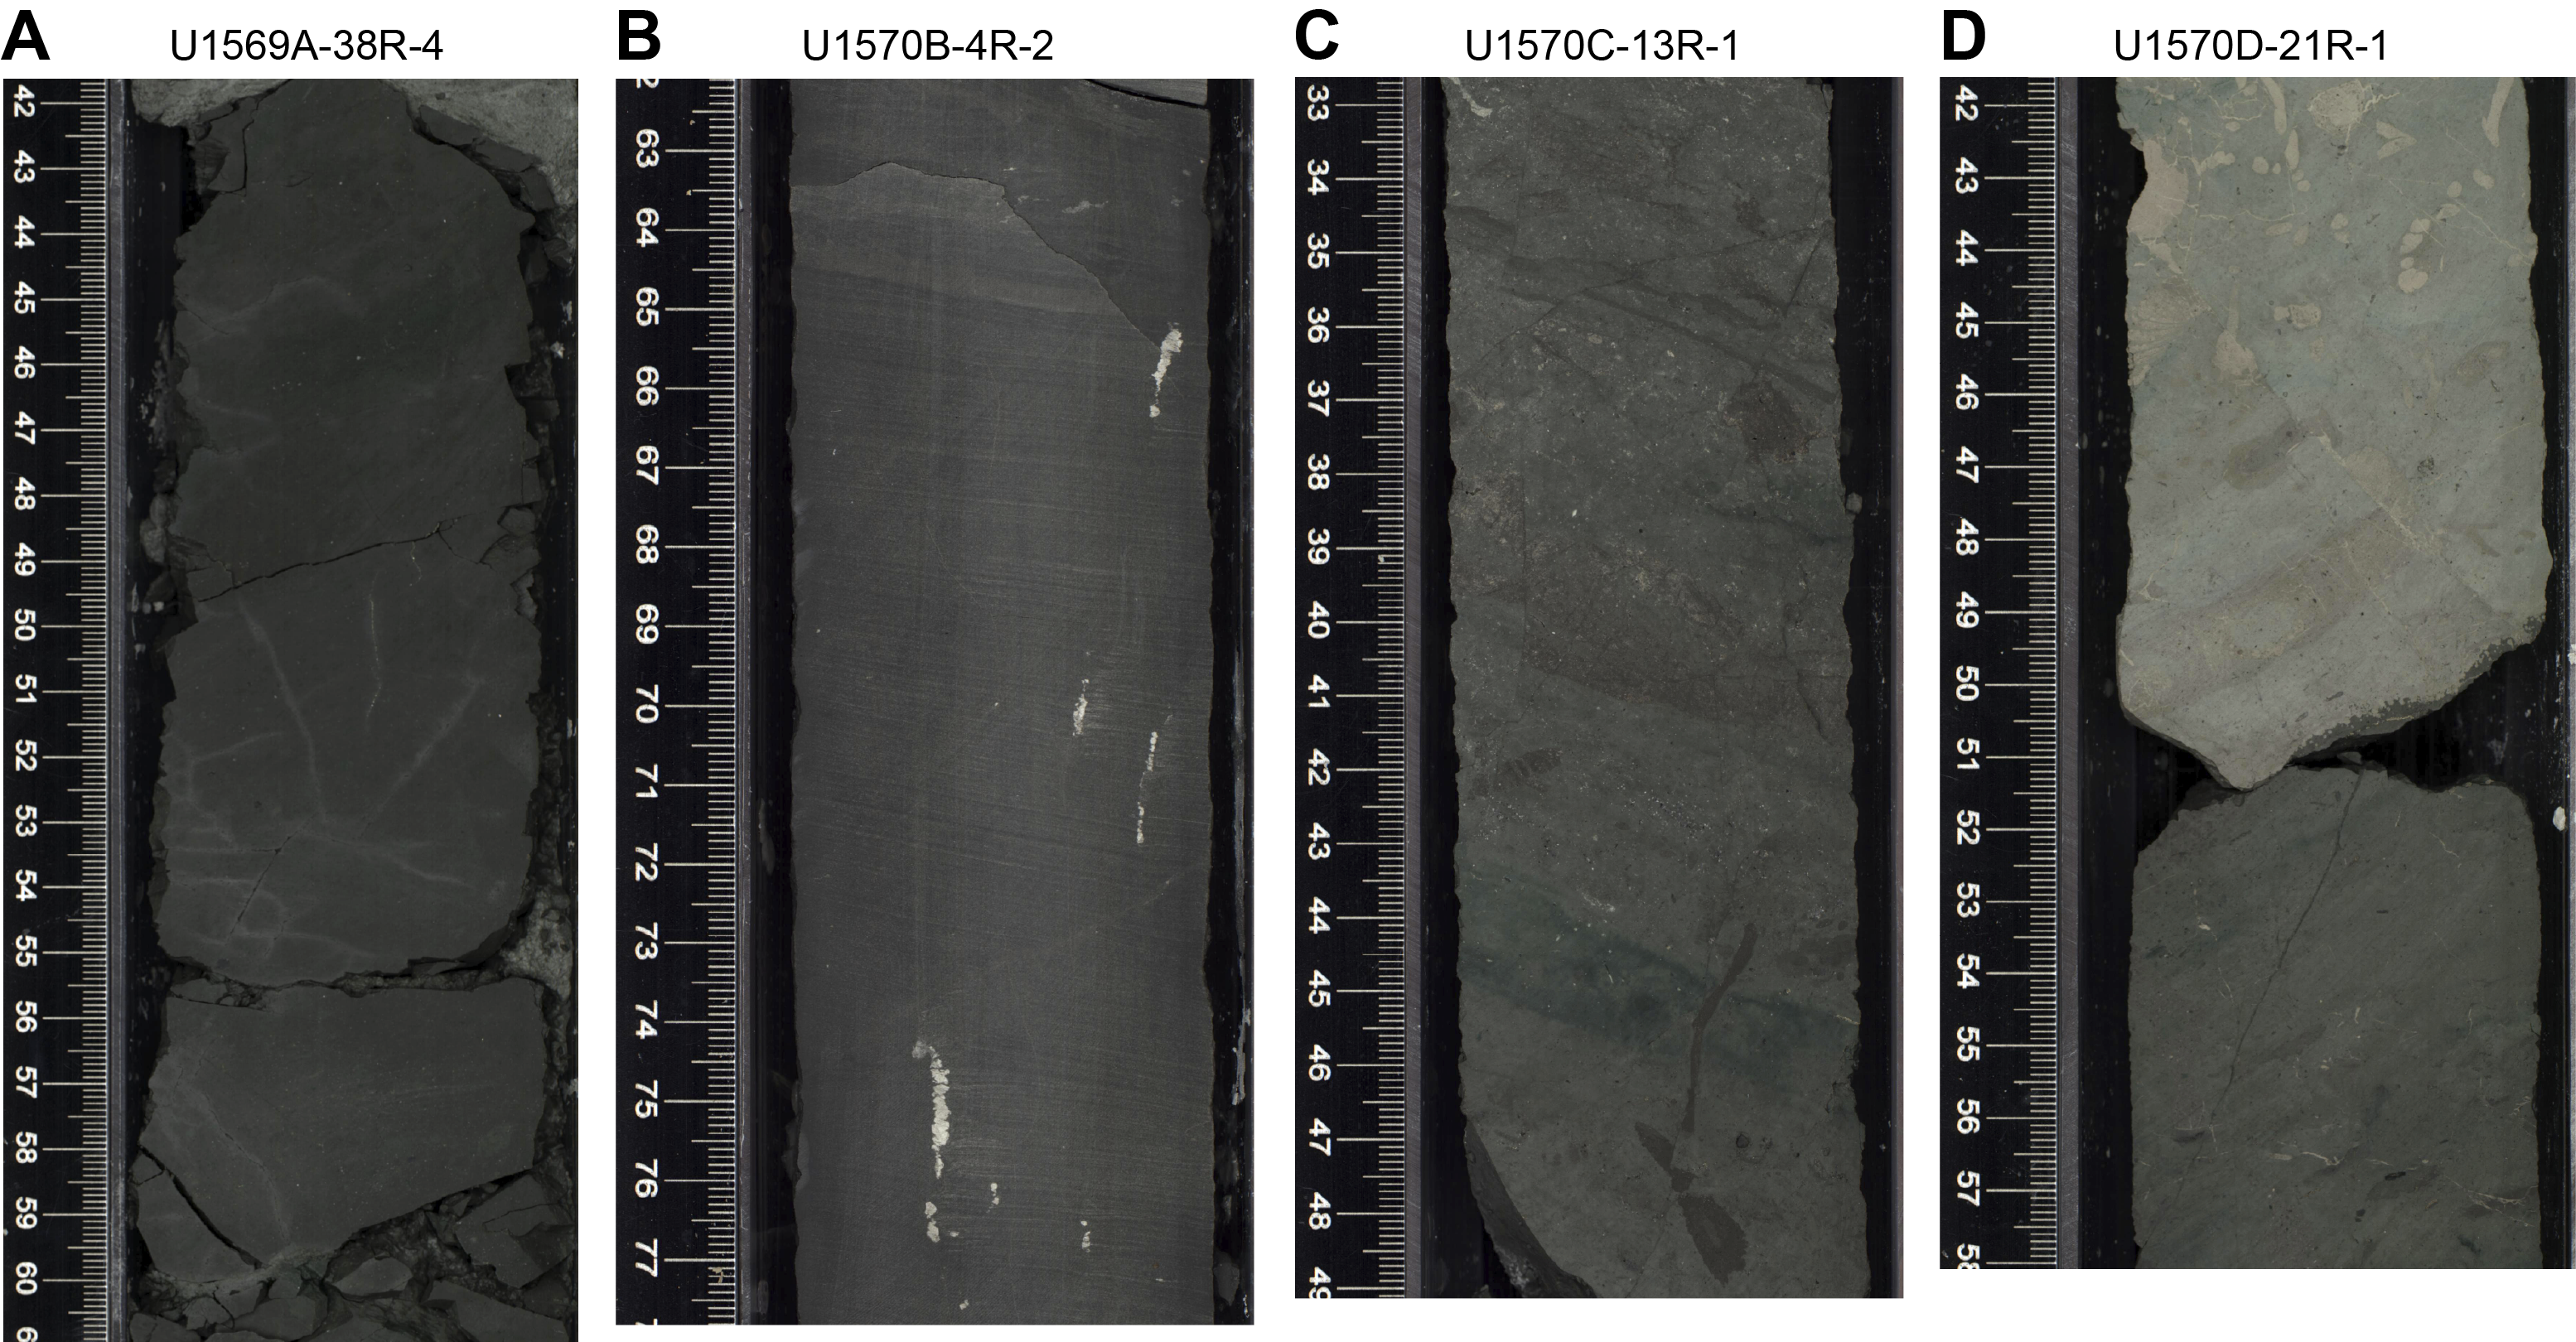
Figure F11. Lithologic characteristics, Unit VIII.
Questions remain regarding the emplacement setting and formation of this igneous unit. The highly pumiceous texture of the flow points toward subaerial or shallow subaqueous emplacement, whereas the coherent nature of the unit indicates a rate of decompression too low to drive explosive fragmentation, favoring a subaqueous environment (Cas and Simmons, 2018, and references therein). The completeness of crystals (e.g., plagioclase phenocrysts) also argues against explosive fragmentation (Allen and McPhie, 2003). The absence of peperite and hyaloclastite (Gifkins et al., 2002) and the preservation of the laminations also observed in Units V and VII favor shallow emplacement in unconsolidated sediments. The presence of a baked contact between Subunit Vb and Unit VI in Core 396-U1570D-14R indicates intrusion into preexisting sediment or rock.
The presence of garnet and cordierite together strongly indicates an aluminum-rich melt source. Garnet and cordierite have been documented in similar flows both as magmatic phenocrysts (e.g., Zeck and Williams, 2002; Kawabata and Takafuji, 2005) and xenocrysts of metamorphic origin (e.g., Bach et al., 2012; Munksgaard, 1985). The presence of graphite may indicate melting of a carbonaceous protolith. Two possible candidates are proposed. If the garnets and cordierites are metamorphic xenocrysts, they probably record a deep, high-grade metamorphic crustal component (i.e., metapelite). Alternatively, if they are magmatic phenocrysts, shallow, intense partial melting of pelitic rocks (e.g., contact metamorphism) is perhaps more likely. Composition and zoning of the garnet and cordierite crystals will be investigated to discriminate between these two origins during postcruise studies.
3.7. Lithostratigraphic Unit VII
- Intervals: 396-U1569A-37R-1, 33 cm, to 38R-3, 60 cm; 396-U1570A-27R-1, 14 cm, to 36R-CC, 25 cm; 396-U1570D-16R-2, 8 cm, to 21R-1, 3 cm
- Depths: Hole U1569A = 332.63–345.71 m CSF-A; Hole U1570A = 151.94–198.59 m CSF-A; Hole U1570D = 110.91–134.63 m CSF-A
- Age: earliest Eocene (PETM)
Lithostratigraphic Unit VII primarily consists of very dark gray and very dark grayish brown ash-rich siltstone with clay and common diagenetic pyrite. Unit VII is present in Holes U1569A, U1570A, and U1570D. Parallel lamination, slight to moderate bioturbation, and dewatering structures are present throughout the unit (Figure F10A, F10B). In Section 396-U1570D-20R-1, the color changes from very dark gray to dark greenish gray, and layers of tuffaceous and carbonaceous siltstone are present in this interval (Figure F10C, F10D). A large fragment of wood is found in Section 20R-3 (Figure F10D). Microscopic inspection of smear slides from Section 20R-1 indicate the presence of glass, diatoms, and radiolarians. In Hole U1570A, trace gastropods and mollusks (bivalves) are observed in Cores 29R–32R.
3.8. Lithostratigraphic Unit VIII
- Intervals: 396-U1569A-38R-3, 60 cm, to 44R-CC, 15 cm (bottom of hole); 396-U1570B-4R-1, 3 cm, to 10R-CC, 11 cm; 396-U1570C-6R-1, 4 cm, to 23R-CC, 19 cm (bottom of hole); 396-U1570D-21R-1, 3 cm, to 28R-CC, 26 cm (bottom of hole)
- Depths: Hole U1569A = 345.71–404.04 m CSF-A; Hole U1570B = 27.62–64.25 m CSF-A; Hole U1570C = 44.54–194.23 m CSF-A; Hole U1570D = 134.63–192.30 m CSF-A
- Age: Late Paleocene (Thanetian)
Lithostratigraphic Unit VIII is characterized by dark greenish gray to very dark gray bioturbated claystone with silt to siltstone. Unit VIII is present in Holes U1569A and U1570B–U1570D (Figure F11). Diagenetic pyrite is common in this unit, and localized limestone beds are present in Holes U1569A and U1570D. Microfault and dewatering structures are common through the interval in Holes U1569A, U1570C, and U1570D. In Hole U1570D, the Unit VII–VIII transition is marked by an erosional surface that separates tuff from the underlying bioturbated mudstone (Figure F10E).
3.9. Lithostratigraphic Unit IX
- Interval: 396-U1570B-11R-1, 9 cm, to 11R-1, 143 cm
- Depth: 66.09–67.43 m CSF-A
- Age: Late Paleocene (Thanetian)
Lithostratigraphic Unit IX consists of light gray limestone (Figure F12D). It is only present in Hole U1570B. The carbonate is likely calcareous in nature, and faint traces of biogenic material are present (e.g., foraminifers). Uniform and composite veins that are vertical to steeply dipping are present in some intervals of the unit. The white veins are carbonate, and the greenish gray veins consist of clay minerals. In Hole U1570B, Unit IX separates two similar units (VIII and X). Because Unit IX is Late Paleocene in age and Middle Paleocene is recovered in Hole U1570C, it is likely that either Unit IX is not laterally extensive or, less likely, not recovered in Hole U1570C. In Hole U1570B, Unit VIII and X are separated by Unit IX, which is not observed in Hole U1570C, indicating that the limestone bed was not present at that location. Thus, Unit IX is not laterally extensive to the east because the Middle to Late Paleocene boundary is likely recovered in Unit VIII in Hole U1570C (Figure F4).
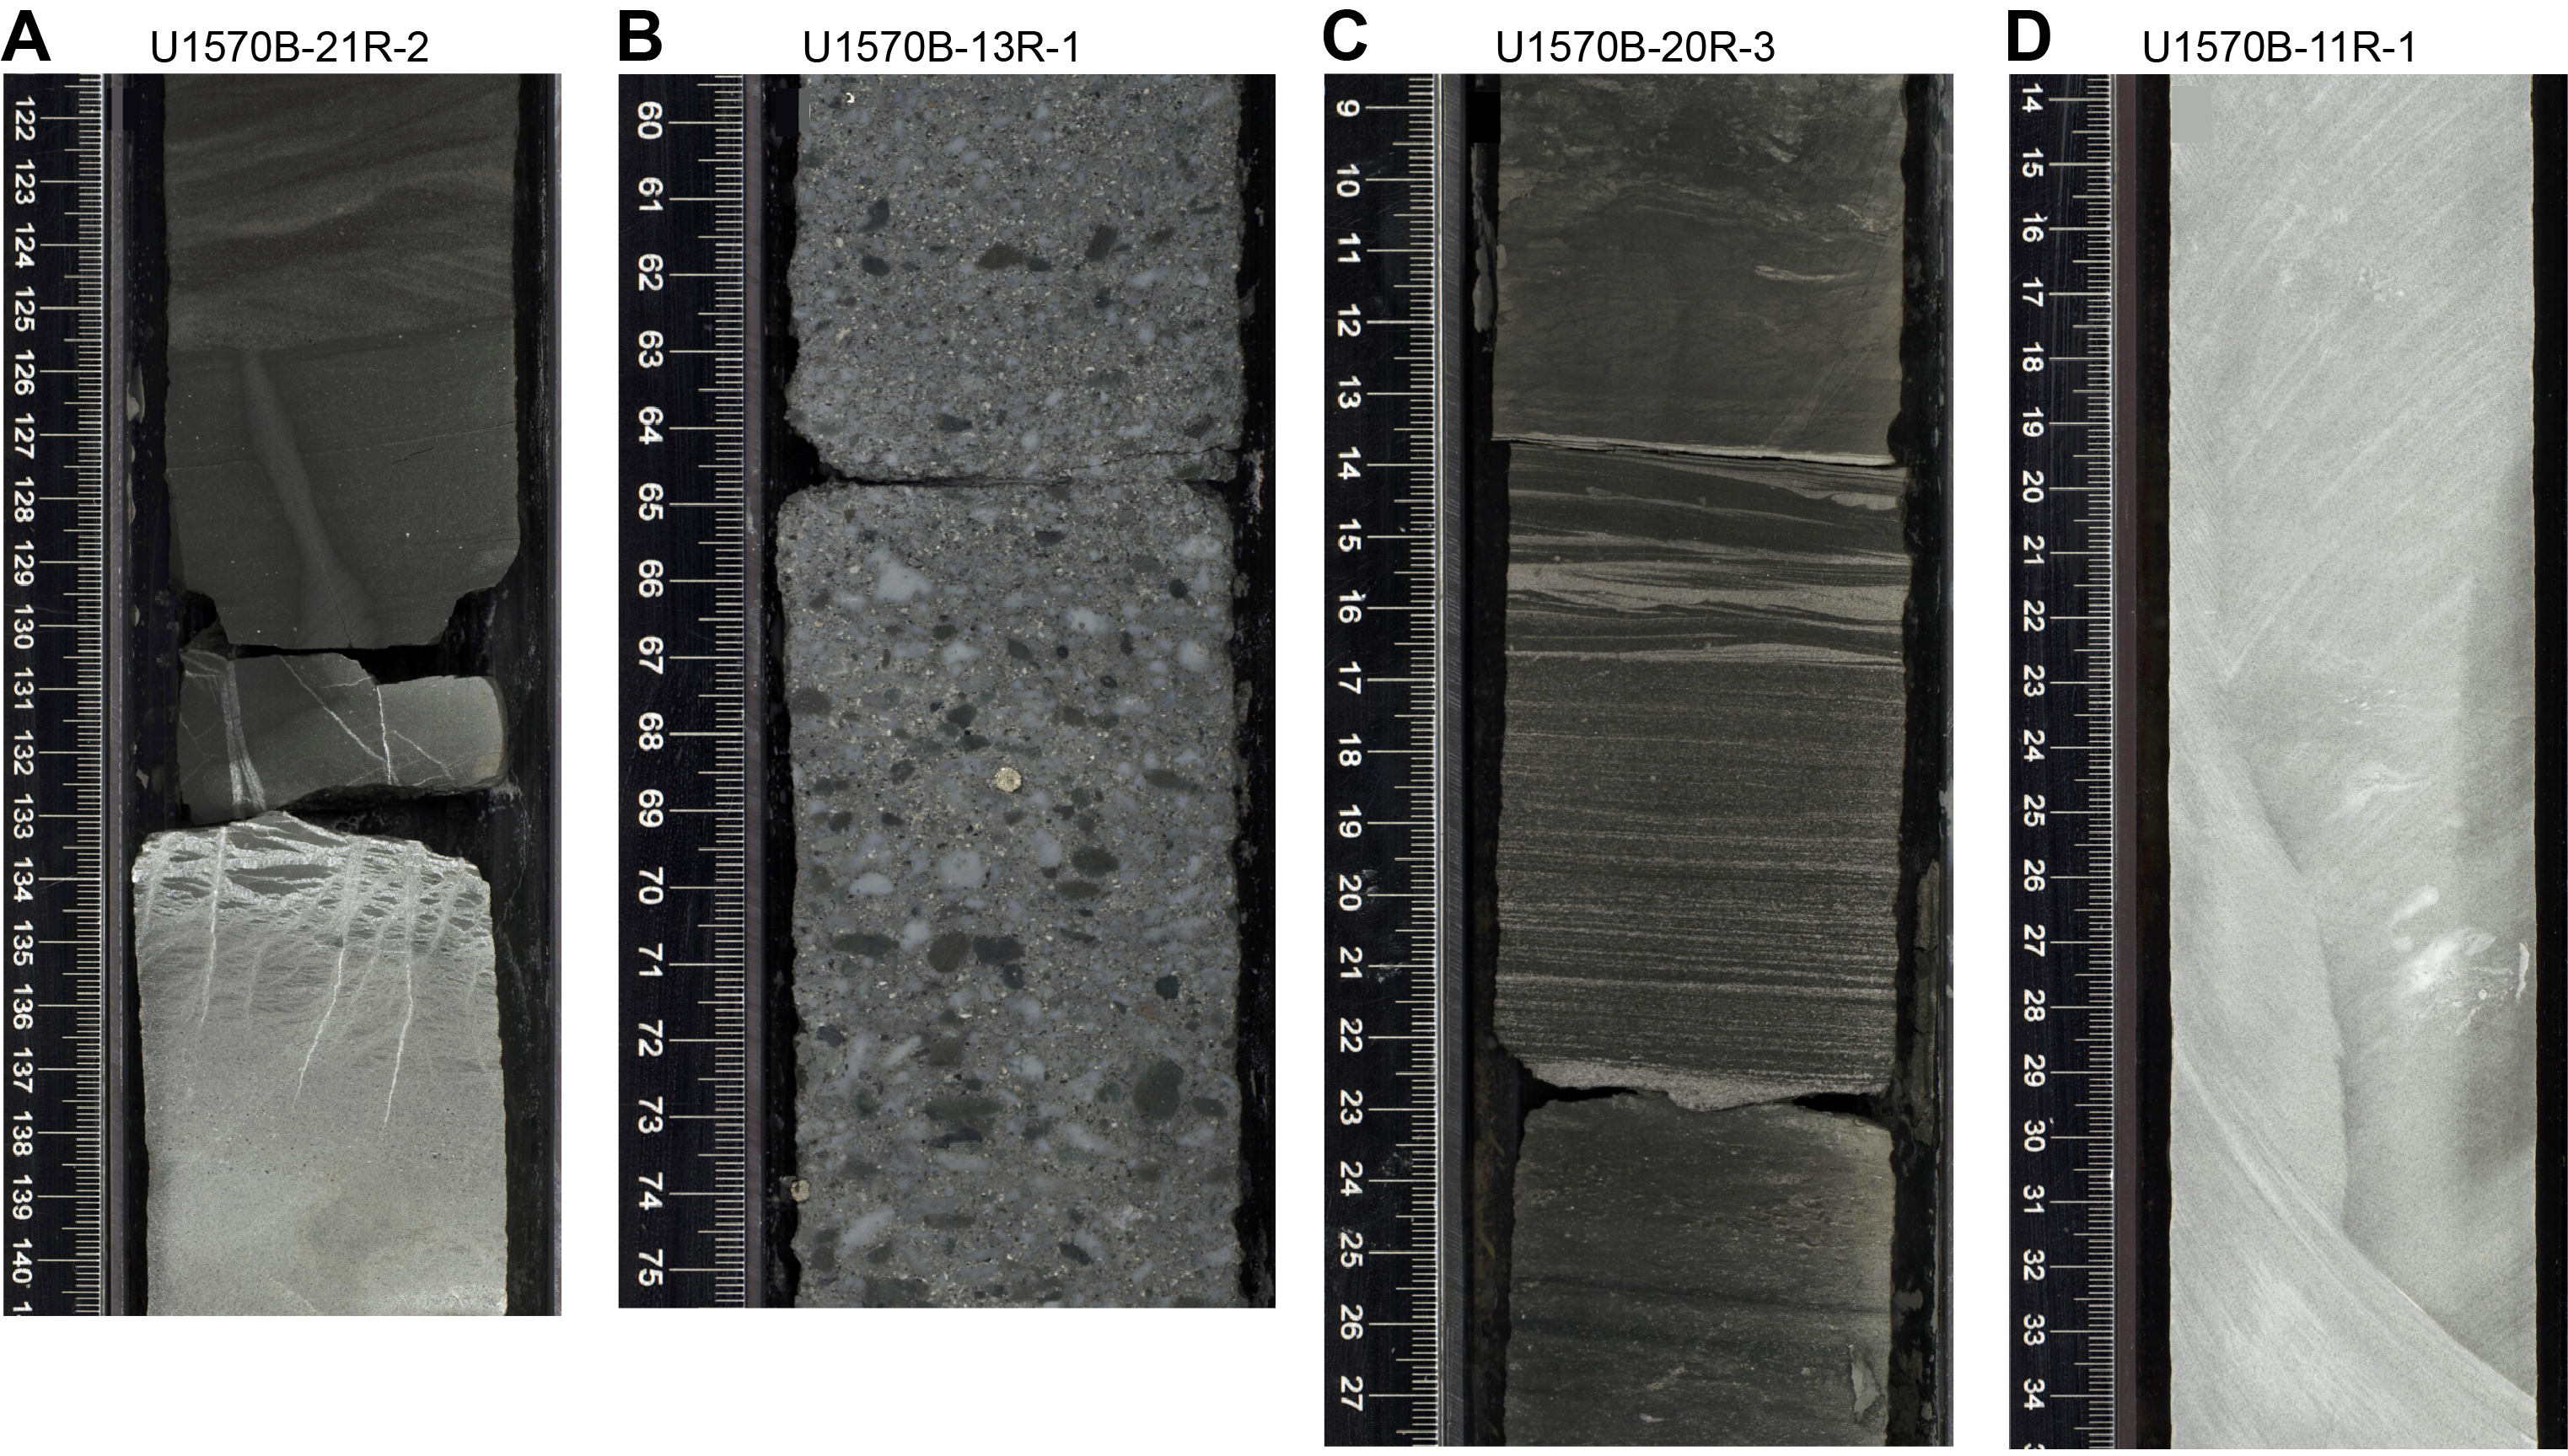
Figure F12. Lithologic features, Hole U1570B.
3.10. Lithostratigraphic Unit X
- Interval: 396-U1570B-11R-1, 143 cm, to 25R-CC, 29 cm (bottom of hole)
- Depth: 67.43–160.30 m CSF-A
- Age: Middle to Late Paleocene (Selandian to Thanetian)
Lithostratigraphic Unit X consists of very dark greenish gray siltstone with clay, sometimes ash rich, with common ash and rare beds of limestone (Figure F12A, F12C). Section 396-U1570B-13R-1 includes a volcaniclastic conglomerate that underlies a massive (>1 m) ash deposit in Core 12R, part of which is white and contains carbonate. The conglomerate contains pebble-sized (1–3 cm) clasts of dark greenish gray angular siltstone that is only somewhat lithified, suggesting short transport consistent with volcaniclastic deposition. Furthermore, the gray clay to coarse sand matrix material of the conglomerate contains glass (Figure F12B). Thin beds of light gray limestone with ash are present throughout the unit. The unit is mostly moderately to heavily bioturbated. Weak lamination is observed in Cores 16R–22R. Diagenetic pyrite is common within and above Section 18R-1 and in only trace occurrence downhole.
Unit X is only present in Hole U1570B. Although more variable in terms of lithology, much of Unit X resembles the lowermost Unit VIII in Hole U1570C. Additionally, both Units VIII and X include sediments of Middle Paleocene age (Selandian). This suggests that the lower part of Unit VIII in Hole U1570C likely corresponds to Unit X in Hole U1570B.
3.11. Lithostratigraphic correlation
A preliminary lithostratigraphic correlation across the five holes based on unit boundaries and biostratigraphic zonation is presented in Figure F3. None of the five holes have all ten lithostratigraphic units, but when tied together, the succession of holes can be combined for a more complete stratigraphic record. The units observed in each hole are documented in Table T3. Ages of the sediments across the five holes are tentatively constrained with biostratigraphic markers identified aboard ship from core catcher material (“Dino zone” in Figure F4 in the Sites U1567 and U1568 chapter [Planke et al., 2023c]). Unconformities representative of depositional hiatus and/or erosion of sediments are identified at the base of Unit I. For example, the base of Unit I is Pleistocene in age, whereas the top of Unit II is Miocene in age (Figure F3). Based on biostratigraphic zonation, it is likely that unconformities are also present below Unit II in Holes U1570A–U1570C and below Unit III in Hole U1569A, separating the Neogene and Paleogene. The unconformities across the five holes differ in terms of hiatus duration. They are mostly, though not necessarily, distinguished by an erosional or sharp lithologic contact. In some intervals, these contacts are lost because of drilling disturbance. Biostratigraphic constraints are required to confirm the precise position of the unconformities and stratigraphic gap of the associated hiatus.
3.12. Structural geology
Structures and related features are observed across all holes at Sites U1569 and U1570 in Units V, VII, and VIII. The uppermost cores in which deformation structures occur are Cores 396-U1569A-25R, 396-U1570A-9R, 396-U1570B-5R, 396-U1570C-11R, and 396-U1570D-17R. In part, deformation structures may have been overprinted by drilling disturbance from the RCB system. As a result, structures are likely underestimated because we only include the well-preserved ones.
3.12.1. Normal faults
Centimeter- to millimeter-scale normal faults represent the most common structural features identified at these sites (Figure F13). Generally, these structures are clearly observed in laminated sediments and sedimentary rocks and are highlighted by offset laminations/beds. These structures form either a single planar structure typically with centimeter-scale offset and apparent dips ranging 40°–60° or a semiregular array with millimeter-scale spacing showing often domino-like geometry (Figure F13). These extensional fractures are typically not more than 1 mm thick, although in some rare cases, they can reach 1 cm and can be filled by fine-grained black materials likely consisting of clays.
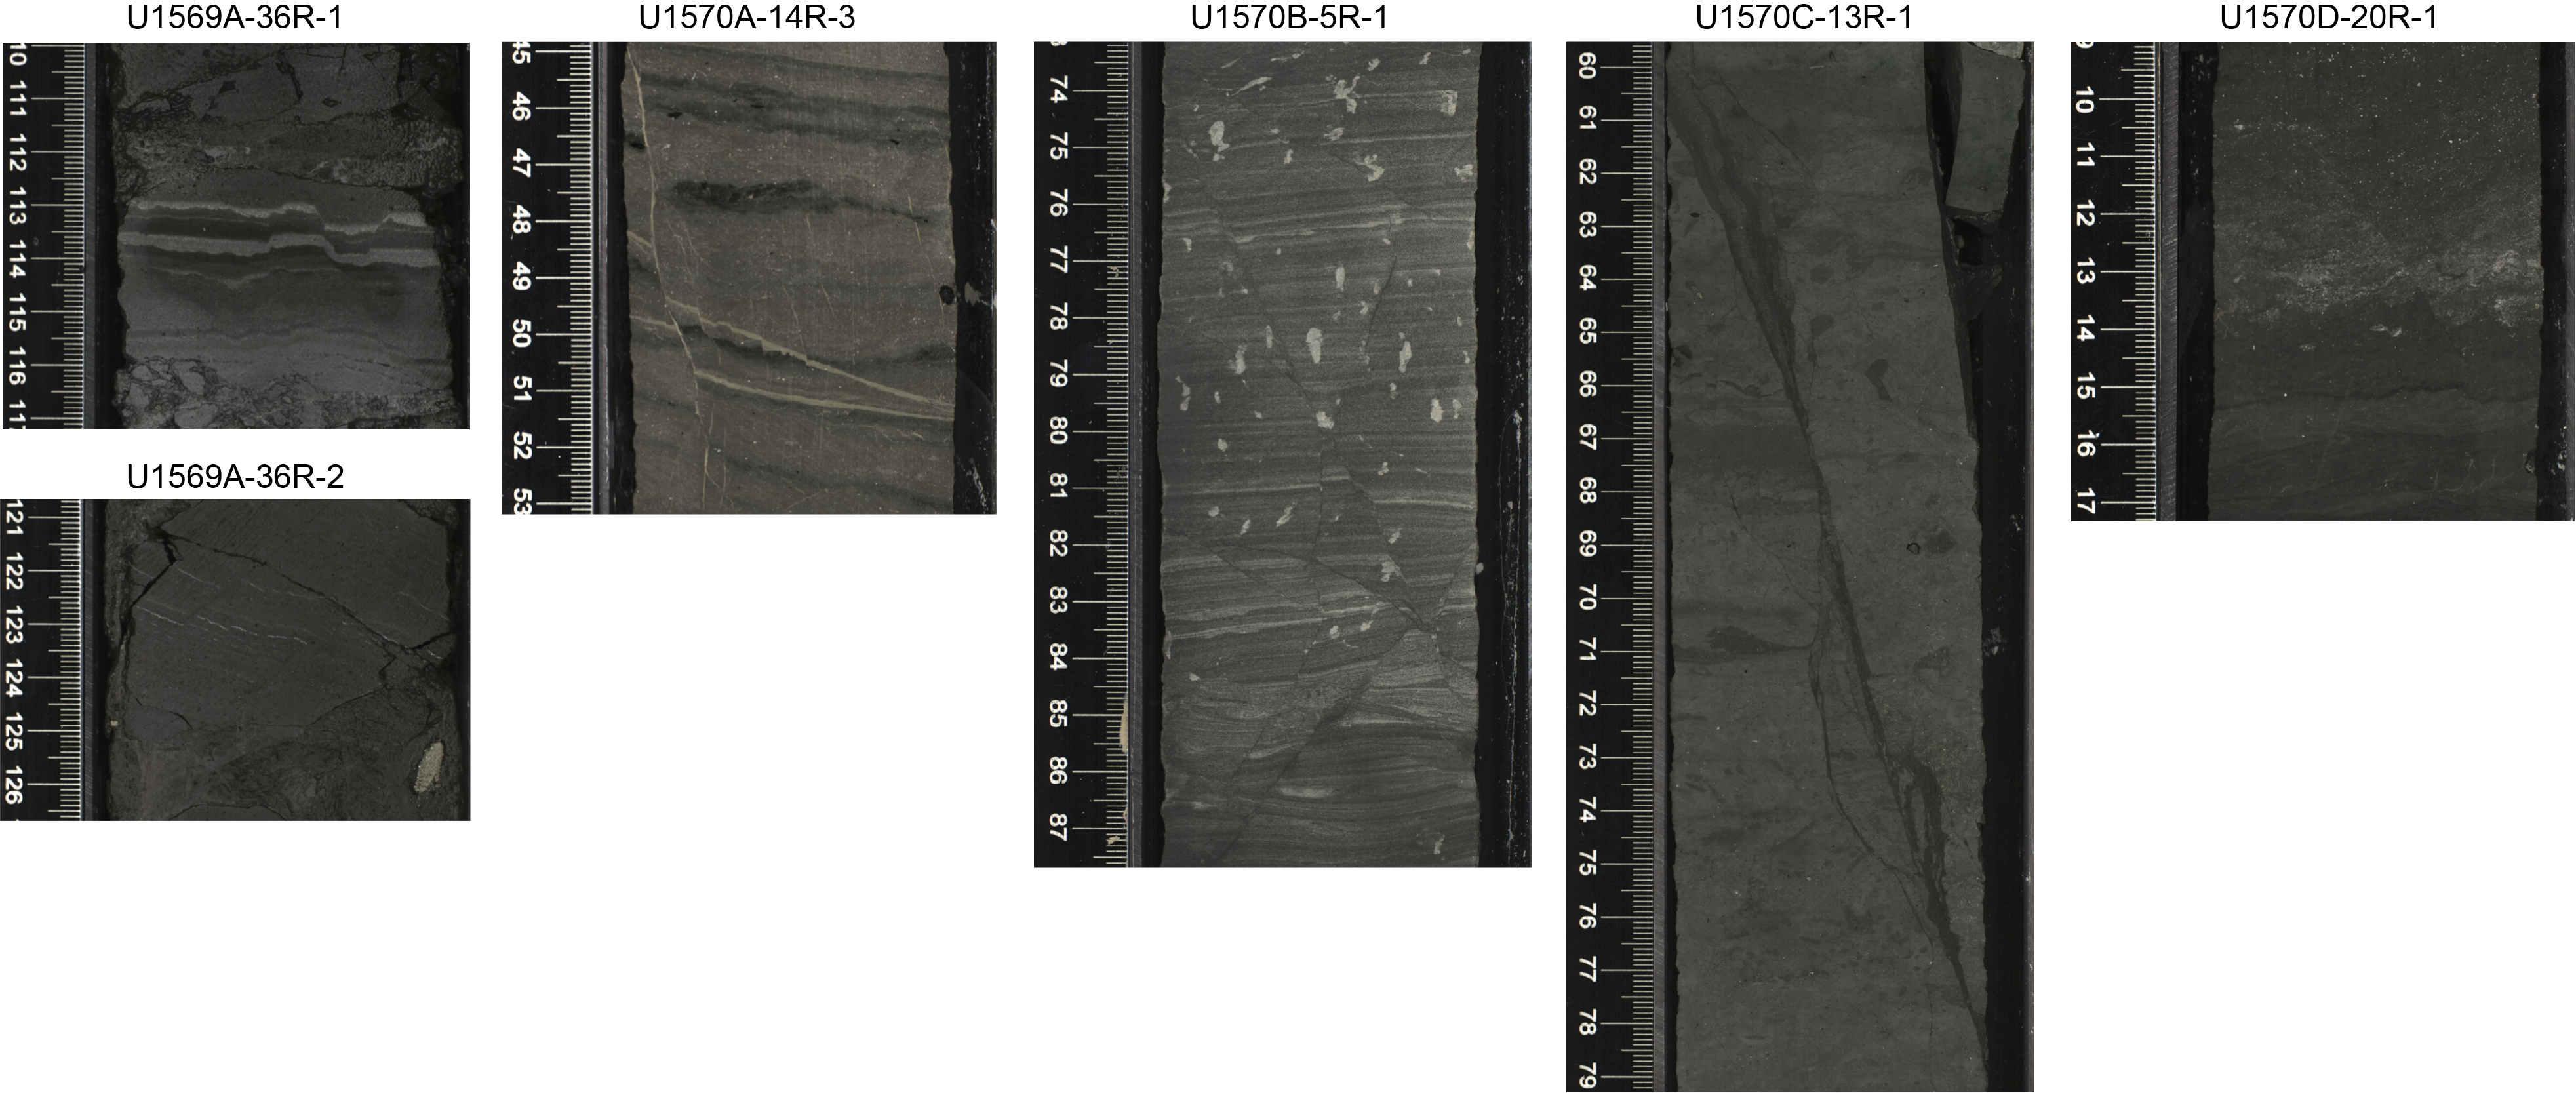
Figure F13. Extensional fractures.
3.12.2. Open fractures and joints
In several intervals, including Sections 396-U1569A-27R-2 and 396-U1570A-14R-2, 16R-3, and 17R-1, vertical centimeter-scale series of en echelon open fractures are visible, filled by light brown clay. Such fractures are rare and heterogeneously distributed (Figure F14). In addition, millimeter-scale fractures related to dewatering structures are also observed. In layered sediments, orientations of fractures appear deflected across some beds, likely related to variable mechanical strength and permeability properties (Figure F14).
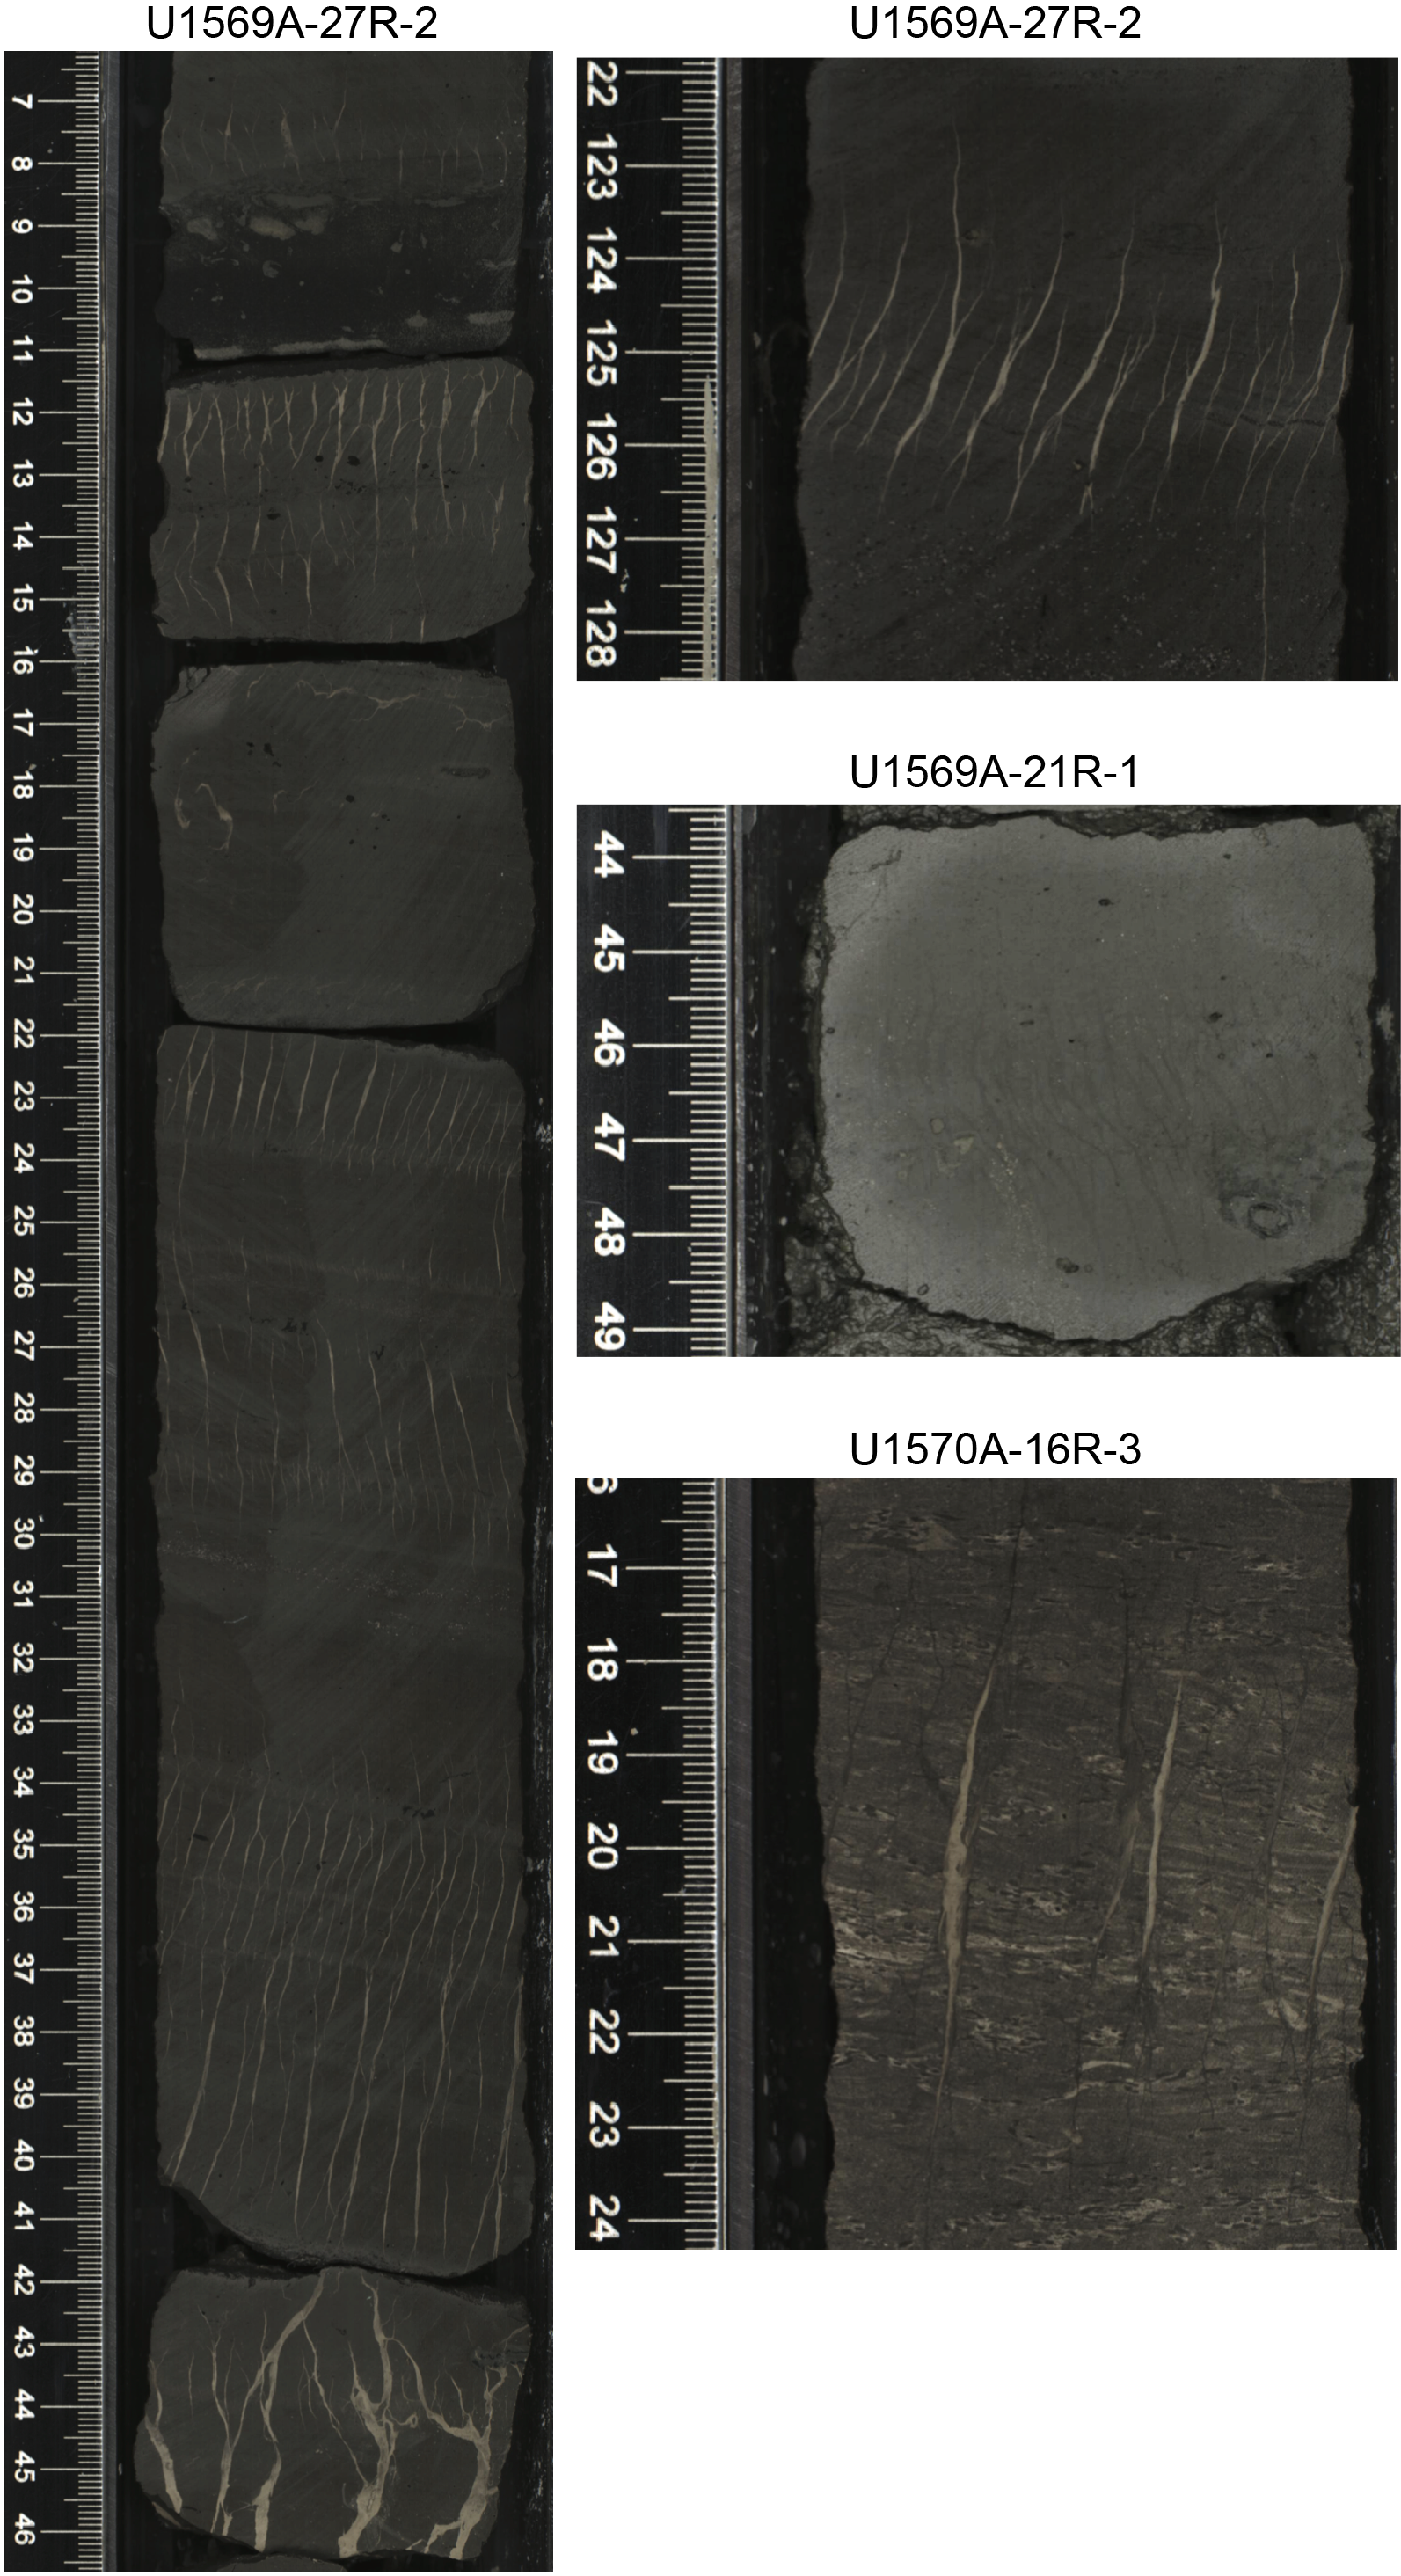
Figure F14. Open fractures and dewatering structures.
3.12.3. Tectonic breccia
Interval 396-U1570C-17R-4, 8–26 cm, documents a zone of high strain characterized by a high-density network of fractures filled by black fine-grained clays passing laterally to cataclasite and gouge (Figure F15). The cataclasite consists of clasts of variable sizes showing jigsaw structure. The gouge is characterized by fine-grained black clays with a matrix-supported fabric and few millimeter-scale clasts.
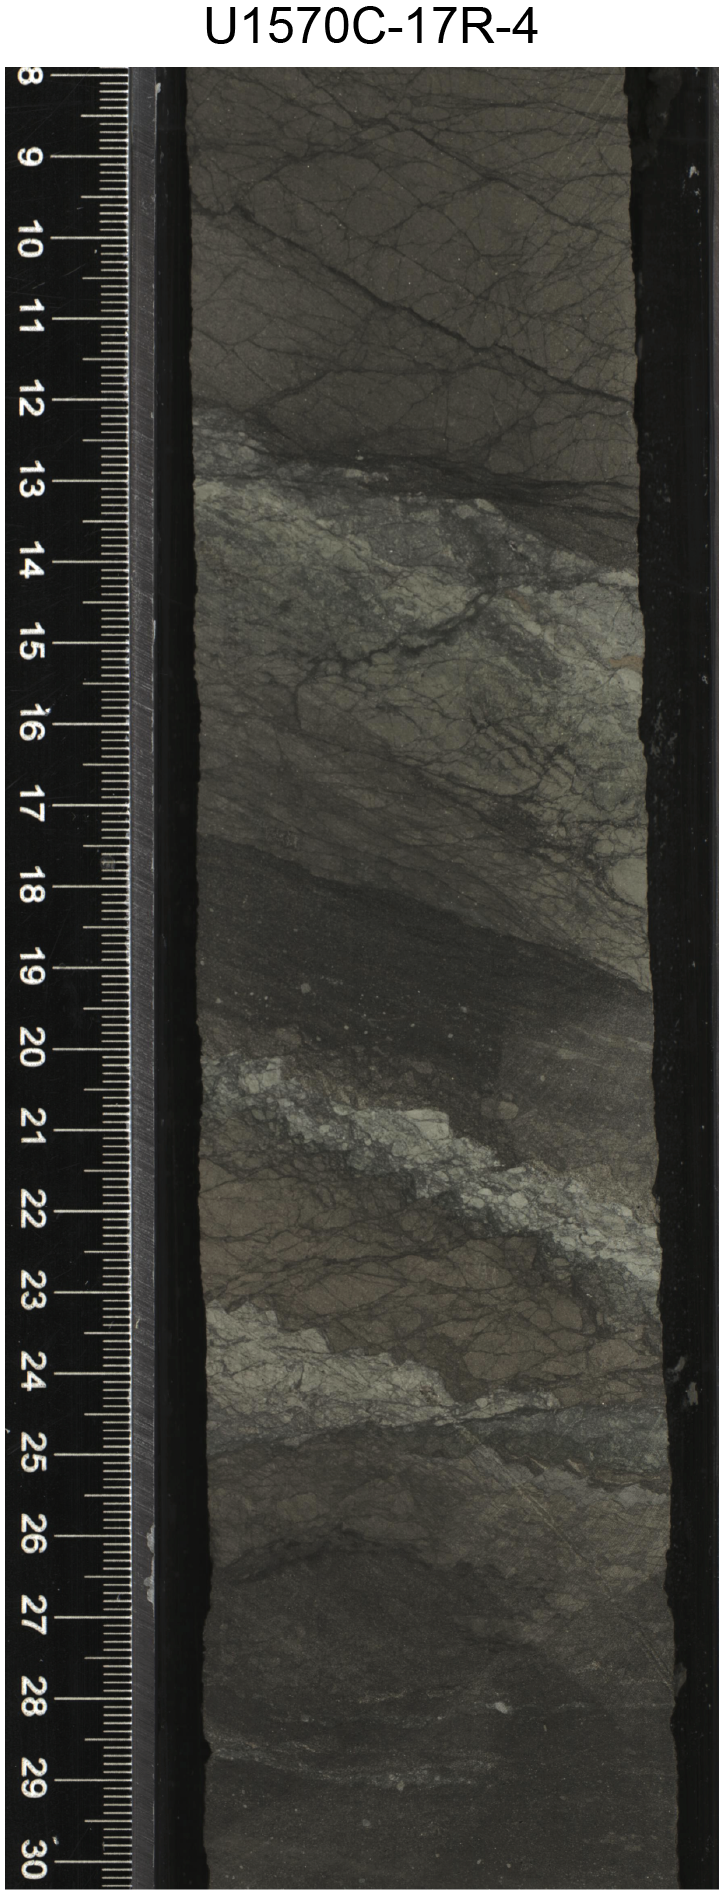
Figure F15. Tectonic breccia.
The precise significance of these deformations and their characterization require further observations. However, based on the tectonic setting of the Mimir High, it seems likely that the observed normal faults developed during Paleocene rifting and following Early Eocene uplift during initial seafloor spreading (Berndt et al., 2000; Polteau et al., 2020).
4. Biostratigraphy
Sediment samples from core catchers and selected core intervals were processed and analyzed for siliceous, organic-walled, and/or calcareous microfossils. The mudline in all holes was processed for calcareous biota.
Siliceous and organic-walled microfossils were found in various abundances in and below the Quaternary strata. Calcareous microfossils are restricted to the Quaternary strata. A summary of microfossil abundances for Sites U1569 and U1570 is listed in Tables T4, T5, T6, T7, and T8.
4.1. Siliceous microfossils
Core catcher and occasional split core smear slides provided diatom biostratigraphic data that allowed the identification of Middle Miocene, some Upper Oligocene, Lower Eocene, PETM, and Paleocene intervals in Holes U1569A and U1570A–U1570D. The Neogene and Oligocene portions are correlated to the North Atlantic diatom zones summarized in Scherer et al. (2007), and the lower Paleogene materials are correlated to the diatom zones of Oreshkina and Radionova (2014) from Russian Platform sections.
4.1.1. Miocene and Oligocene
Beneath younger sediments barren of diatoms, the Middle Miocene Denticulopsis lauta Zone, characterized by D. lauta, Actinocyclus ingens, Thalassionema nitzschioides var. parva, and Rhizosolenia hebetata, complimented by a characteristic Middle Miocene silicoflagellate assemblage, is recognized in core catcher Samples 396-U1569A-9R-CC to 11R-CC, 396-U1570A-5R-CC, and 396-U1570C-5R-CC. The Middle Miocene diatom assemblage is also recognized in the upper part of Sample 396-U1570A-6R-CC, but a sharp contact to underlying barren sediments occurs in that same core catcher, presumably marking an unconformity. Samples 396-U1569A-13R-CC and 14R-CC include an assemblage attributable to the latest Oligocene and are assigned to the upper Rocella gelida Zone (Scherer et al., 2007). This includes R. gelida, Rocella praenitida, Azpeitia oligocenica, Triceratium barbadense, Trinacria excavata, and Cymatosira biharensis. An unconformity spanning most or all of the Lower Miocene is inferred. No Miocene or Oligocene diatoms were found in Holes U1570B and U1570D.
4.1.2. Lower Paleogene
Diatoms are generally poorly preserved in Samples 396-U1569A-15R-CC to 20R-CC, but several specimens are consistent with an Eocene age. An Early Eocene age is assigned to Samples 22R-CC and 23R-CC by the occurrences of Trinacria regina, Trinacria heibergii, Hemiaulus elegans, Hemiaulus danicus, Hemiaulus polymorphus, Proboscia cretacea, Solium exculptum, and T. excavata. All of these taxa are common in the Lower Eocene Fur Formation of Denmark (Homann, 1991; Fenner, 1994) and the Lower Eocene of the Russian Platform (Oreshkina and Radionova, 2014). The absence of taxa characteristic of the PETM and the Upper Paleocene, such as Hemiaulus proteus, H. danicus, and Hemiaulus curvatulus, further suggests a post-PETM, early Early Eocene age. Although several taxa also occur in sediment of a similar age in the western North Atlantic (Witkowski et al., 2020), many components of the assemblage show regional differences, indicating a significant level of endemism. Unlike Witkowski et al. (2020), the Russian Platform material is not independently calibrated to the Gradstein et al. (2012) timescale.
Relatively poor preservation of diatoms persists to the base of the Hole U1569A, complicating diatom-based biostratigraphic age assessment. However, it is apparent that these sediments were diatomaceous before diagenesis of opal-A, which is characterized by diatom dissolution and recrystallization to opal-CT. This occurs with a combination of corrosive pore waters, heating, and/or relatively deep burial (Figure F16). Lower Eocene diatoms are generally abundant in most of Hole U1570A, below the unconformity inferred at the base of Sample 6R-CC. The Early Eocene assemblage is similar to that described above. The interval identified by palynology as PETM (earliest Eocene) contains abundant but highly fragmented and poorly preserved diatoms.
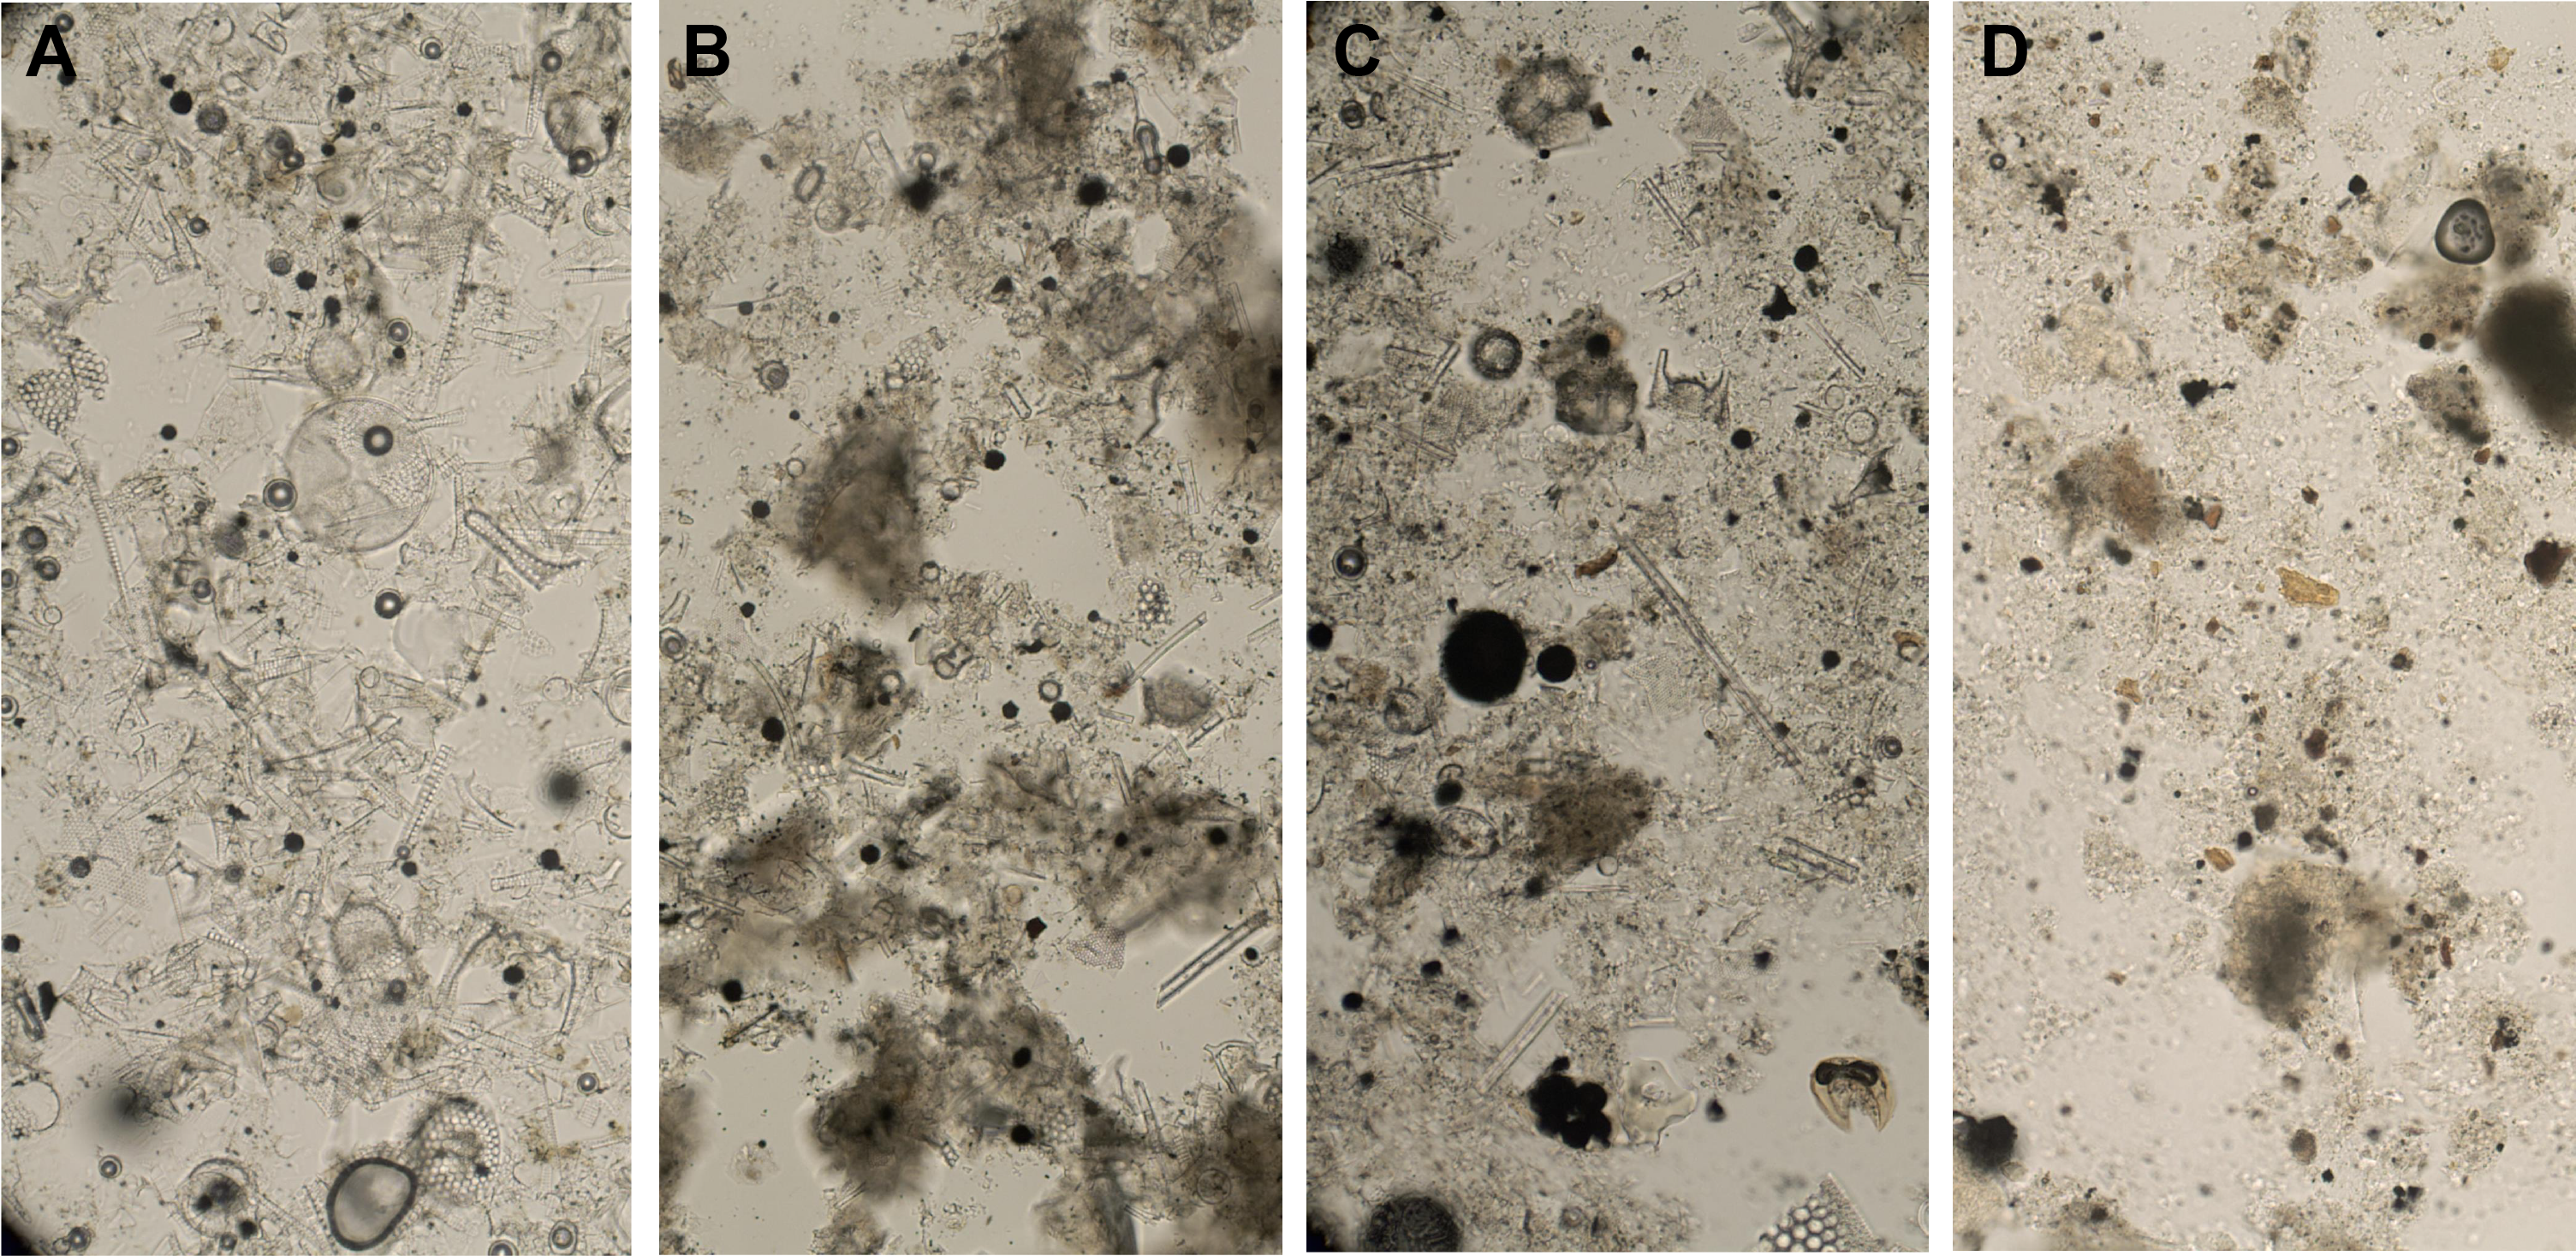
Figure F16. PETM age diatom occurrence and preservation.
Samples from Hole U1570B are barren or contain traces of very poorly preserved diatoms. Hole U1570C beneath the unconformity in Core 6R contains abundant but highly fragmented diatom assemblages attributable to the Paleocene. Age-diagnostic taxa include Pterotheca kittonia in Sample 12R-CC. A Middle Paleocene age is assigned to Samples 15R-CC to 18R-CC by the occurrence of Trinacria ventriculosa and is assigned to the T. ventriculosa Zone (Oreshkina and Radionova, 2014).
Diatoms of Paleocene to Early Eocene age occur in Hole U1570D in Samples 5R-CC to 24R-CC. The Early Eocene is assigned down to Sample 16R-CC with the same taxa described for this interval in Hole U1570A. The H. proteus Zone (Oreshkina and Radionova, 2014), which corresponds to their dinocyst Apectodinium augustum Zone (and the PETM), is recognized by the presence of H. proteus and other associated key taxa, including the diatoms noted in the exceptionally well preserved PETM interval in Holes U1567A and U1567B. Sample 396-U1570D-17R-CC is particularly rich in diatoms, with more than 50 distinct taxa recognized to date, including some freshwater diatoms, such as Aulacoseira cf. granulata. This interval includes abundant evidence of nonmarine algal remains in the palynological preparations. Underlying this interval are diatoms of the Upper Paleocene T. ventriculosa Zone, with taxa described for this interval in Hole U1570C.
The variable diatom preservation in this suite of holes demonstrates the sensitivity of diatoms to diagenesis generally linked to burial depth (Mitsui and Taguchi, 1977). Diatoms representing the PETM interval can be exceptionally well preserved when subjected to under 100 m of overburden, but diatoms are rarely well preserved when beneath more than 300 m of strata, as illustrated in Figure F16.
4.2 Palynology
4.2.1. Site U1569
In total, 33 core catcher samples from Hole U1569A were processed for palynology. All samples were processed using the standard hydrofluoric acid (HF) technique (see Biostratigraphy in the Expedition 396 methods chapter [Planke et al., 2023a]). Overall, palynomorphs and, notably, the dinocysts among them were found to occur in highly variable states of preservation and abundance. Therefore, no fully quantitative analyses were conducted. The upper analyzed part of Hole U1569A may be assigned to the Neogene and Late Oligocene (Samples 9R-CC to 15R-CC), whereas the remainder is assigned to the early Paleogene. Therefore, the discussion below is presented in two parts. Occurrences of palynofacies categories and palynomorphs in Hole U1569A are listed in Table T9 for the Neogene and uppermost Oligocene portion and Table T10 for the early Paleogene.
4.2.1.1. Hole U1569A Miocene and Oligocene
Although the samples above Sample 396-U1569A-9R-CC are likely of Quaternary age (see Siliceous microfossils and Calcareous nannofossils), a section of Miocene age was recovered (Sample 15R-CC). In effect, Samples 9R-CC to 11R-CC may be assigned to the Middle Miocene, whereas the underlying section to Sample 15R-CC is of latest Oligocene to Early Miocene age. The Middle Miocene succession is inferred from the occurrence of age-diagnostic taxa like Labyrinthodinium truncatum (Sample 11R-CC; early Middle Miocene) and Hystrichosphaeropsis obscura (Sample 9R-CC; early Late Miocene) and associated species like Invertocysta lacrymosa and Habibacysta tectata (cf., e.g., Munsterman and Brinkhuis, 2004; Egger et al., 2016; Dybkjær et al., 2021).
The latest Oligocene to early Early Miocene (Aquitanian) age for the underlying section down to Sample 396-U1569A-15R-CC is based on the distribution and extinction patterns of, from older to younger, Artemisiocysta cladichotoma, Chiropteridium spp., Cordosphaeridium cantharellum, Thalassiphora pelagica, and Svalbardella spp. (cf. Dybkjær et al., 2021).
4.2.1.2. Hole U1569A Paleogene
Sample 396-U1569A-15R-CC is barren but is likely derived from below the unconformity between the Neogene–Upper Oligocene and the lower Paleogene. From the underlying section, downhole dinocyst first and last occurrences allow recognition of a middle Lower Eocene section, an uppermost Paleocene–lowermost Eocene section, and a likely Upper Paleocene section (i.e., with much of the lower Lower Eocene missing). The dinocyst distribution, albeit of low diversity and with often very poor preservation, permits recognition of the zones and subzones of Bujak and Mudge (1994). These are indicated in Table T10, as are the index species. A concise summary is given in Table T11, which also includes results from holes drilled at Site U1570.
Of particular interest is an intra-Lower Eocene discontinuity between Samples 396-U1569A-20R-CC and 21R-CC, where Zone E2 of Bujak and Mudge (1994) is conspicuously missing. Similarly, only a single core catcher sample (37R-CC) can be positively assigned to Subzone P6b of Bujak and Mudge (1994) because of the scarcity of the subzone-defining taxon A. augustum, correlative to the PETM interval. This sample is followed directly downhole by middle Upper Paleocene Subzone P5b, with the uppermost Paleocene Subzone P6a apparently missing. An abundance of Cerodinium wardenense, indicative of the Subzone E1a of Bujak and Mudge (1994), occurs in Samples 33R-CC to 30R-CC. Samples 36R-CC to 34R-CC are virtually devoid of recognizable age-diagnostic dinocysts. Intriguingly, Sample 33R-CC is devoid of A. augustum but contains very abundant Caryapollenites pollen grains, which characterizes the peak of the PETM carbon isotope excursion in the North Sea (e.g., Eldrett et al., 2014; Frieling et al., 2016). We therefore surmise that in the phytoclast, pollen, and spores that dominate Sample 33R-CC, and especially in the overmature to barren Samples 36R-CC to 34R-CC, occurrences of A. augustum might have been missed because of combined effects of massive terrestrial organic matter influx and poor preservation/absence as a result of localized thermal alteration. Therefore, although we can only positively identify the PETM interval in Sample 37R-CC, we anticipate the PETM interval to also encompass Cores 36R through 34R.
The expanded Upper Paleocene succession downhole from Sample 396-U1569A-37R-CC is characterized by common to abundant reworked Upper Cretaceous palynomorphs (Table T10) and is mainly assigned to Zone P5 of Bujak and Mudge (1994). Sample 44R-CC, the lowermost sample, may be assigned to Zone P4 of Bujak and Mudge (1994) based on the occurrence of Palaeocystodinium bulliforme (referred to as Palaeocystodinium cf. australinum in Bujak and Mudge [1994]).
4.2.2. Site U1570
Approximately 100 samples, mainly from core catchers and spanning all four holes of Site U1570, were processed and analyzed for palynology. All samples were processed using the standard HF technique (see Biostratigraphy in the Expedition 396 methods chapter [Planke et al., 2023a]). Similar to Hole U1569A, palynomorphs and, notably, the dinocysts among them occur in highly variable numbers and states of preservation; therefore, no detailed quantitative analyses were conducted.
Again, similar to the situation at Site U1569, before reaching the Paleogene section, all the holes at Site U1570 penetrated a relatively thin Quaternary and Neogene (Miocene) sediment cover (see Siliceous microfossils and Calcareous nannofossils). The Quaternary and Miocene sequence was only sampled sparsely (Samples 396-U1569A-5R-CC and 6R-CC) for palynology. The content of the samples is similar to that described above for the Middle to Late Miocene in Samples 9R-CC to 11R-CC. In this section, we focus on the Paleogene strata only.
4.2.2.1. Hole U1570A
Downhole dinocyst first and last occurrences allow recognition of a very expanded Lower Eocene section, although the lowermost Eocene, specifically the basal PETM interval, is missing. The zones and subzones of Bujak and Mudge (1994) are indicated in Table T12, as are the index species, and a summary is given in Table T11.
An expanded peak PETM to immediately post-PETM succession is recognized. This succession, with the last occurrence of A. augustum (between Samples 396-U1570A-28R-CC and 27R-CC) closely followed by the single occurrence of Phelodinium magnificum (Sample 27R-CC) in turn directly followed by the C. wardenense acme (typical for Subzone E1a) between Samples 28R-CC and 18R-CC (Table T12), is consistent with the successions described by Bujak and Mudge (1994) and Mudge and Bujak (1994, 1996, 2001). These exact sequences have been described for a large number of industrial wells in the greater North Sea area, including the Norwegian Sea, spanning the Paleocene–Eocene interval.
4.2.2.2. Hole U1570B
The recovered Paleogene section of Hole U1570B is tentatively assigned to the Late Paleocene, but it yields only very poorly preserved and/or low diversity palynological assemblages. The few recognizable downhole dinocyst first and last occurrences allow only tentative assignment to Upper Paleocene Zones P4–P5 and subzones based on the distribution patterns of the index species Alisocysta margarita, Palaeoperidinium pyrophorum, and P. bulliforme (Tables T11, T13). Abundant reworked dinocysts, mostly from the Upper Cretaceous, are characteristic for this interval. The lower parts of the recovered section are increasingly difficult to assign to the established zonations because of a combination of abundant Upper Cretaceous reworking and generally poor preservation. A few specimens in Samples 19R-CC and 20R-CC superficially resemble Isabelidinium? viborgense, the marker taxon for Middle Paleocene (Selandian) Zone P3. Unlike in Hole U1570C, no well-preserved specimens of this marker are present, and it thus remains uncertain whether this part of the succession is of a Late or Middle Paleocene age.
4.2.2.3. Hole U1570C
The Paleogene section of Hole U1570C, similar to Hole U1570B, is entirely assigned to the Middle and Upper Paleocene. The recovered succession yields only (very) poorly preserved, low diversity, palynological assemblages. Still, the few downhole dinocyst first and last occurrences allow assignment to Upper Paleocene Zones P3–P5 and subzones on the basis of the distribution patterns of the index taxa A. margarita, P. pyrophorum, P. bulliforme, and Isabelidinium? viborgense (Tables T11, T14). The Upper Cretaceous reworking is again dominant in the lower part of the section.
4.2.2.4. Hole U1570D
Downhole dinocyst first and last occurrences allow recognition of an expanded but likely partly discontinuous lowermost Eocene–Upper Paleocene section. The zones and subzones of Bujak and Mudge (1994) are indicated in Table T15, as are the index species. A summary is presented in Table T11.
The similarity between this hole and Hole U1570A regarding the PETM to immediately post-PETM succession is remarkable, as indicated by the total range of A. augustum. As in Hole U1570A, the last occurrence of A. augustum (between Samples 396-U1570D-17R-CC and 16R-CC) is closely followed by a conspicuous single occurrence of P. magnificum (Sample 16R-CC), which in turn is directly followed by the C. wardenense acme that defines Subzone E1a. The C. wardenense acme ranges from Sample 16R-CC to 9R-CC (Table T15). This sequence further reaffirms the consistency of previously documented regional dinocyst events. Sample 21R-CC yields a middle Late Paleocene assemblage dominated by Areoligera gippingensis, correlative to Subzone P5a of Bujak and Mudge (1994) or slightly older, also supported by rare occurrence of Alisocysta circumtabulata in this sample and farther downhole.
A single sample in the PETM succession (Sample 396-U1570D-17R-CC) yielded abundant to very abundant remains of freshwater algae. Although marine dinocysts are still common, Leiosphaeridia, Pterospermella, and particularly the colonial form Pediastrum (Figure F16) are remarkably abundant, suggesting enhanced influx from freshwater environments and/or intermittent extreme salinity stratification that permitted local growth. Freshwater diatom species provide further support for these inferences (see Siliceous microfossils). Although influxes of freshwater algae have been documented in the broader North Sea area (e.g., Bujak and Mudge, 1994; Mudge and Bujak, 1994, 2001; Eldrett et al., 2014), this signal was not found yet in the PETM intervals of Holes U1569A or U1570A or any of the Site U1567 and U1568 holes, which may indicate it represents a short-lived anomalous event in this area.
4.2.3. Summary
The dinocyst species composition from analysis of the Paleogene section of holes drilled at Sites U1569 and U1570 can be used to assign section intervals to the dinocyst zones of Bujak and Mudge (1994), as outlined above (Tables T10, T12, T13, T14, T15). The resulting correlation and integration with the lithostratigraphic units between all holes is shown in Figure F17.
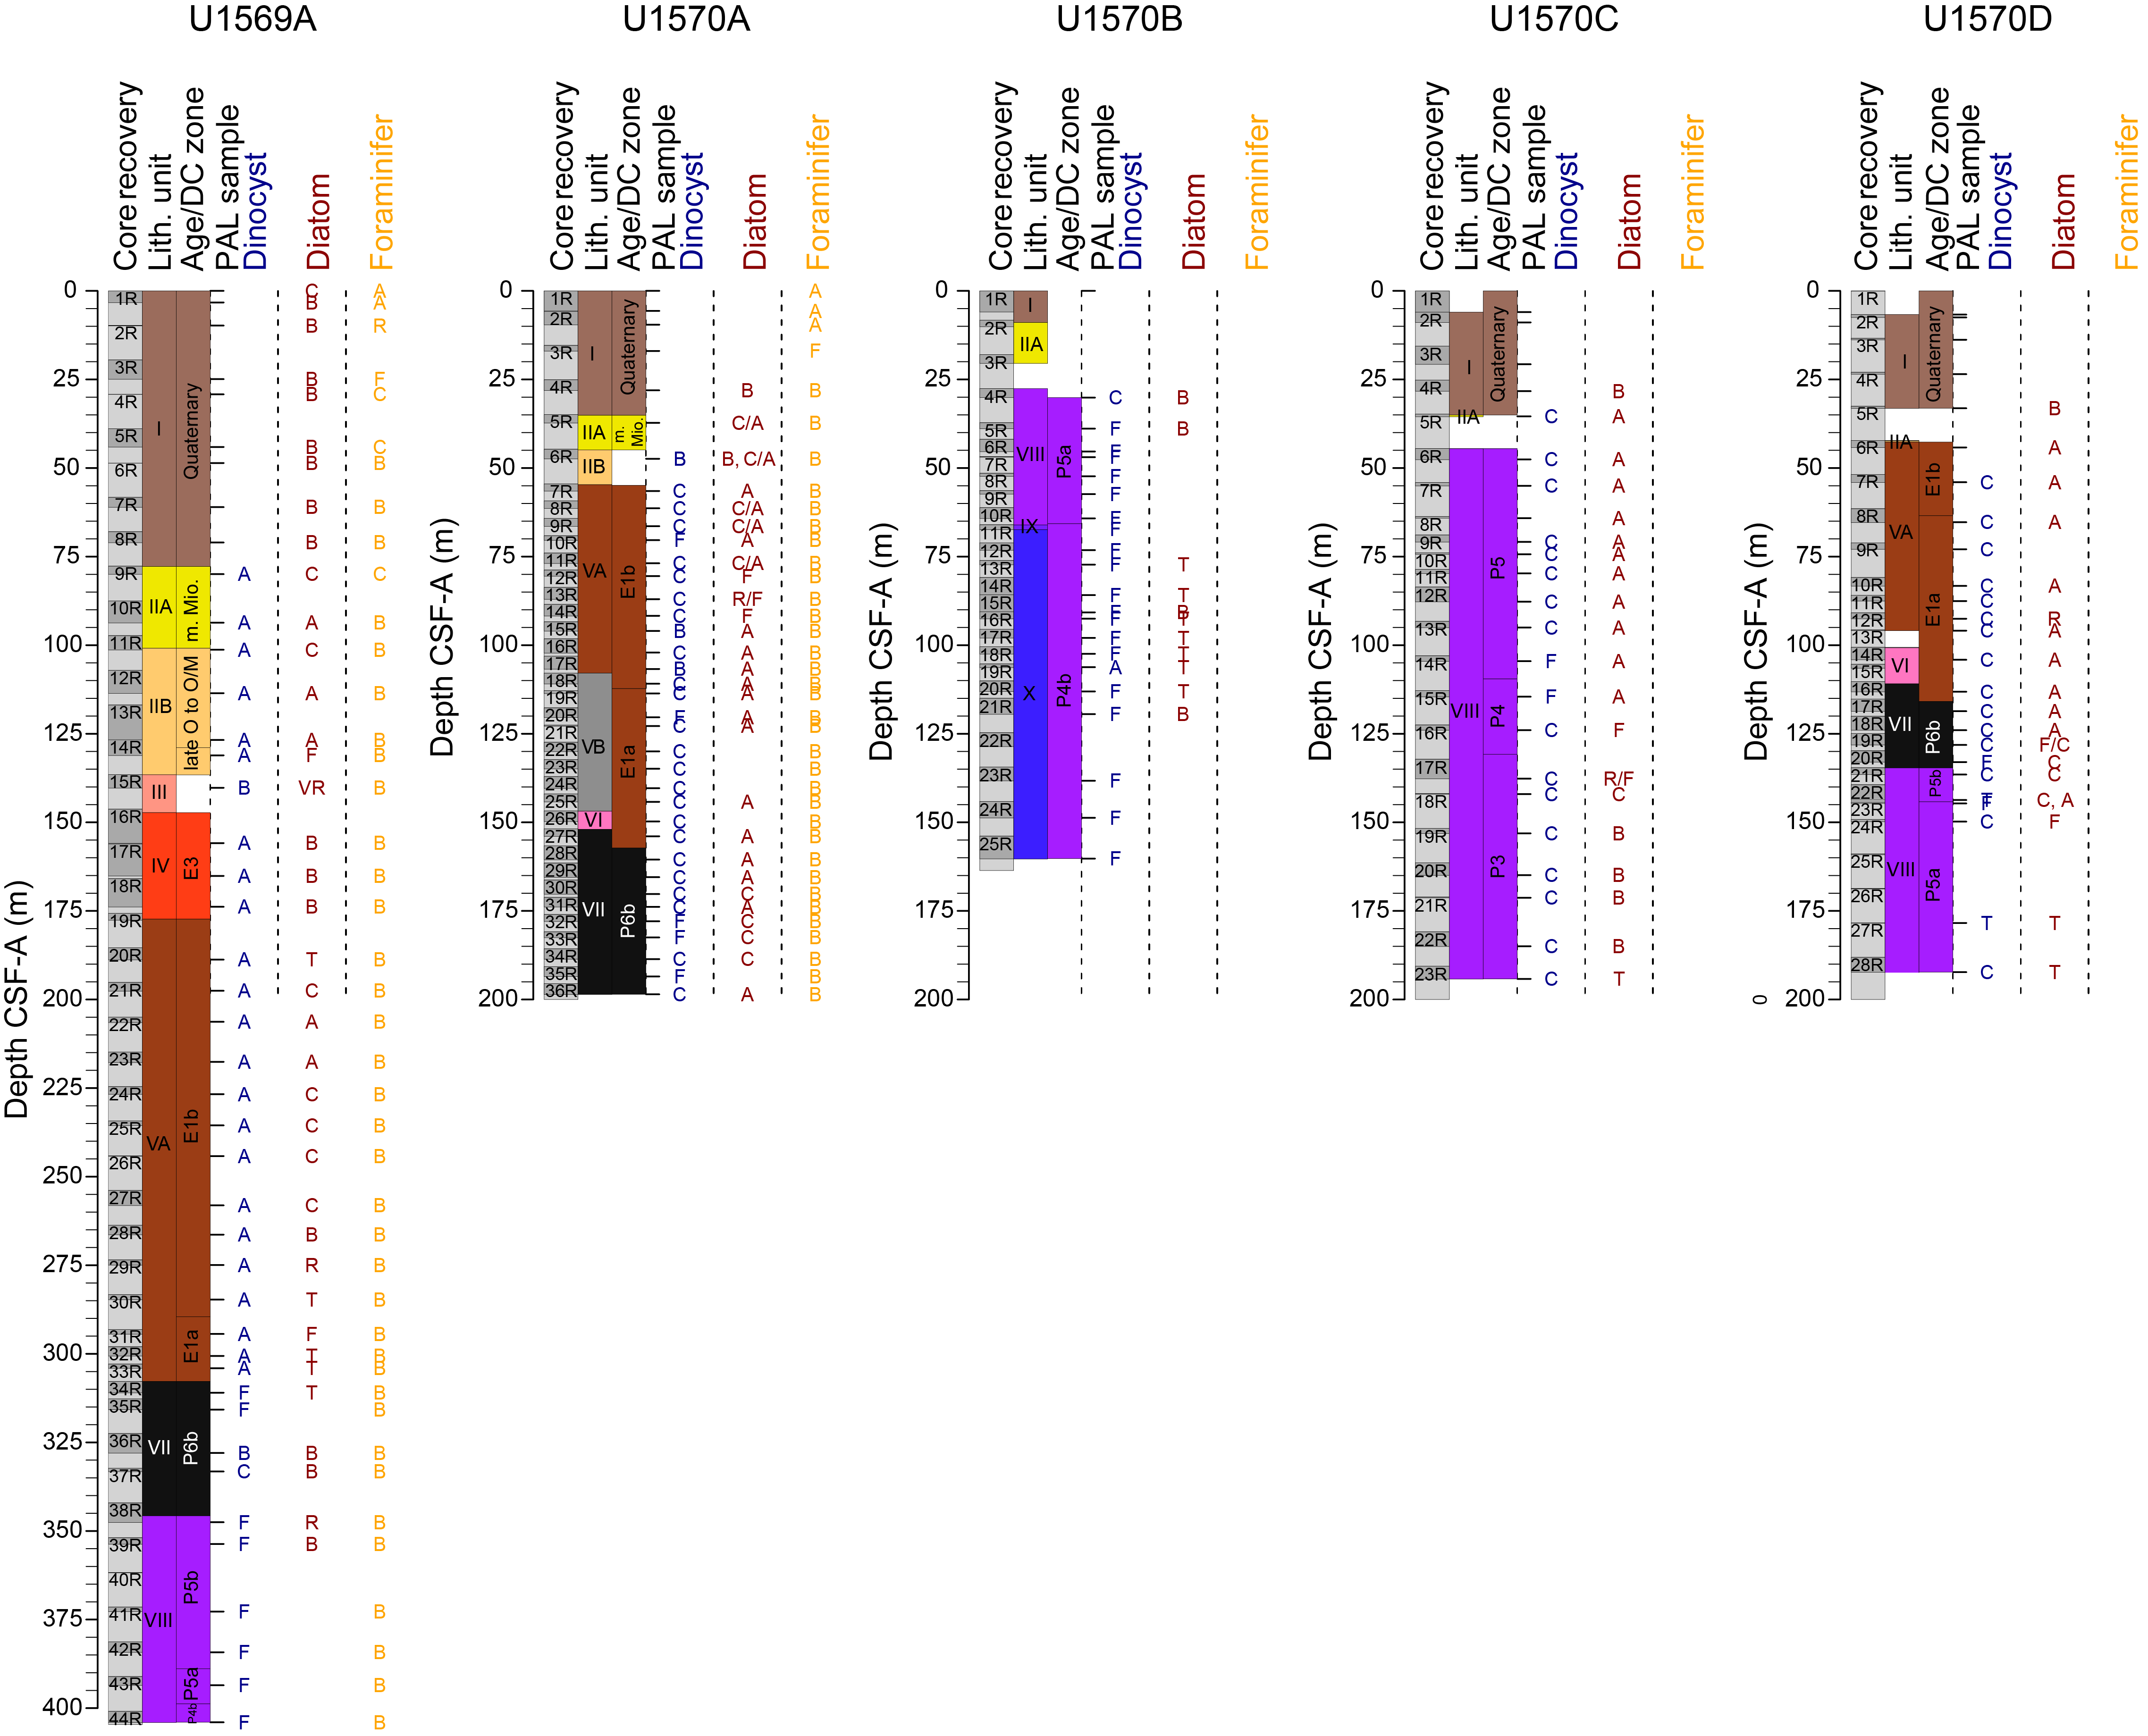
Figure F17. Microfossil occurrences and abundances.
In summary, the early Paleogene is represented by a thin (0–20 m) middle Early Eocene sediment package (Zone E3) that unconformably overlays a much thicker earliest Eocene deposit (Zone E1) (>100 m). Middle Early Eocene Zone E2 is entirely missing. Earliest Eocene Subzones E1b and E1a sit on top of a PETM (Subzone P6b) succession of variable thickness (possibly ~25 m in Hole U1569A, >40 m in Hole U1570A, and ~15 m in Hole U1570D). The uppermost Paleocene (Subzone P6a) is not recorded in any of the analyzed holes from Sites U1570 and U1569. The Paleocene sections recovered from Holes U1569A and U1570C, and potentially Hole U1570B, reach into the Middle Paleocene (Zone P3) (Selandian) and seem to be of variable thickness.
4.3. Planktonic foraminifers
4.3.1. Hole U1569A
Samples 396-U1569A-1R-CC to 44R-CC and the mudline were processed for planktonic foraminifers (see Biostratigraphy in the Expedition 396 methods chapter [Planke et al., 2023a]). Samples 1R-CC to 5R-CC and 9R-CC, including the mudline, have an overall abundance from rare to abundant (Table T4). Samples 10R-CC to 44R-CC are barren of foraminifers. A thin section from the limestone in Sample 28R-CC was requested, but no foraminifers were noted in the sample. The preservation state of the six core catcher samples is moderate to good with some encrusting and fragmentation of tests (Figure F18A). Encrusting of tests is predominately found in Neogloboquadrina pachyderma (sin.). Pyrite framboids are observed throughout the Hole U1569A core catchers. Core catcher samples indicate slight Oligocene reworking. The mudline sample from Hole U1569A is very abundant in planktonic foraminifers. Neogloboquadrina sp. and Globigerina sp. are the two dominant taxa noted in the mudline sample.
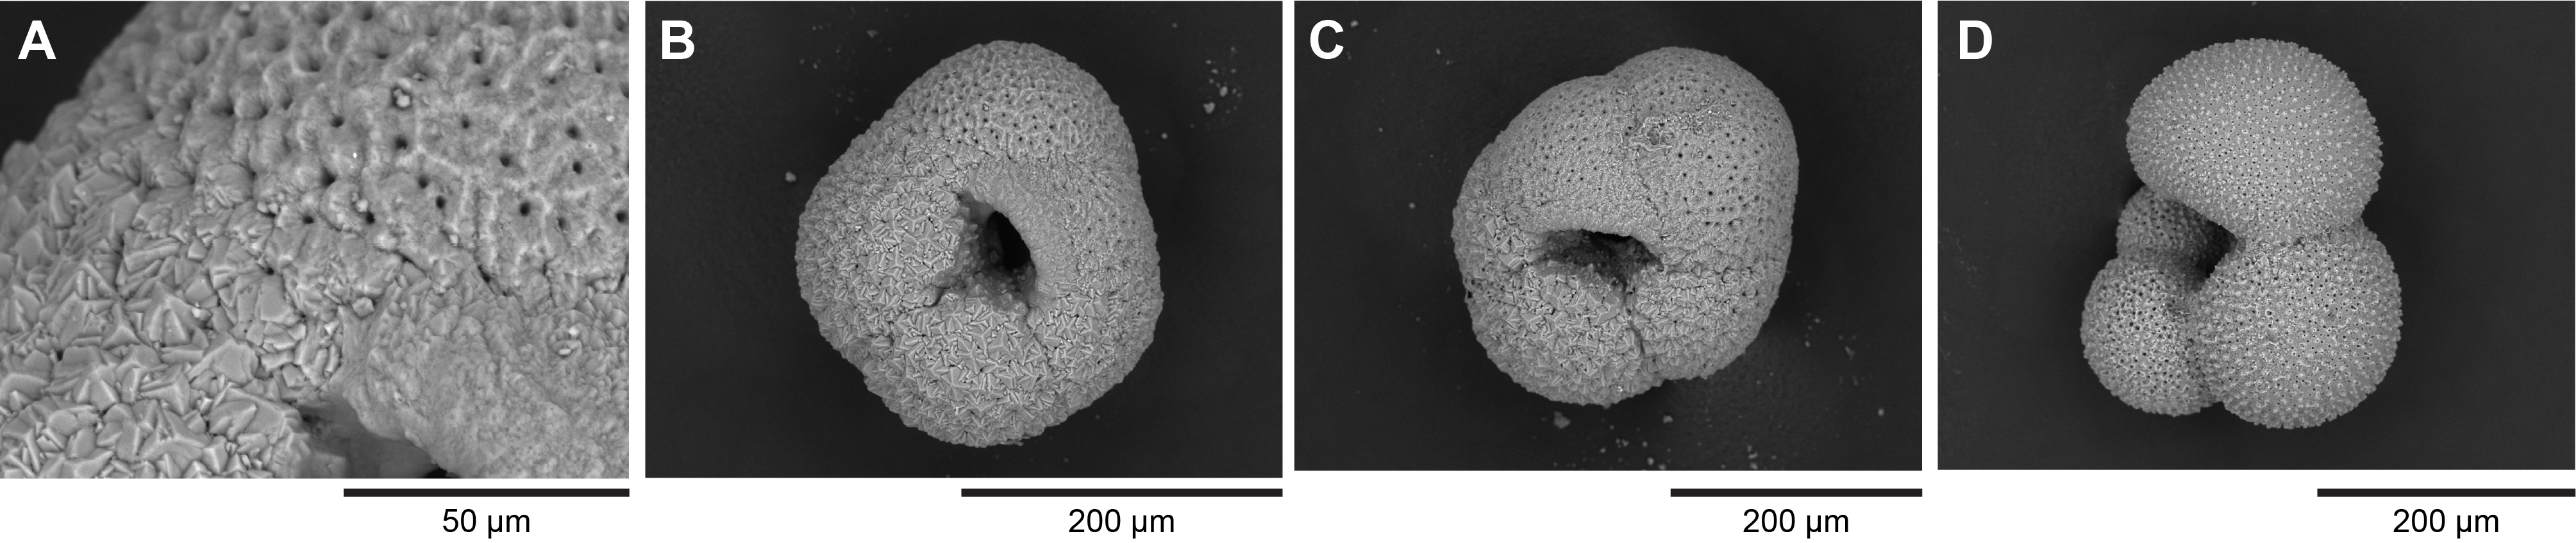
Figure F18. Planktonic foraminifers, 369-U1569A-1R-CC.
Sample 396-U1569A-1R-CC is very quartz rich with an overall abundance of planktonic foraminifers, good to moderate preservation, and slight Miocene reworking. N. pachyderma (sin.) dominates the sample (Figure F18B). Rare taxa include Ciperoella ciperoensis, Globigerina bulloides, Globigerina officinalis, Globigerinella obesa, Globigerinita glutinata, Neogloboquadrina atlantica, Neogloboquadrina incompta, Neogloboquadrina cf. dutertrei, Neogloboquadrina cf. pachyderma, N. pachyderma (dex.) (Figure F18C), and Neogloboquadrina sp.
Planktonic foraminifers in Sample 396-U1569A-2R-CC are rare with moderate preservation. N. pachyderma (sin.) dominates this sample. Rare taxa include N. cf. dutertrei, N. cf. pachyderma, N. pachyderma (dex.), and Neogloboquadrina sp. Sample 3R-CC is quartz rich with frequent abundance of foraminifers and moderate preservation. N. pachyderma (sin.) is the dominant taxon in the assemblage. Less abundant taxa include G. bulloides, N. atlantica, N. cf. dutertrei, N. cf. pachyderma, N. pachyderma (dex.), and Neogloboquadrina sp.
Sample 396-U1569A-4R-CC is quartz rich, with common abundance of foraminifers and moderate preservation. N. pachyderma (sin.) dominates this sample. Less abundant taxa include G. bulloides, G. obesa, Globigerinella sp., Globigerinita sp., N. cf. dutertrei, N. cf. pachyderma, N. pachyderma (dex.), and Neogloboquadrina sp. Sample 5R-CC has common overall abundance of foraminifers and moderate preservation. N. pachyderma (sin.) is the dominant taxon in the sample. Less abundant taxa include G. bulloides, N. cf. dutertrei, N. cf. pachyderma, N. pachyderma (dex.), and Neogloboquadrina sp.
Sample 396-U1569A-9R-CC has common planktonic foraminifers with good preservation and slightly reworked material. Paragloborotalia nana (Figure F19C) and Paragloborotalia pseudocontinuosa (Figure F19A) are more abundant in the sample, with minor to rare occurrences of Dentoglobigerina sp., G. glutinata (Figure F19B), Paragloborotalia mayeri, Paragloborotalia opima, Paragloborotalia continuosa, and Paragloborotalia sp. (Figure F19D).
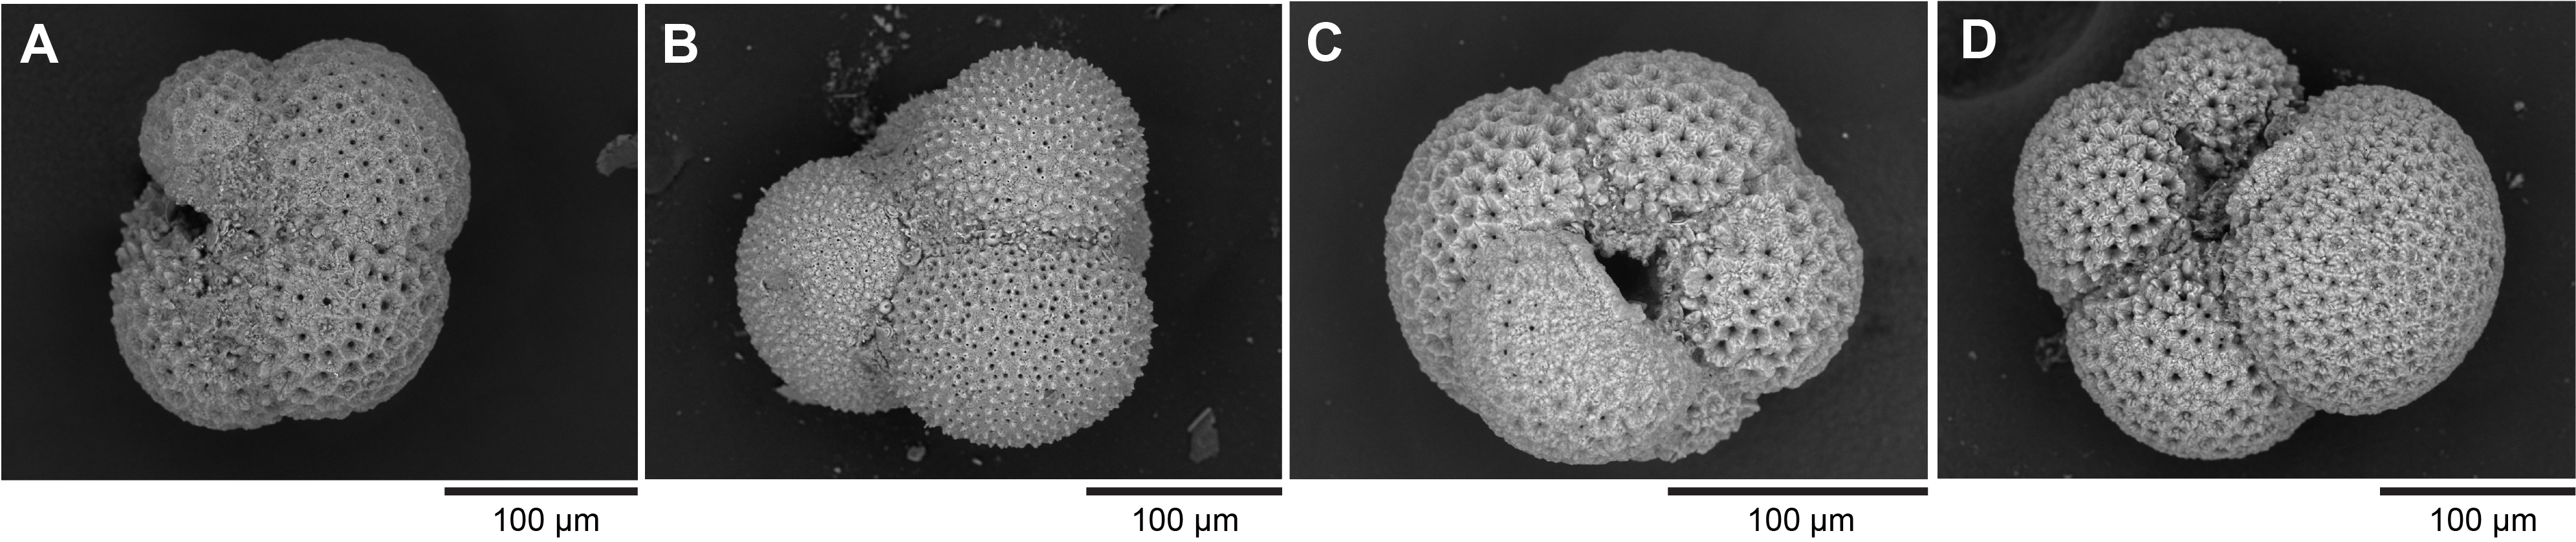
Figure F19. Planktonic foraminifers, 396-U1569A-9R-CC.
4.3.2. Holes U1570A–U1570D
Core catcher Samples 396-U1570A-1R-CC to 36R-CC were processed and analyzed for planktonic foraminifers (see Biostratigraphy in the Expedition 396 methods chapter [Planke et al., 2023a]). The majority of Hole U1570B core catcher samples were processed for planktonic foraminifers. Hole U1570A foraminifer identification was given priority, and processed samples from Hole U1570B were not further analyzed. The mudline samples from Holes U1570A–U1570D were processed for foraminifers, but only Hole U1570A had foraminifers in addition to sediment. Holes U1570C and U1570D were not processed. This section focuses on preliminary taxa identification from Hole U1570A.
Samples 396-U1570A-1R-CC, 2R-1, 88–89 cm, 3R-CC, and 4R-CC, including the mudline, had an overall abundance from frequent to abundant (Table T5). Samples 5R-CC to 36R-CC are barren of foraminifers. The preservation state of the four core catcher samples and the mudline is moderate to good, with some encrusting and fragmentation of tests (Figure F18A). Encrusting of tests is predominately found in N. pachyderma (sin.) (Figure F18A). Pyrite framboids are observed throughout the Hole U1570A core catchers. Samples 1R-CC and 2R-1, 88–89 cm, indicate Oligocene reworking. The mudline sample from Hole U1570A is very abundant in planktonic foraminifers. Neogloboquadrina sp. and Globigerina sp. are two dominant genera in the mudline sample.
Foraminifers in Sample 396-U1570A-1R-CC are abundant with moderate preservation. The occurrence of Ciperoella sp. indicates a moderate amount of pre-Quaternary reworking. N. pachyderma (sin.) dominates this sample. Rarer taxa include G. bulloides, Globigerina sp., Globigerinella sp., Globigerinita sp., N. cf. dutertrei, N. cf. pachyderma, N. pachyderma (dex.), and Neogloboquadrina sp. Sample 2R-1, 88–89 cm, has good to moderate preservation and overall abundant with more reworking evident in sample (Eoglobigerina edita and Parasubbotina sp.). N. pachyderma (sin.) is the most abundant taxon in the sample. Less abundant taxa include G. bulloides (Figure F20D), Globigerina umbilicata (?), Globigerinita sp., N. atlantica, N. cf. dutertrei, N. cf. pachyderma, Neogloboquadrina dutertrei, N. pachyderma (dex.), and Neogloboquadrina sp.
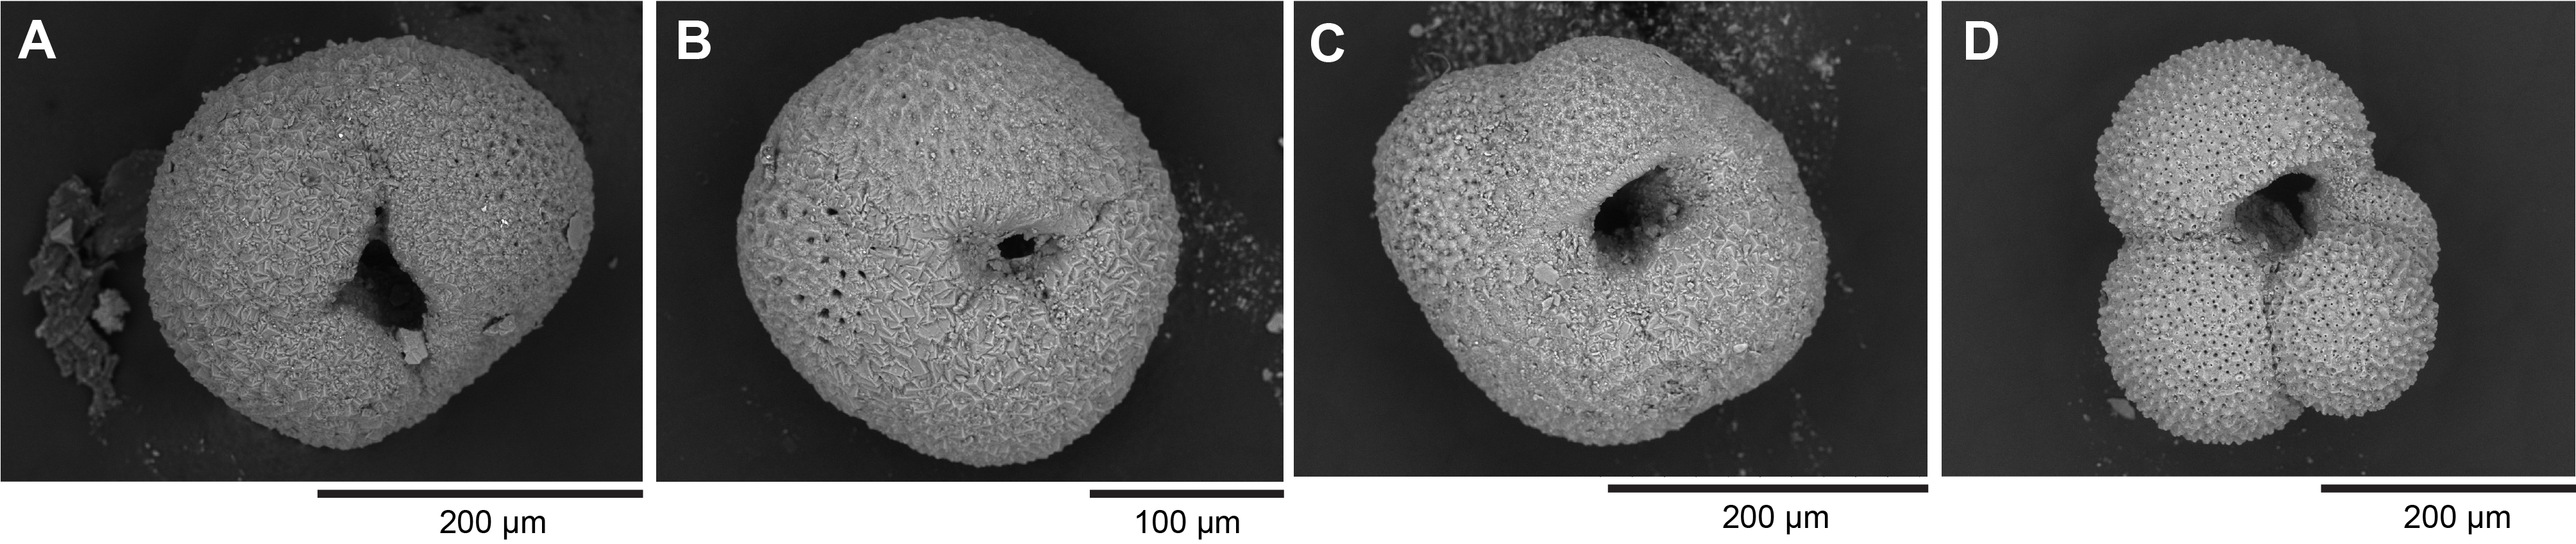
Figure F20. Planktonic foraminifers, Hole U1570A.
Sample 396-U1570A-3R-CC is quartz rich and abundant in foraminifers with good to moderate preservation of tests. N. pachyderma (sin.) is the most abundant taxon in the sample. N. pachyderma (dex.) has a slight increase in abundance. Rare taxa in this sample include G. bulloides, Globigerina sp., Globigerinella sp., G. glutinata, N. cf. dutertrei, N. cf. pachyderma, and Neogloboquadrina sp. Sample 4R-CC is quartz rich with moderate preservation of tests and frequent planktonic foraminifers. N. pachyderma (sin.) dominates the sample. Rare taxa include G. bulloides, N. atlantica, N. cf. pachyderma, N. pachyderma (dex.), and Neogloboquadrina sp.
4.3.3. Summary
Planktonic foraminifers from Samples 396-U1569A-1R-CC to 5R-CC and 396-U1570A-1R-CC to 4R-CC and the mudline from both sites indicate a Quaternary age and can be placed in the N. pachyderma (sin.) Zone of Spiegler and Jansen (1989). Although taxa identified in Sample 396-U1569A-9R-CC are consistent with an Early Miocene age, because of the lack of the first and last occurrences of marker taxa for the Early–Middle Miocene, this sample is unassignable to a zonation. More work on Core 9R is needed to provide a more definitive Miocene zonation.
4.4. Ostracods
Samples that yielded planktonic and/or benthic foraminifers were also examined for the presence of ostracods, but ostracods were found only in small numbers and with moderate preservation in the mudline sample of Hole U1570A (18 specimens), in Sample 396-U1569A-1H-CC (3 specimens), and in Sample 396-U1570A-2R-1, 88–89 cm (4 specimens). They include Krithe spp. (78%), Henryhowella asperrima (14%), Cytheropteron sp. (4%), and Eucythere sp. (4%).
4.5. Calcareous nannofossils
Rare and poorly preserved calcareous nannofossils occur in samples that include abundant reworked Cretaceous dinocysts. They were not identified but tentatively inferred to be reworked as well.
4.6. Summary
Quaternary sediments of Holes U1569A and U1570A–U1570D (~10–80 m) are characterized by glacially influenced hemipelagic mud, which unconformably overlies Lower to Middle Miocene strata. Uppermost Oligocene strata likely rest unconformably on Lower Eocene strata. Below, a thin (0–20 m) sediment package assigned to the middle Lower Eocene rests unconformably over a thicker lowermost Eocene deposit (>100 m), with much of the middle and lower Lower Eocene apparently missing. This deposit of early Early Eocene age sits on top of a thick PETM (earliest Eocene) succession (at least 10–40 m). The sequences from Holes U1569A and U1570D, spanning the Paleocene/Eocene boundary, do not show any record of the presence of uppermost Paleocene sediments. Dinocyst chronobiostratigraphy on the basis of the current set of samples suggests that at least ~1 My of the latest Paleocene is missing. The oldest sediments recovered are assigned to the Middle Paleocene (Selandian; 61.6–59.2 Ma) and recorded in samples from Holes U1569A and U1570C. Although Hole U1570B was expected to yield older sediments compared to Hole U1570C, the poor preservation, abundant reworking, and absence of dinocyst marker taxa in critical intervals hampered detailed assessment of the lowermost recovered sediments (Figure F21; Table T11). The lowermost sediments in Hole U1570B are assigned to a broad interval spanning the Late and Middle Paleocene but seem unlikely to be older than those recovered from Holes U1569A and U1570C.
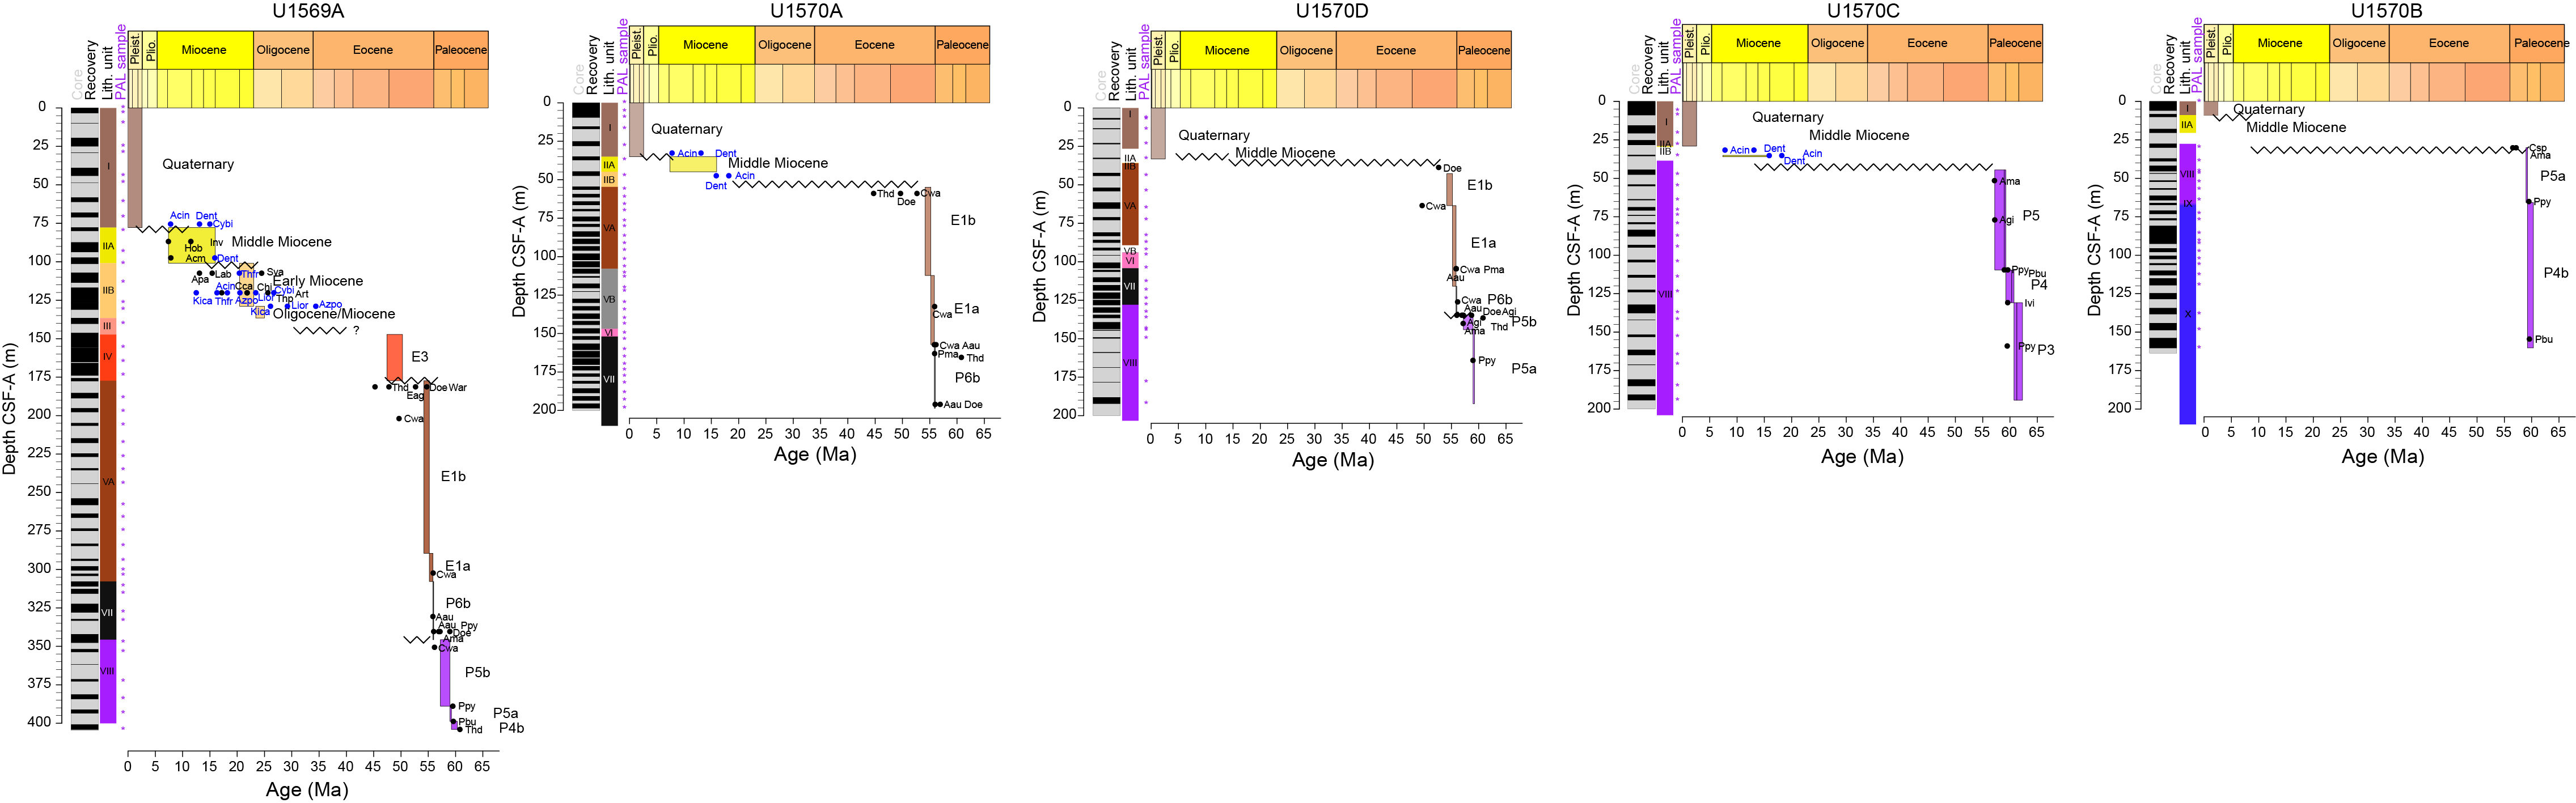
Figure F21. Diagnostic microfossil taxa age-depth plots.
4.6.1. Paleoenvironment and other noteworthy observations
The overall palynofacies is entirely dominated by terrestrial elements (pollen, spores, and phytodebris) and suggests that the depositional environments were coastal, neritic for most of the Paleocene and Eocene, similar to that of Sites U1567 and U1568.
In some intervals, samples taken from Hole U1569A showed mild to strong thermal alteration of palynomorphs. The highest concentration of the affected specimens is located in the Lower Eocene strata, either directly overlying the PETM or in the upper part of the PETM. Lithostratigraphic observations suggest this thermal alteration of organic matter may be the result of (nearby) volcanic activity rather than deep burial. Both thermal alteration and oxidation affect palynomorph preservation in distinct intervals, whereas Neogene intervals above the Lower Eocene are generally characterized by thermally immature and well-preserved organic microfossils.
The Upper Paleocene deposits in Holes U1570B–U1570D are all marked by occasionally abundant to dominant reworked Late Cretaceous palynomorphs. Although these palynomorphs occur throughout the entire section, they are most clearly present in the deposits assigned to the Late Paleocene. Some Paleogene reworking was observed, both in Neogene and younger Paleogene deposits.
5. Paleomagnetism
5.1. Shipboard measurements
Shipboard paleomagnetic investigations combined (1) measurement and in-line alternating field (AF) demagnetization of archive-half sections on the superconducting rock magnetometer (SRM) and (2) measurement and AF demagnetization of discrete samples on the spinner magnetometer (JR-6A). A total of 151 archive halves from Holes U1569A and U1570A–U1570D were measured on the SRM. Anisotropy of magnetic susceptibility (AMS) measurements were not performed because of time constraints.
A total of 62 discrete samples were collected to perform AF demagnetization: 18 from Hole U1569A, 14 from Hole U1570A, 14 from Hole U1570B, 4 from Hole U1570C, and 12 from Hole U1570D. Directional and intensity data from discrete samples were used to validate the polarities inferred from section measurements. Directional data were analyzed using Zijderveld diagrams (Zijderveld, 2013). The characteristic remanent magnetization (ChRM) direction(s) were determined using the Remasoft 3.0 software (Chadima and Hrouda, 2006).
5.2. Demagnetization behavior
5.2.1. Post-earliest Eocene sediments (Lithostratigraphic Units I–VI)
Post-earliest Eocene sediments (i.e., post-PETM) were recovered in multiple cores. In these cores, inclination and intensity present consistent and continuous variations, which indicates that despite drilling disturbance these parameters are meaningful. The high variability of magnetic parameters observed in a few intervals could be attributed to local drilling disturbance or to a weakly coercive magnetic assemblage. The steep magnetic inclinations (>80°) (Figure F22) might be due to drilling-induced magnetic overprint close to the modern geomagnetic field for these holes (~77°; https://www.ngdc.noaa.gov/geomag/calculators/magcalc.shtml#igrfwmm).
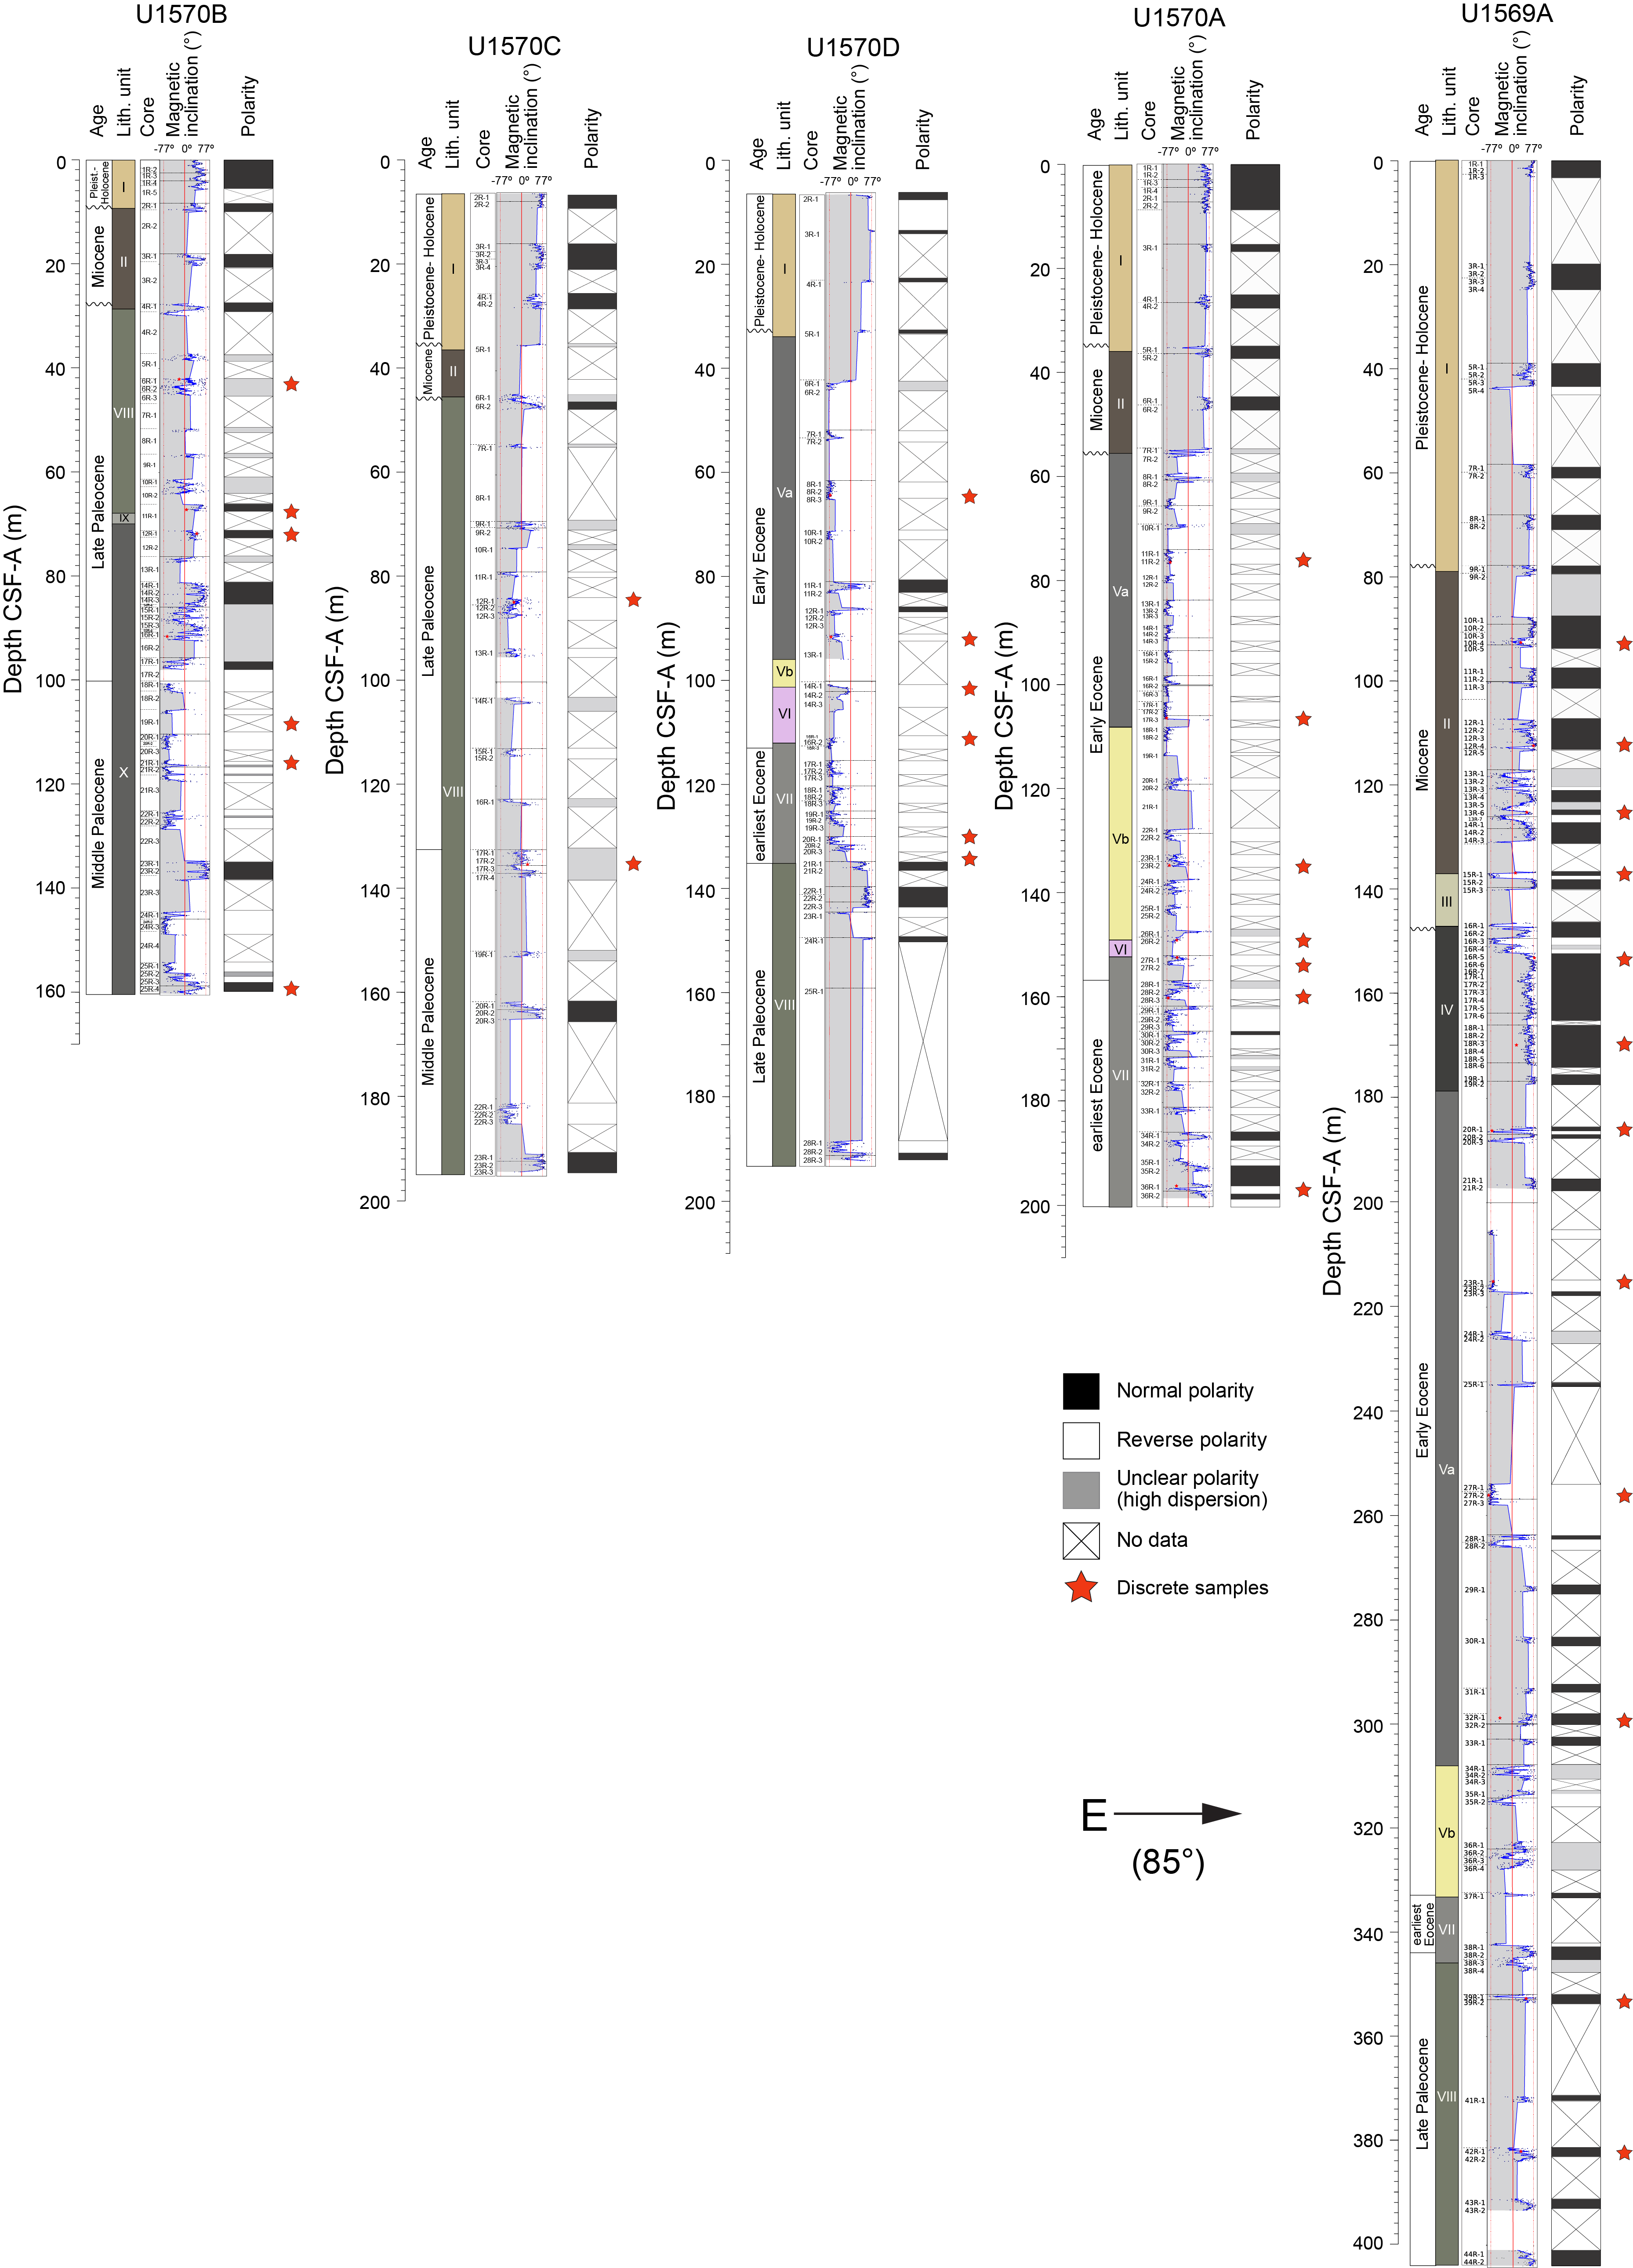
Figure F22. SRM magnetic inclination.
The average intensity of magnetization of these units ranges from 2.26 × 10⁻² (Hole U1569A) to 3.22 × 10⁻² A/m (Hole U1570C). The cores are not completely demagnetized in an applied AF field of 20 mT. The degree of magnetic coercivity is expressed by the ratio of magnetization left after 20 mT AF demagnetization to natural remanent magnetization (NRM). The range of magnetic coercivities indicates that the magnetic mineralogy is dominated by hematite or goethite. Six episodes of magnetic reversals are marked by a negative magnetic inclination (Figure F22).
A total of 13 discrete samples from post-earliest Eocene sediments were measured. All six samples from Cores 396-U1569A-1R through 33R (0–307.80 m CSF-A) show positive magnetic inclination. Three of them lack stable remanent component (Samples 10R-4, 61–63 cm; 12R-4, 68–70 cm; and 13R-6, 64–66 cm) and one has a medium coercivity component that demagnetizes at 40 mT (Sample 15R-1, 22–24 cm). The remaining two samples show a low-coercivity component that is demagnetized at 15 mT (16R-5, 73–75 cm, and 18R-3, 84–86 cm). Out of the 13 samples, 3 are from Cores 396-U1570A-1R through 25R (0–146.80 m CSF-A). The first two samples (11R-2, 99–101 cm, and 17R-3, 45–47 cm) show negative magnetic inclination and a high-coercivity component that remains stable through 100 mT demagnetization. The second sample also has a low-coercivity component that is demagnetized at 15 mT. The third sample has positive magnetic inclination but unstable remanent directions (Sample 23R-2, 71–73 cm). A total of four discrete samples were measured from Cores 396-U1570D-1R through 15R (0–110.30 m CSF-A). The first two samples have unstable remanent directions (Samples 8R-2, 132–134 cm, and 12R-1, 60–62 cm).
5.2.2. PETM sediments (Lithostratigraphic Unit VII)
PETM sediments were recovered in Cores 396-U1569A-34R through 38R (307.80–351.90 m CSF-A), 396-U1570A-27R through 36R (151.80–200.00 m CSF-A), and 396-U1570D-16R through 20R (110.30–134.60 m CSF-A). The average intensity of magnetization of these units ranges from 0.06 × 10⁻² (Hole U1570D) to 0.13 × 10⁻² A/m (Hole U1569A). The cores are not completely demagnetized in an applied field of 20 mT. The median coercivity ranges from 1.32 (Hole U1570D) to 3.04 (Hole U1569A). There are at least two short intervals of normal polarity within the dominantly reverse magnetic polarity (Figure F22).
The demagnetization behavior of four discrete samples was measured in the JR-6A magnetometer. All four samples show normal magnetic polarity; however, the behavior of all four samples was unstable during AF demagnetization.
5.2.3. Pre-PETM sediments (Lithostratigraphic Units VIII–X)
Pre-PETM strata is encountered in Cores 396-U1569A-38R through 44R (342.10–404.60 m CSF-A), 396-U1570B-4R through 25R (27.60–163.60 m CSF-A), 396-U1570C-6R through 23R (44.50–200.00 m CSF-A), and 396-U1570D-21R through 28R (134.60–200.00 m CSF-A). The average intensity of magnetization of these cores ranges from 0.06 × 10⁻² (Hole U1569A) to 0.59 × 10⁻² A/m (Hole U1570B). Not all cores are completely demagnetized in an applied field of 20 mT. The median coercivity ranges from 2.77 (Hole U1570B) to 4.41 (Hole U1569A).
The demagnetization behavior was measured for the 11 discrete samples, and 10 of them show unstable remanent directions. Just one sample (396-U1569A-39R-1, 79–81 cm) shows stable remanent directions, which is due to a high-coercivity component that is stable throughout the demagnetization process, up to the AF of 100 mT. The NRM inclination in this sample is positive.
5.3. Anisotropy of magnetic susceptibility
5.3.1. Post-earliest Eocene sediments (Lithostratigraphic Units I–VI)
A total of 11 discrete samples were measured from post-earliest Eocene (i.e., PETM) units. Out of these, four are from Cores 396-U1569A-1R through 33R (0–307.80 m CSF-A). Sample 23R-1, 28–30 cm, is weakly ferromagnetic with mean bulk MS (κm) of ~1.054 × 10⁻³ [SI]. The magnetic foliation is nearly horizontal with a magnetic lineation trending 258° horizontally. The degree of corrected anisotropy (P′ = 1.018) is very low. The other three samples (20R-1, 80–82 cm; 27R-2, 70–72 cm; and 32R-1, 85–87 cm) present low P′ (<1.095) and κm (<0.4 × 10⁻³ [SI]). These three specimens present subhorizontal magnetic foliations and with nearly horizontal lineations.
Three samples from Cores 396-U1570A-1R through 25R (0–146.80 m CSF-A) present subvertical magnetic fabrics with κ3 plunging between 74° and 77°. The κ (<0.5 × 10⁻³ [SI]) and P′ (≤1.039) are also low. Out of the 11 discrete samples, 4 are from Cores 396-U1570D-1R through 15R (0–110.30 m CSF-A). All of them present subvertical to oblique magnetic fabrics. P′ is low (≤1.028), and κ is ≤0.2 × 10⁻³ [SI]. Steep magnetic fabrics may be attributed to drilling-related disturbances.
5.3.2. PETM sediments (Lithostratigraphic Unit VII)
A total of four discrete samples were measured using the AGICO KLY 4S Kappabridge. All of them present oblique magnetic fabrics, low bulk MS (0.4 × 10⁻³ ≥ κ ≥ 0.1 × 10⁻³ [SI]), and low to very low corrected degree of anisotropy (1.018 ≥ P′ ≥ 1.008).
5.3.3. Pre-PETM sediments (Lithostratigraphic Units VIII–X)
A total of 11 discrete samples were measured using the AGICO KLY 4S Kappabridge. All but two samples present oblique magnetic fabrics. In the two samples (396-U1570B-21R-2, 56–58 cm, and 25R-4, 92–94 cm), the magnetic fabrics are subhorizontal. However, all 11 samples have weak bulk MS (0.5 × 10⁻³ ≥ κ ≥ 0.06 × 10⁻³ [SI]) and a weak corrected degree of magnetic anisotropy (1.077 ≥ P′ ≥ 1.003).
5.4. Summary
The inclination and intensity for Sites U1569 and U1570 show consistent and continuous variations throughout the sections, which indicates that, despite drilling disturbance, these parameters are meaningful. The average magnetization intensities of these units range from 2 × 10⁻² to 4 × 10⁻² A/m. Several magnetic reversals are recorded by intervals of negative magnetic inclination. The demagnetization behavior of the discrete samples falls into three groups: (1) unstable remanent directions, (2) weakly coercive remanent magnetization that is erased in AFs of 15 mT, and (3) high-coercivity that remains stable throughout the demagnetization process up to 100 mT.
All discrete samples measured using the AGICO KLY 4S Kappabridge show a low corrected degree of anisotropy (<1.08) and low bulk susceptibility (κ = <0.5 × 10⁻³ [SI]). Most of the magnetic fabrics are oblique to (sub)vertical. Magnetic fabrics with dips other than horizontal to subhorizontal are most likely related to drilling-related disturbances.
6. Geochemistry
At Sites U1569 and U1570 (ribbon site) on the northeast flank of the Mimir High, five boreholes were drilled to a total penetration of 1.2 km and core recovery of 415 m. In addition to a single mudline sample, 31 interstitial water (IW) samples were taken from sediments recovered at Site U1569. At Site U1570, a total of 57 IW samples were taken, including 4 mudline samples. A total of 21 IW samples were taken from Hole U1570A, 22 from Hole U1570B, and 13 from Hole U1570D. In Hole U1569A, the lowermost sample was taken at 402 m CSF-A. Carbonate and carbon-hydrogen-nitrogen-sulfur (CHNS) analysis was completed on all corresponding squeeze cake samples, and an additional 23 samples were taken from Hole U1570D paleontology samples because no IW samples were collected. A total of 39 samples were taken for routine headspace analysis in Hole U1569A, and 23 were taken in Hole U1570A. Because of low methane content, no further headspace samples were taken at Site U1570. X-ray diffraction (XRD) analysis was completed on 55 samples from Hole U1569A; 31 were completed on the bulk fraction, 12 on the clay fraction, and 12 on the heated clay fraction. At Site U1570, 48 samples were analyzed from Hole U1570A (with 8 each for clay and heated clay) and 32 samples were analyzed from Hole U1570B (with 6 each for clay and heated clay). Source rock analysis (SRA) was completed on 4 samples from Hole U1569A and 8 from Hole U1570A.
6.1. Inorganic geochemistry
6.1.1. Site U1569
The alkalinity from IW samples in Hole U1569A displays a concave profile, with concentrations between 4 and 6 mM in Lithostratigraphic Units I and II before decreasing to as low as <3 mM in Unit V (between 175 and 300 m CSF-A); concentrations then return to 5 mM by Unit VII (Figure F23; Table T16). pH values are typically the inverse of alkalinity and are between 7.8 and 8 in the upper (Units I–III) and lower (Units VI and VII) units and below 7.8 in Units IV and V (Figure F23). Ammonium and sulfur (as SO42−) concentrations show more linear profiles downcore, increasing and decreasing with depth, respectively. Interestingly, the rate of decrease in dissolved SO42− with depth does not remain constant, showing a steeper decreasing trend between 225 and 300 m CSF-A (Figure F24). Phosphate concentrations show very little variability, and values remain between 7 and 12 µM in all analyzed samples (Figure F23). This lack of variability, coupled with slowly increasing NH4+ concentrations, suggests that organic matter breakdown and diffusion of IW are the primary controls on S distributions. However, Units IV and V, with low alkalinity and high pH, appear to have undergone alternative diagenetic histories, and alkalinity values suggest reverse weathering may be occurring. This idea is supported by the regular occurrence of authigenic clay minerals in these units, with Si potentially sourced from ash alteration (Figure F24) (Michalopoulos and Aller, 1995; Gieskes and Lawrence, 1981). As with Modgunn hydrothermal vent complex Sites U1567 and U1568, alkalinity and pH appear to be linked to the lithology, suggesting IW compositions may record early diagenetic environments. At the base of Hole U1569A (below 300 m CSF-A), the salinity of the IW drops below that of seawater, from 35 to 32 g/L, suggesting a potential source of freshwater to these rocks.
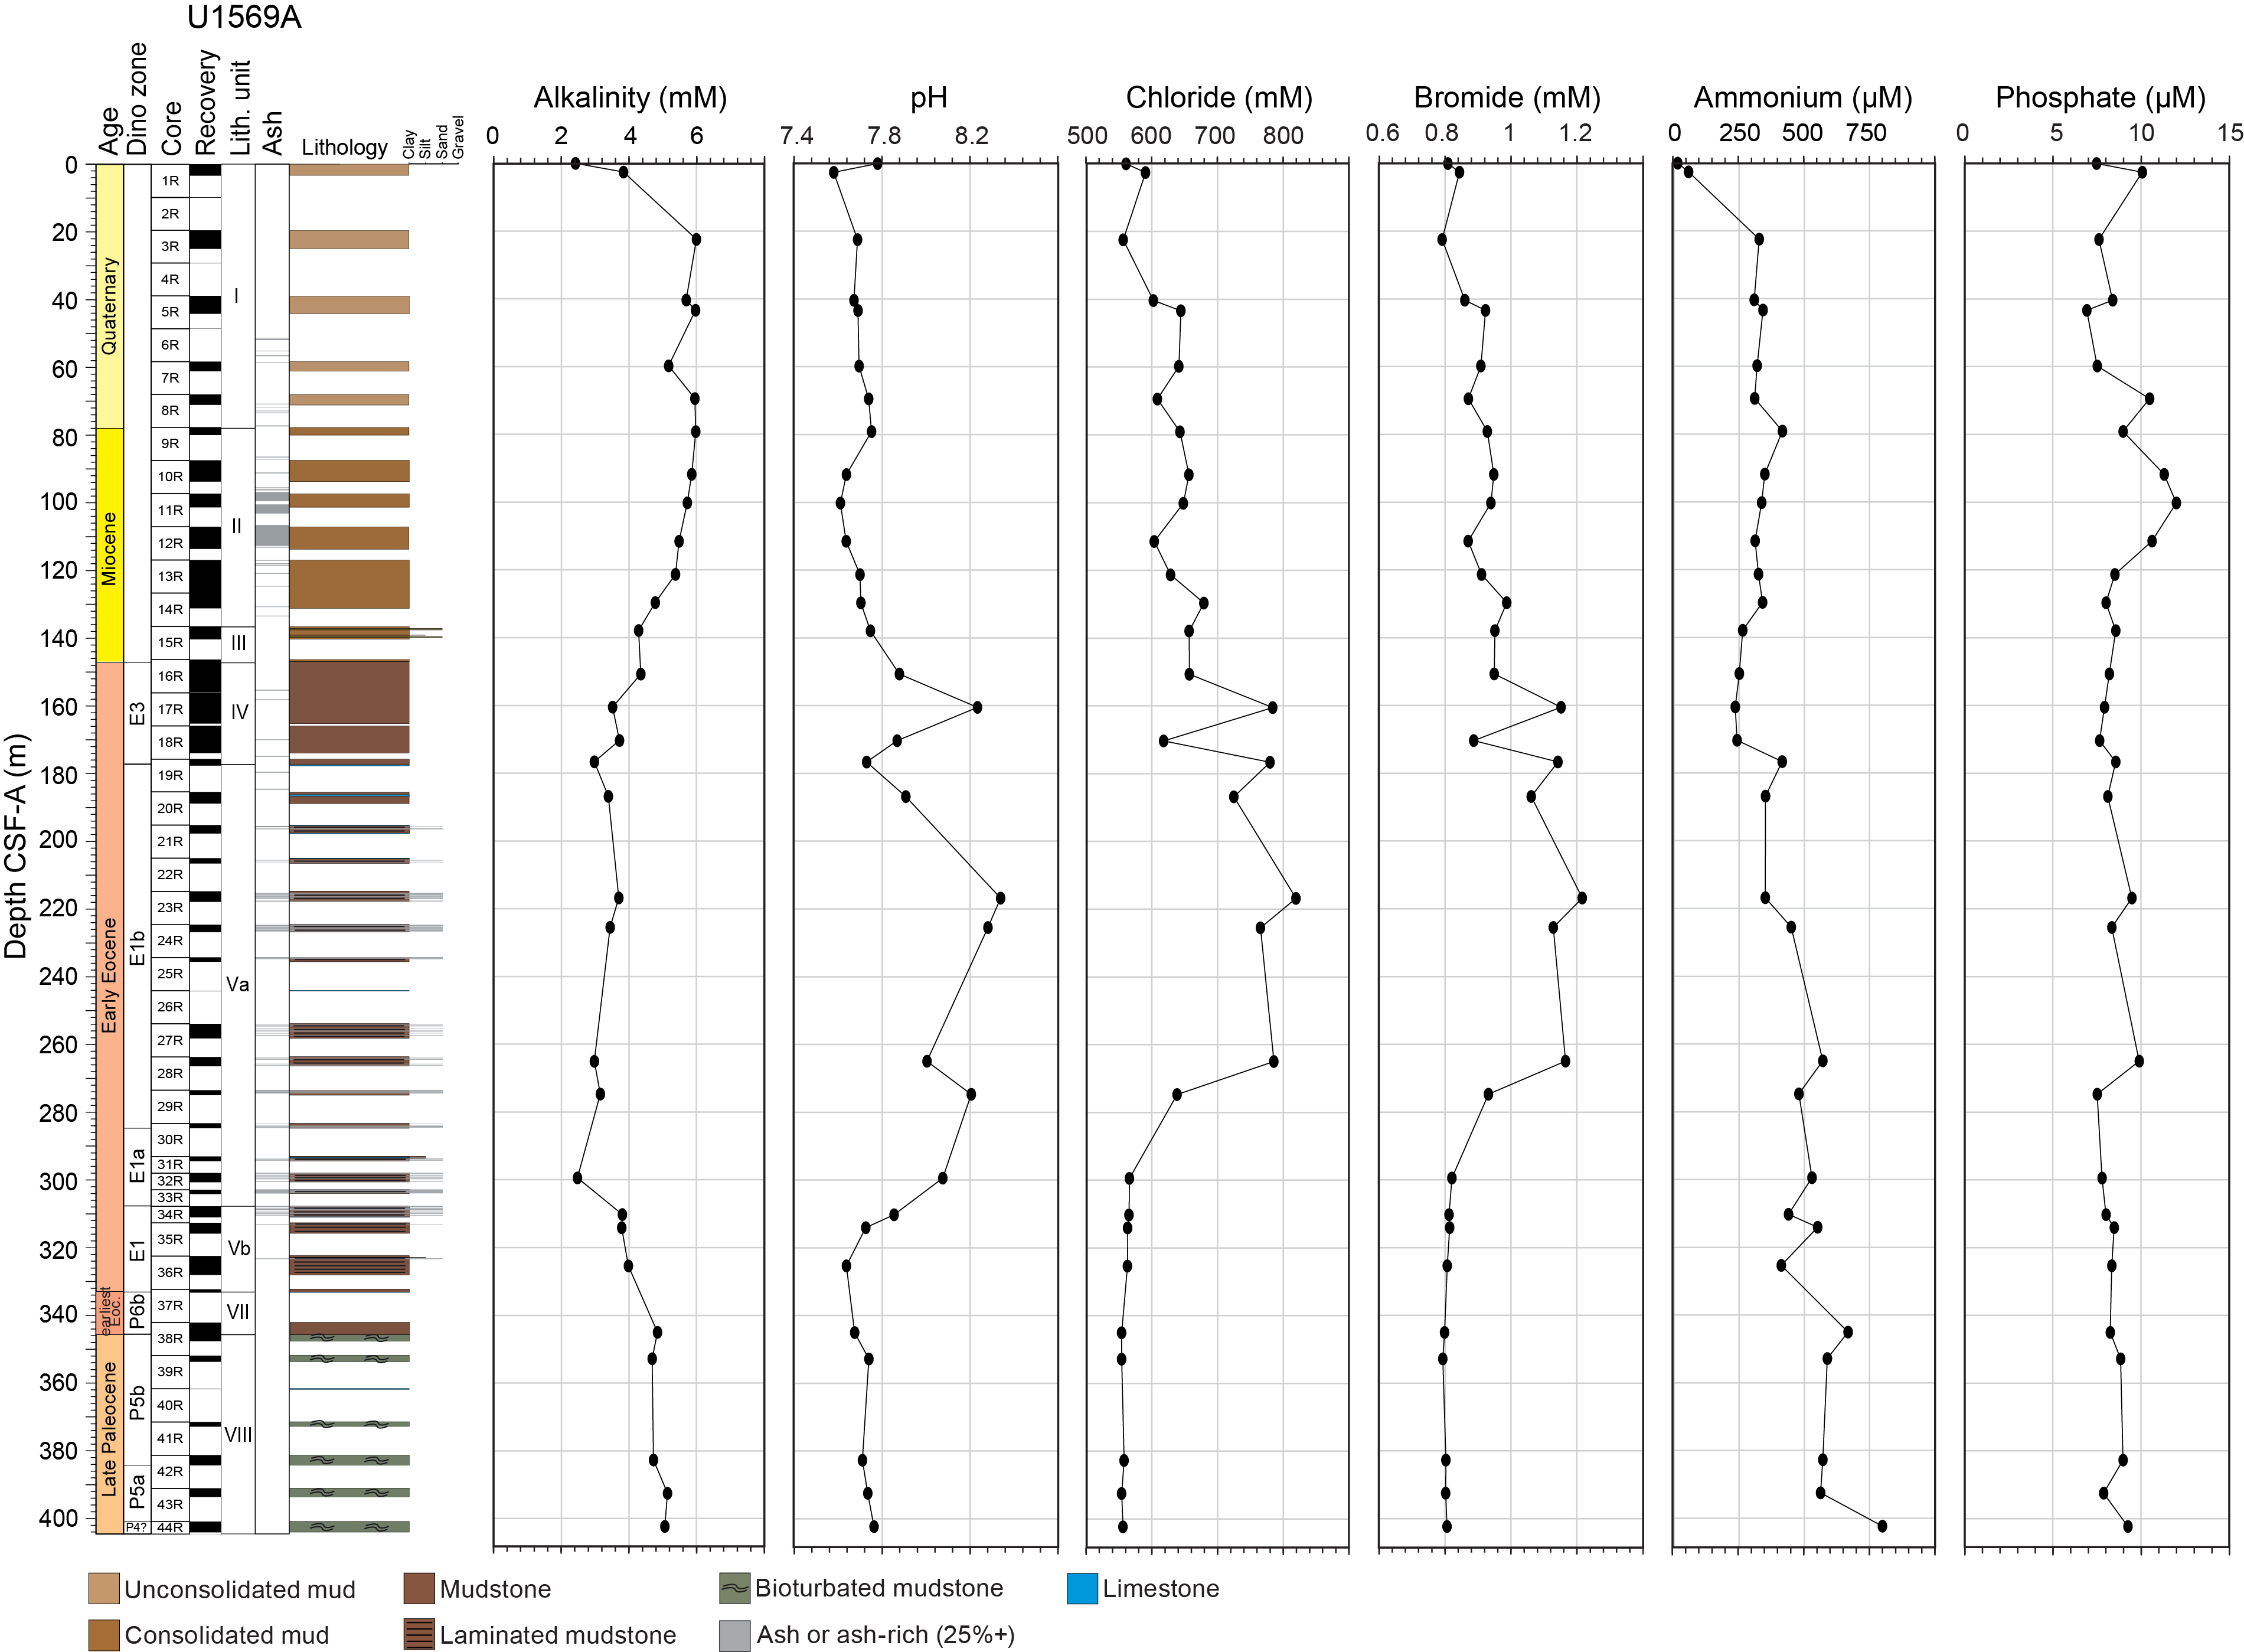
Figure F23. IW alkalinity, pH, Cl, Br, NH4+, and PO43−, Hole U1569A.
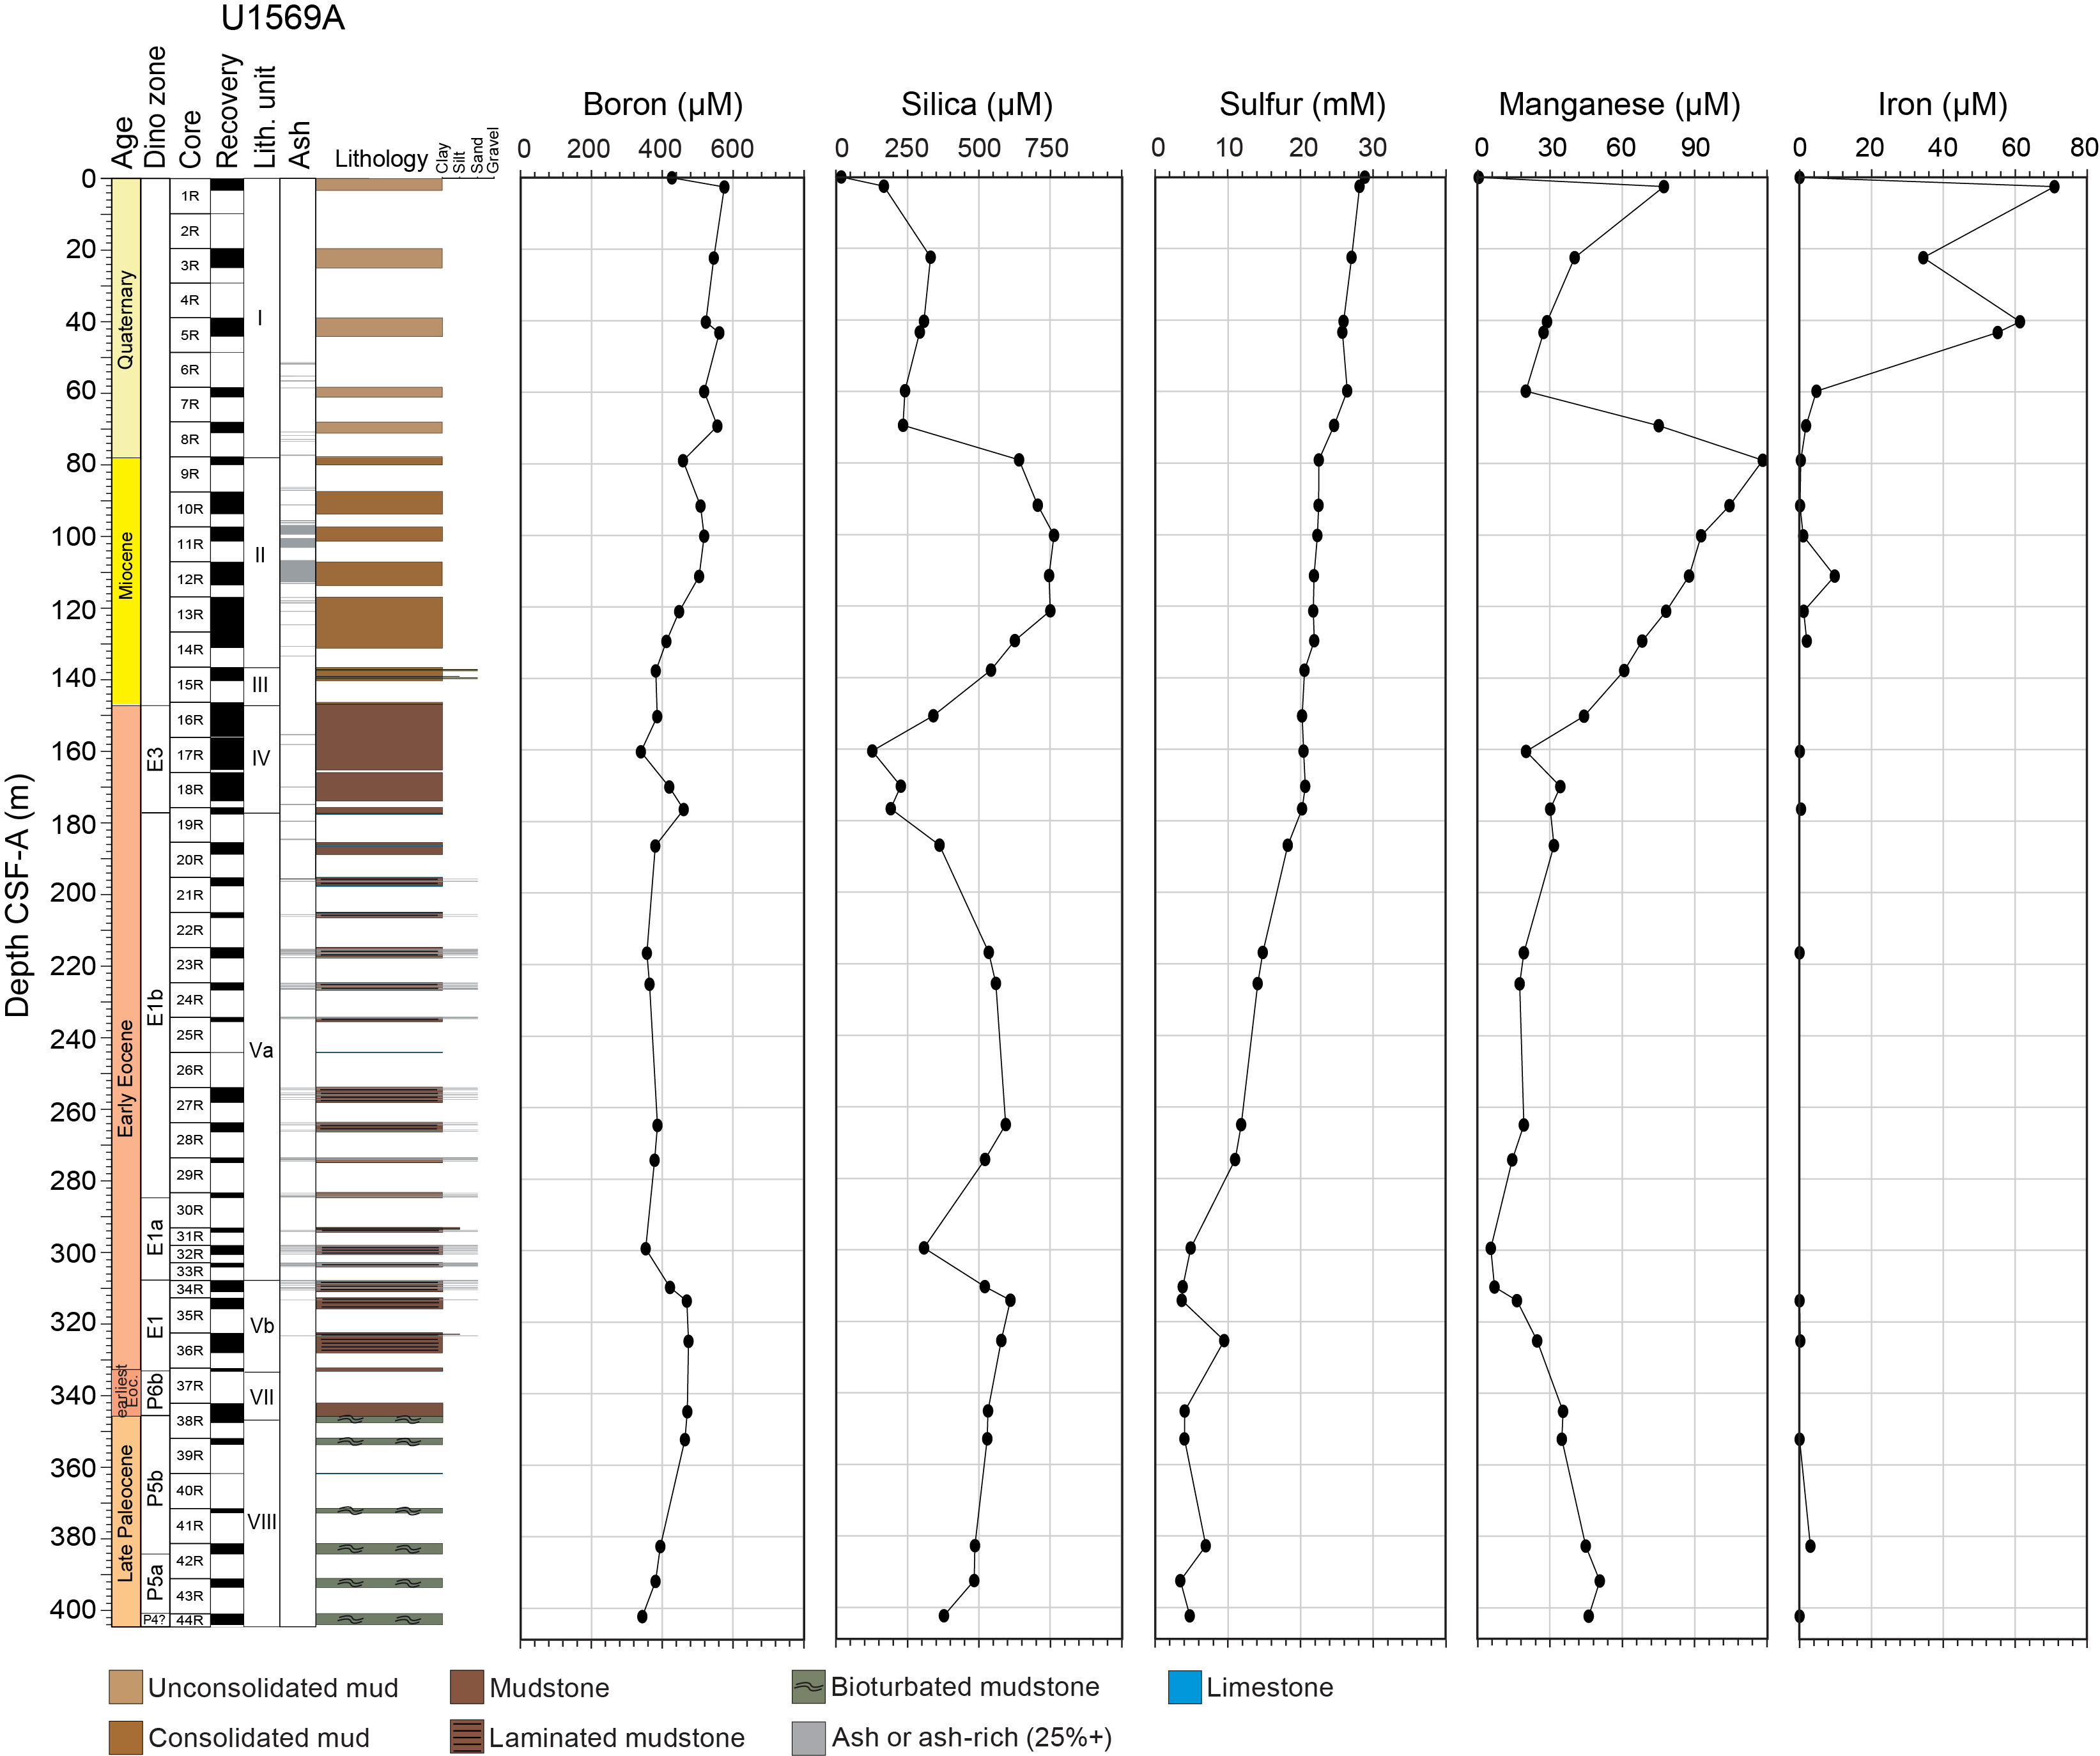
Figure F24. B, Si, S, Mn, and Fe, Hole U1569A.
Many of the elemental profiles support the inference of a distinct diagenetic environment between 175 and 300 m CSF-A. Many elements are enriched in this part of the hole (Units IV and V), and concentrations of Br, Ca, Cl, and Na rise substantially through this interval, with lower concentrations above and below (Figures F23, F25). Increases in these elements may be linked to the combination of both ash alteration and marine silicate weathering, a process by which bicarbonate ions are formed (raising alkalinity) along with silicic acid (raising pH). The low alkalinity may be the result of these bicarbonate ions being incorporated into authigenic carbonates, which are observed periodically in the hole (Torres et al., 2020; Longman et al., 2021). Alternatively, low alkalinity may reflect pyrite precipitation, a reaction which consumes HS− and produces H+ and is evidenced by the regular pyrite minerals observed at the site. Pyrite precipitation may also explain the sudden decrease in interstitial SO42− below 225 m CSF-A (Figure F24). Concentrations of Mn and B decrease in the interval of interest, suggesting incorporation into authigenic clay minerals (Figure F24). The downcore profile of Si is the most complex and likely reflects the competing processes at play in the diagenetic environment. Si content increases from 200 µM in Unit I to over 700 µM in Units II and III (60–150 m CSF-A) before a sharp decrease to values below 200 µM in Unit III (Figure F24). Concentrations then rise to between 400 and 600 µM for the remainder of the core (Figure F24). Decreases in Si may indicate the formation of authigenic clays via reverse weathering (Michalopoulos and Aller, 1995; Isson and Planavsky, 2018), whereas Si increases are potentially indicative of the silicic acid release linked to marine silicate weathering (Torres et al., 2020; Longman et al., 2021).
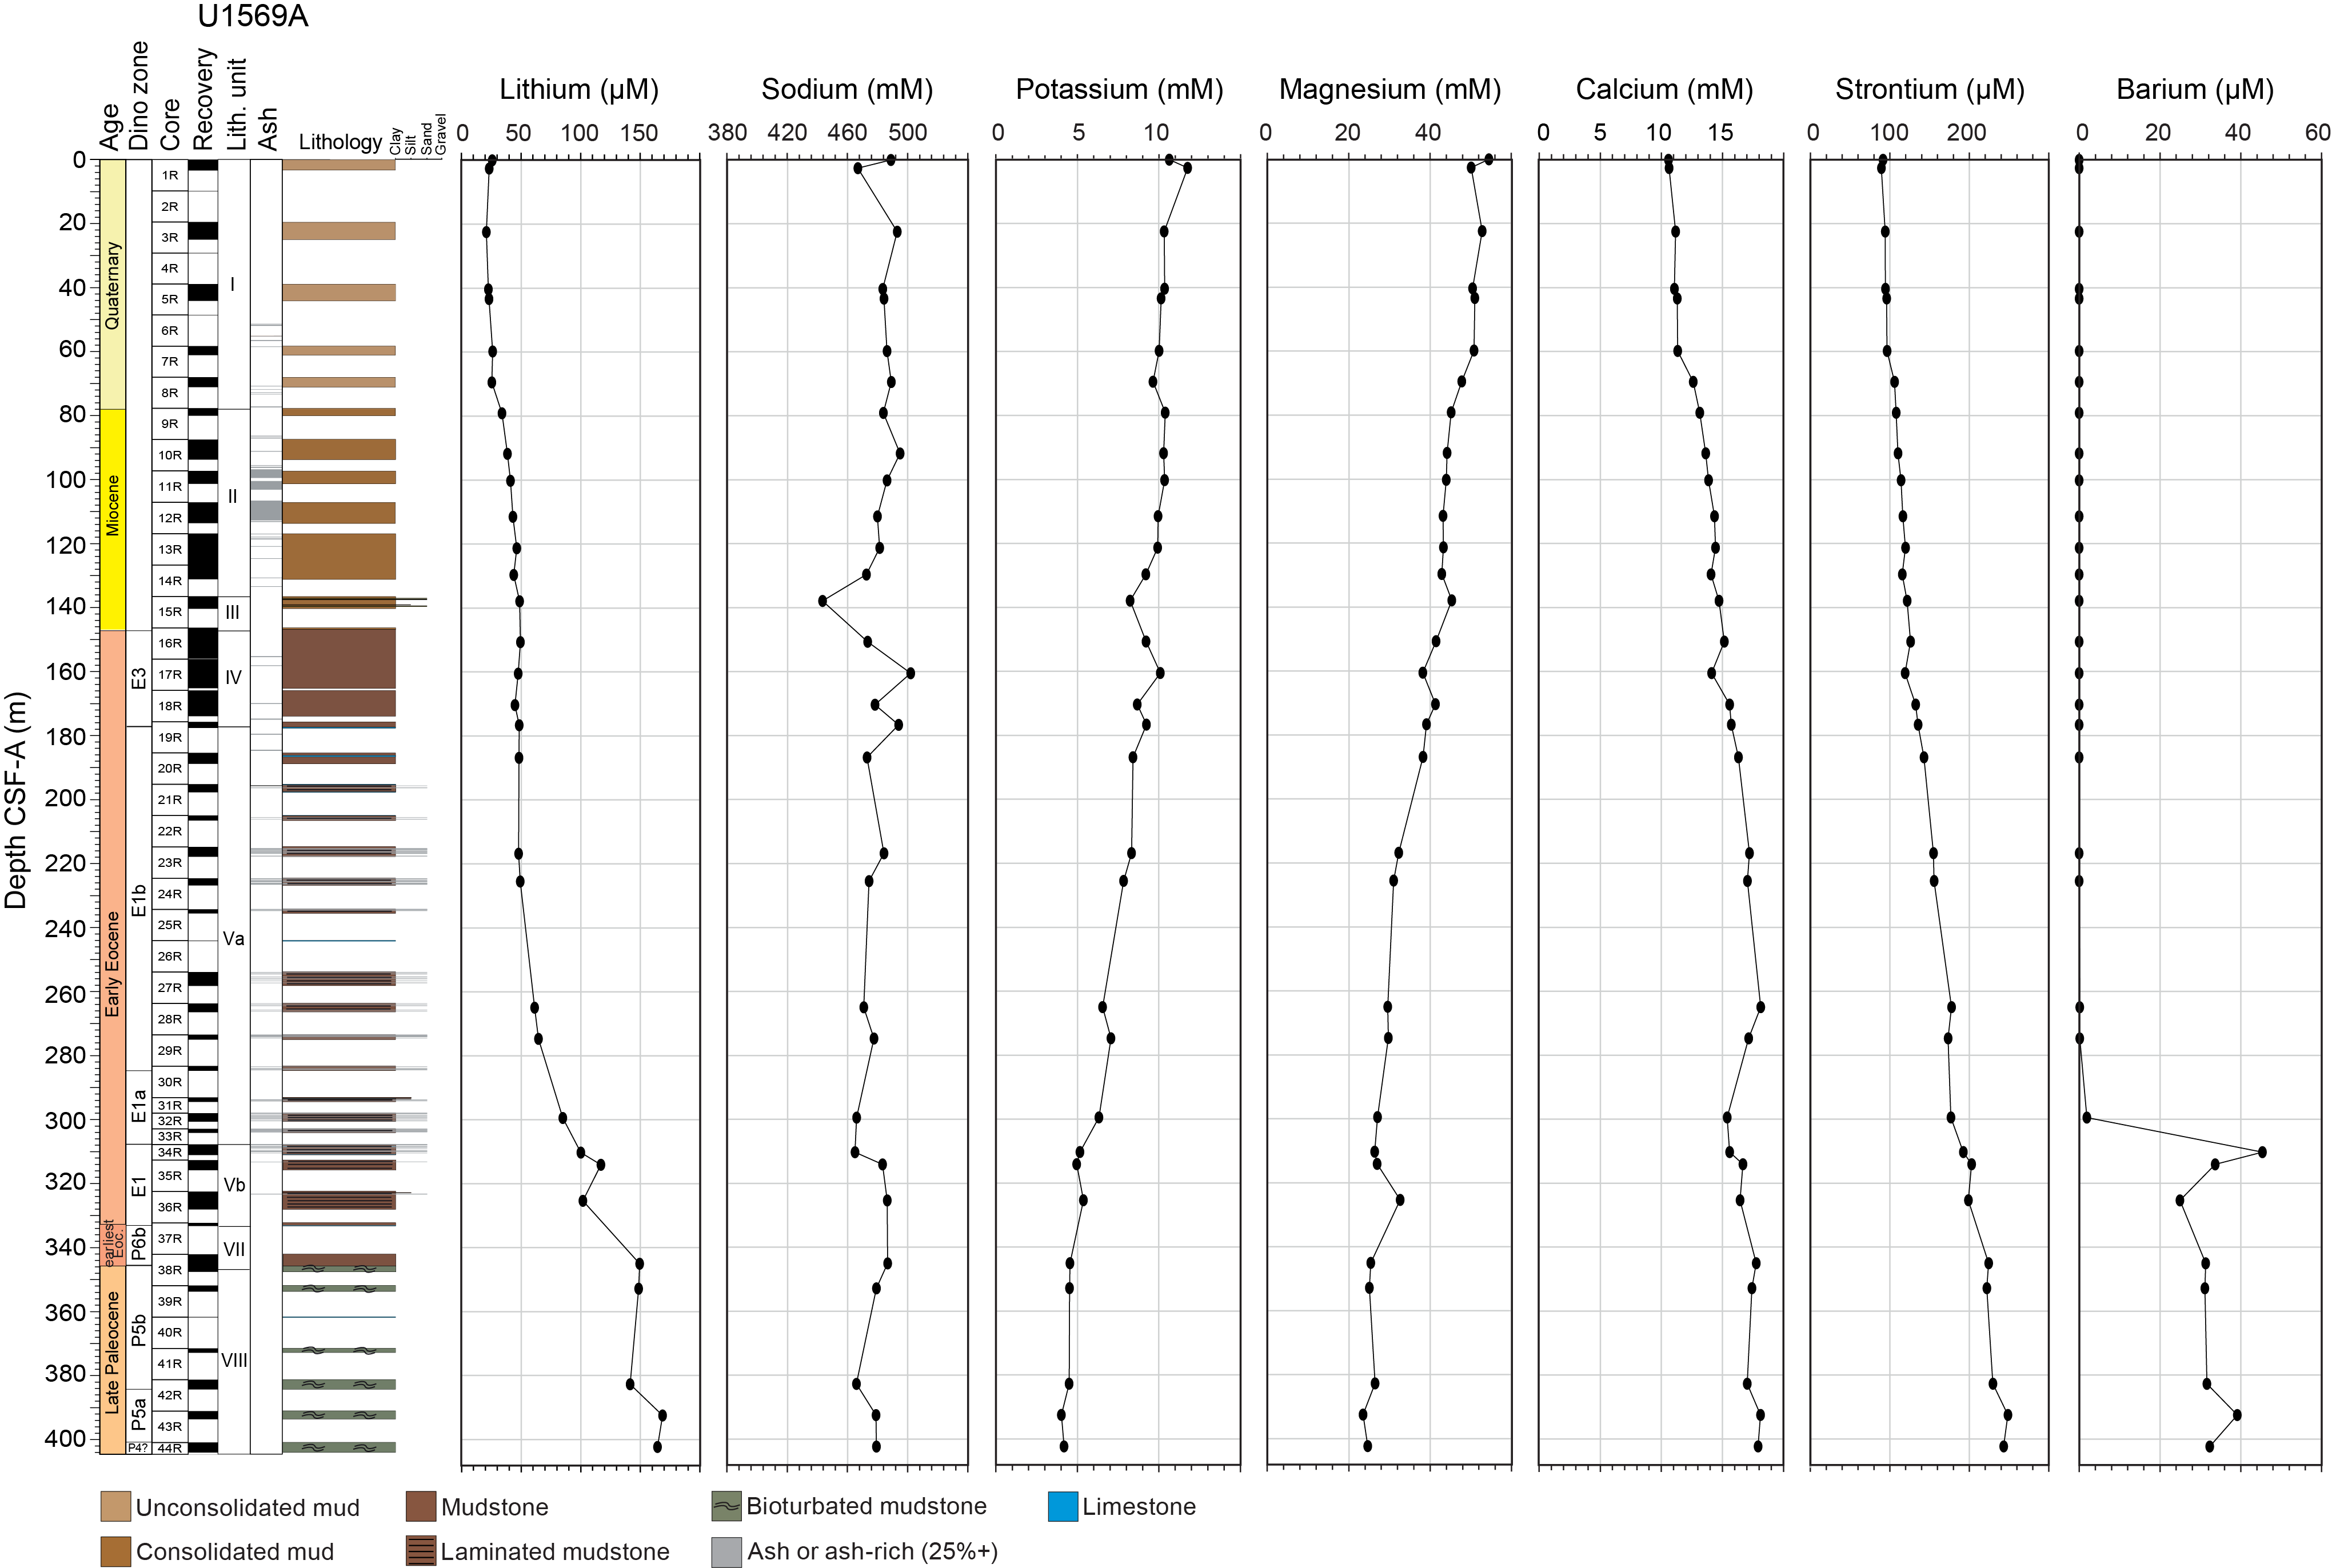
Figure F25. Alkali and alkali earth metals, Hole U1569A.
Some elements appear to show relatively conservative profiles with close to linear concentration changes through the core. These include steady decreases in K, Mg, and S concentrations with depth, whereas Ca and Sr show consistent enrichments with depth (Figures F24, F25). In contrast, Ba is below the detection limit of the inductively coupled plasma–atomic emission spectrometry (ICP-AES) to 300 m CSF-A but then rises sharply to 30 µM below 275 m CSF-A (Figure F25). Lithium is also slightly anomalous; concentrations initially steadily increase with depth to the middle of Unit V (where concentrations are as high as 40 µM) before a more exponential rise with depth from ~250 m CSF-A to values approaching 160 µM at the base of the hole. The high Li contents in the lowermost strata may be related to deeper metamorphism associated with sill emplacements (see Lithostratigraphy). The Fe profile is characterized by enrichment in the uppermost 50 m, where concentrations are above 40 µM (Figure F24). Below this depth, almost all measurements are below detection limits.
6.1.2. Site U1570
Alkalinity in the samples from Hole U1570A increases linearly from 2.31 mM in the mudline sample to 7.34 mM in the lowermost IW sample at 196.91 m CSF-A (Figure F26; Table T17). A similar trend is present in the IW samples from Hole U1570C, which rise from 2.4 to 6.9 mM from the mudline to the base of the hole (Figure F27). In contrast, samples from Hole U1570B diverge from the linear increase below 60.59 m CSF-A, at which point alkalinity decreases to nearly 3 mM at 91.73 m CSF-A before recovering to values of around 4 mM at the base of the hole (Figure F28).
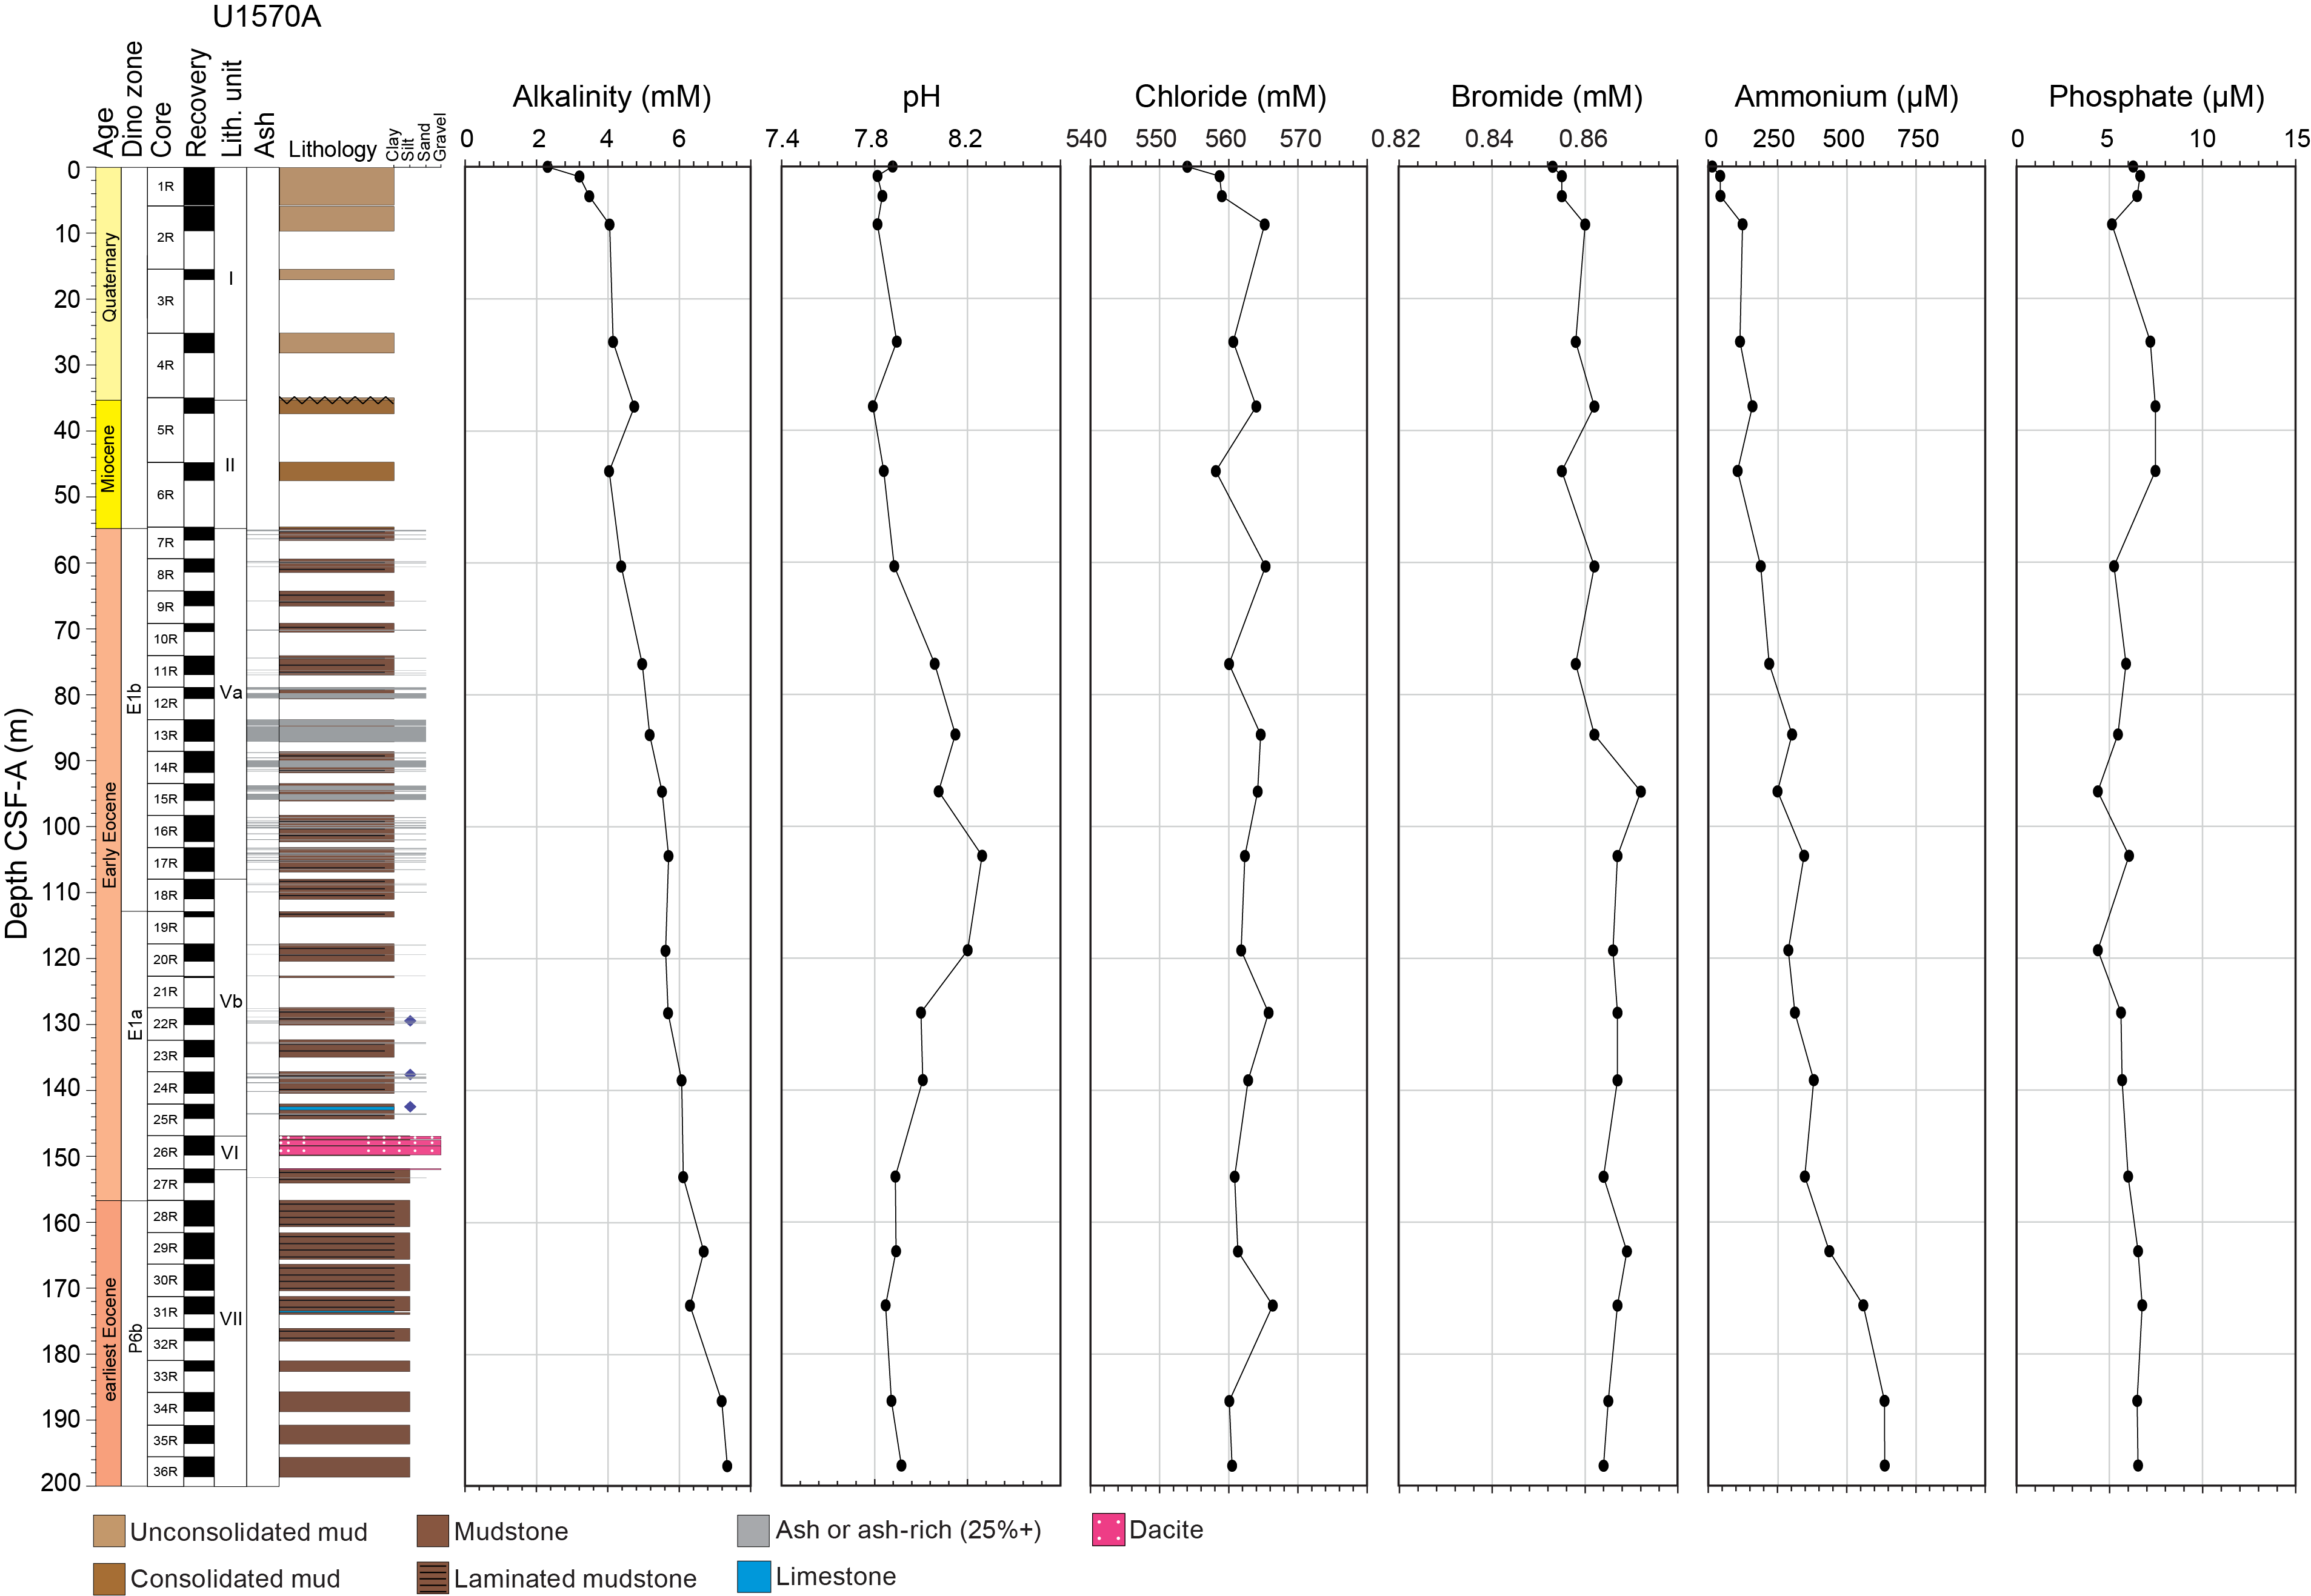
Figure F26. IW alkalinity, pH, Cl, Br, NH4+, and PO43−, Hole U1570A.
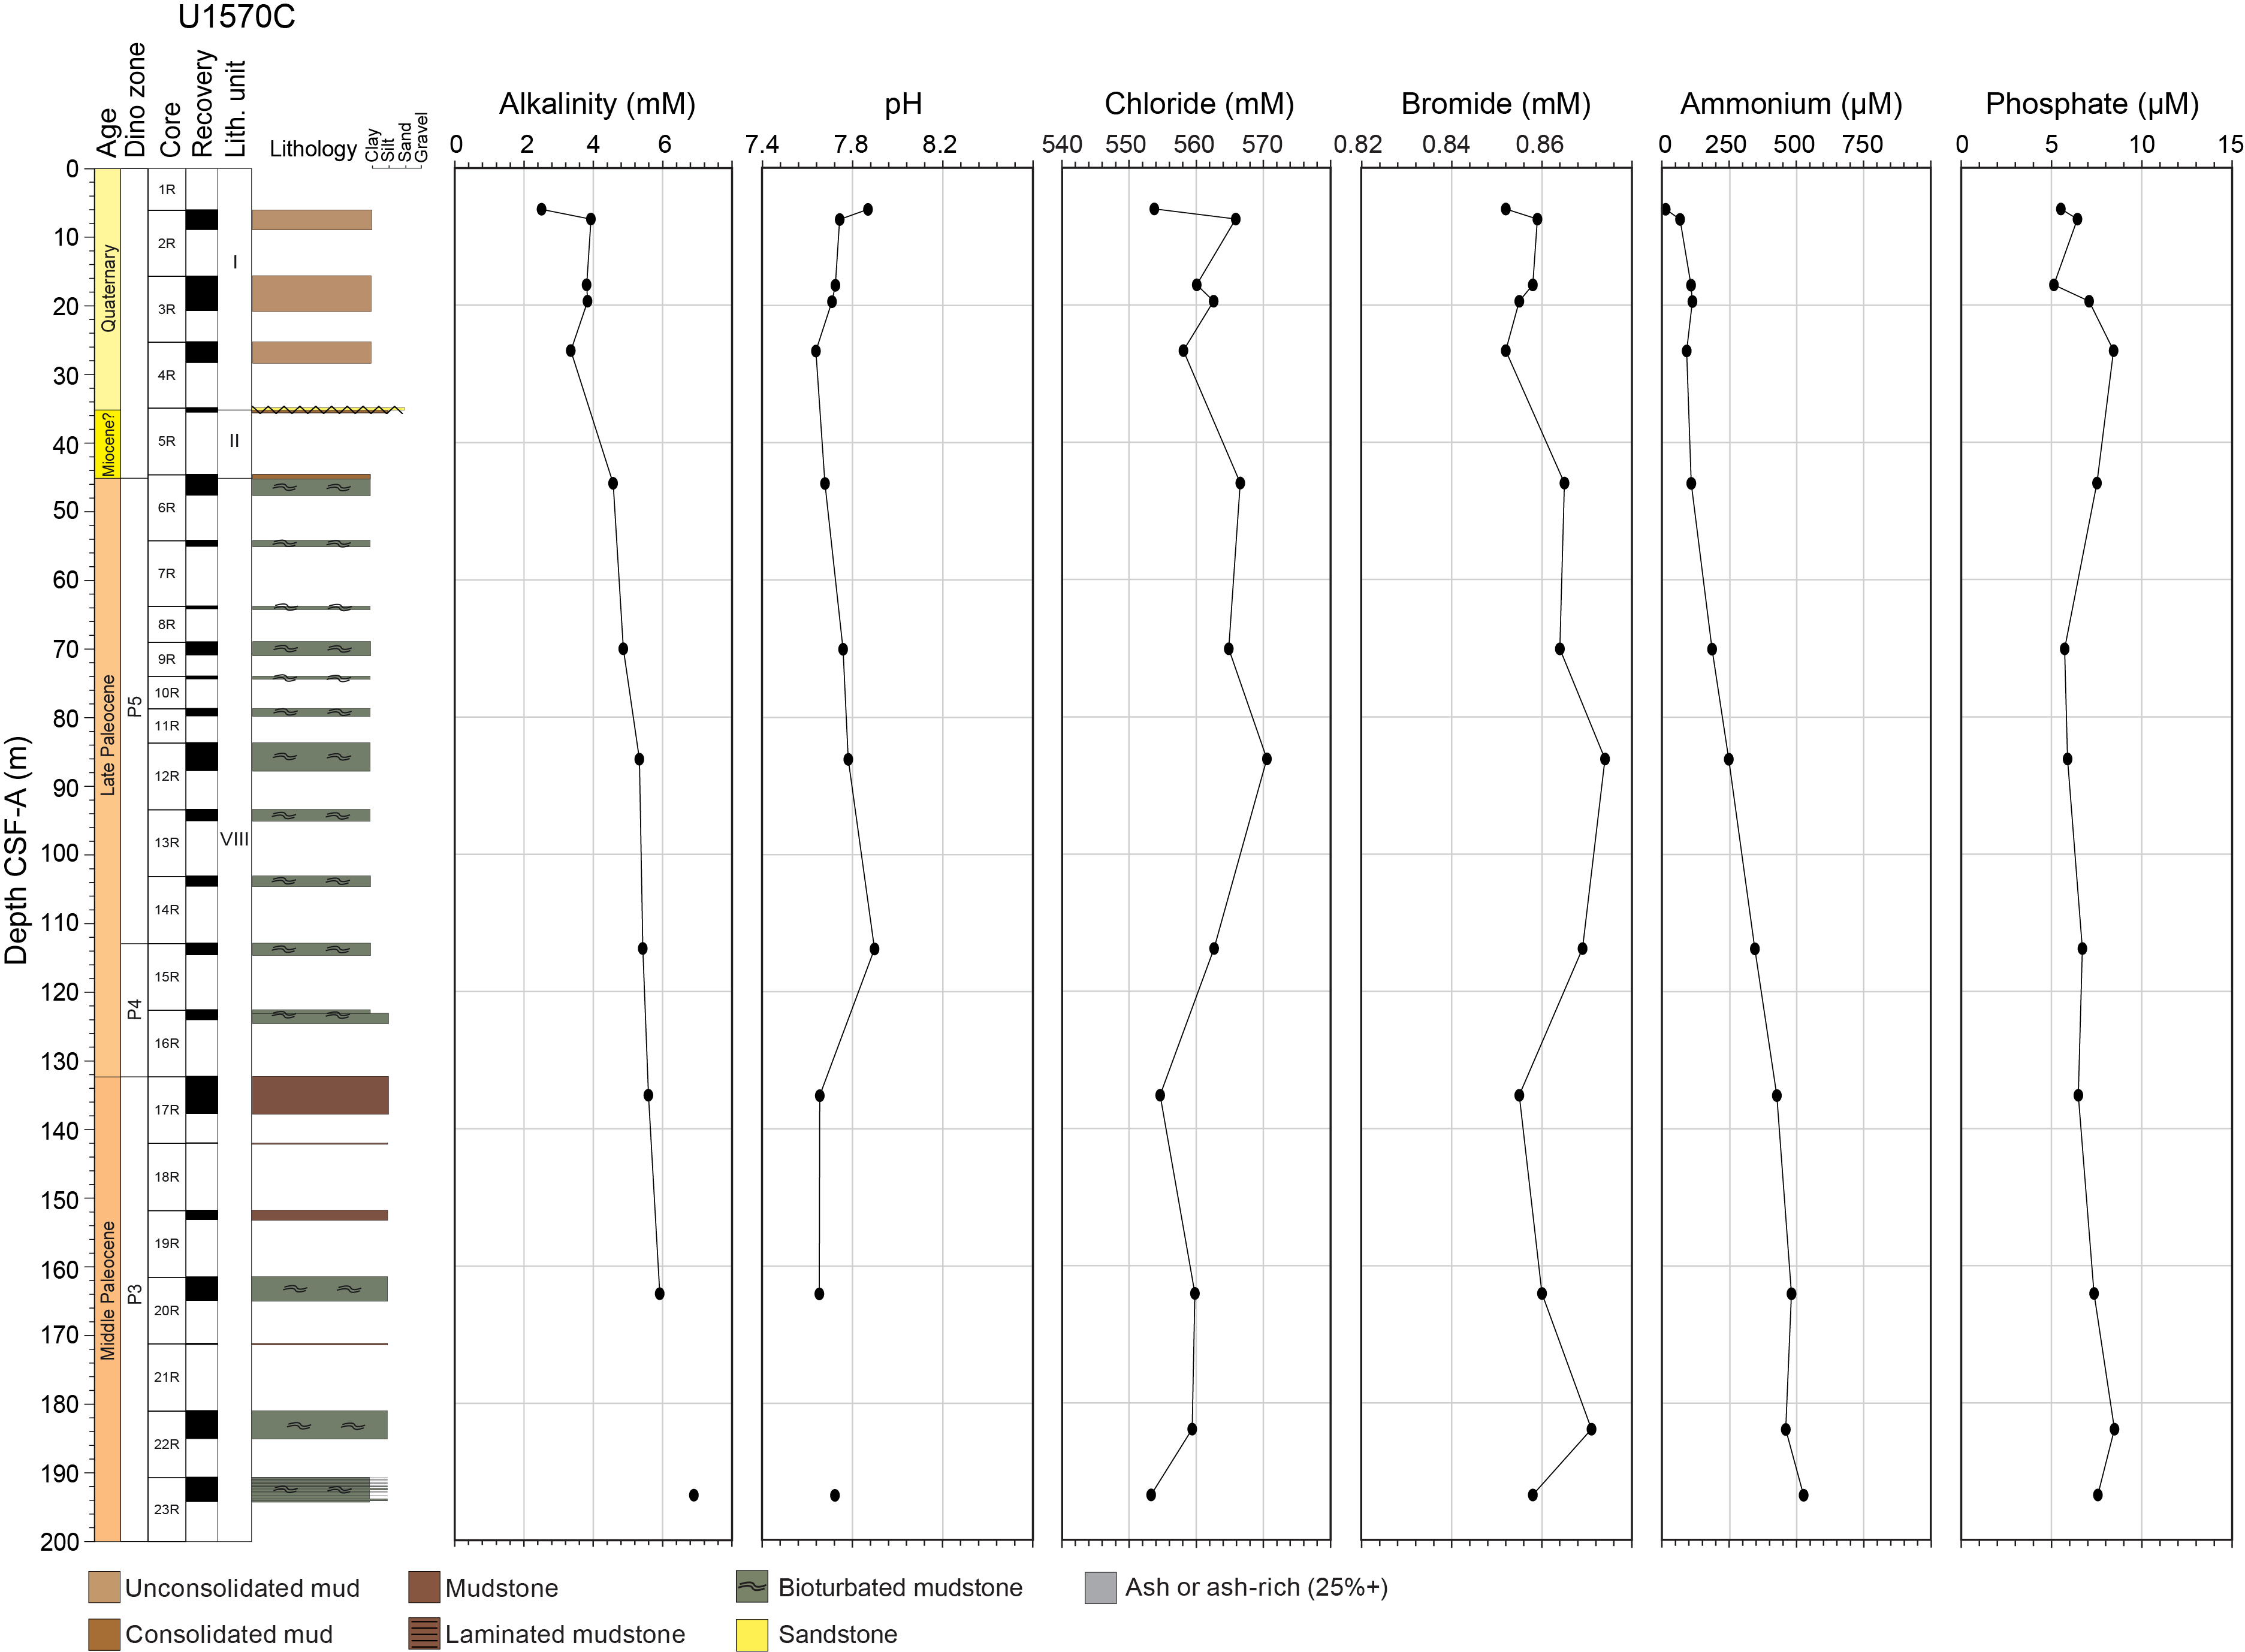
Figure F27. IW alkalinity, pH, Cl, Br, NH4+, and PO43−, Hole U1570C.
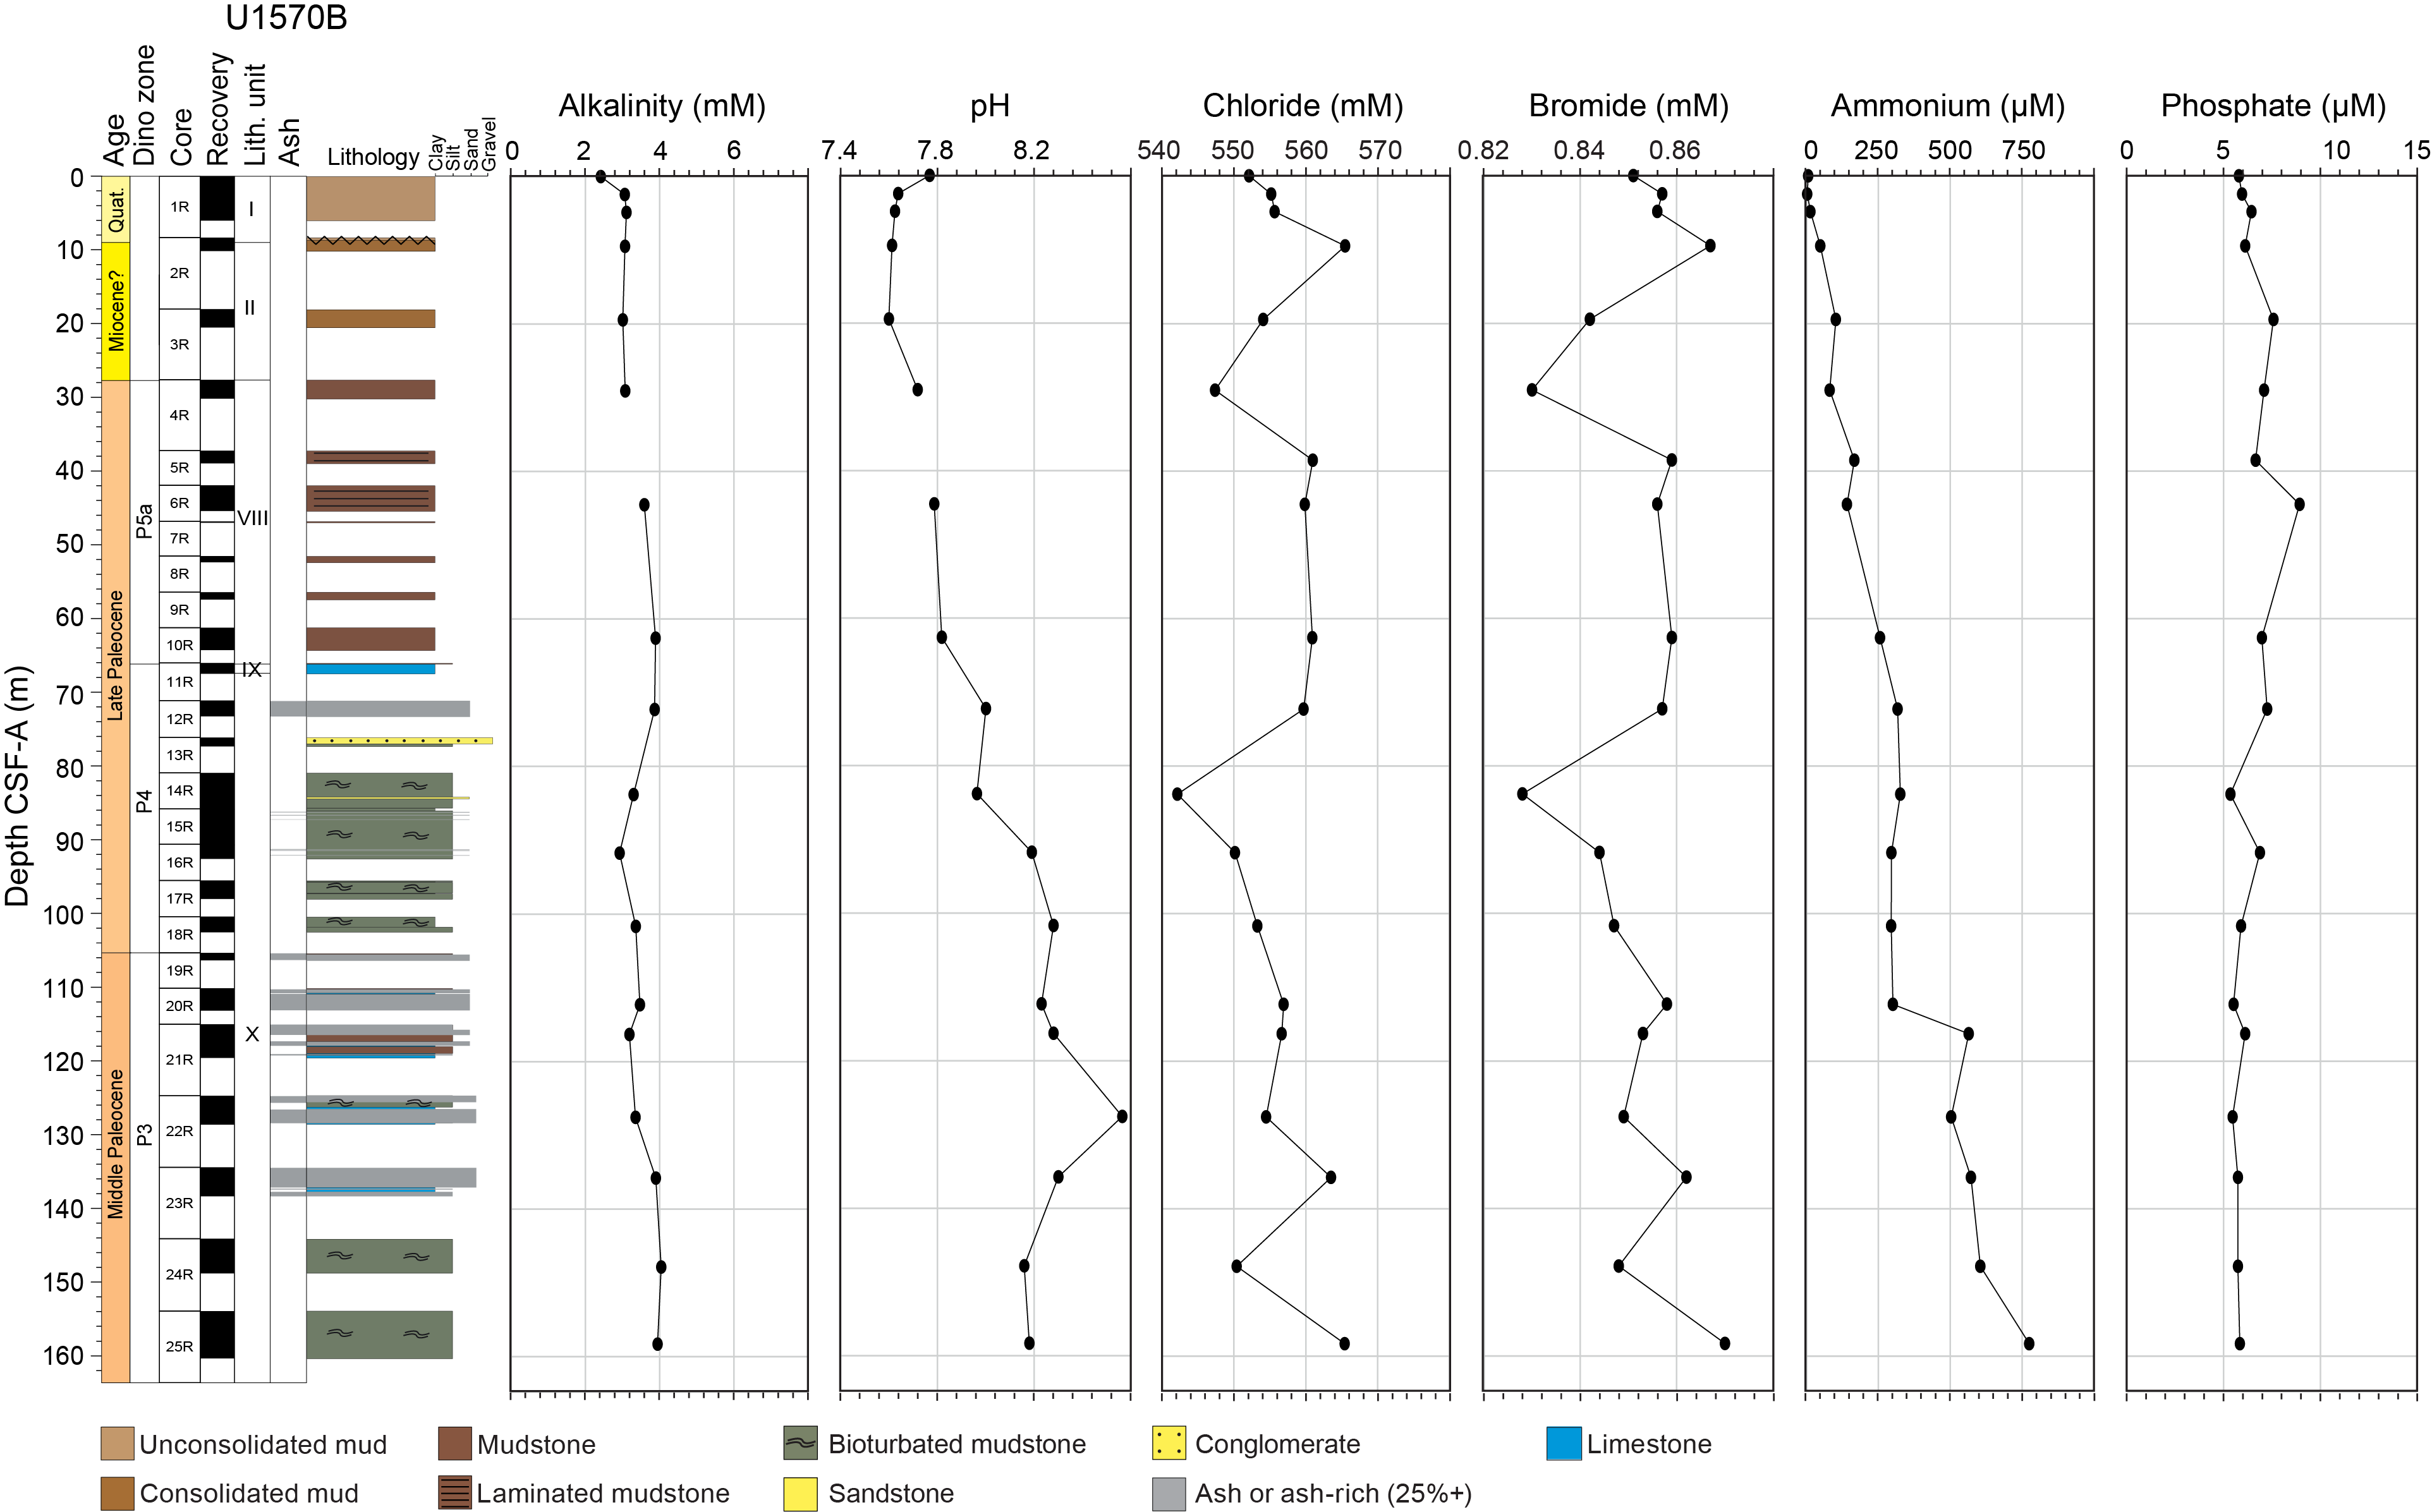
Figure F28. IW alkalinity, pH, Cl, Br, NH4+, and PO43−, Hole U1570B.
The pH varies considerably between holes. The mudline samples from Holes U1570A and U1570C are similar, showing 7.7 and 7.86, respectively. Hole U1570C shows the least variability, and pH ranges 7.65–7.90 throughout the core (Figure F27). Hole U1570A shows a general increase to pH 8.18 at 105 m CSF-A toward the base of the main ash-rich stratigraphy in Unit V (Figure F26). Hole U1570B shows an even larger pH increase to 8.56 at 127.56 m CSF-A, again within an ash-rich interval in Unit X (Figure F28). This is accompanied by relatively low alkalinity between 50 and 150 m CSF-A in Hole U1570B, matching observations at previous sites such as Sites U1569 and U1568. The exact cause of the unusual combination of lowered alkalinity and elevated pH is currently not known, but potential candidates include enhanced clay mineral formation, pyrite precipitation, and/or reverse weathering (Michalopoulos and Aller, 1995).
Mudline NH4+ concentrations are between 6 and 11 µM in all holes. Downcore NH4+ values rise linearly with depth, from around 40 µM to over 700 µM (Table T17). The highest NH4+ concentration is present in IW samples from Hole U1570B, which reaches 775 µM at the base of the analyzed core. One exception to the linearly increasing trends may be seen in Hole U1570B at around 116 m CSF-A, where NH4+ concentrations rise from 300 µM to over 560 µM (Figure F28). This step change is coincident with a transition from ash-rich to ash-poor underlying strata, suggesting that rapid burial during ash deposition inhibited pore water oxygen concentrations (Hembury et al., 2012). Phosphate values vary slightly in all holes, ranging 5–8 µM, but display no clear trends with respect to depth or lithology.
Unlike the pronounced enrichments at Site U1569, Br and Cl show no trends downcore in Holes U1570A and U1570C. In Hole U1570B, however, both show low concentrations at 29, 84, and 135 m CSF-A (Figure F28). These decreases suggest some mechanism that freshens the pore space, a conclusion supported by the slightly lowered salinity content in Cores 23R and 24R (as low as 32 g/L), corresponding to the decreases in Br and Cl concentrations at 135 m CSF-A. Sodium concentrations in IW samples also show low variability in Holes U1570A and U1570C (Figures F29, F30) but fluctuate more in Hole U1570B, reaching a nadir of 393 mM at 101.68 m CSF-A (Figure F31). Although this is potentially further evidence of low salinity, the low Na intervals do not mirror low Cl concentration zones.
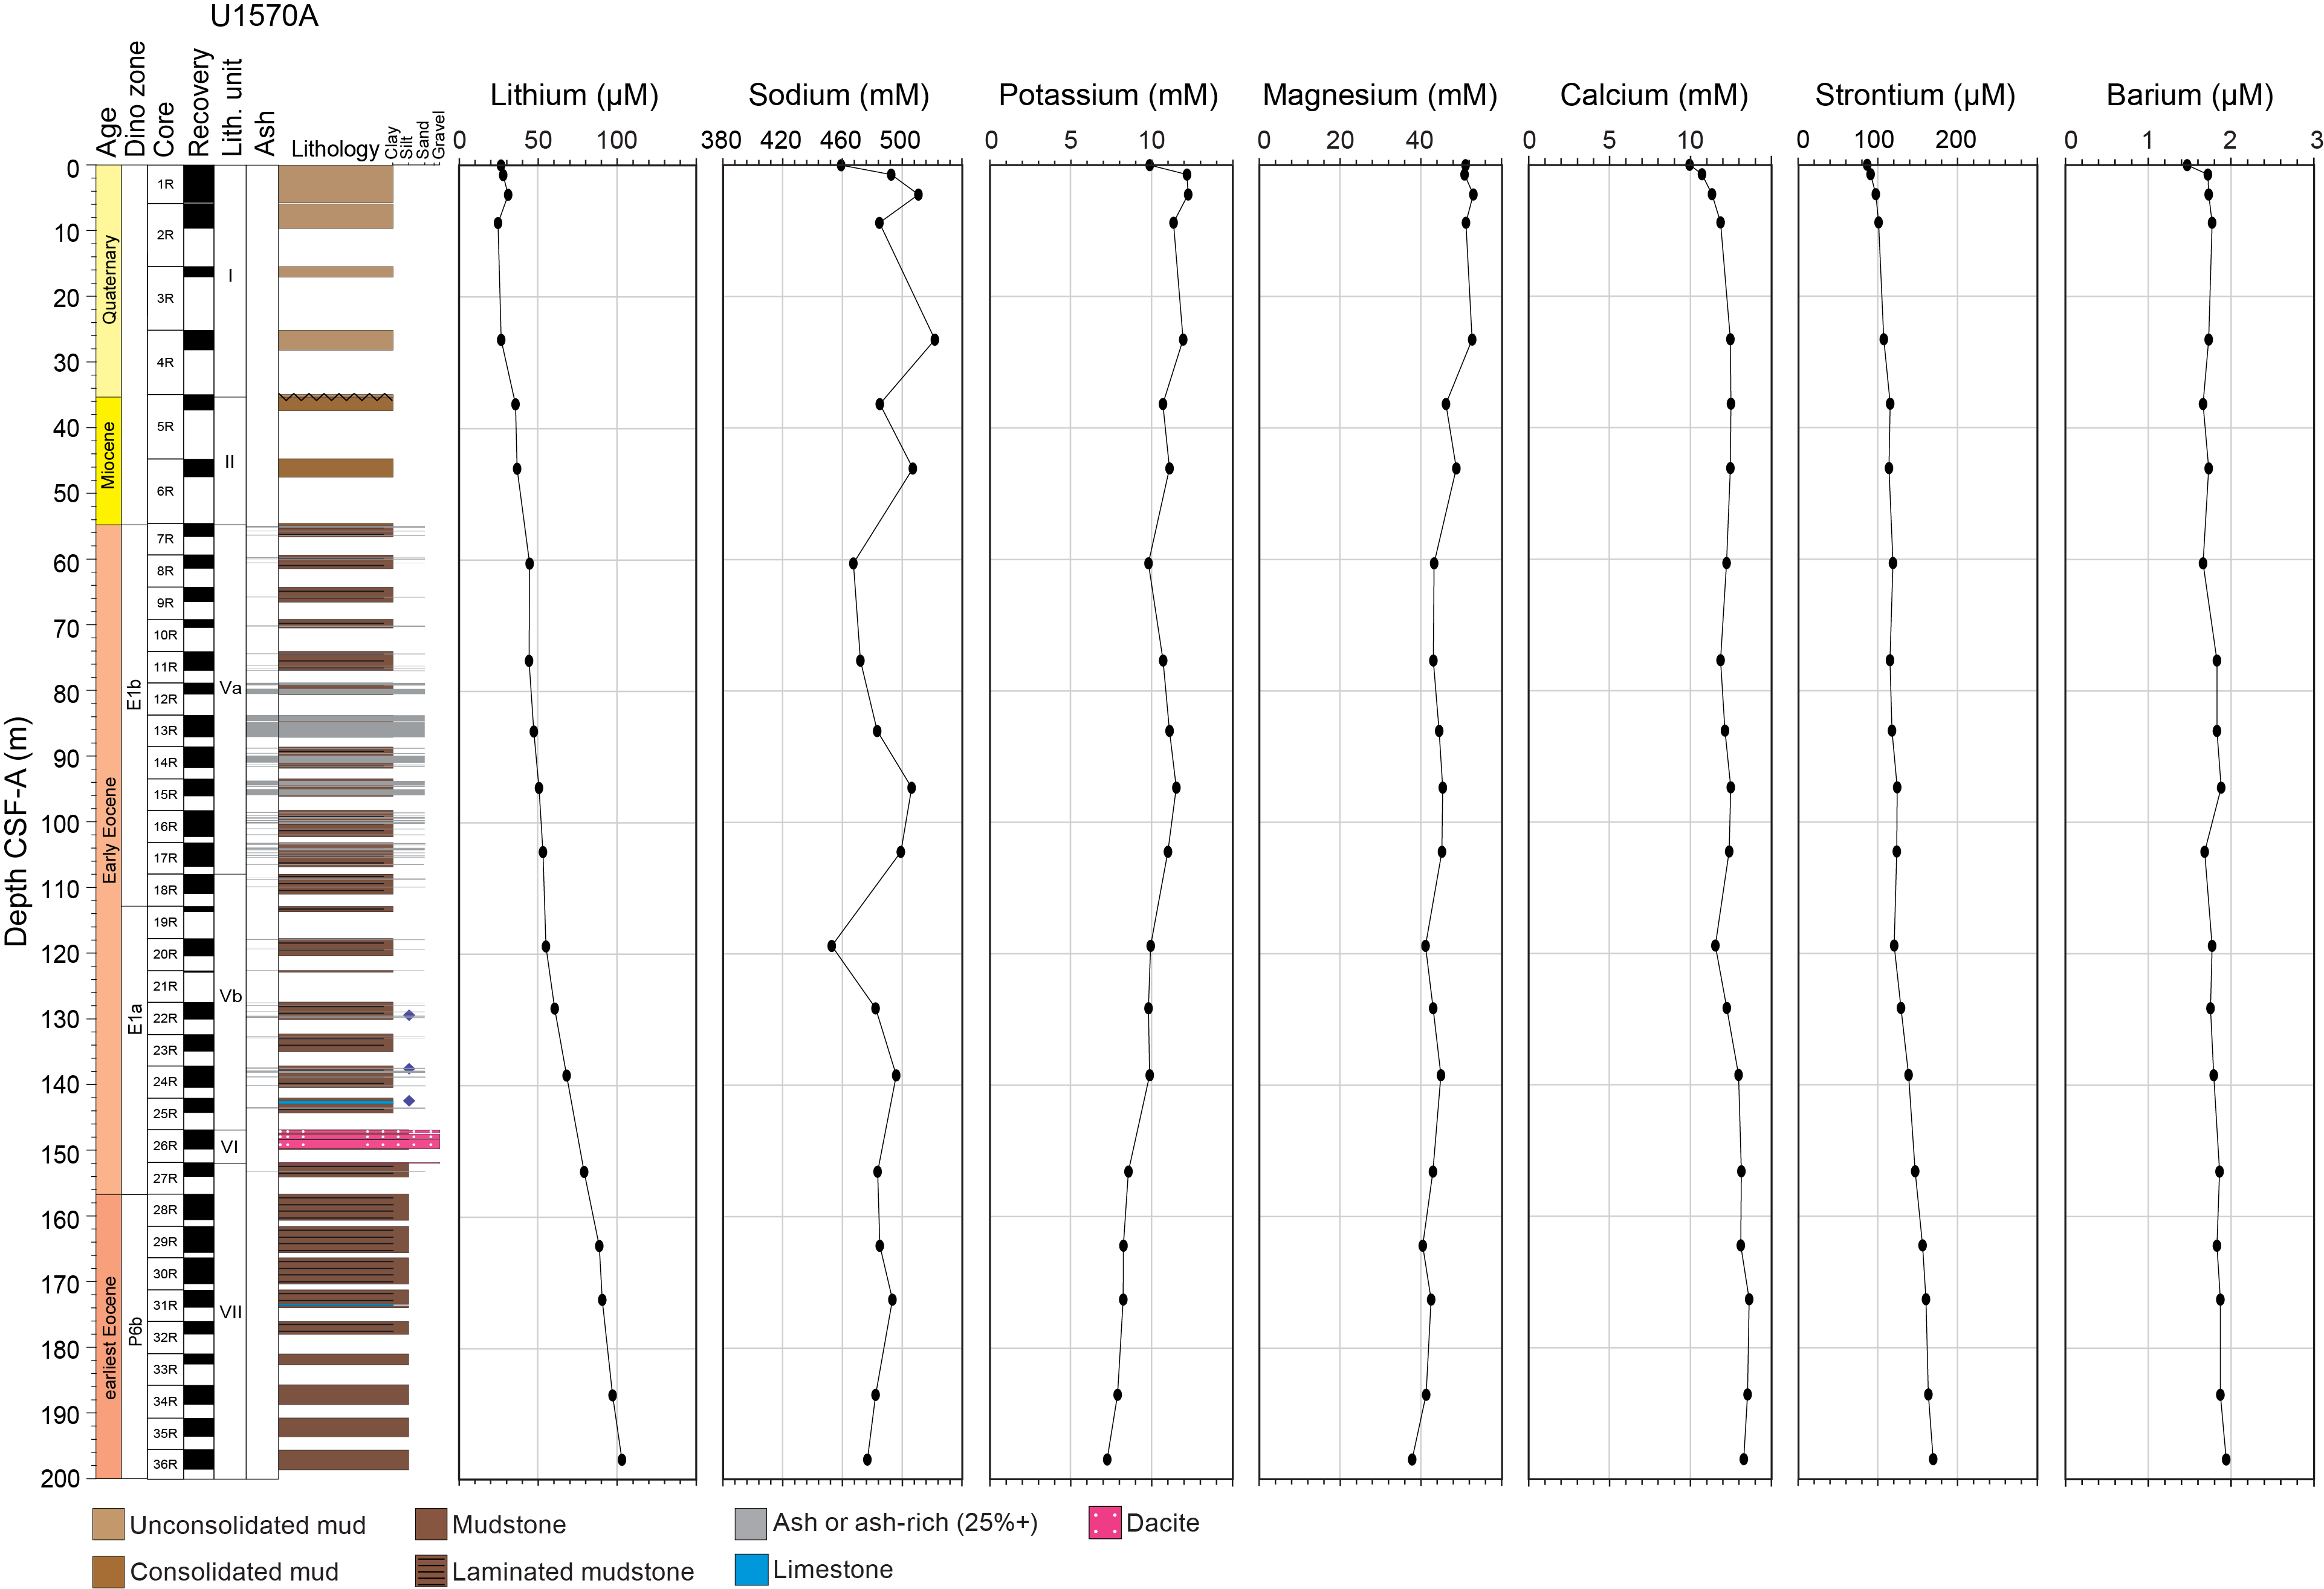
Figure F29. Alkali and alkali earth metals, Hole U1570A.
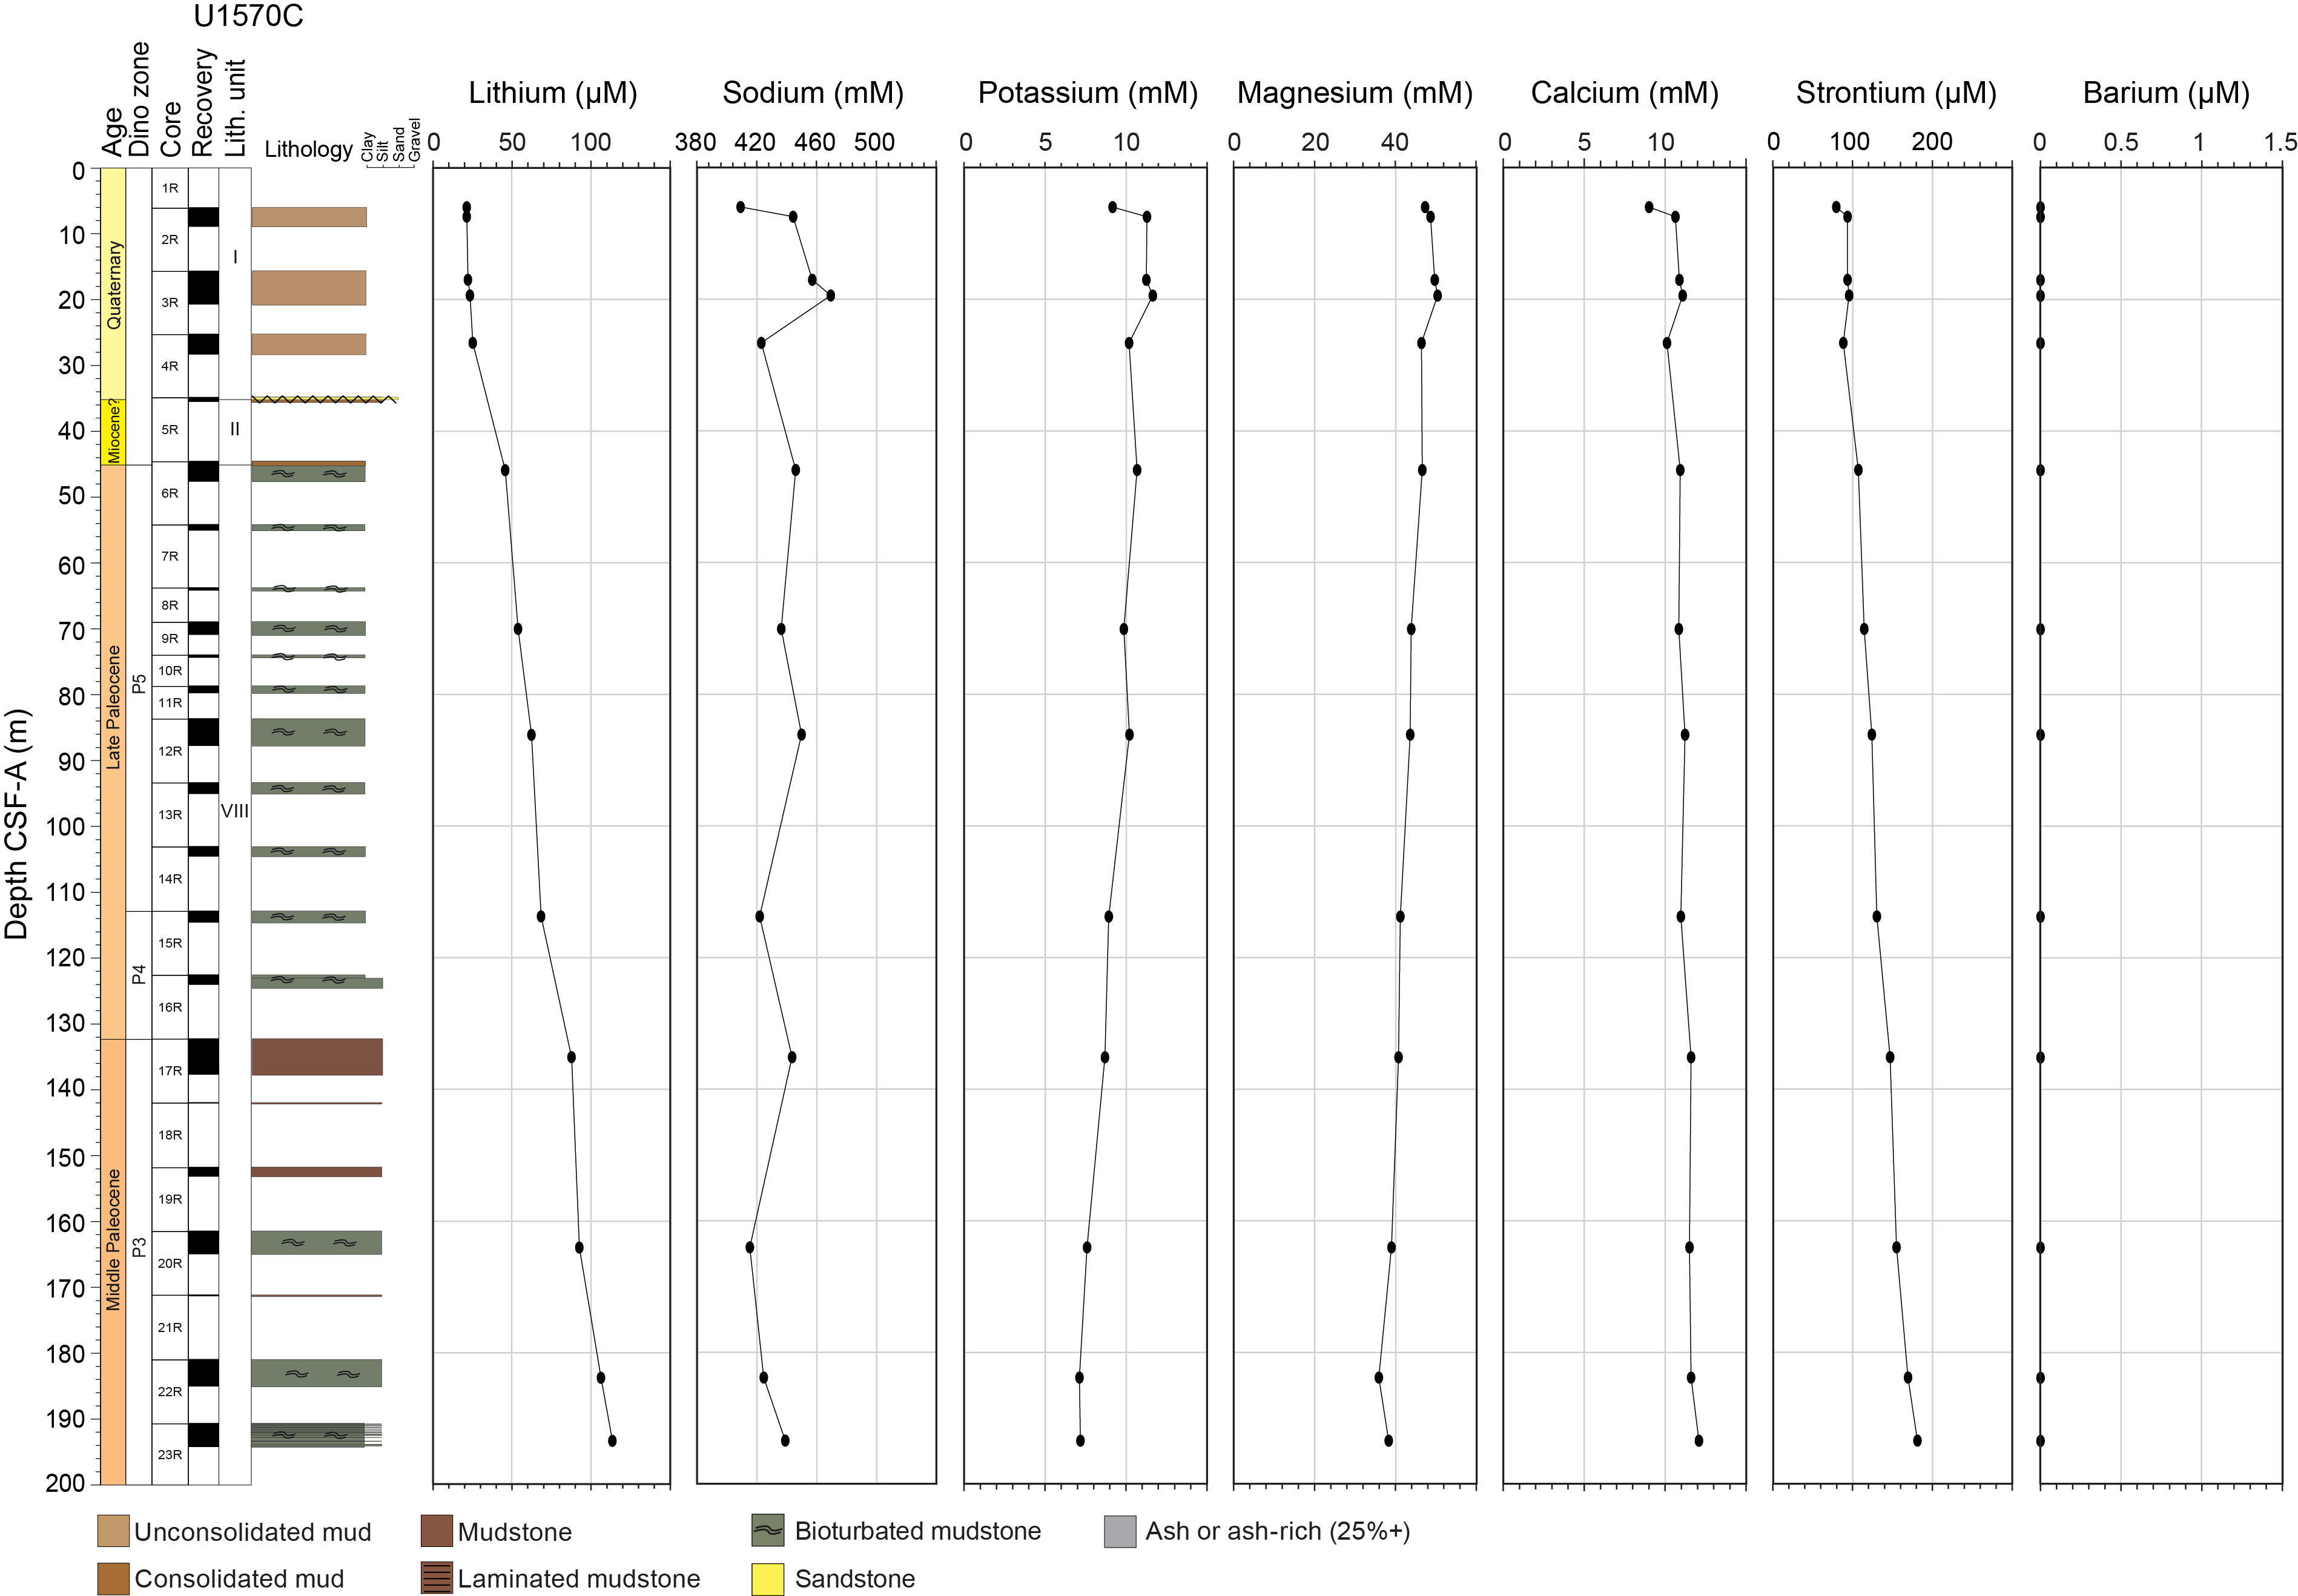
Figure F30. Alkali and alkali earth metals, Hole U1570C.
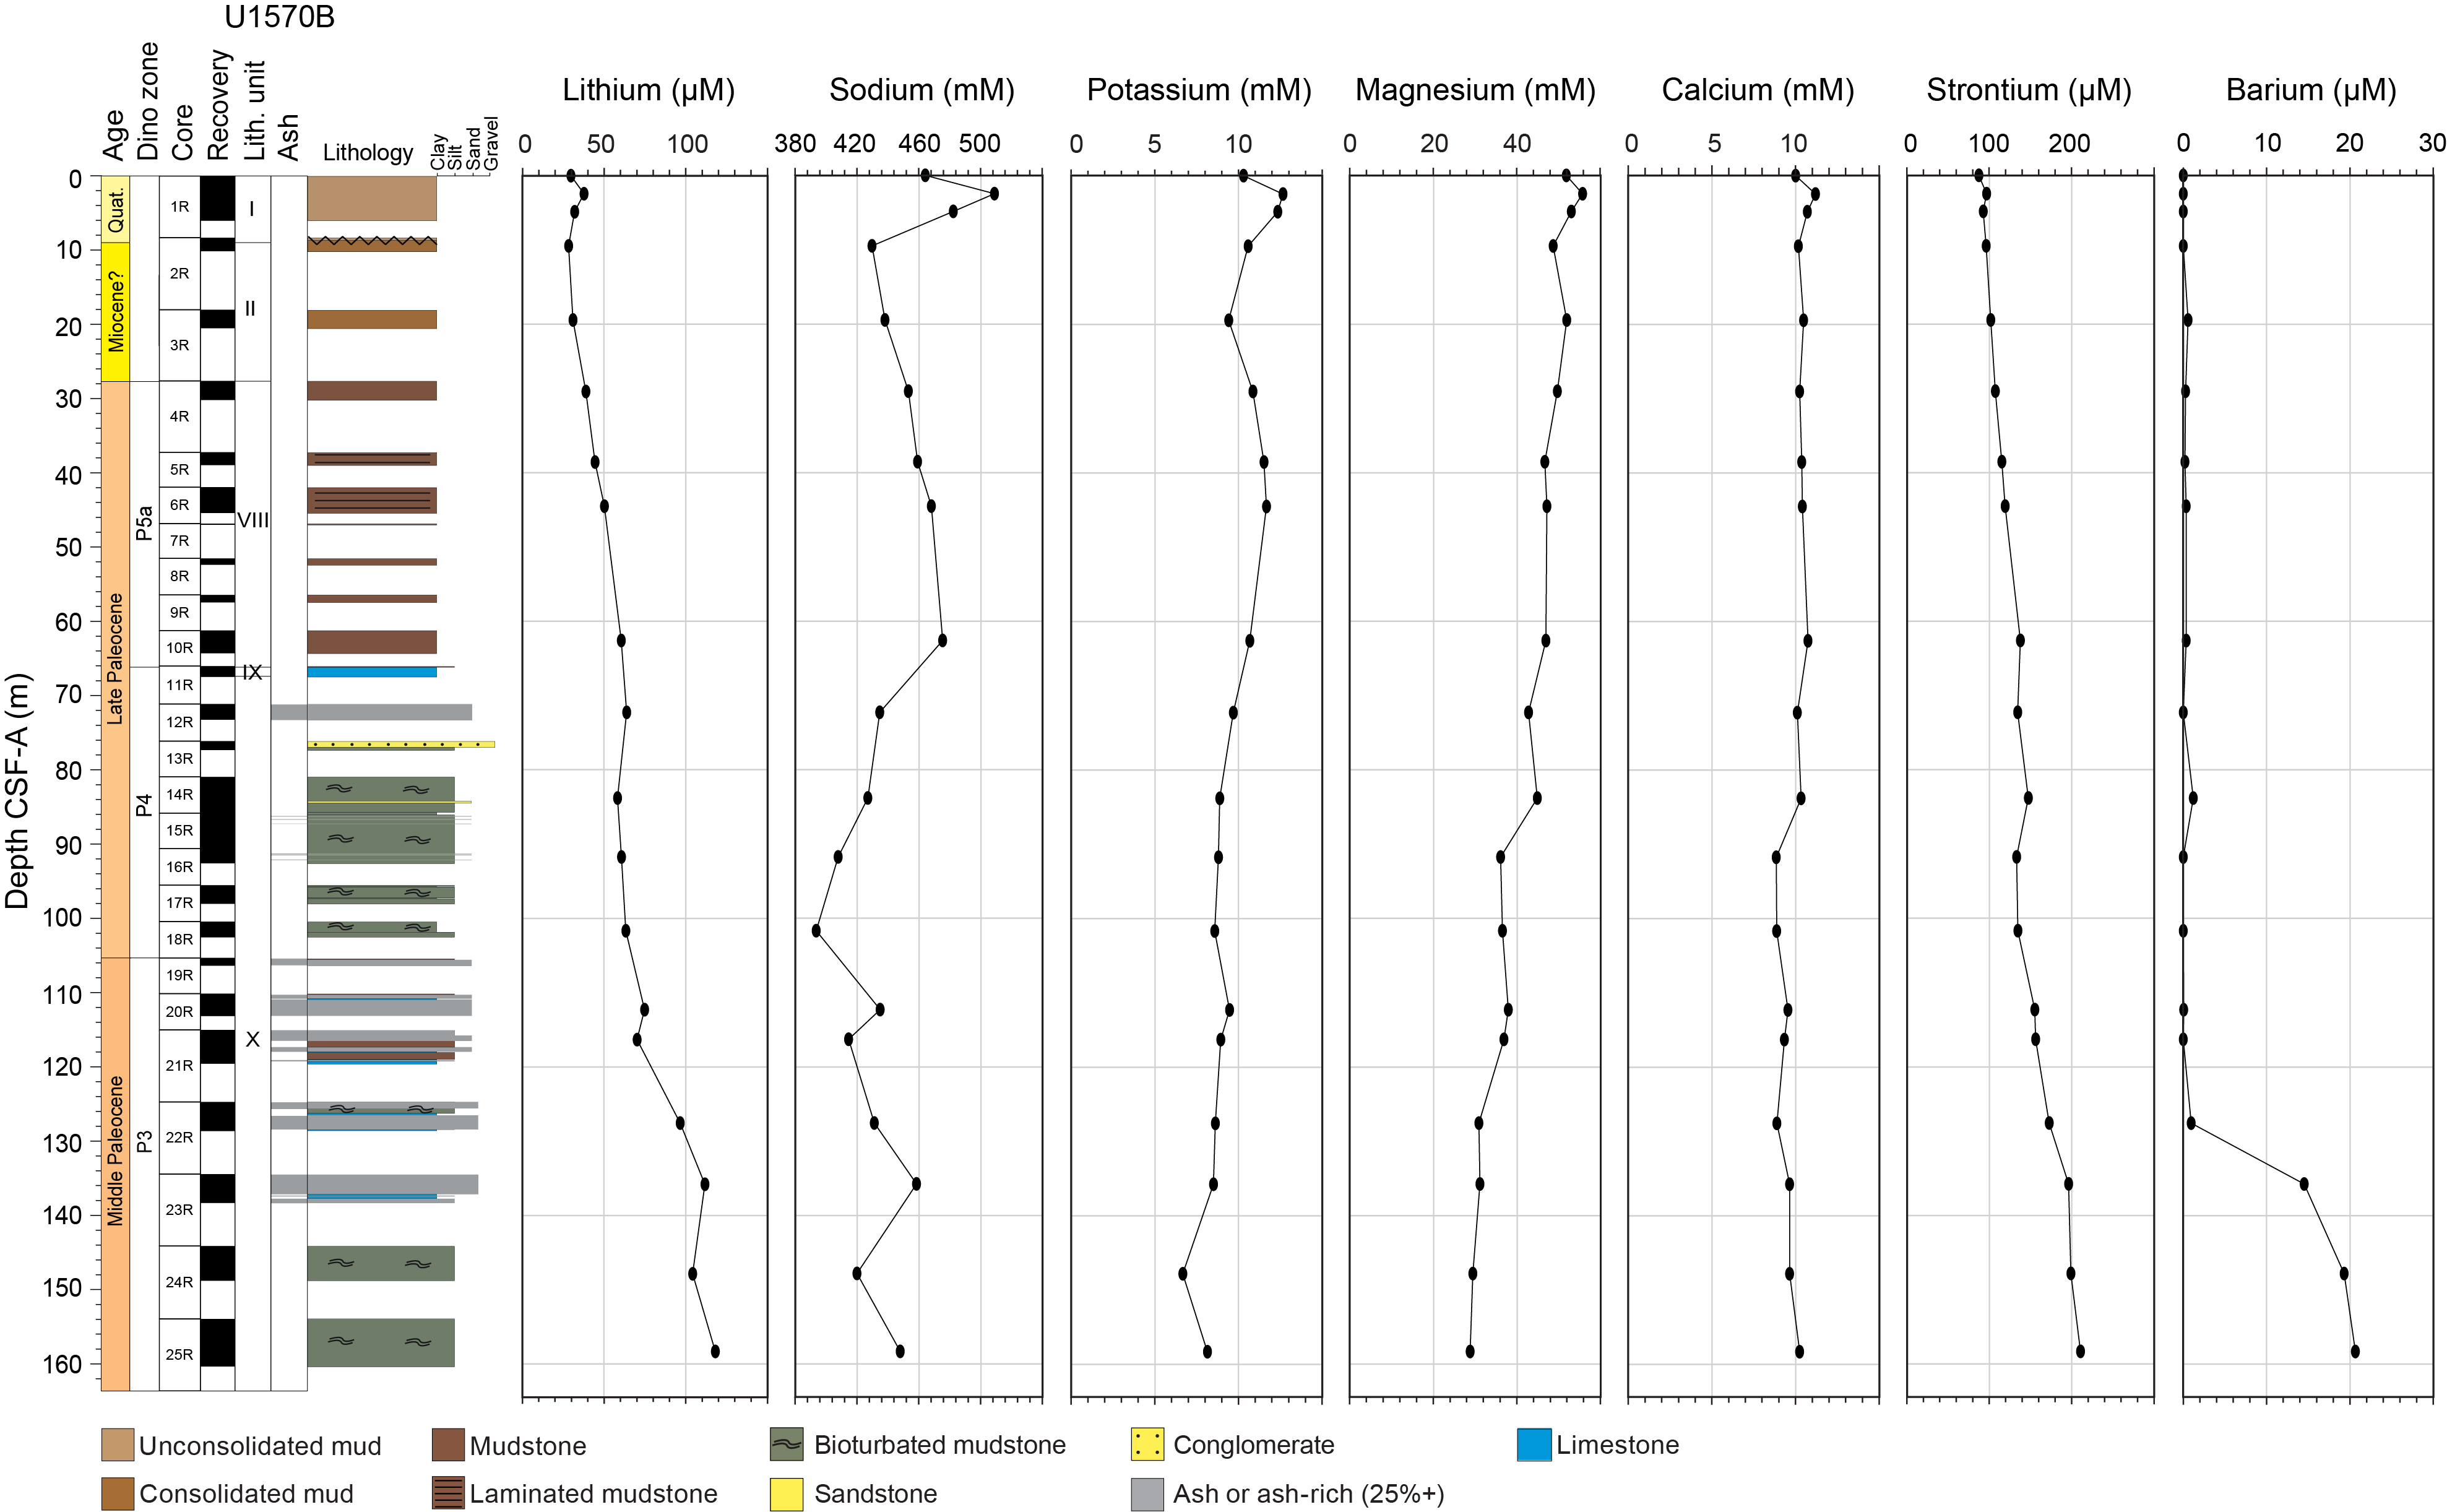
Figure F31. Alkali and alkali earth metals, Hole U1570B.
The alkali and alkali earth metals mostly show conservative behavior at Site U1570. Potassium and Mg concentrations decrease nearly linearly at all three sites, and Li and Sr show near constant increases with depth (Figures F29, F30, F31). These elemental distributions point to diffusion and advection being the primary controls on their distributions (Berner, 1980; Chester and Jickells, 2012). However, unlike at Site U1569, IW Ca concentrations only show minor enrichments with depth. The main outlier to conservative behavior is Ba, which varies considerably between holes. In Hole U1570A, Ba concentrations are near constant at ~2 µM (Figure F29). In Hole U1570C, Ba contents are below detection (Figure F30). In Hole U1570B, Ba varies between 0 and 1.2 µM to 135 m CSF-A, where there is a marked increase downcore similar to that observed at 310 m CSF-A in Hole U1569A (Figures F25, F31). The increasing Ba concentrations occur in Unit X in Hole U1570B below thick ash-rich sequences. This suggests a potential causal relationship with the overlying ashes.
For the other dissolved constituents measured, B concentrations show the highest concentrations in the upper 30 m of each hole before stabilizing to between 390 and 600 µM through the remainder of Holes U1570A and U1570C (Figures F32, F33). Hole U1570B shows the lowest B concentrations, exhibiting values below 300 µM deeper than 75 m CSF-A (Figure F34). Silica concentrations rise with depth in the upper 30 m of all three holes (0–600 µM). In Holes U1570A and U1570C, values remain high throughout the rest of the holes (Figures F32, F33). In Hole U1570B, however, there is a marked drop in Si content between 60 and 90 m CSF-A to ~200 µM, and values remain low for the remainder of the hole (Figure F34). The low Si content may indicate either reverse weathering or ash alteration leading to large amounts of clay mineralization with Si incorporated into clay mineral structures (Isson and Planavsky, 2018; Michalopoulos and Aller, 1995). As at other Expedition 396 sites, Mn and Fe contents are high in the uppermost sections of all five holes and concentrations are below detection limits in many lower intervals. Sulfur (as SO42−) concentrations decrease linearly downcore except in Hole U1570B below 135 m CSF-A, where S contents drop to near zero (Figure F34). This is mostly likely due to the formation of pyrite at depth in Unit X.
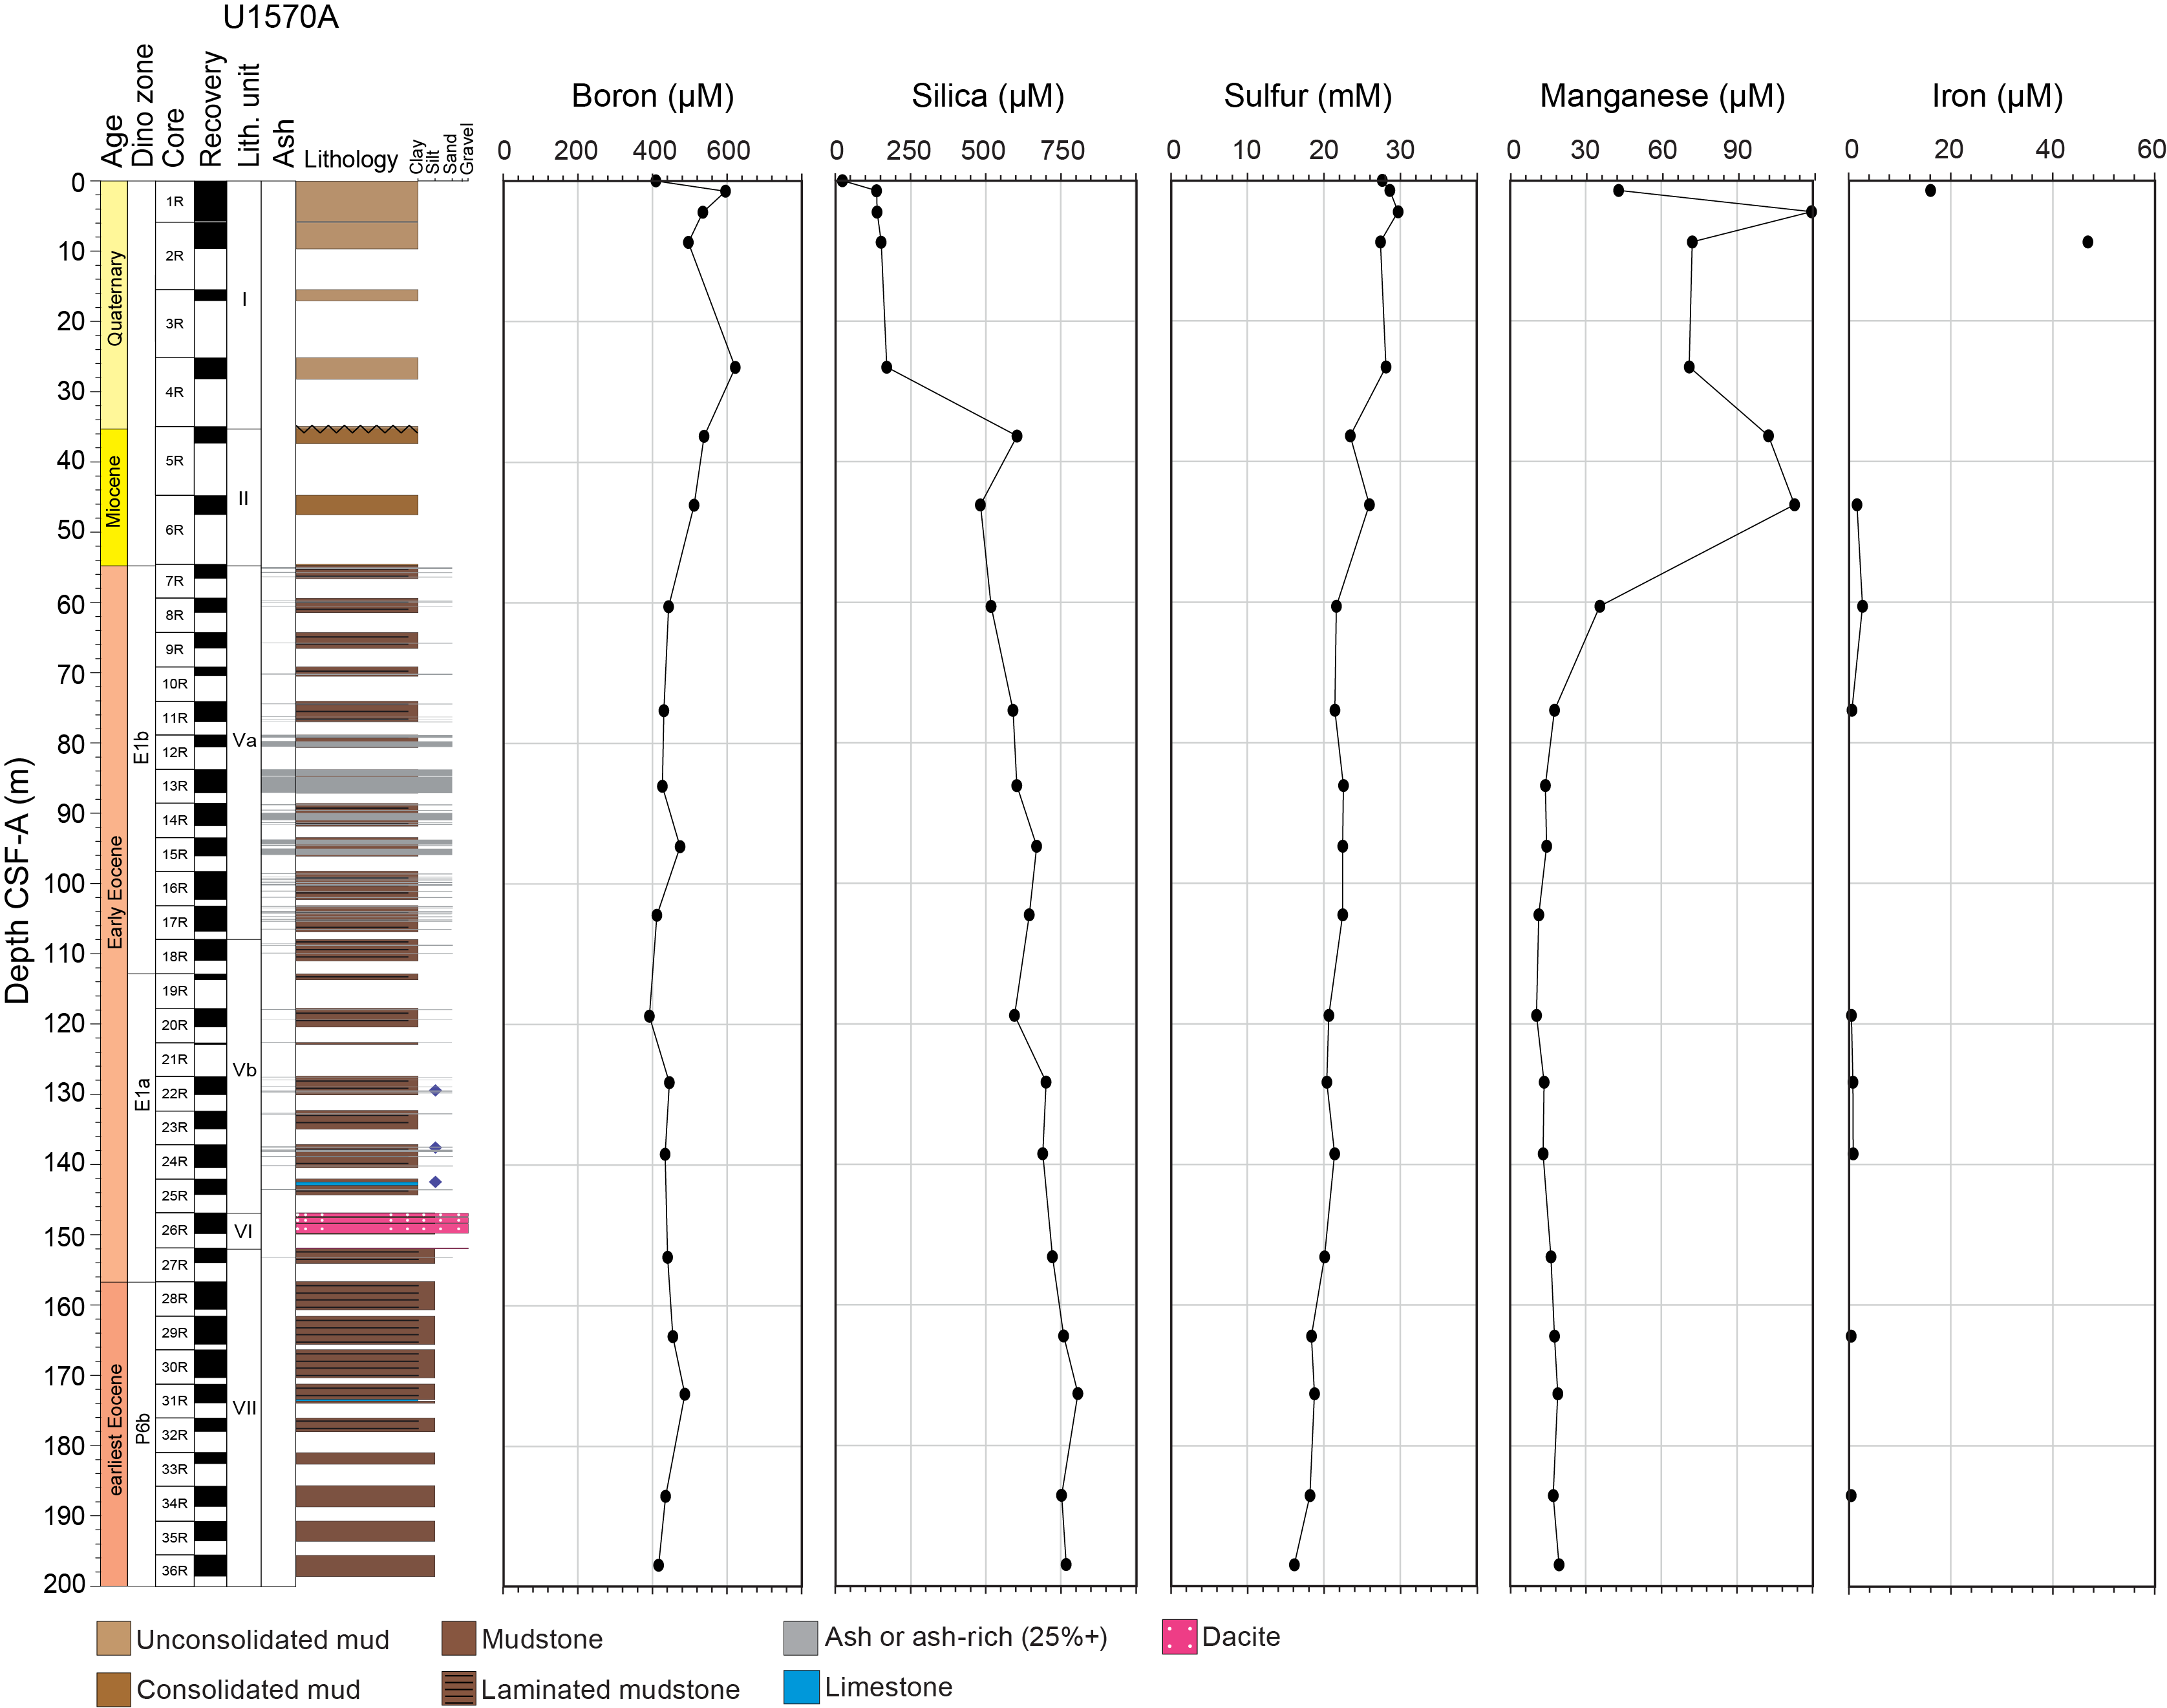
Figure F32. B, Si, S, Mn, and Fe, Hole U1570A.
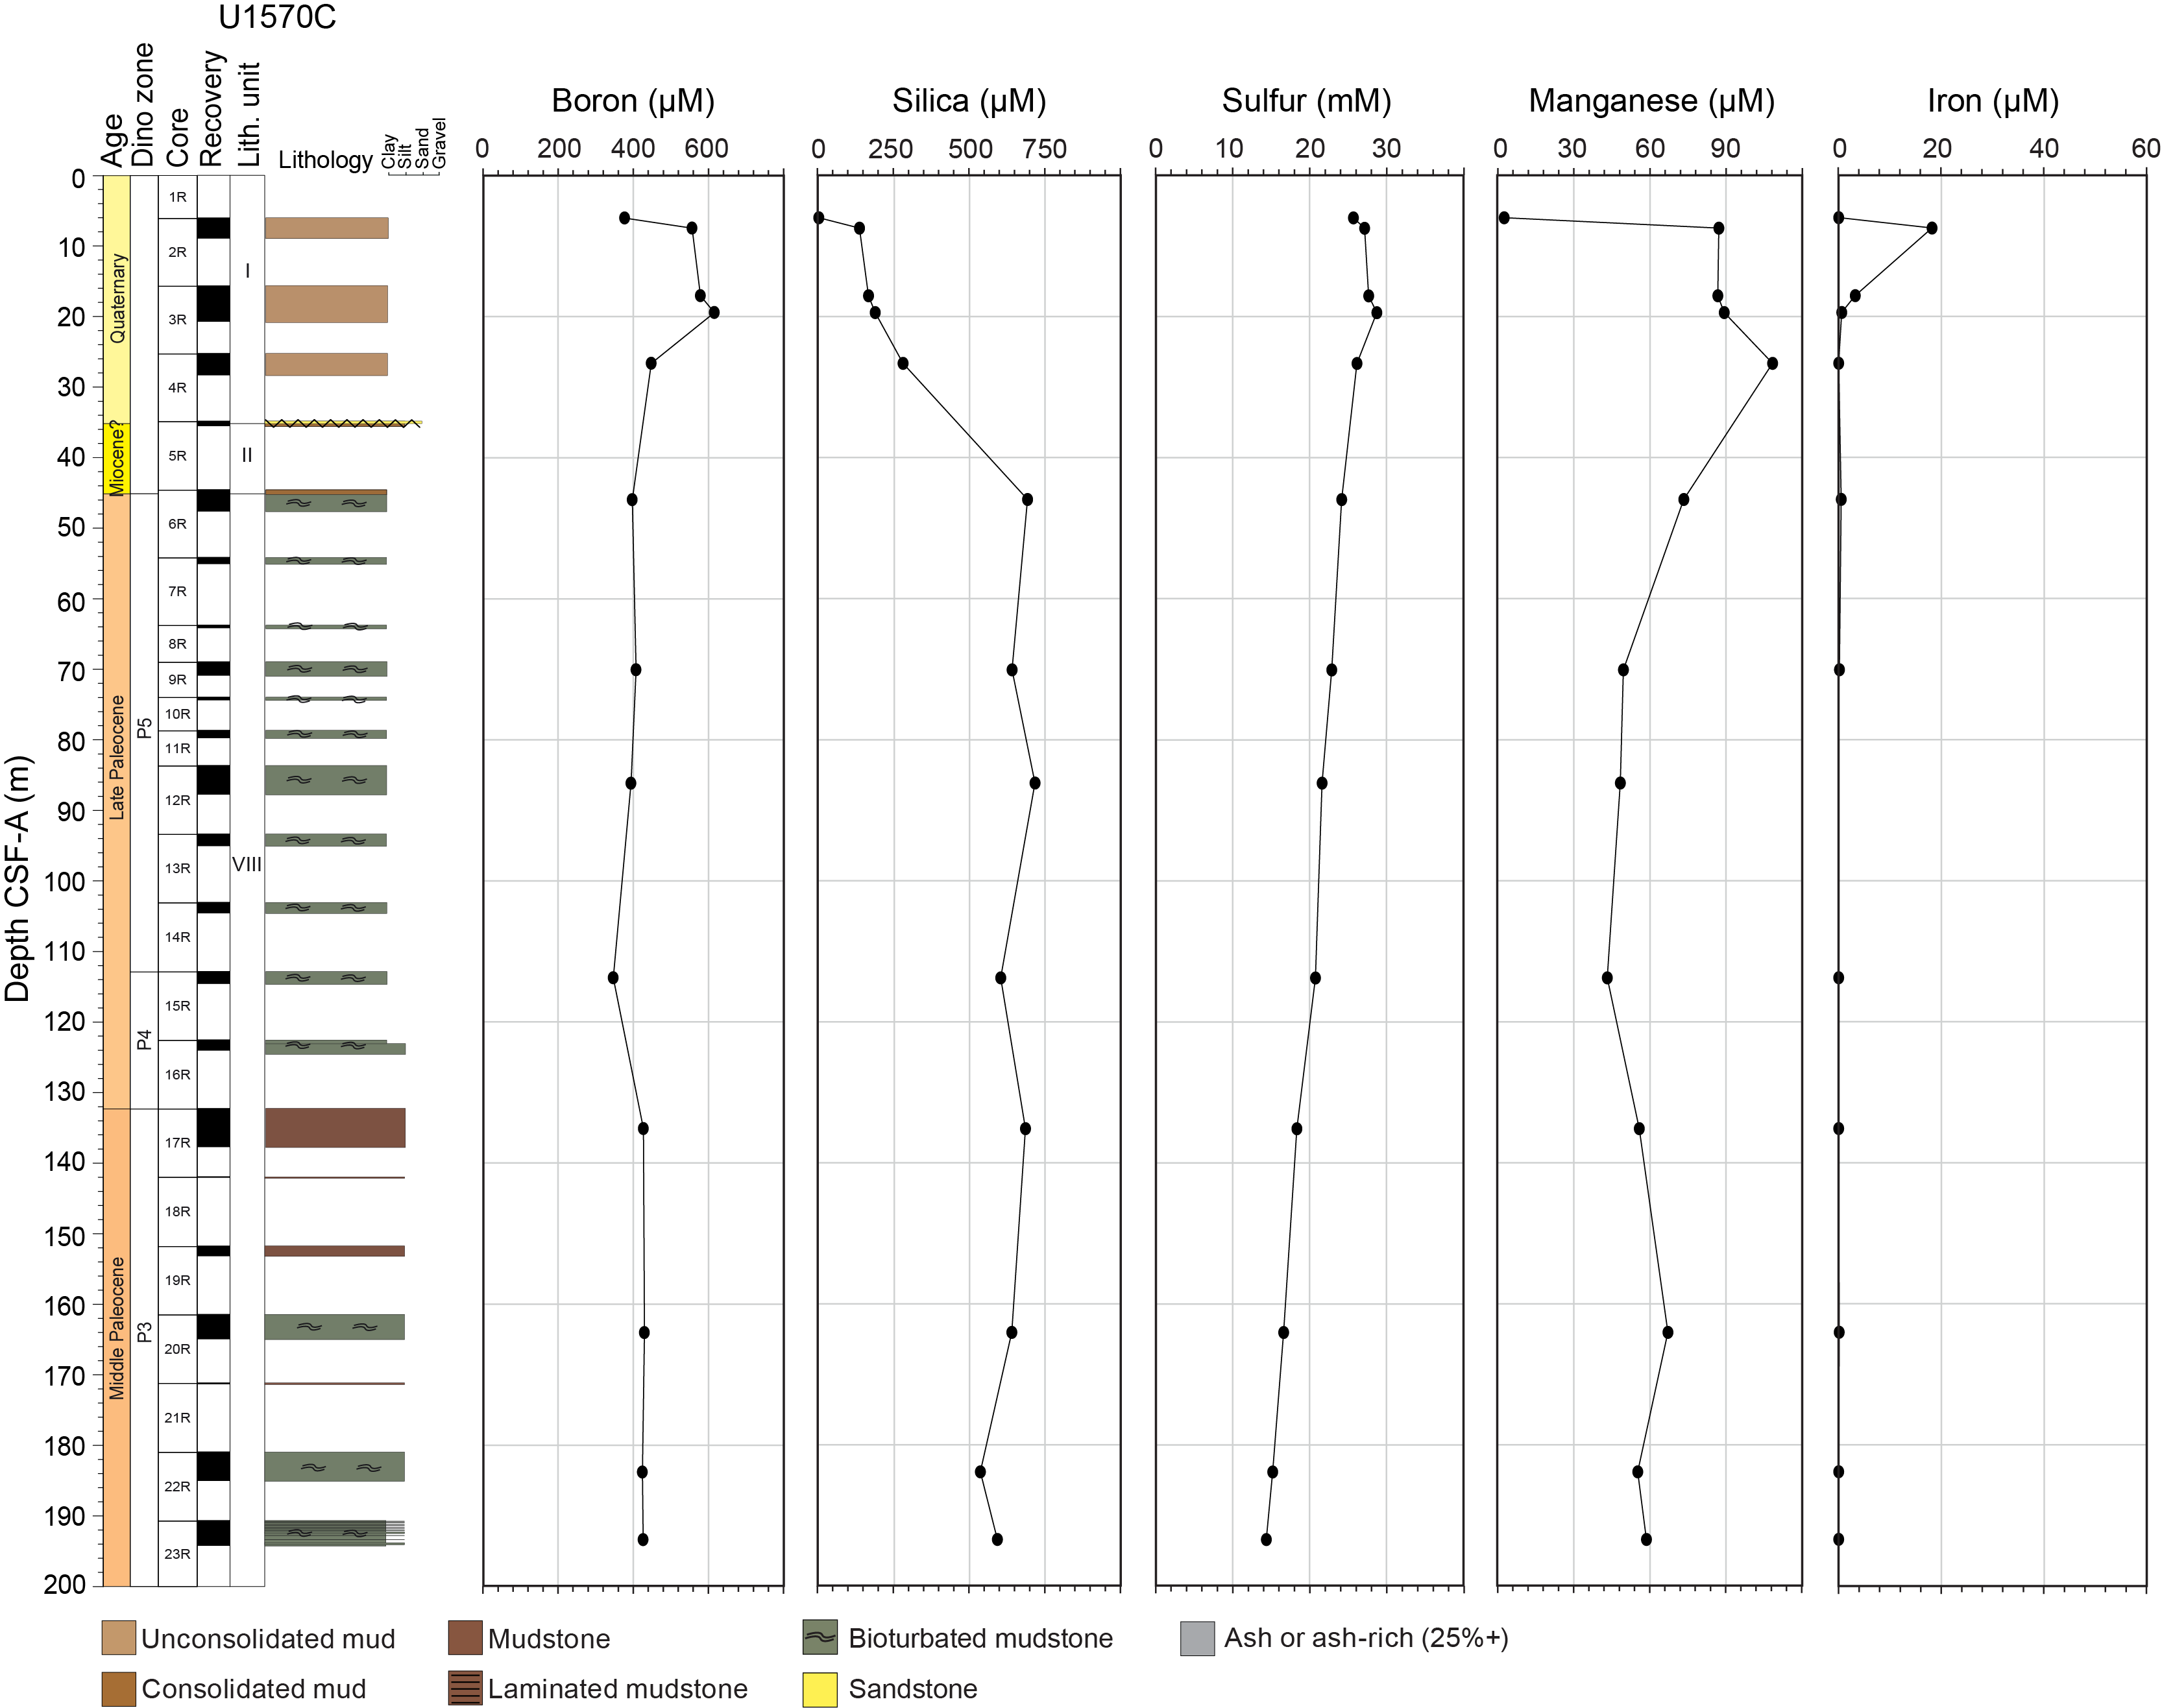
Figure F33. B, Si, S, Mn, and Fe, Hole U1570C.
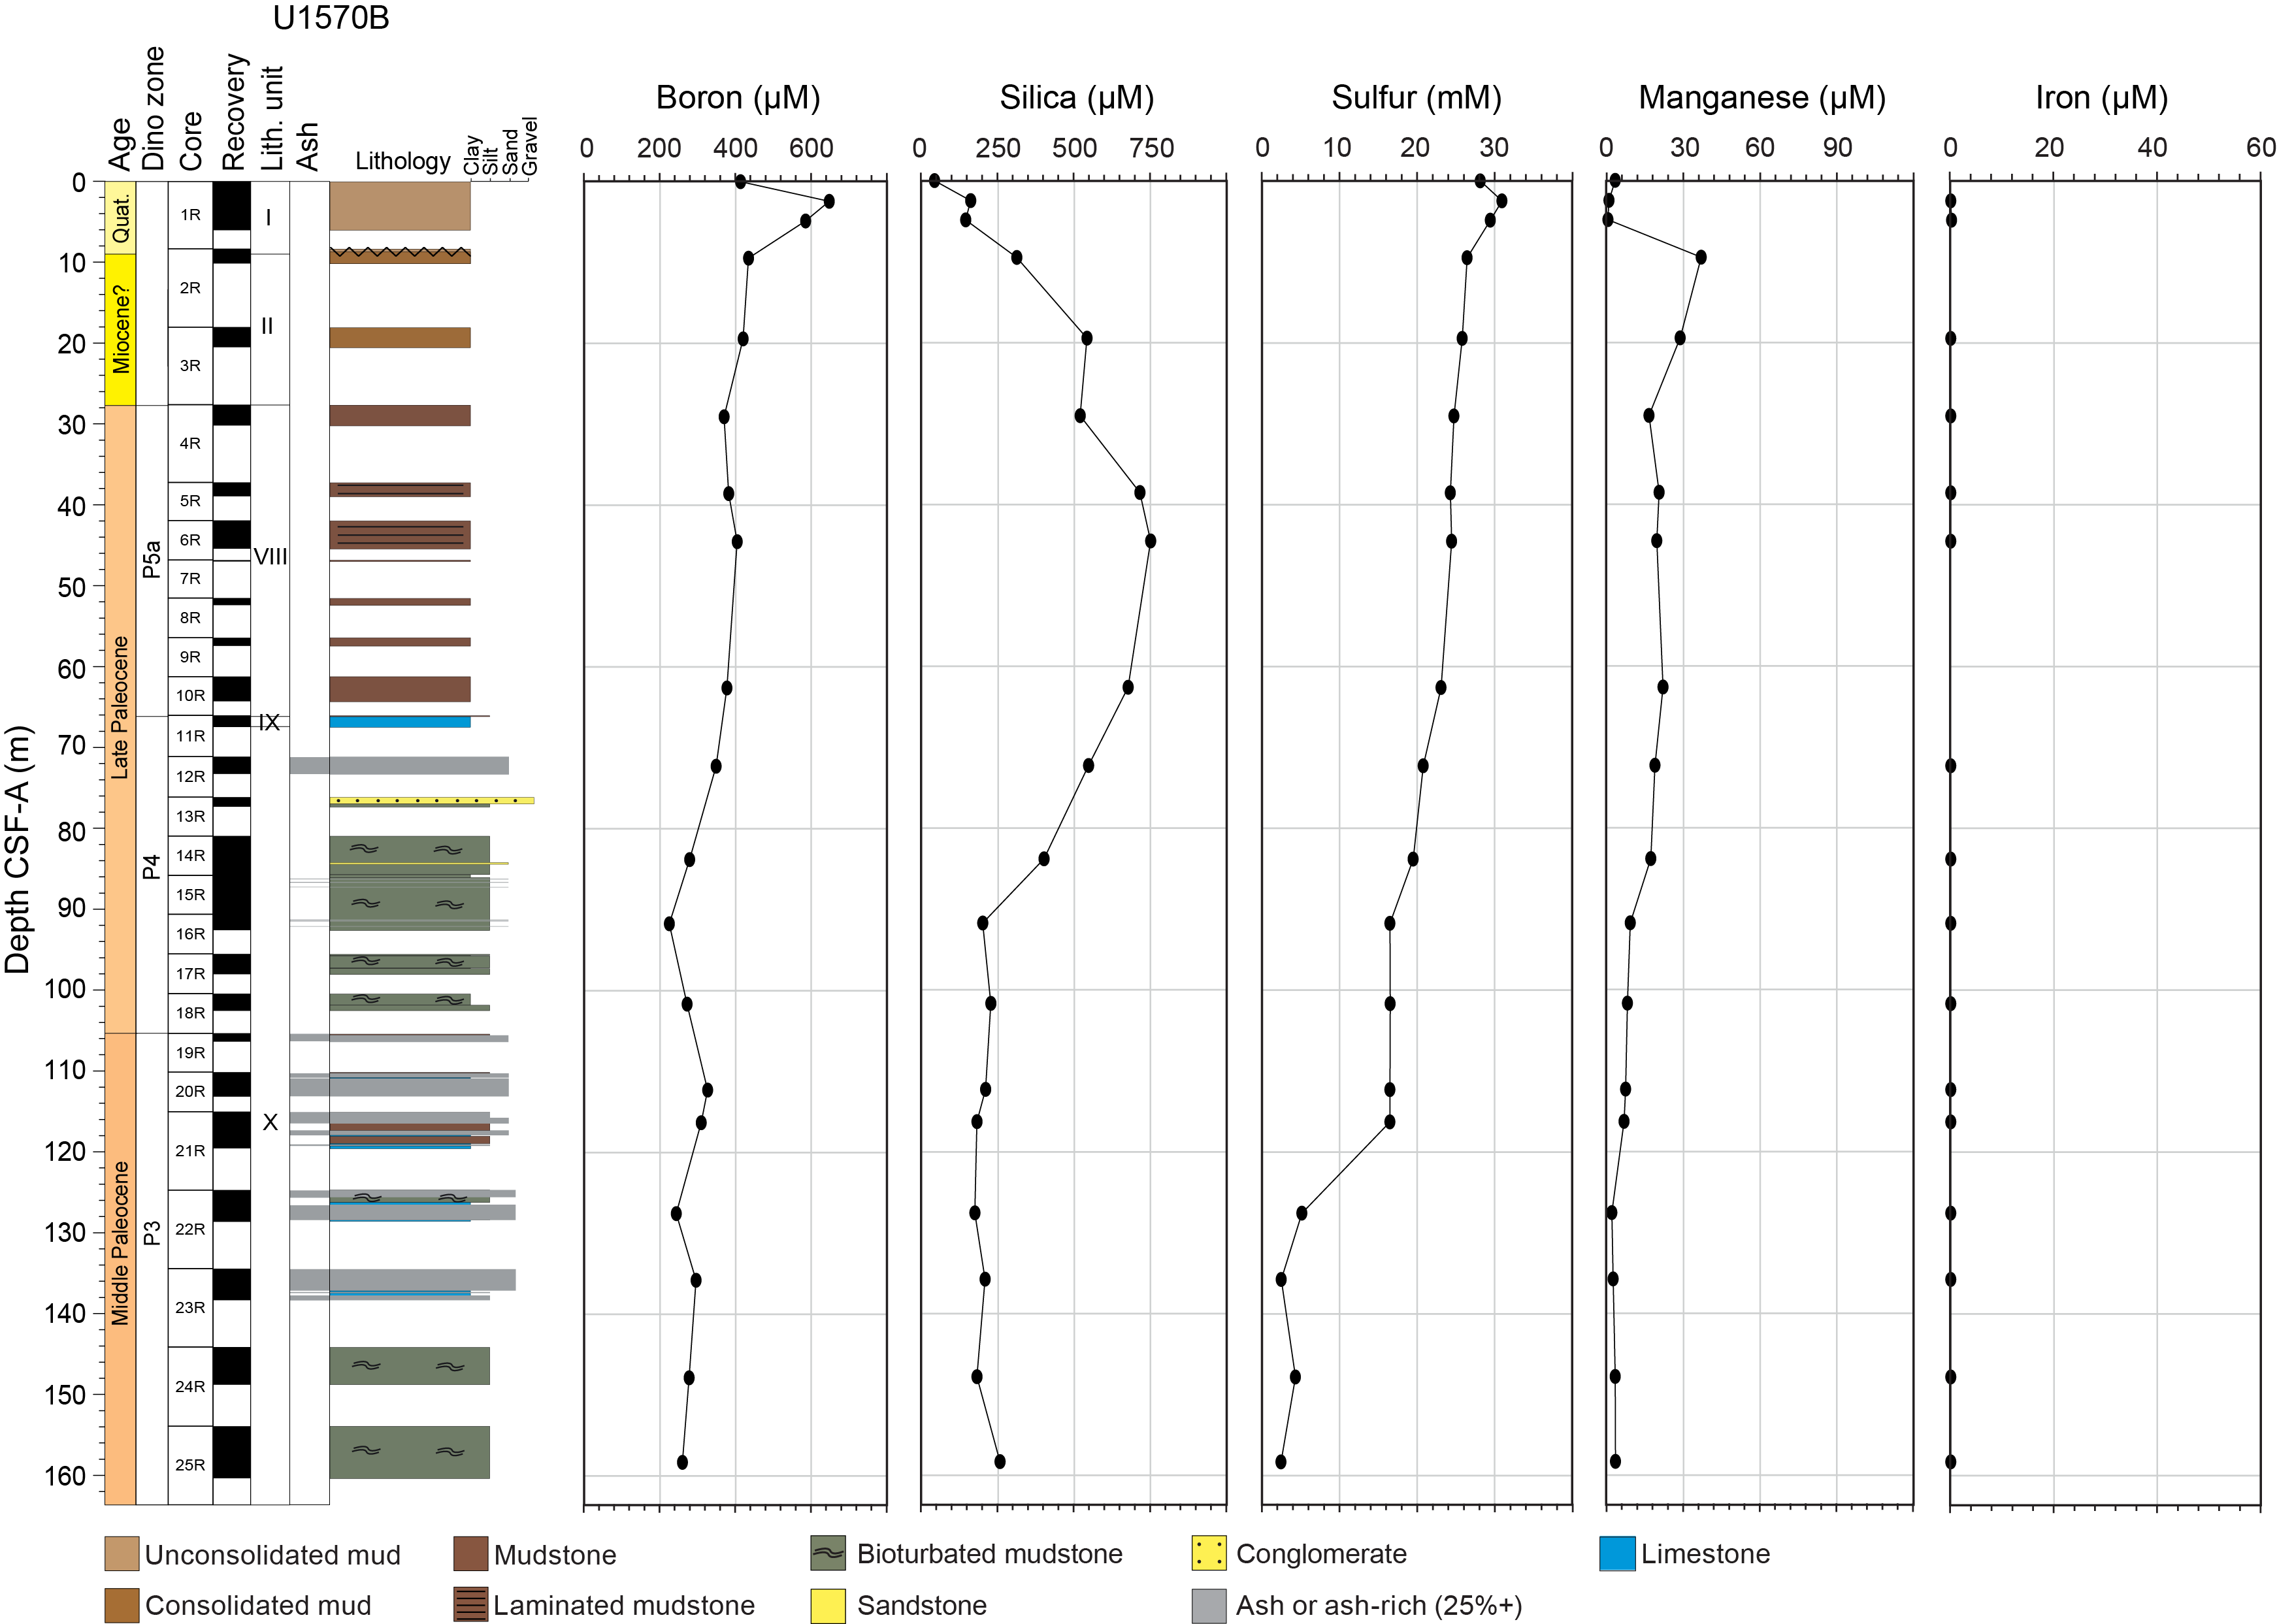
Figure F34. B, Si, S, Mn, and Fe, Hole U1570B.
6.1.3. Deconvolved natural gamma radiation
In Hole U1569A, K content is between 2 and 3.5 wt% in the uppermost 30 m of the hole before a gradual decrease in concentrations to 140 m CSF-A, where values are close to 1.2 wt% (Figure F35). Between 140 and 146 m CSF-A there is an increase in K content corresponding to the shift from Unit II to Unit III; below this point, values average 3 wt%. This is followed by another decrease in K content to a stabilization around 2 wt% at 200 m CSF-A. The remaining 200 m of the core are characterized by variations in K content, and a series of peaks and troughs suggest a variation in lithologies or potentially the signature of the abundant volcanic ash. The U content in Hole U1569A is generally constant, showing values between 1 and 4 ppm for the majority of the hole. Peaks in U concentration (as high as 6 ppm) exist at around 110 and 180 m CSF-A and between 320 and 345 m CSF-A (Figure F35). The Th content of the hole displays a similar trend to that of K, with a gradual decrease to ~140 m CSF-A and a sharp increase in concentration underneath. The bottommost 75 m of the hole are different from the K record with values increasing between 300 and 350 m CSF-A, followed by a peak in concentrations as high as 15 ppm.
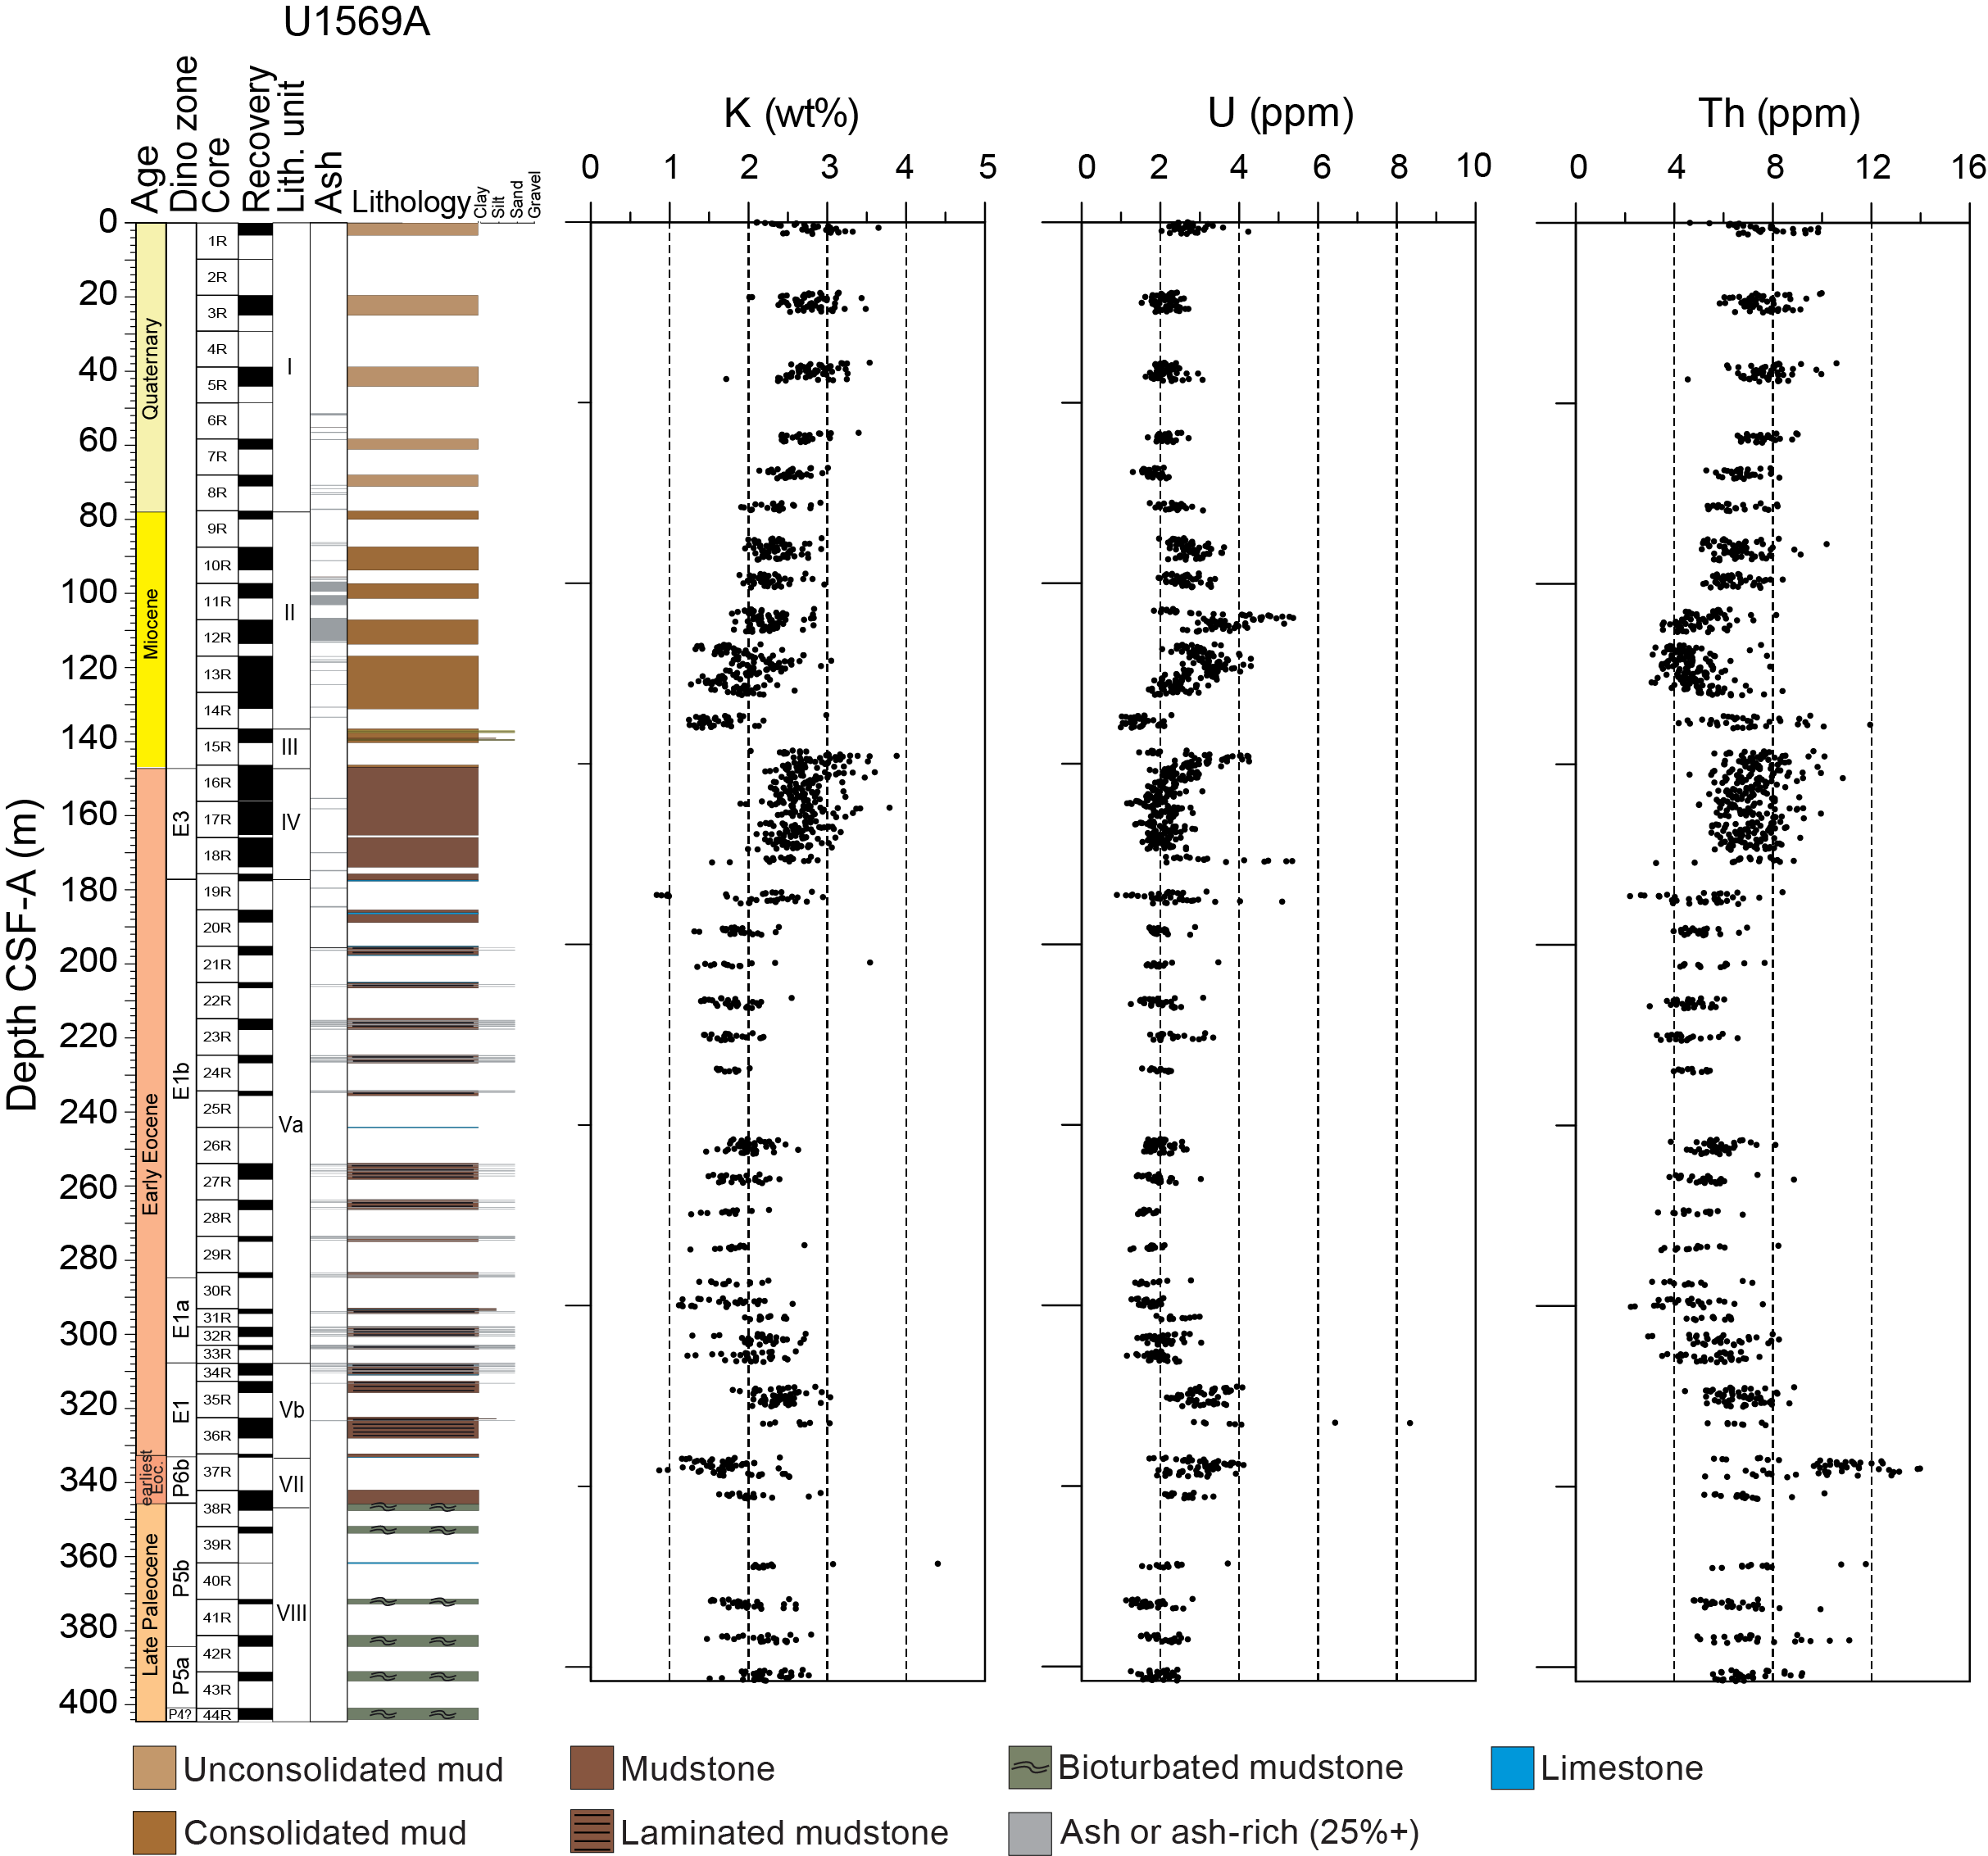
Figure F35. K, U, and Th, Hole U1569A.
In Hole U1570A, K content gradually decreases from around 2.5 wt% at the top of the hole to ~1.8 wt% at 110 m CSF-A (Figure F36). Other than a peak in K content (as much as 4 wt%) in the dacitic unit (Core 26R), values are between 2 and 3 wt% for the remainder of the strata. In Hole U1570B, K also decreases from 2.5 wt% at the top of the hole to around 2 wt% at 79 m CSF-A before an interval of higher values (2.5–3.5 wt%) to 120 m CSF-A. Hole U1570C shows the same trends as Hole U1570A but without recovery of the dacitic unit. In Hole U1570D, K content ranges 3–4 wt% between 100 and 135 m CSF-A and remains between 1.5 and 3 wt% for the rest of the hole. Most U concentrations range 1–3 ppm in all holes. Higher U content is observed at 35–68 and 145–185 m CSF-A in Hole U1570A and 100–135 m CSF-A in Hole U1570D. The Th content in all holes mirrors that of the K content, with the dacite clearly present in Hole U1570A and Th enrichment (values above 8 ppm) at 100–135 m CSF-A in Hole U1570D.
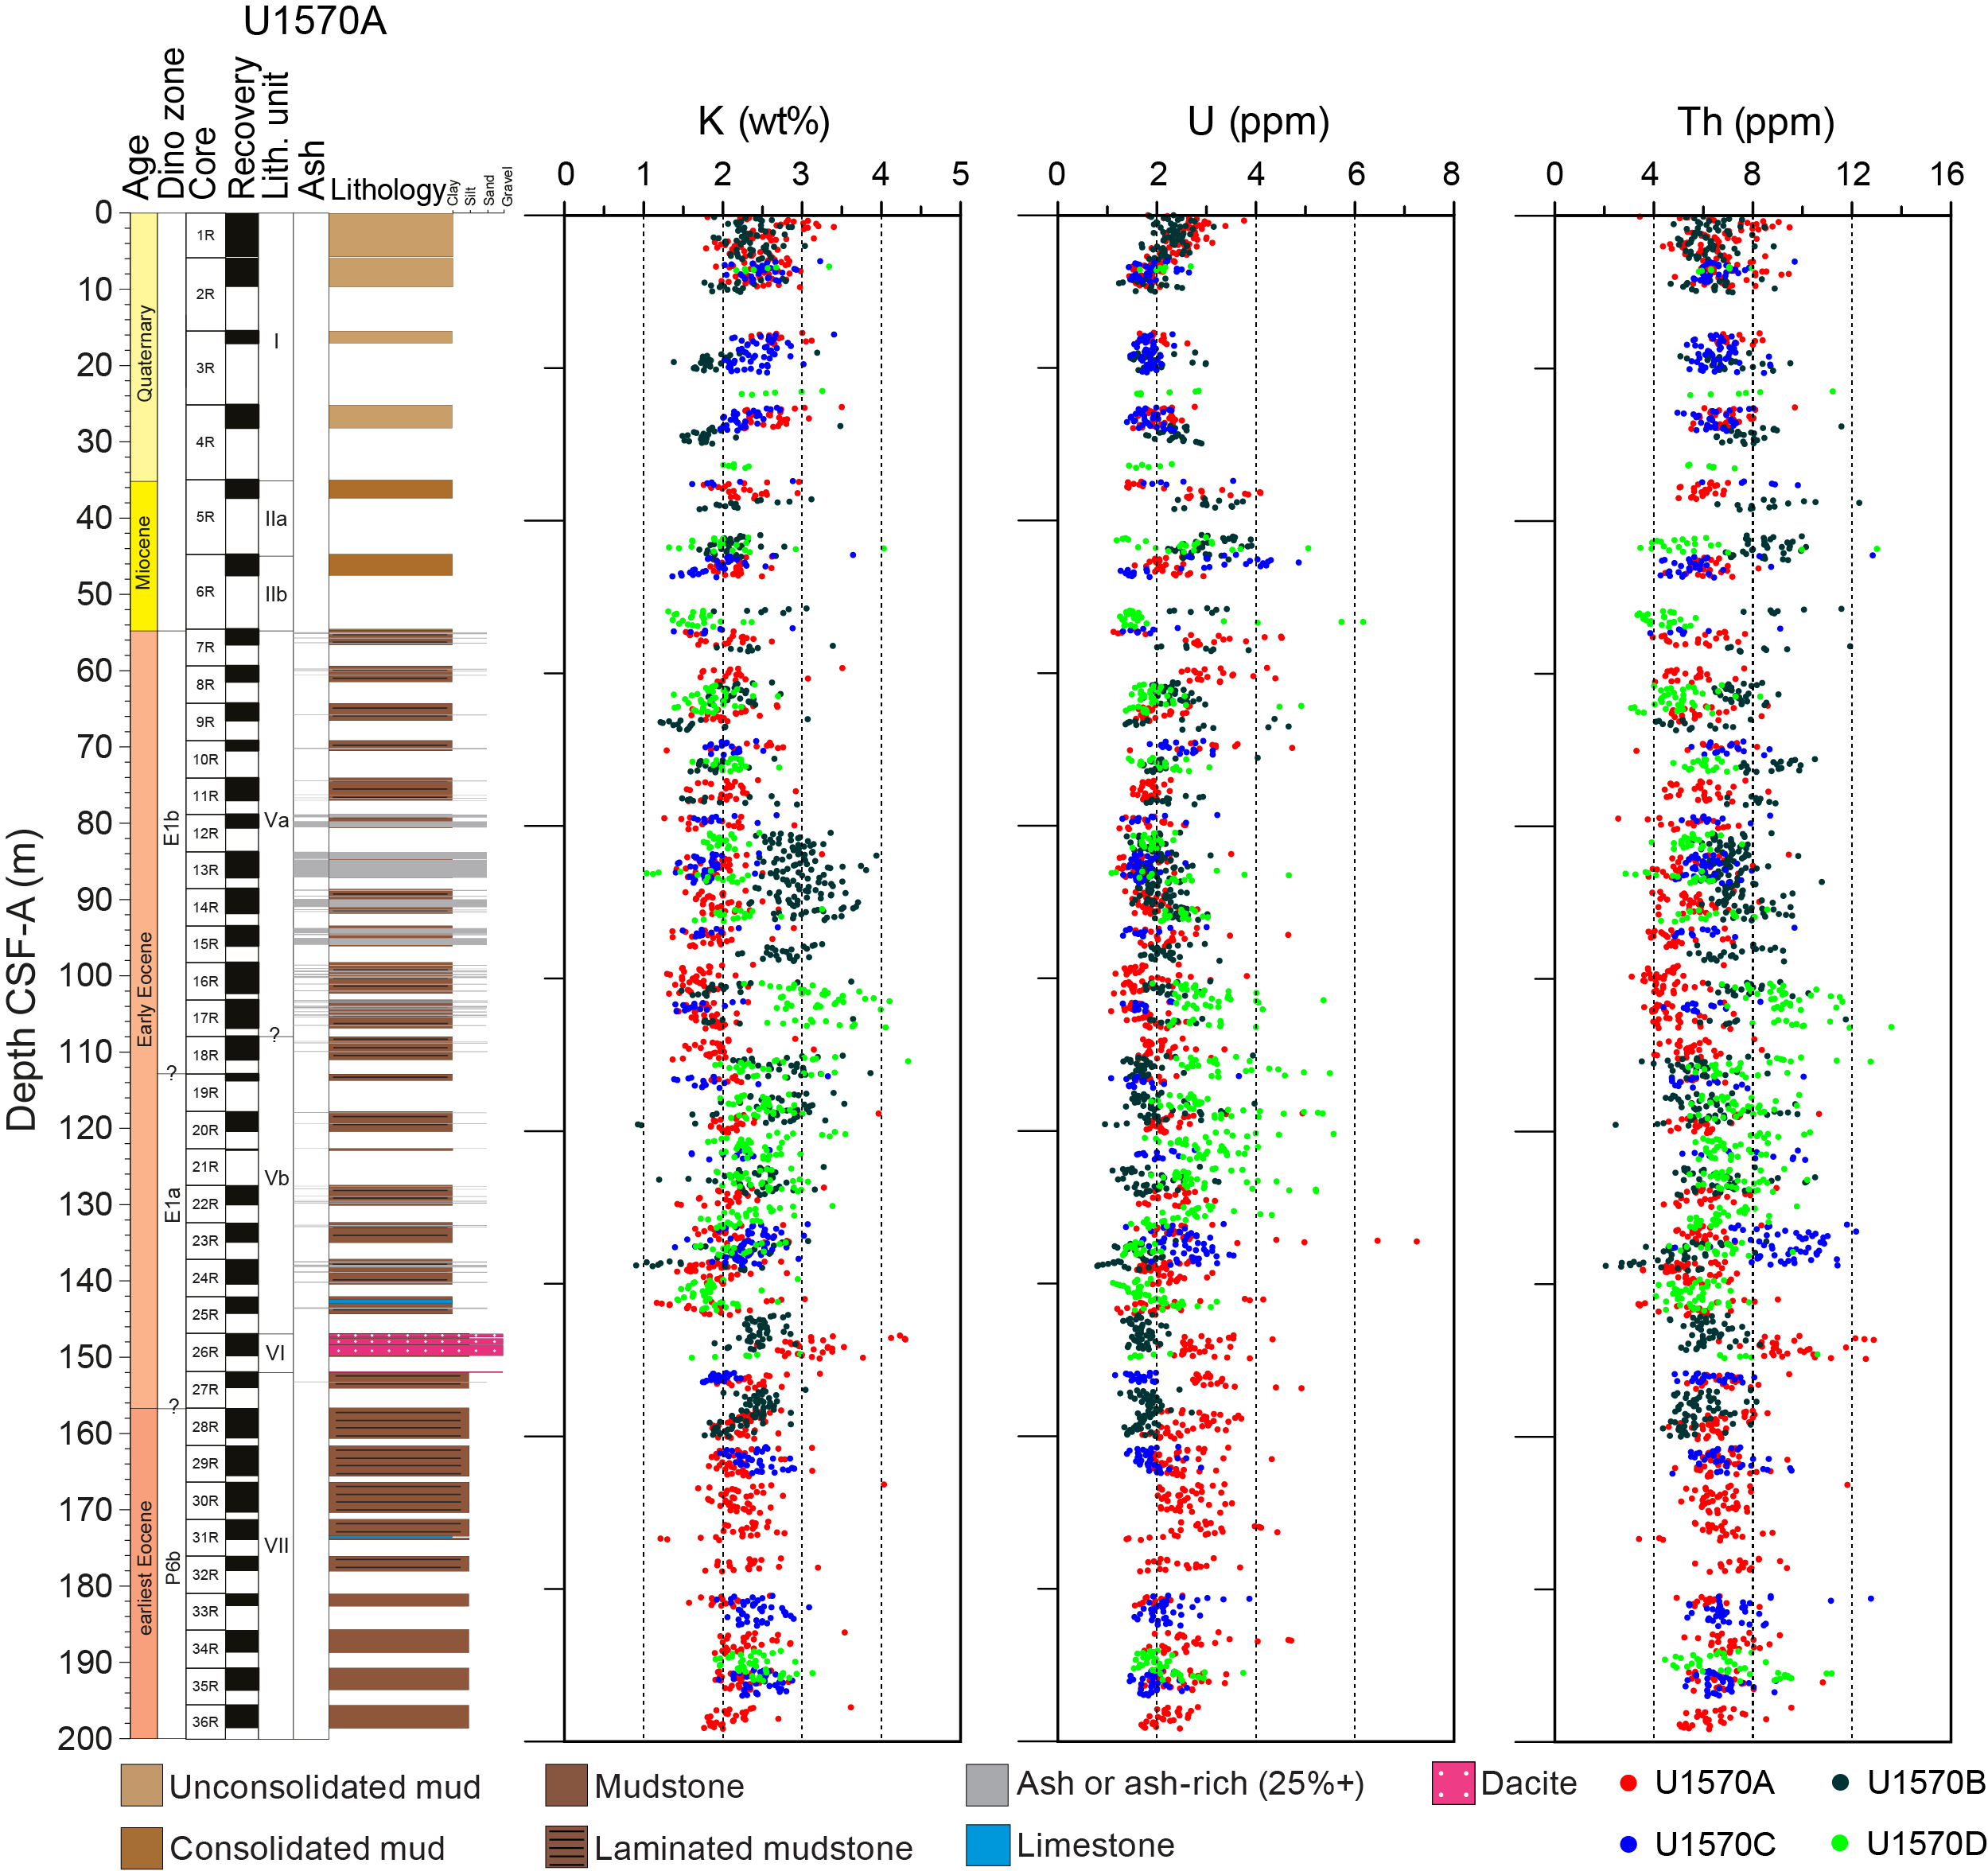
Figure F36. K, U, and Th, Holes U1570A–U1570D.
6.1.4. X-ray diffraction
XRD analysis indicates the dominance of quartz in Units I–III in Hole U1569A. Muscovite and other types of clay minerals such as sepiolite, montmorillonite, and palygorskite are also present in these units. In Cores 32R and 34R, clinoptilolite is the dominant clay mineral component. Clinoptilolite is the most common form of zeolite and forms from the alteration of volcanic ash; therefore, its presence indicates ash weathering and clay authigenesis. In the lowermost cores (Core 41R and below), a hump is present in all diffractograms, suggesting the presence of an amorphous component.
At Site U1570, quartz remains the primary component of the recovered sedimentary units, but other minerals such as muscovites, albite, and anorthite are also present. In some cores (e.g., 396-U1570A-7R), halite is present. Pyrite is also common in some of the cores. Clay minerals are ubiquitous, with montmorillonite and illite the most common. The direct mineralogic imprint of the regular volcanic ash deposition is also present, and many of the analyzed samples contain diopside, pyroxene, labradorite, and, more occasionally, spinel.
6.1.5. Hard rock geochemistry
In Hole U1570D, three samples (14R-1, 7–8 cm; 14R-2, 46–47 cm; and 15R-1, 45–47 cm) were taken to investigate the composition of the igneous rock that compose Unit VI. A standard plot of total alkalis (Na2O + K2O) versus SiO2 (Le Maitre, 1989) shows one sample of dacitic composition with a normalized SiO2 concentration of ~65 wt% (Figure F37; Table T18). The two lower samples plot in the rhyolite composition field with loss on ignition (LOI)-normalized SiO2 concentrations of 72–74 wt%. Using the molecular Na + K/Al versus the alumina saturation index (Frost et al., 2001), the three samples plot in the peraluminous field (Figure F37). The presence of garnet crystals could potentially account for the excess Al, which indicates significant incorporation of sedimentary rocks into the magma.
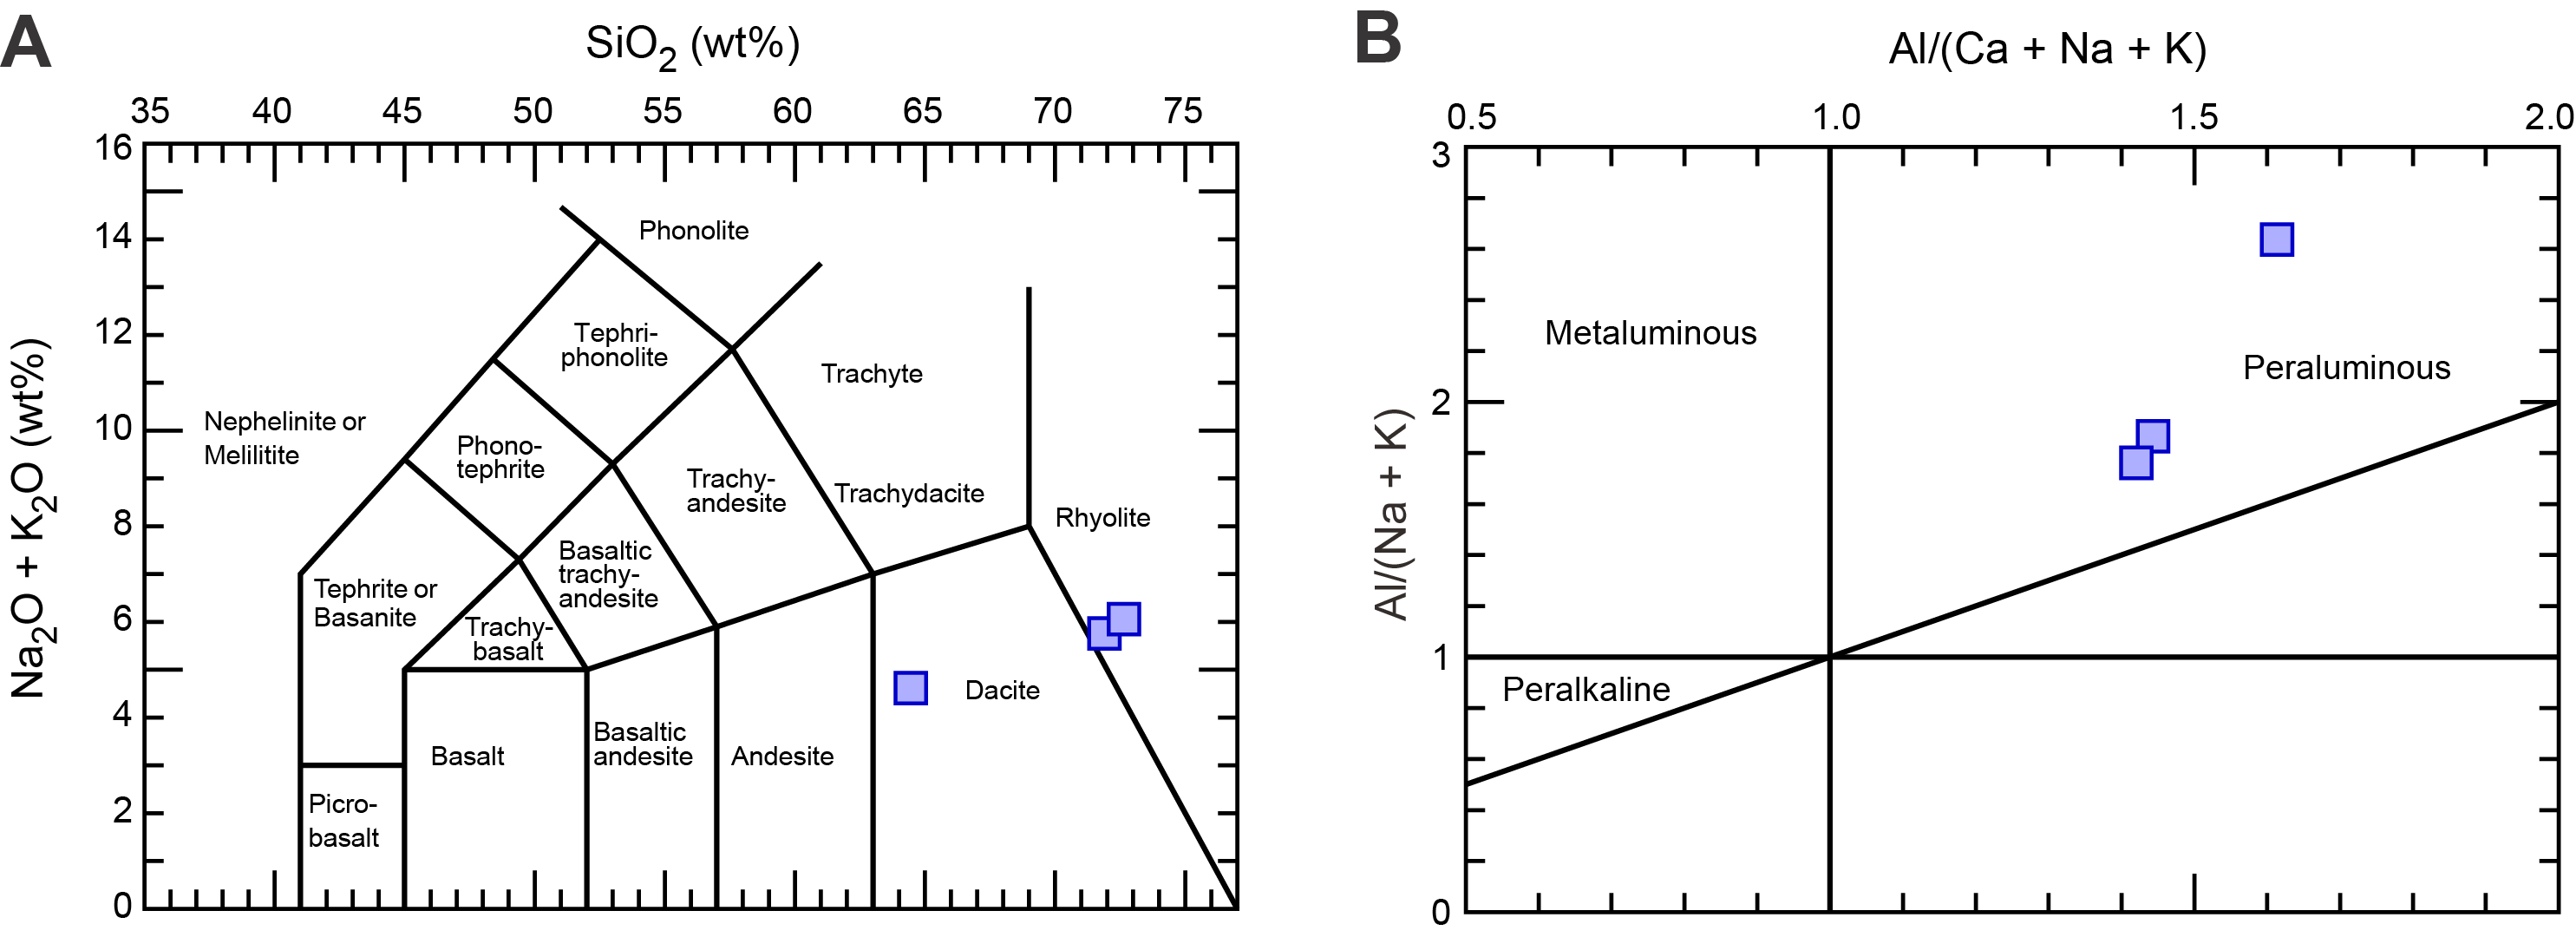
Figure F37. Igneous rock composition, Hole U1570D.
pXRF analysis was conducted on 41 discrete samples: 24 from Hole U1569A and 17 from Hole U1570A. Each sample was run in triplicate as a minimum, so the total number of analyses was 131 individual measurements (Table T19). The analyses were conducted on specific intervals such as ash layers, laminated sediments, and the dacitic igneous layer present in Holes U1570A and U1570D (Unit VI). Results are presented in Lithostratigraphy.
6.2. Organic geochemistry
6.2.1. Headspace gas
Unlike the four previous sites, methane levels at Site U1569A are above 1 ppm for considerable fractions of the recovered cores. The transition between Units V and VI at 300 m CSF-A marks a boundary in methane values. Above this depth, concentrations are below 2 ppmv, but below it, CH4 rises to a maximum of 4900 ppmv. These values, although not dangerous to drilling operations, indicate a source of methane from below, likely to be either from the maturation of hydrocarbons or from hydrothermal venting. Ethane content covaries with methane (highest concentrations = 10 ppmv), and all other measured gases are below the detection limit for the entirety of the hole. All measurements made in Hole U1570A indicated that methane levels are below 2 ppmv; therefore, no further analyses were carried out in the other holes at Site U1570.
6.2.2. Carbon, nitrogen, and sulfur
As at most Expedition 396 sites, calcium carbonate (CaCO3) concentrations are elevated in the uppermost sediments because of biogenic carbonate deposition. Calcite contents are ~10 wt% for the majority of the upper 60 m Unit I) in Hole U1569A (Figure F38; Table T20). The same is true for all four holes at Site U1570, which vary in depth depending on the thickness of Unit I at each locality (Table T21). Below the Pleistocene–Holocene sediments, there are two distinct intervals in Hole U1569A (between 260 and 300 m CSF-A and below 400 m CSF-A) with elevated calcite contents (Figure F38). The lowermost sample at 402 m CSF-A has 75 wt% CaCO3. TOC is below 1 wt% for the majority of the hole, with one notable exception at 176 m CSF-A where TOC reaches 3.5 wt%. Total nitrogen (TN) content covaries with (TOC, remaining below 0.1 wt% for most of the hole and peaking at 0.2 wt% at the same interval as the high TOC (Figure F38). Sulfur content is 0 wt% to 80 m CSF-A and shows three main peaks in concentration below this. The first peak at 95 m CSF-A is relatively small, with a highest concentration of 1.6 wt%. The second peak, which reaches as high as 6 wt%, occurs between 170 and 215 m CSF-A and the transition from Unit IV to Subunit Va. The final and largest peak reaches nearly 8 wt% and occurs between 300 and 360 m CSF-A (Unit VI). In these sections, it appears pyrite precipitation is often the driver of these high S contents (see Lithostratigraphy).
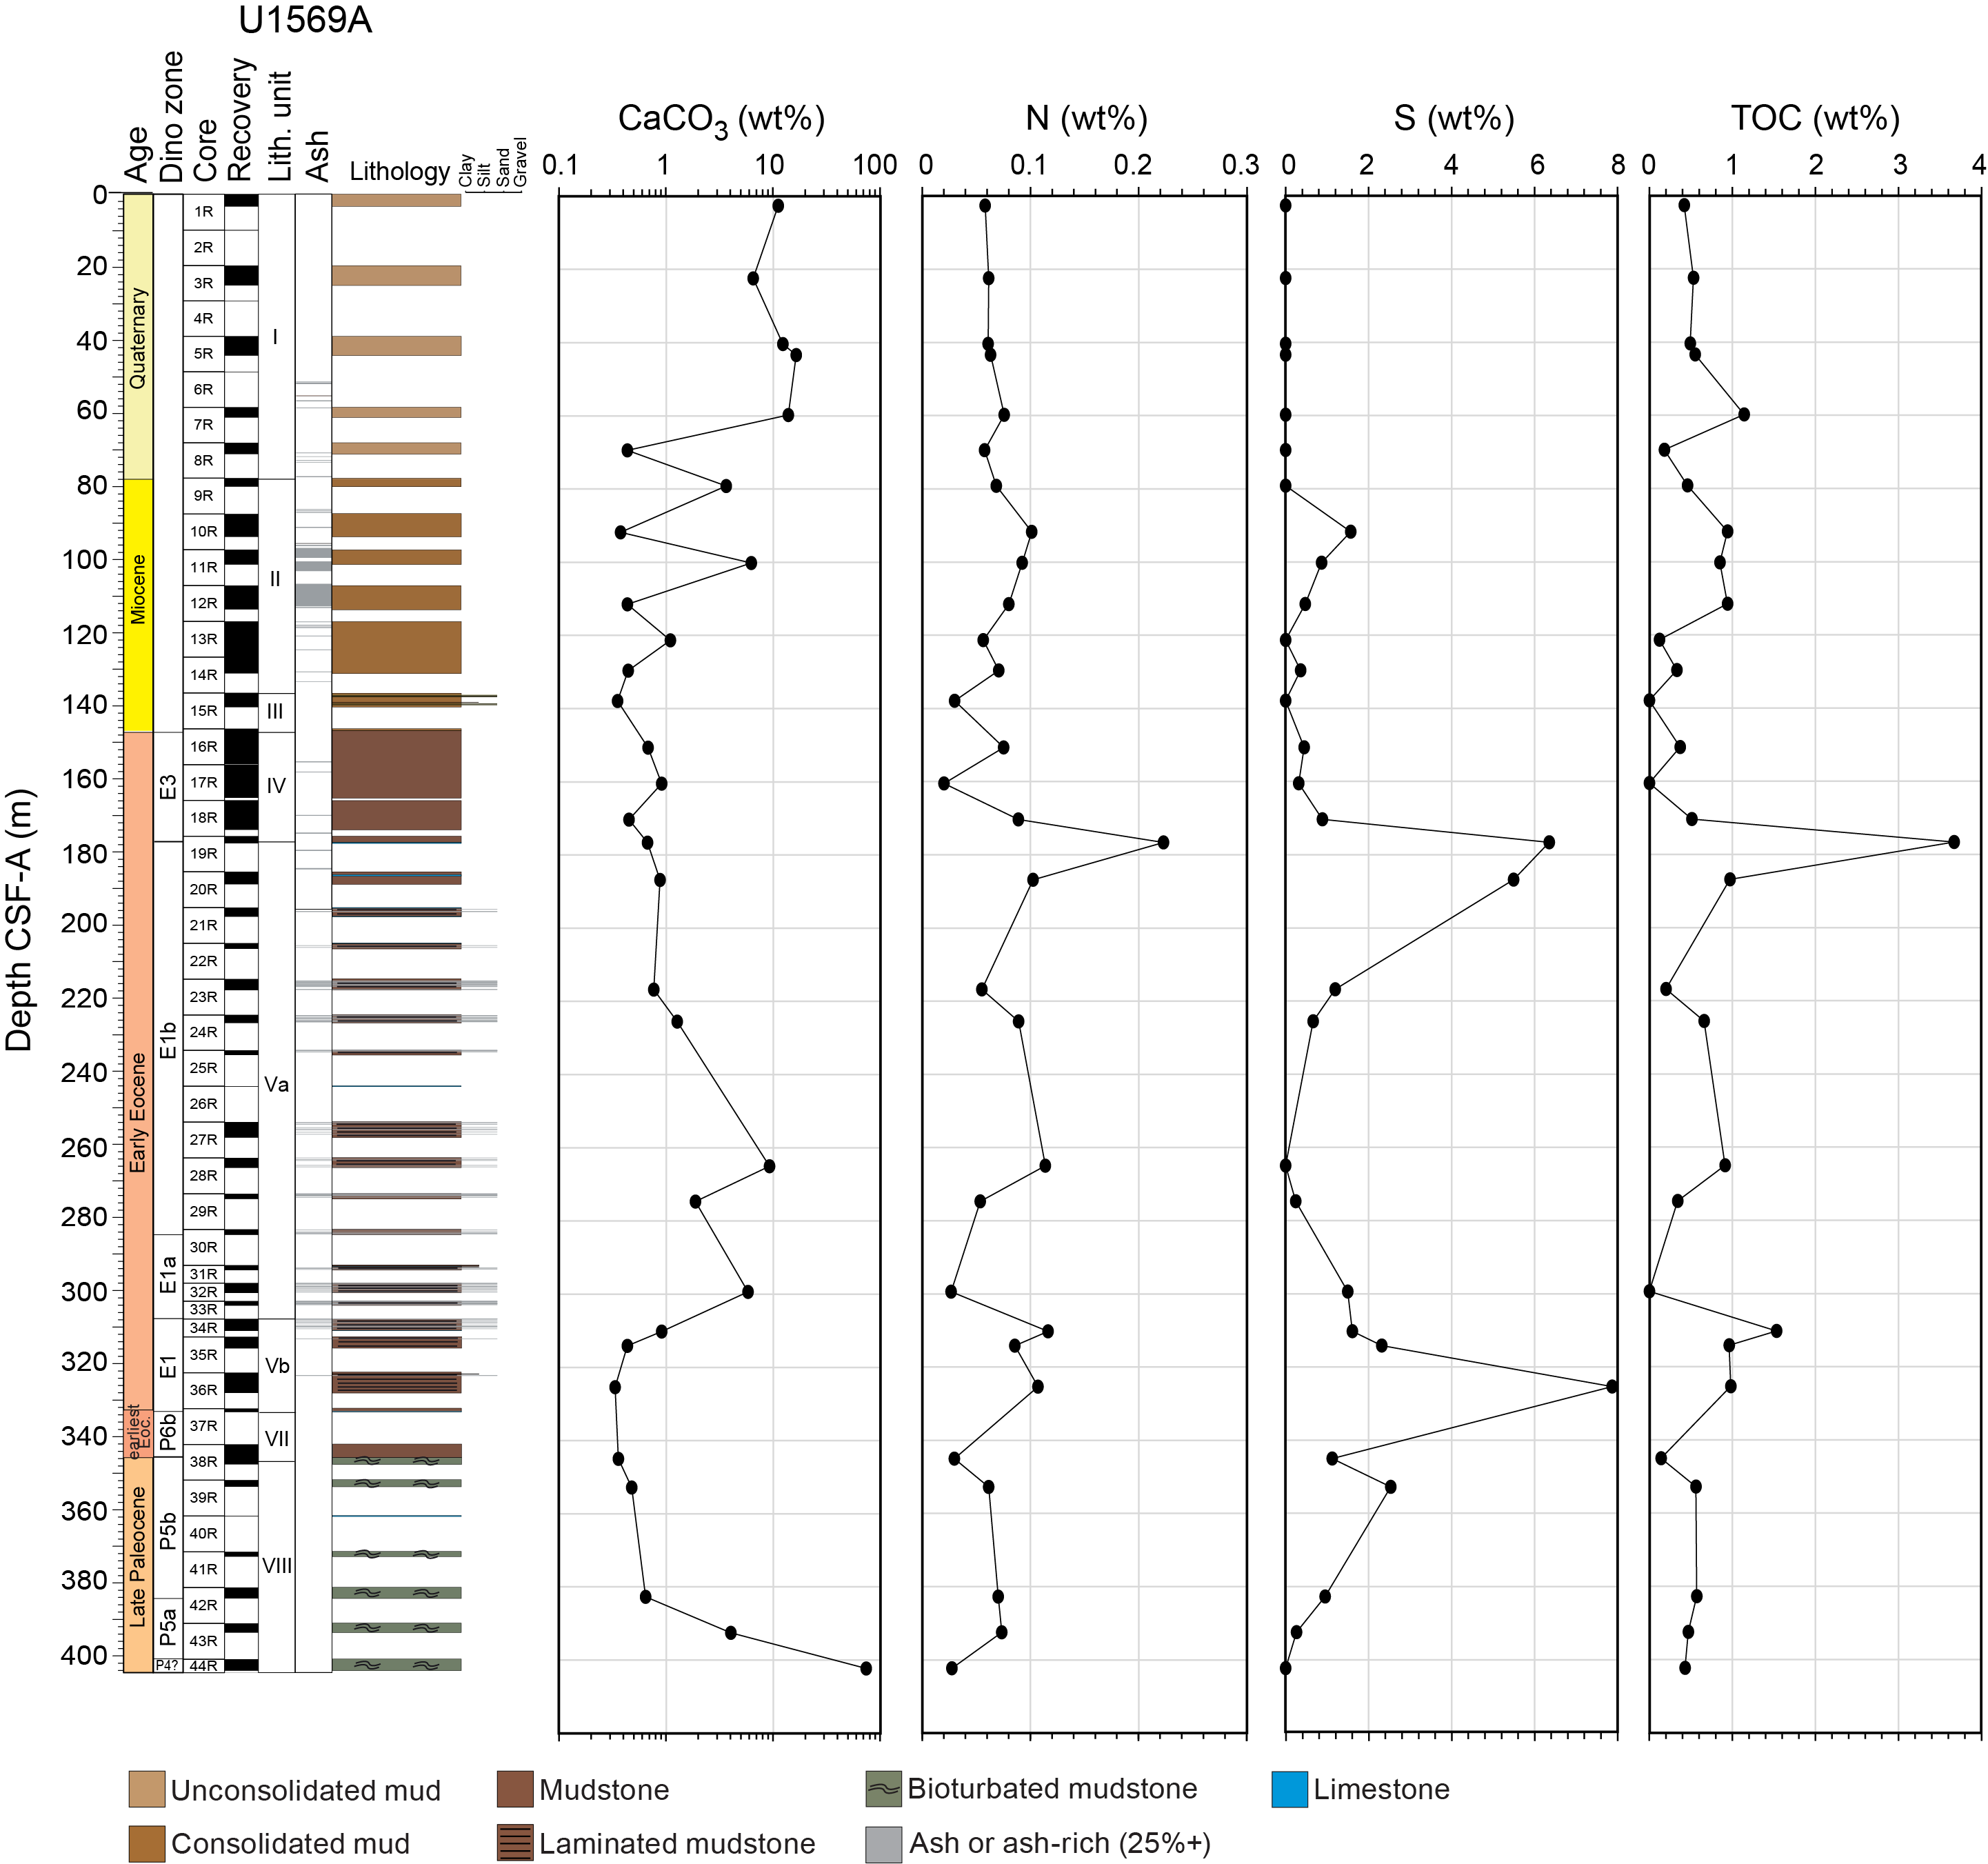
Figure F38. Carbon, nitrogen, and sulfur, Hole U1569A.
At Site U1570, CaCO3 content is high (above 30 wt% for some intervals) in the upper parts of all holes (Figures F39, F40, F41, F42). In Holes U1570B–U1570D, the section of high carbonate content ends at 25 m CSF-A. Below this, there is no CaCO3 to 50 m CSF-A. In Hole U1570A, the high carbonate of the upper layers persists to 50 m CSF-A. For all holes, the interval between 50 and 135 m CSF-A is characterized by fluctuating levels of CaCO3. This is generally between 1 and 5 wt%, but in one layer in Hole U1570B (67 m CSF-A) CaCO3 reaches 55 wt%. Below this depth, carbonate content continues to vary, but it is mostly low in Holes U1570A, U1570B, and U1570D. In Hole U1570C, however, there is an increasing trend between 100 and 180 m CSF-A, and carbonate reaches more than 10 wt% at the base of this hole (Figure F41). Apart from the biogenic carbonate recovered from the uppermost 50 m of the holes, the remainder is considered to be authigenic because of the lack of visible tests or shell fragments.
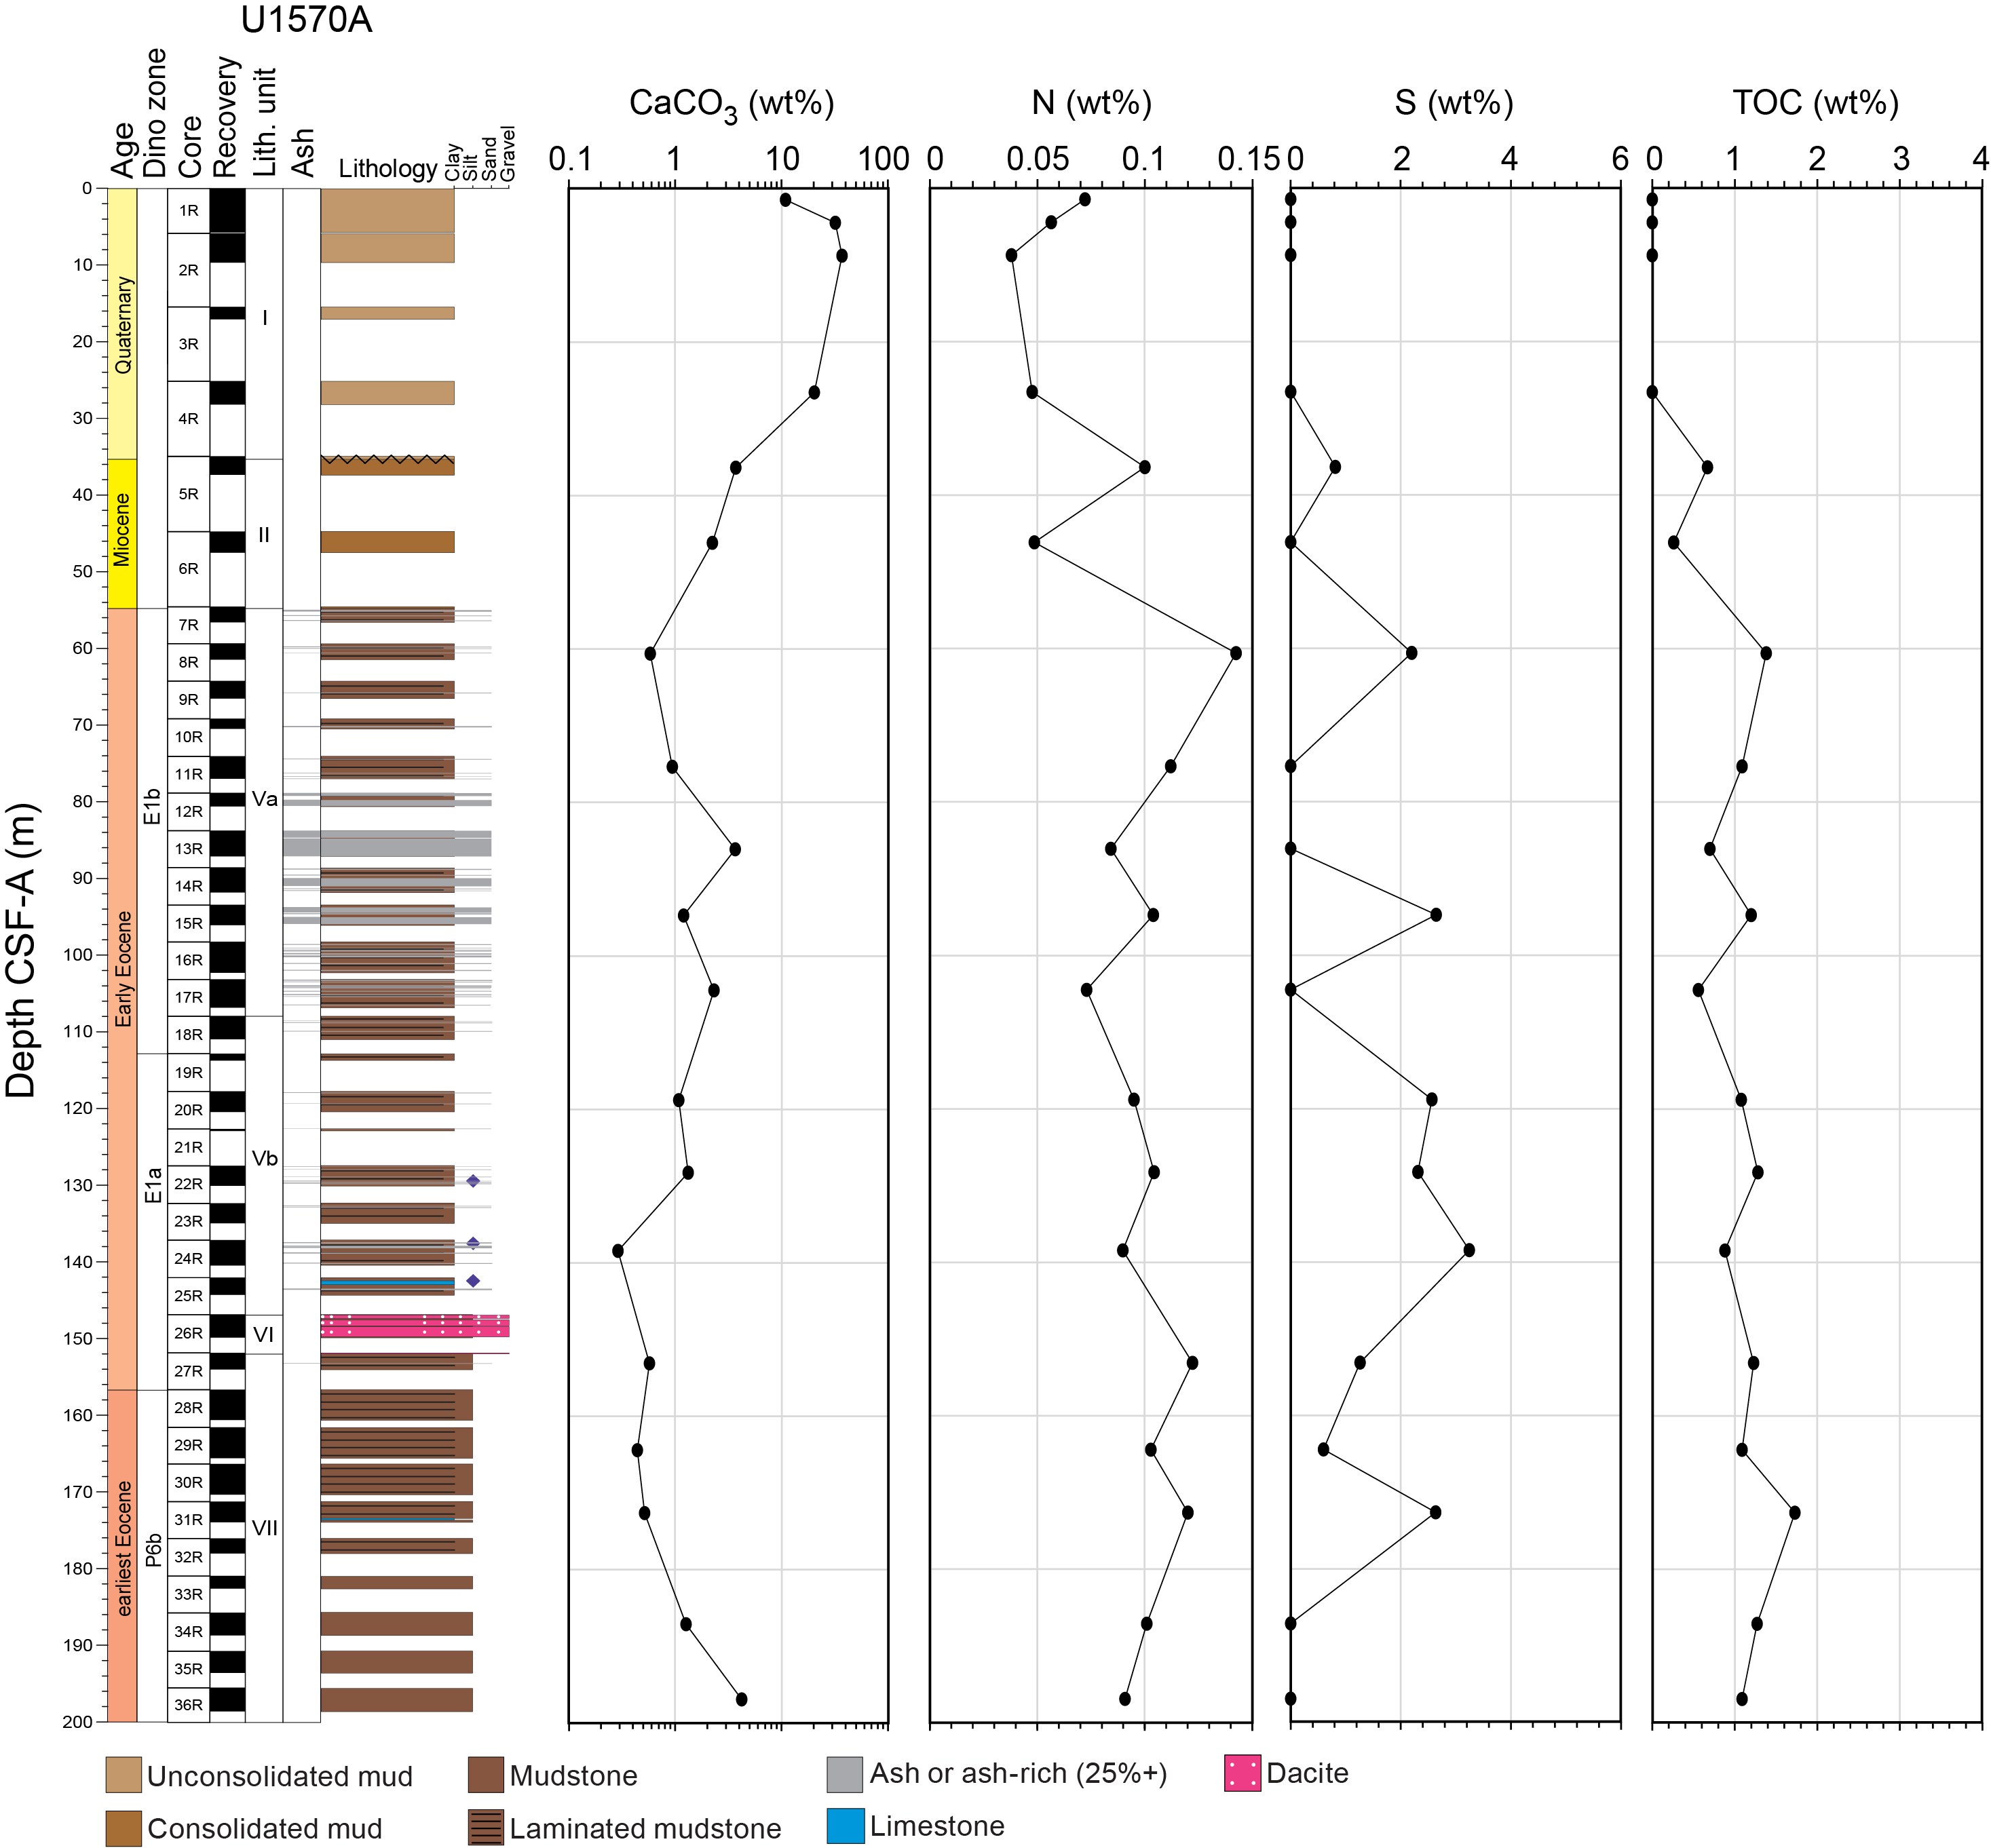
Figure F39. Carbon, nitrogen, and sulfur, Hole U1570A.
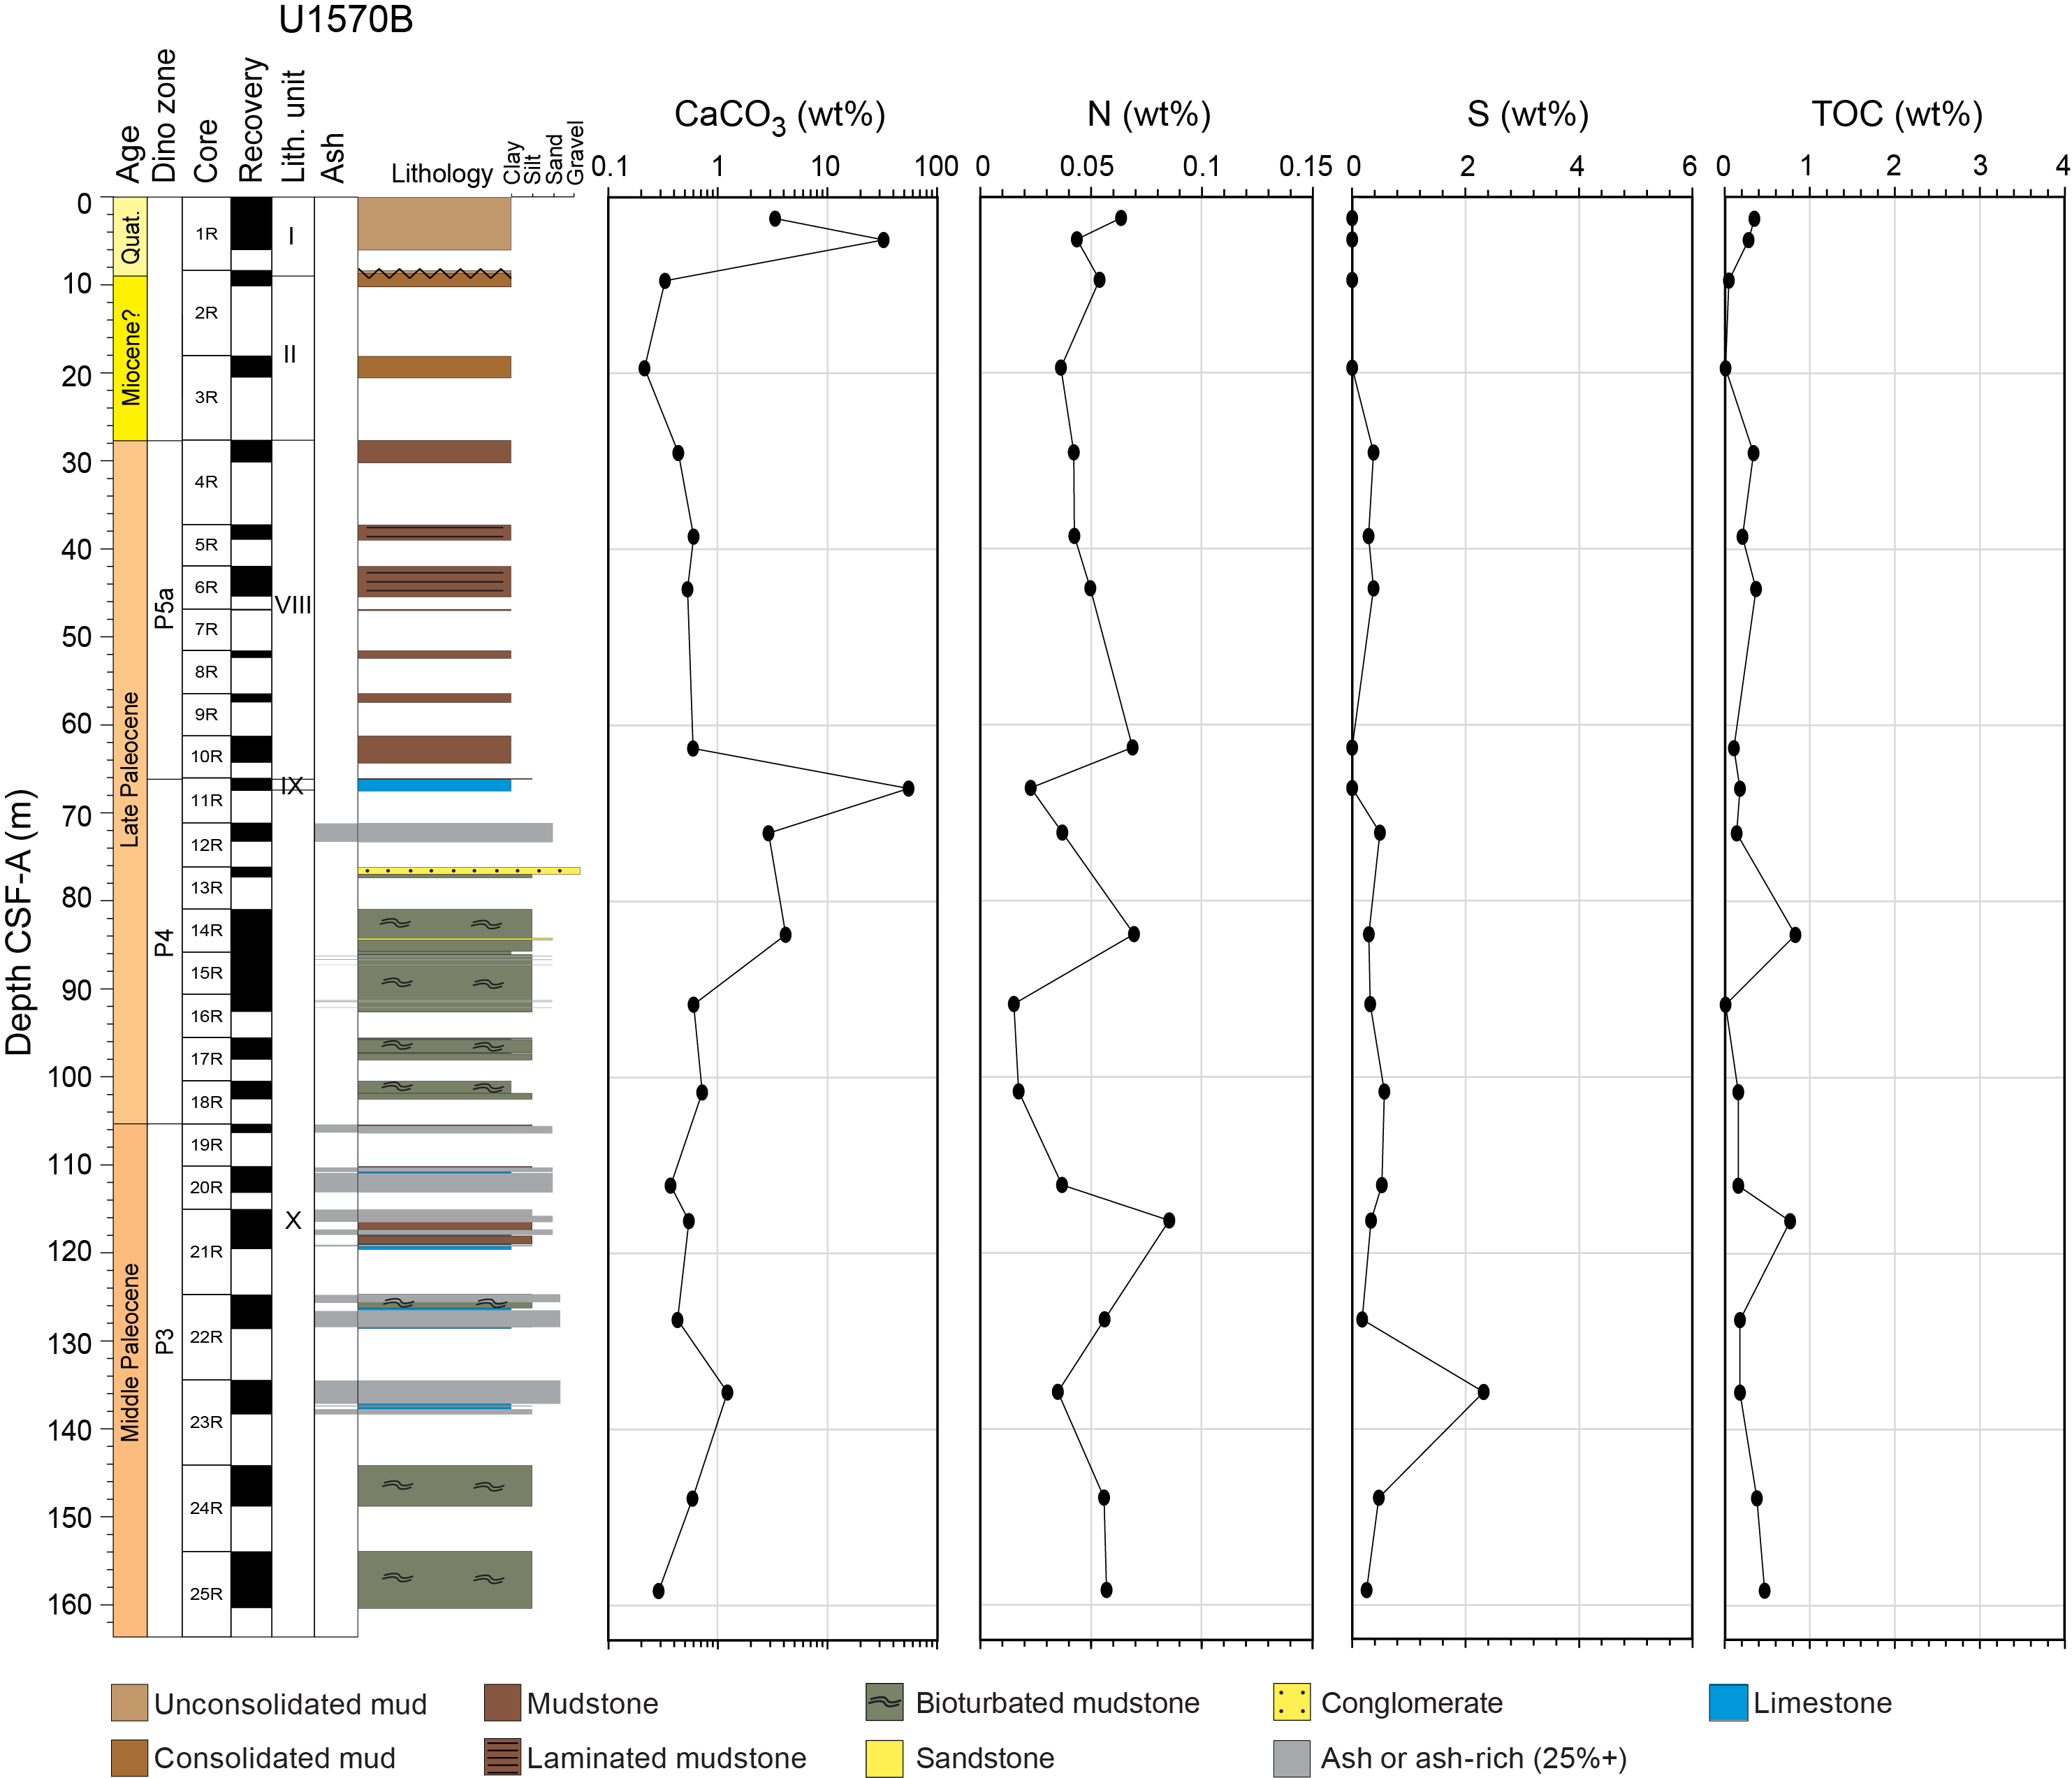
Figure F40. Carbon, nitrogen, and sulfur, Hole U1570B.
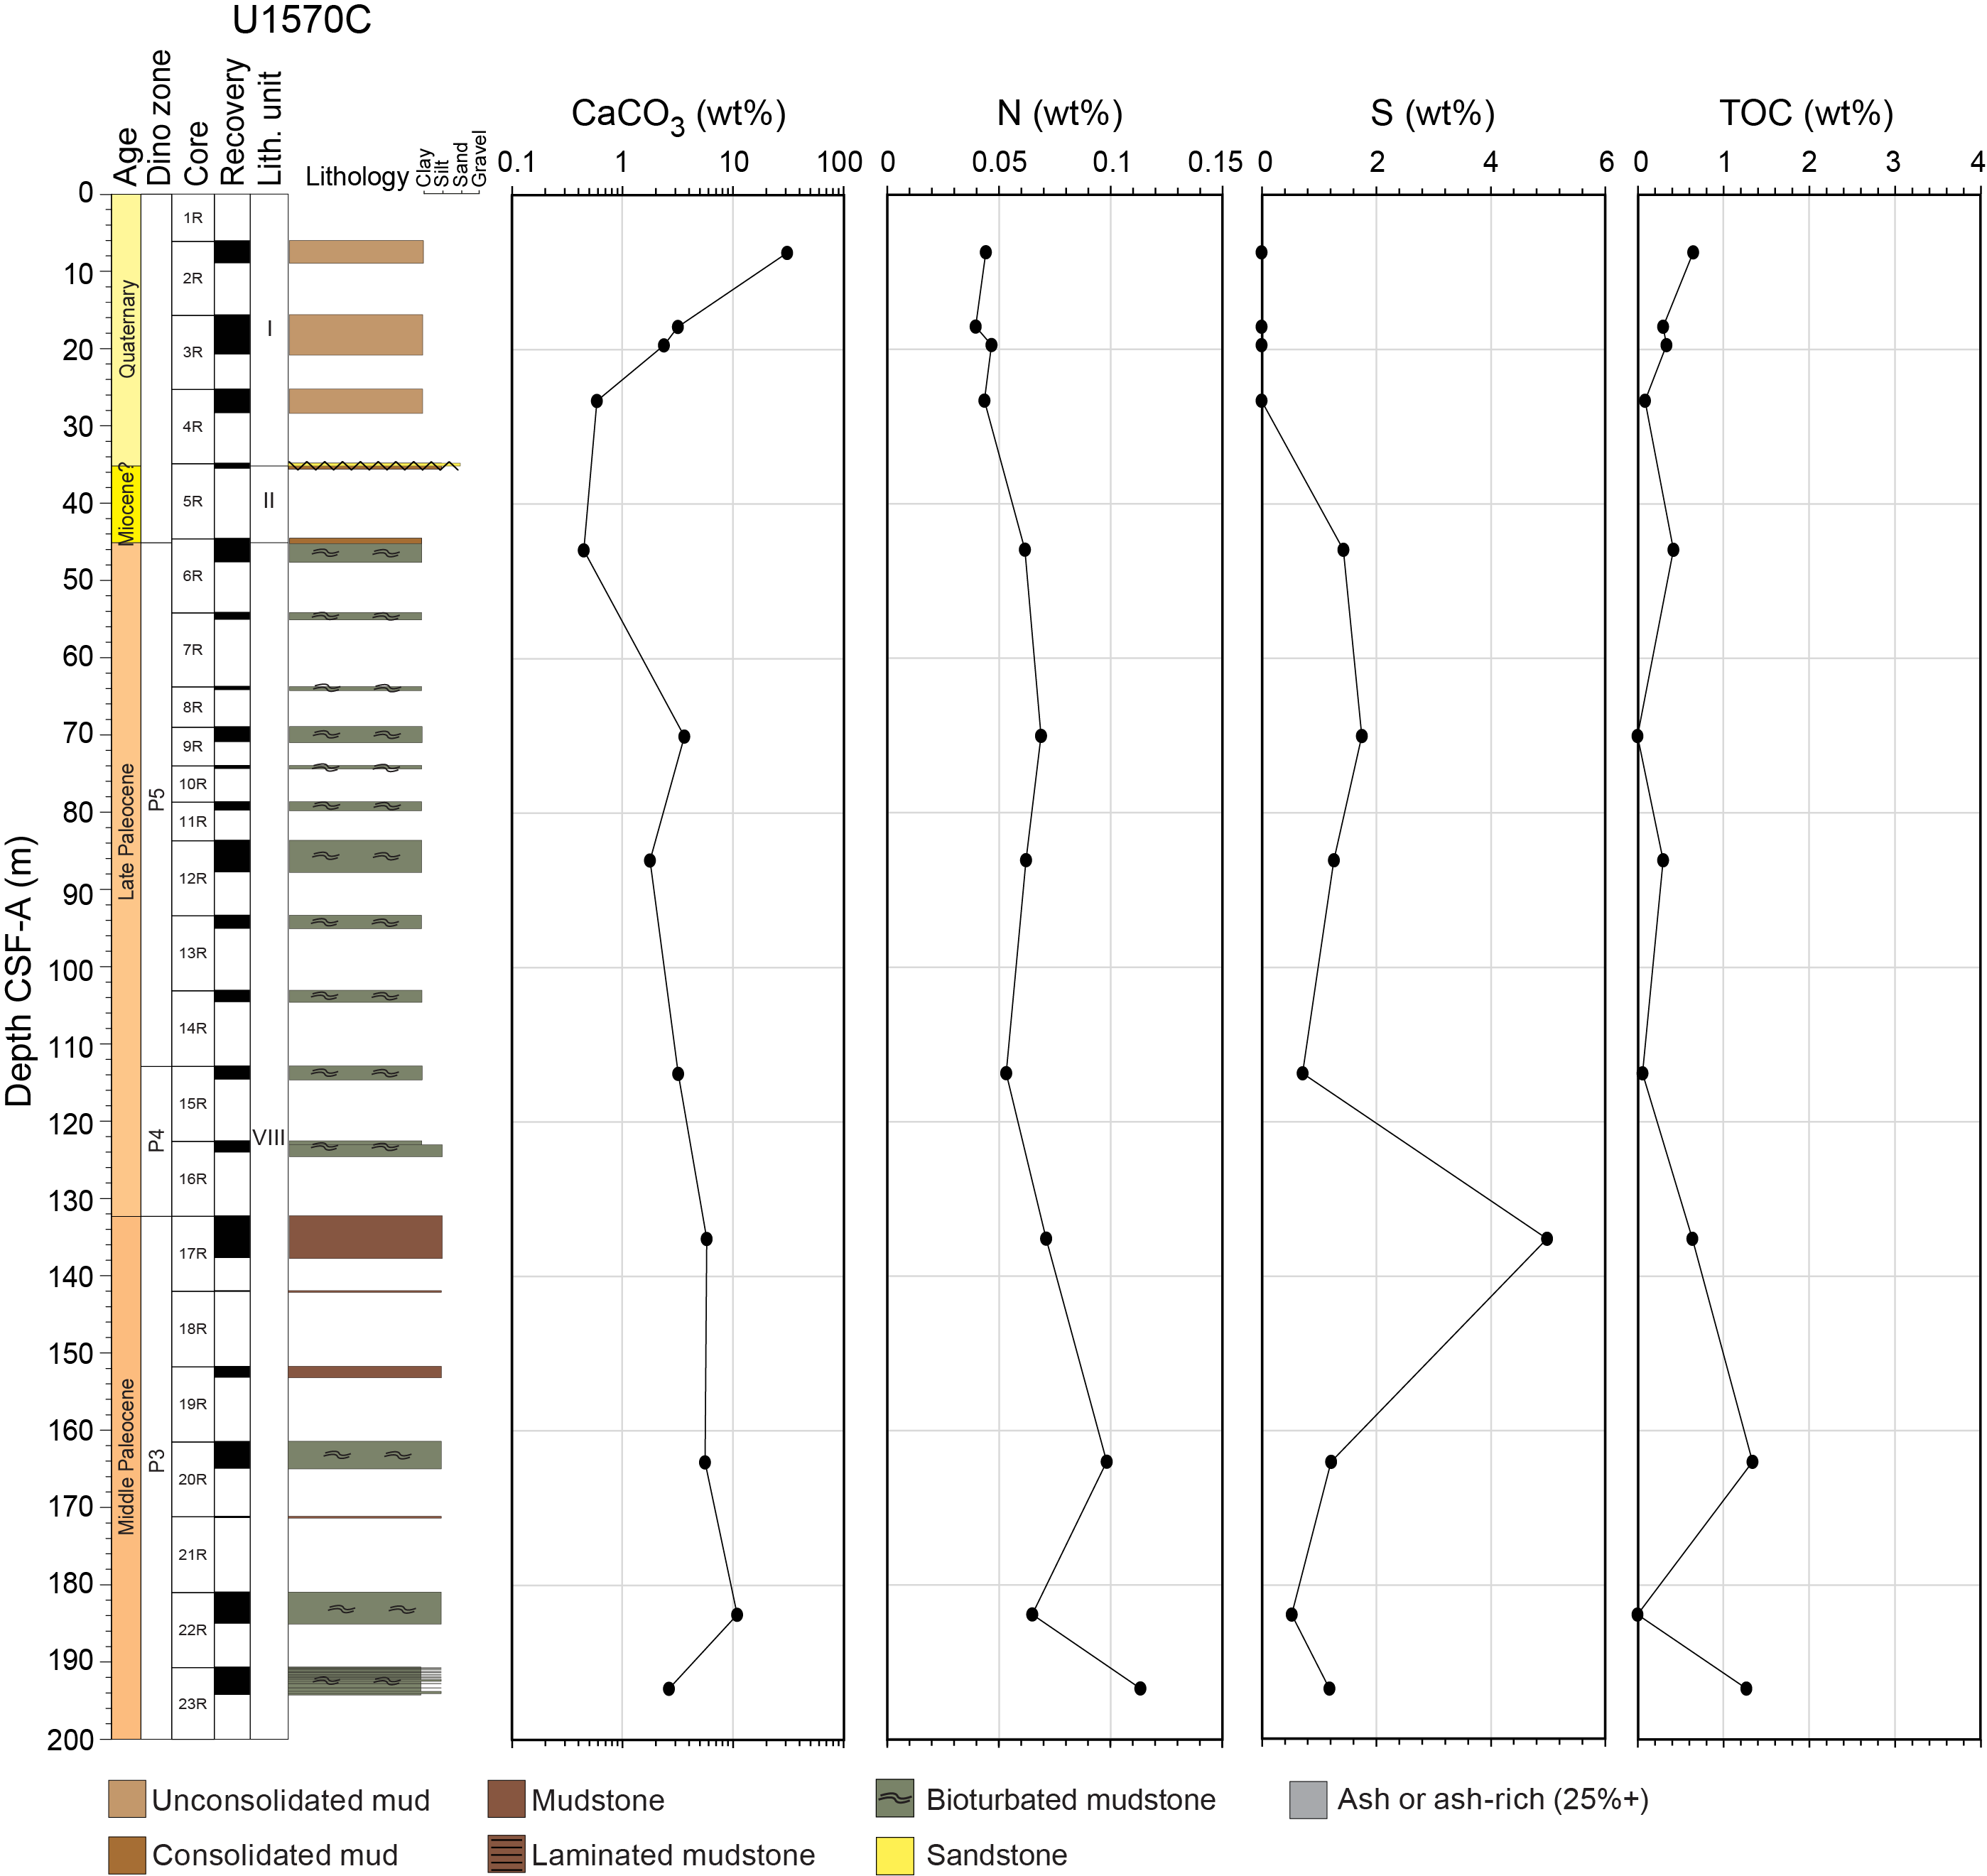
Figure F41. Carbon, nitrogen, and sulfur, Hole U1570C.
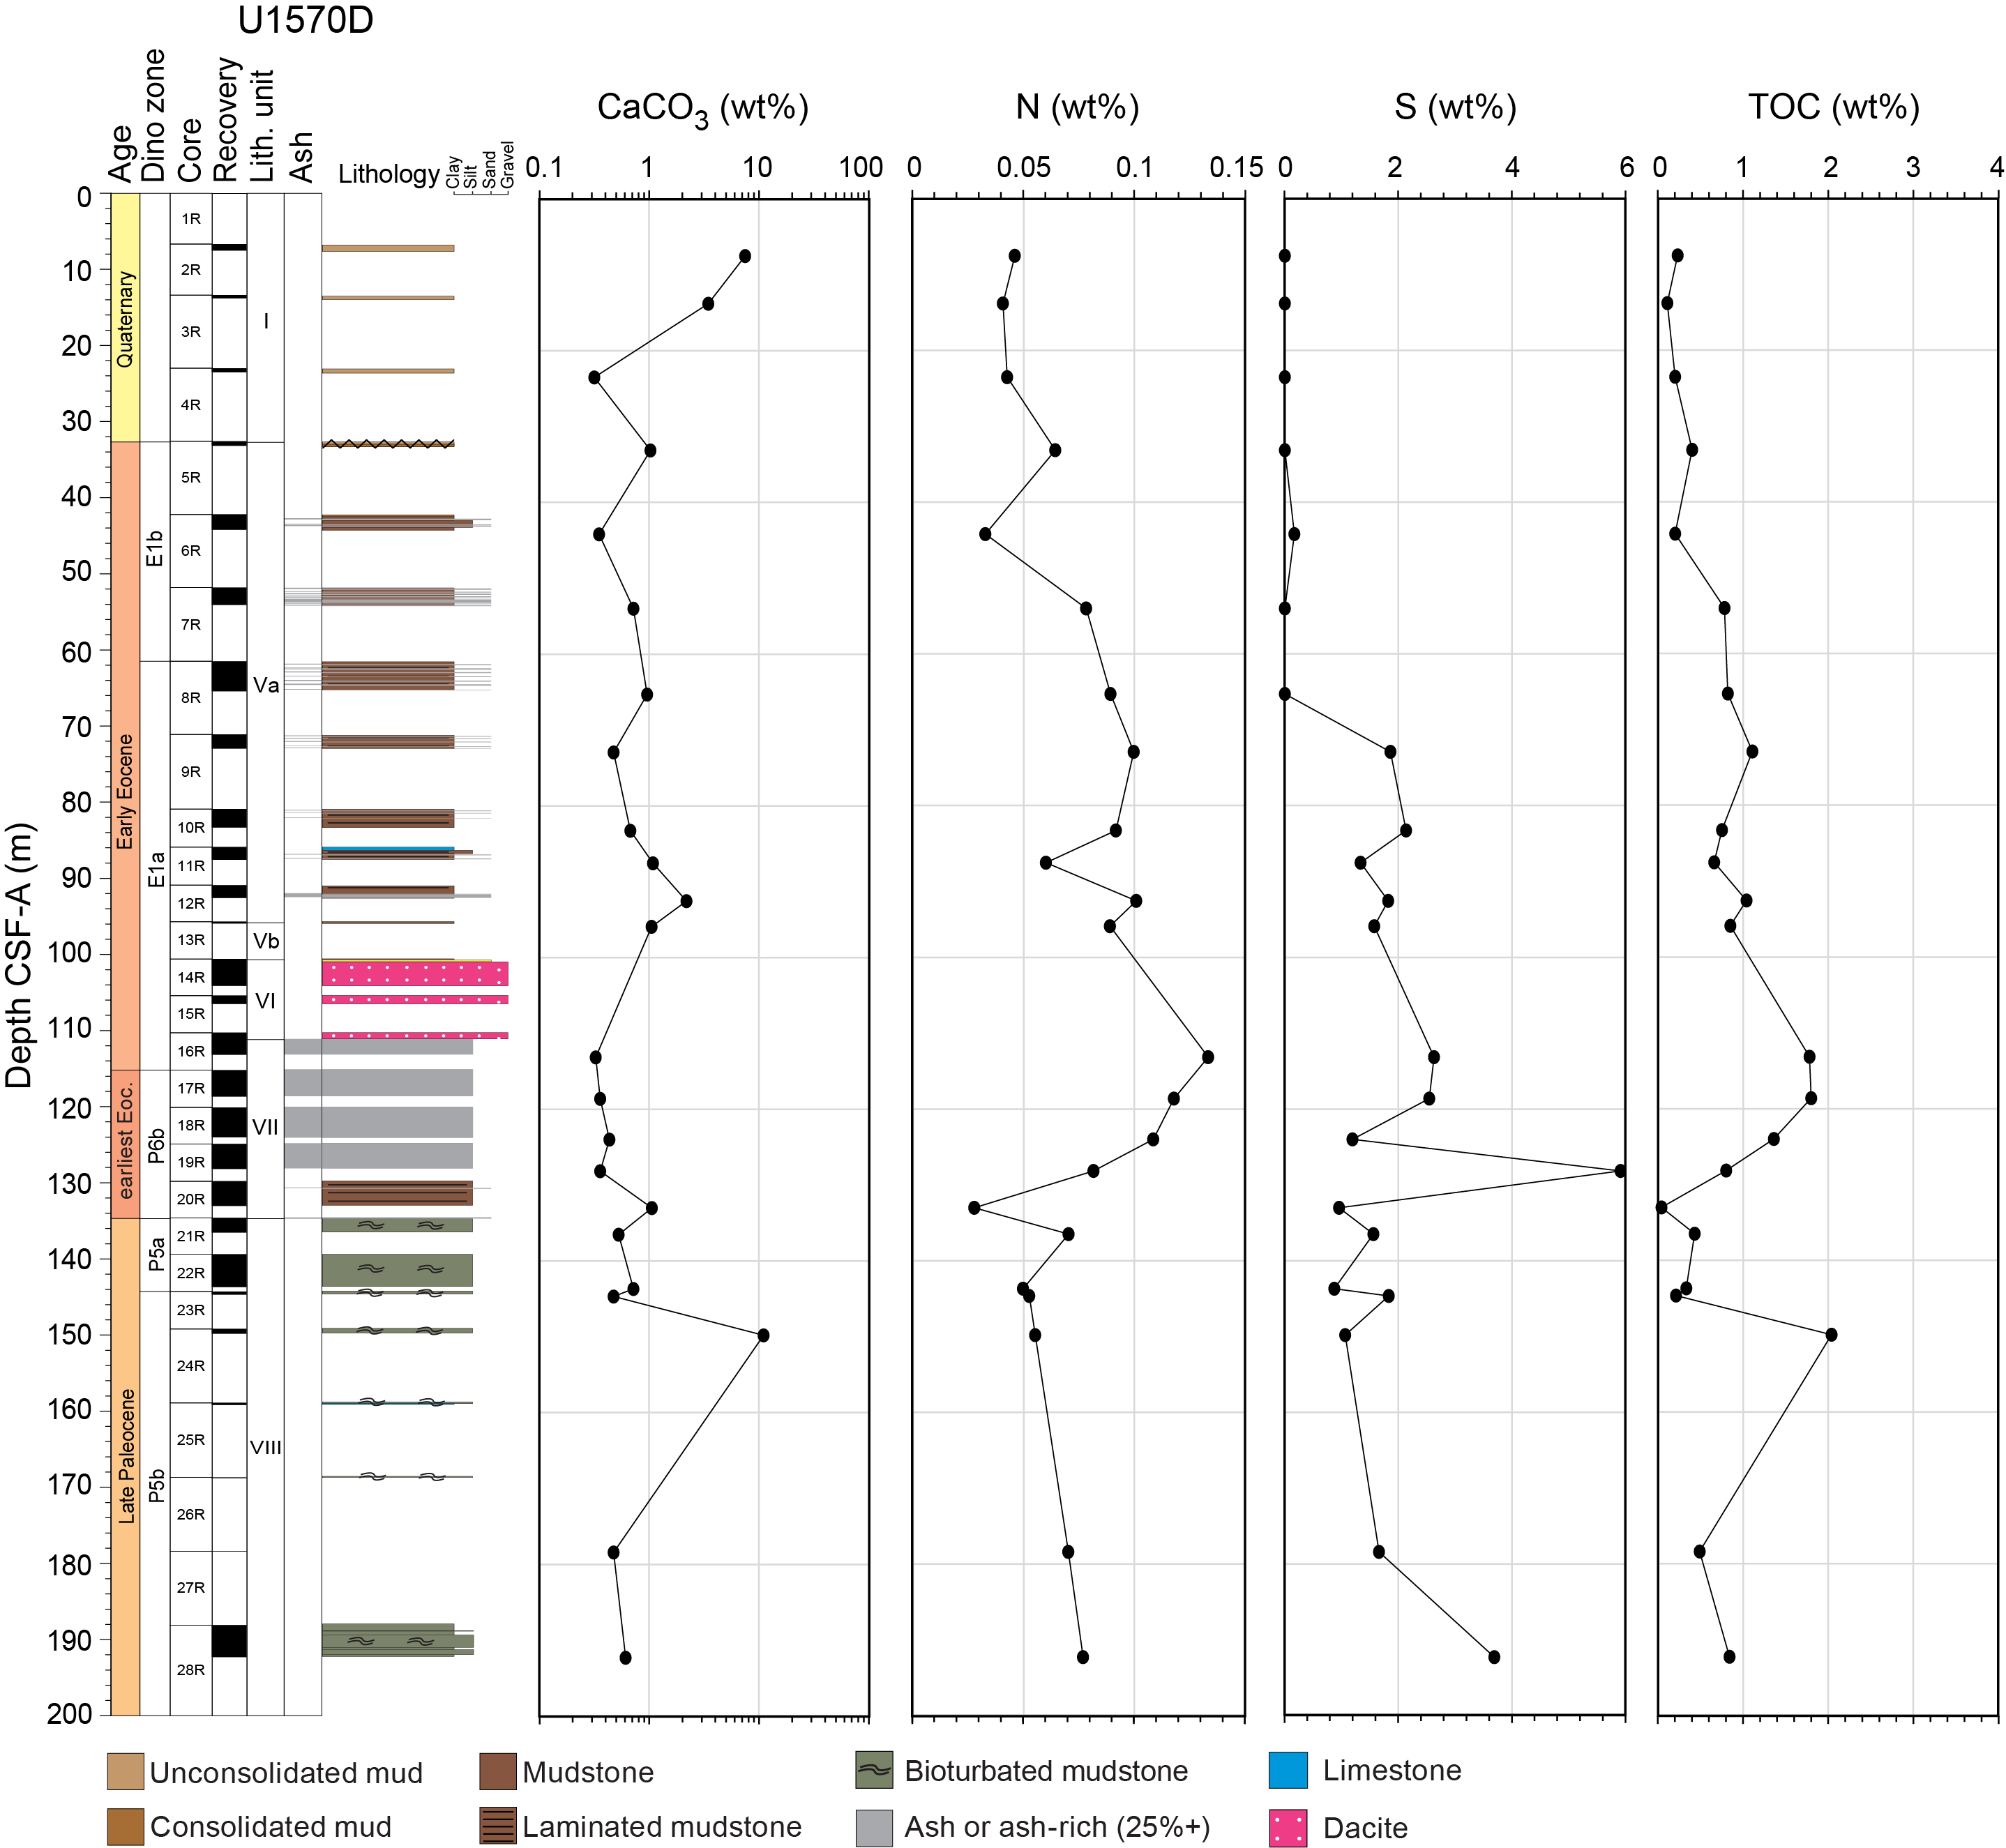
Figure F42. Carbon, nitrogen, and sulfur, Hole U1570D.
TOC varies considerably across Site U1570. In Hole U1570B, which represents the oldest strata encountered, TOC is below 1 wt% for the entirety of the hole (Figure F40). Hole U1570C also shows depressed TOC values, only exceeding 1 wt% below 160 m CSF-A (Figure F41). In contrast, the adjacent Holes U1570A and U1570D show higher concentrations of TOC downcore. Hole U1570A shows TOC values between 0.56 and 1.73 wt% for the entirety of Subunits Va and Vb and Unit VII (Figure F39). Hole U1570D shows a similar trend, and TOC values peak at 1.8 wt% in ash-rich Unit VII beneath the dacite layer (Figure F42). Concentrations then decrease into Unit VIII, providing good intraunit agreement between holes.
TN data show a similar trend to TOC, with low values (<0.085 wt%) throughout Hole U1570B (Figure F40). In Hole U1570C, TN concentrations increase gradually with depth, peaking at 0.113 wt% at 193.4 m CSF-A (Figure F41). Hole U1570A TN concentrations are as high as 0.143 wt%, largely tracking variations in TOC concentrations (Figure F39). In Hole U1570D, TN also covaries with TOC (Figure F42). Additionally, Hole U1570D has an interval of TN enrichment between 50 and 135 m CSF-A, which corresponds to a number of IW elemental variations and the ash-rich intervals in the core, and so may be linked to the factors which control their distribution.
Sulfur content is more coherent between the four holes, and all display 0 wt% in the upper 30 m. Below this depth, S content increases, peaking at between 3 and 5 wt% around 130 m CSF-A in all holes. As mentioned above, this peak is likely due to a period of pyrite mineralization and is accompanied by decreasing IW S content. SRA analysis yielded maximum thermal maturity (Tmax) values between 415° and 435°C for the majority of analyzed samples in Holes U1569A and U1570A (Table T22). The lowermost sample from Hole U1570A (36R-1, 141–151 cm) had the highest Tmax at nearly 550°C, suggesting the presence of an underlying heat source such as a sill intrusion.
6.3. Microbiology
Two samples from Site U1569 and three samples from Site U1570 were taken for microbiological analysis. In each case, ash layers and surrounding sediments were targeted. All samples were immediately frozen.
6.4. Summary
Geochemical data from the Mimir High sites, both downcore and between sites, suggest varied depositional histories. In Hole U1569A, nonconservative behavior is observed for a range of measured IW variables, with periods of high pH and low alkalinity similar to those observed in Holes U1567A and U1568A. This is similar to the profiles observed in Hole U1570C and suggests that lithologic changes likely control the IW composition. In Holes U1570A and U1570B, however, elemental distributions appear to be primarily conservative, suggesting that diffusion and/or advection are the primary controls on IW composition, potentially linked to the extensive fracturing of these rocks. In all holes, high carbonate content is restricted to the upper units, with lower values downcore. Occasional peaks in carbonate and organic carbon content suggest infrequent authigenic precipitation. Unit IV in Hole U1570D was investigated using ICP-AES and appears to be dacitic. XRD analysis indicates the primary sediment components are quartz, calcite, and a range of clays. In some samples, it was possible to identify clinoptilolite as the primary clay mineral, a form of zeolite linked to ash weathering. The direct impact of volcanic ash deposition is present in the form of a range of pyroxene minerals.
7. Physical properties
Five holes were drilled along a 5 km transect at Sites U1569 and U1570, extending across the northeast flank of the Mimir High. Site U1569 featured a single deep hole (U1569A), and four shallower, <200 m offset holes (U1570A–U1570D) were drilled along a transect west of Site U1569. A comprehensive suite of physical properties was collected across the sites, and more extensive sampling was done for discrete measurements in the primary hole (U1569A and U1570A) at both sites (see Physical properties in the Expedition 396 methods chapter [Planke et al., 2023a]).
A total of 10 lithostratigraphic units were defined across the different sites (Units I–X; see Lithostratigraphy). A brief description of each borehole is presented in drilling order prior to a site-wide comparison of the main lithostratigraphic units.
7.1. Data summary and processing
More than 400 m of sediments, comprising 101.8 m of overburden, 132.3 m from the Eocene, 56.8 m associated with the PETM, and 124.1 m from the Paleocene, were recovered from Sites U1569 and U1570. Completed measurements include a total of 14,737 gamma ray attenuation (GRA) bulk density, 14,567 MS, 3,596 P-wave velocity, and 4,043 NGR whole-round measurements taken using the Whole-Round Multisensor Logger (WRMSL) and Natural Gamma Radiation Logger (NGRL). A total of 294 thermal conductivity measurements were additionally taken as either whole-round or section-half measurements and supplemented by 1,349 P-wave velocity measurements using the Section Half Measurement Gantry (SHMG) (1,344 with the P-wave calipers [PWC] and 5 with the P-wave bayonets [PWB]) and 14,686 point MS (MSP) measurements.
Processing and screening for quality assurance and filtering of the data (see Physical properties in the Expedition 396 methods chapter [Planke et al., 2023a]) removed 1412 GRA bulk density data points (108 within 1.5 cm of a bin liner and 1304 below a cutoff of 1.2 g/cm3) and 57 points from the WRMSL P-wave velocity data sets (all below a lower cutoff of 1480 m/s) across the two sites. Processed data are presented here unless stated otherwise.
A general comparison of the respective means shows that moisture and density (MAD) bulk densities across hard sediment intervals are on average 12.4% higher than their WRMSL counterparts. This may relate at least in part to the liner correction only being applied to binned intervals, therefore excluding continuous segments of hard sediments. P-wave velocity measurements were mostly made in the liner using the PWC. Similar results were seen for the MSP and loop MS systems, where the means are generally very close, although higher maxima were found for MSP.
7.2. Hole U1569A
The physical properties for Hole U1569A are summarized in Figure F43. Hole U1569A covers Lithostratigraphic Units I–VIII. In general, the shallow soft-sediment sequences in Unit I feature above-average values for GRA bulk density (mean = 1.74 g/cm3), MS (mean = ~70 × 10−5 [SI]), and NGR (mean = ~40 counts/s). P-wave velocities and MS do not change throughout this unit, and bulk densities and NGR feature slightly increasing and decreasing trends, respectively. A decrease in P-wave velocity, bulk density, MS, and NGR at ~78 m CSF-A marks the top of Unit II. Values for bulk density (mean = 1.49 g/cm3), MS (mean = ~10 × 10−5 [SI]), and NGR (mean = ~30 counts/s) remain largely constant. Decreasing trends are observed for NGR and bulk density across the transition from the base of Unit II to the underlying Unit III (top = 136.4 m CSF-A).
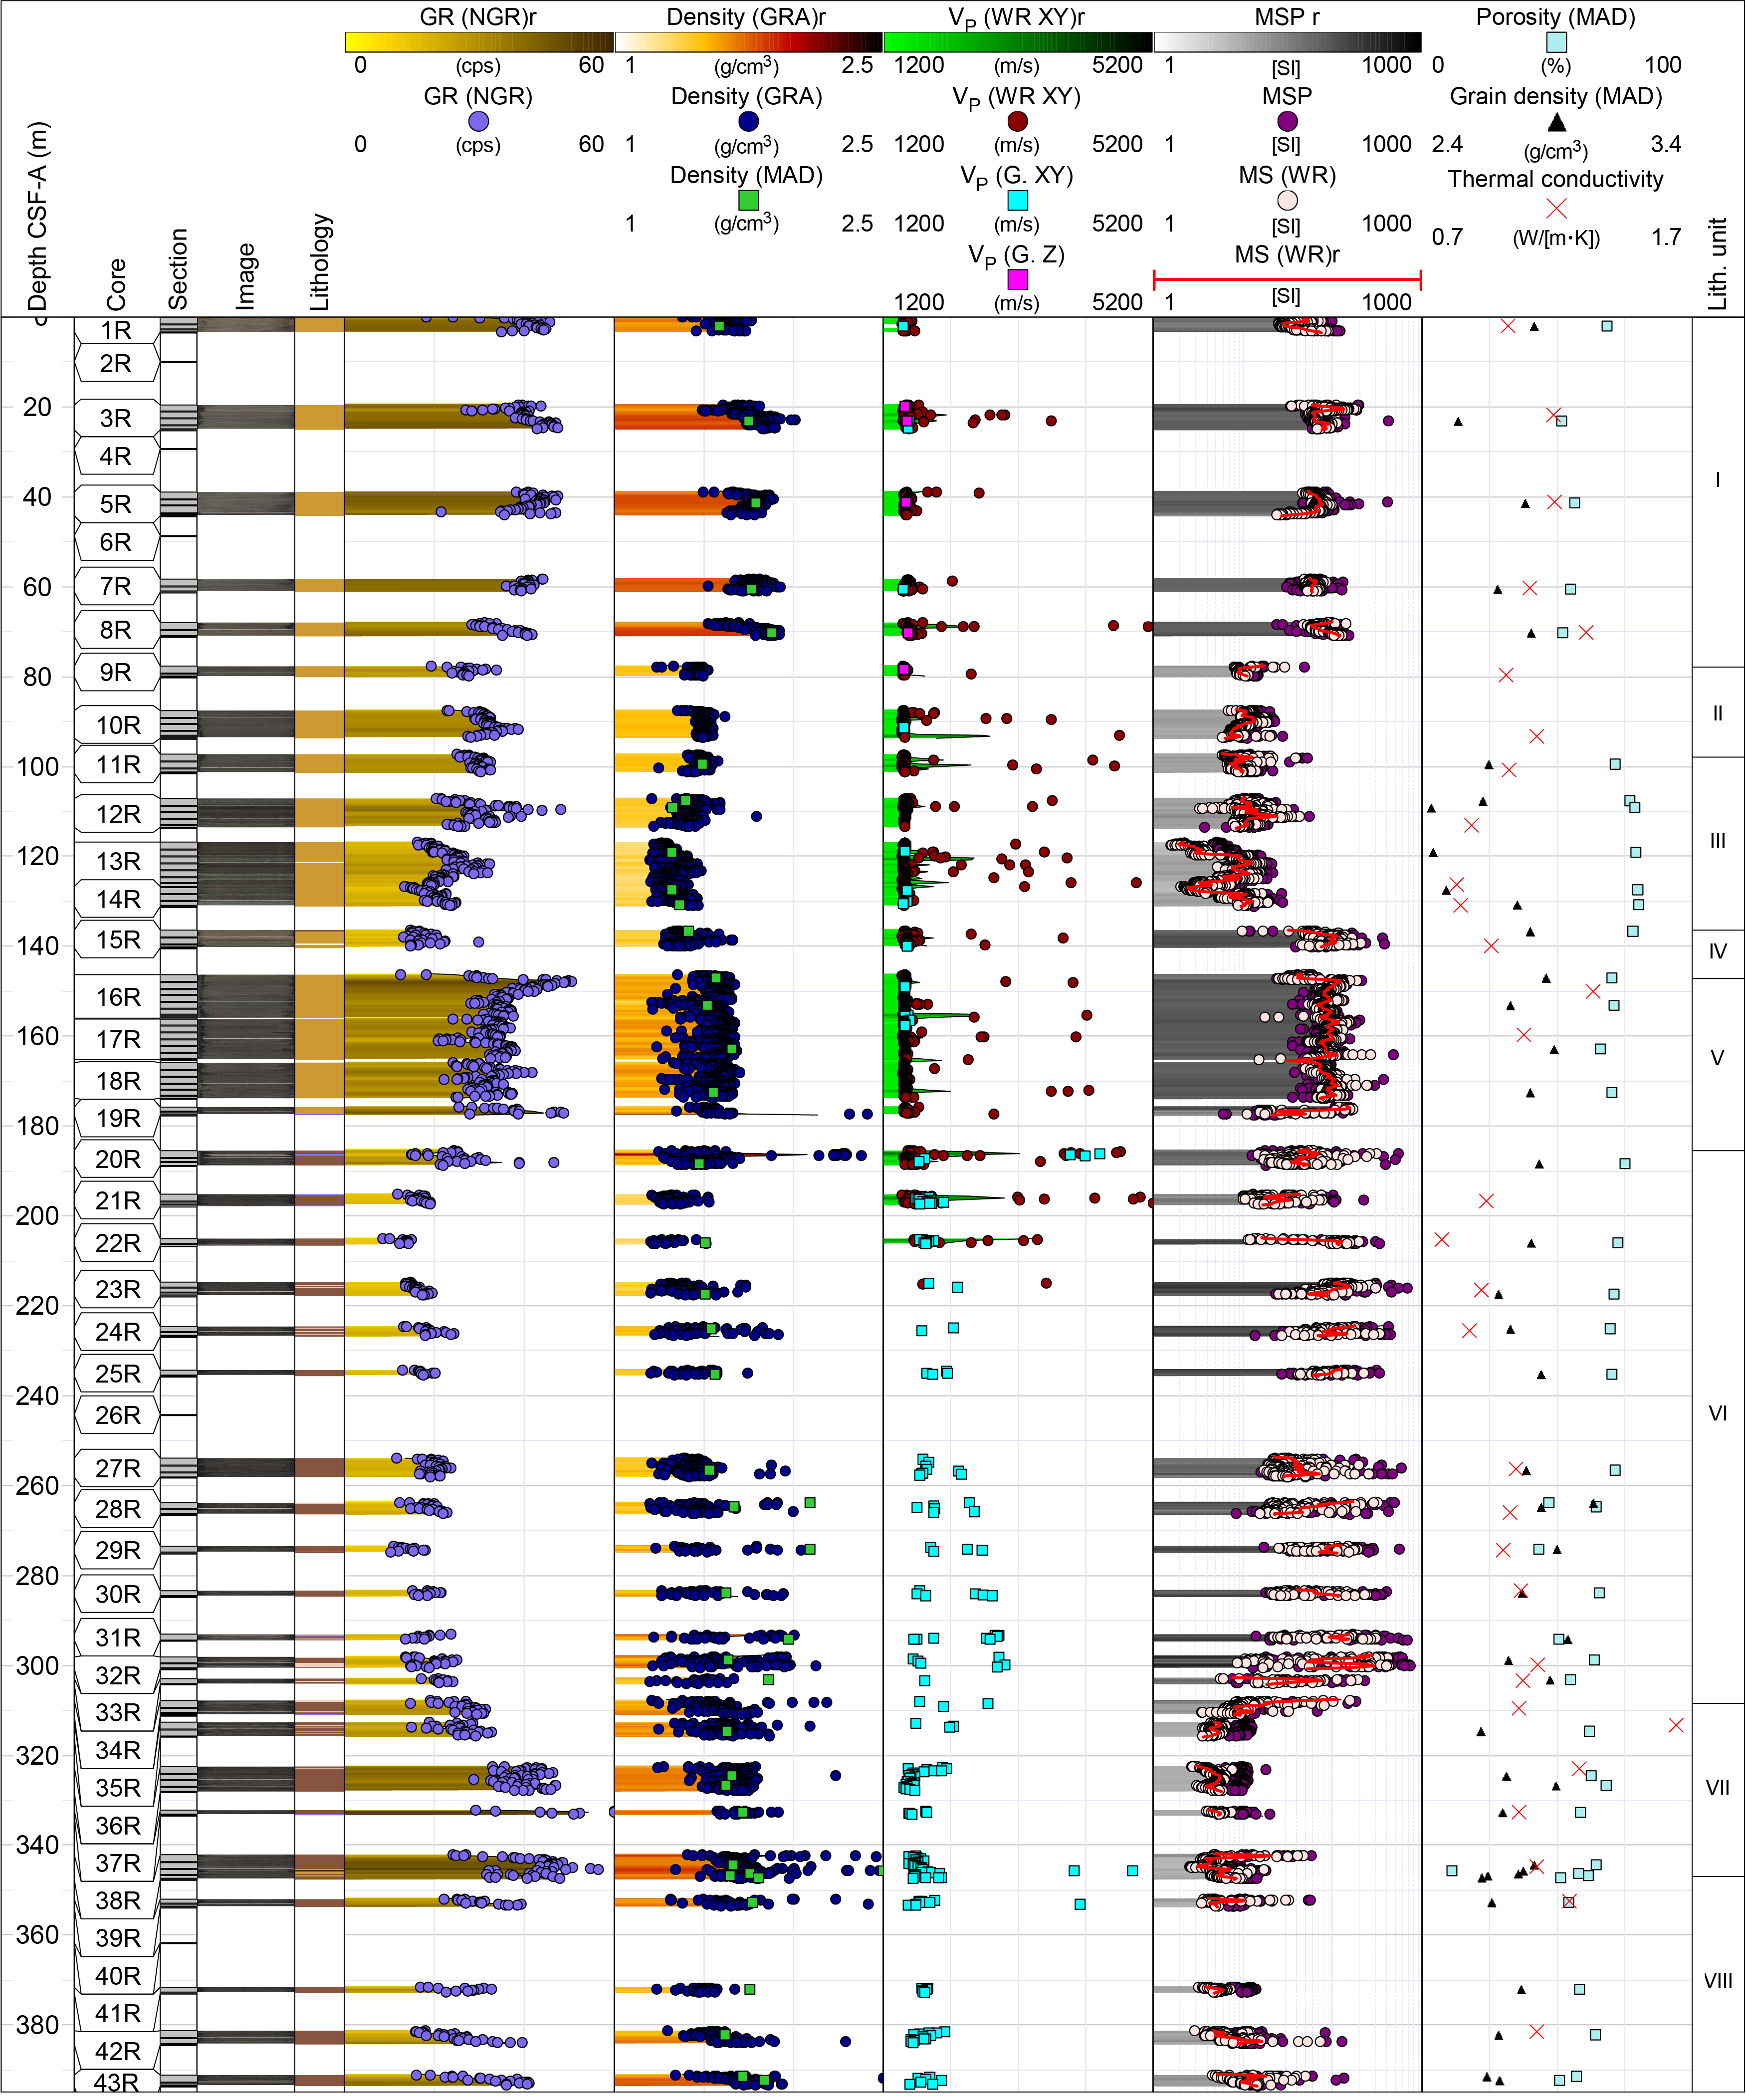
Figure F43. Physical properties, Hole U1569A.
Unit III covers a brief interval dominated by scattered P-wave velocities and MS. Bulk density steadily increases downcore throughout the unit from ~1.4 to ~1.6 g/cm3. A stepwise increase in NGR (from ~20 to ~50 counts/s), MS (from <50 × 10−5 to >100 × 10−5 [SI]), and GRA bulk density (from ~1.3 to as high as 1.6 g/cm3) marks the top of the unconformity in the uppermost part of Unit IV, starting at ~147 m CSF-A. A decrease in NGR is observed to ~177 m CSF-A, which is the start of Subunit Va. NGR remains constant throughout Subunit Va at ~15 counts/s. Low P-wave velocities are recorded throughout the same interval, and bulk densities and MS values remain stable with means of ~1.6 g/cm3 and ~90 × 10−5 [SI], respectively.
A drop in MS to ~5 × 10⁻⁵ [SI] delineates Unit IV from Subunit Va. The latter is characterized by a high degree of scatter in measured P-wave velocities and local increases in MS that correlate well with ash-rich layers throughout the upper part of the unit. Above-average values for GRA bulk density are also recorded for ash intervals. Although the unit is characterized by the lowest NGR in the entire hole, higher than average P-wave velocities as high as 5312 m/s are observed. P-wave velocities over this interval are distributed bimodally: velocities above 2000 m/s are associated with ash layers, and velocities below 2000 m/s typically represent background sediments. From ~210 to 308 m CSF-A, GRA bulk densities follow an increasing trend from a low of ~1.25 to ~1.6 g/cm3. Figure F44 highlights an expanded section of claystone and limestone interlayered with ash physical properties.
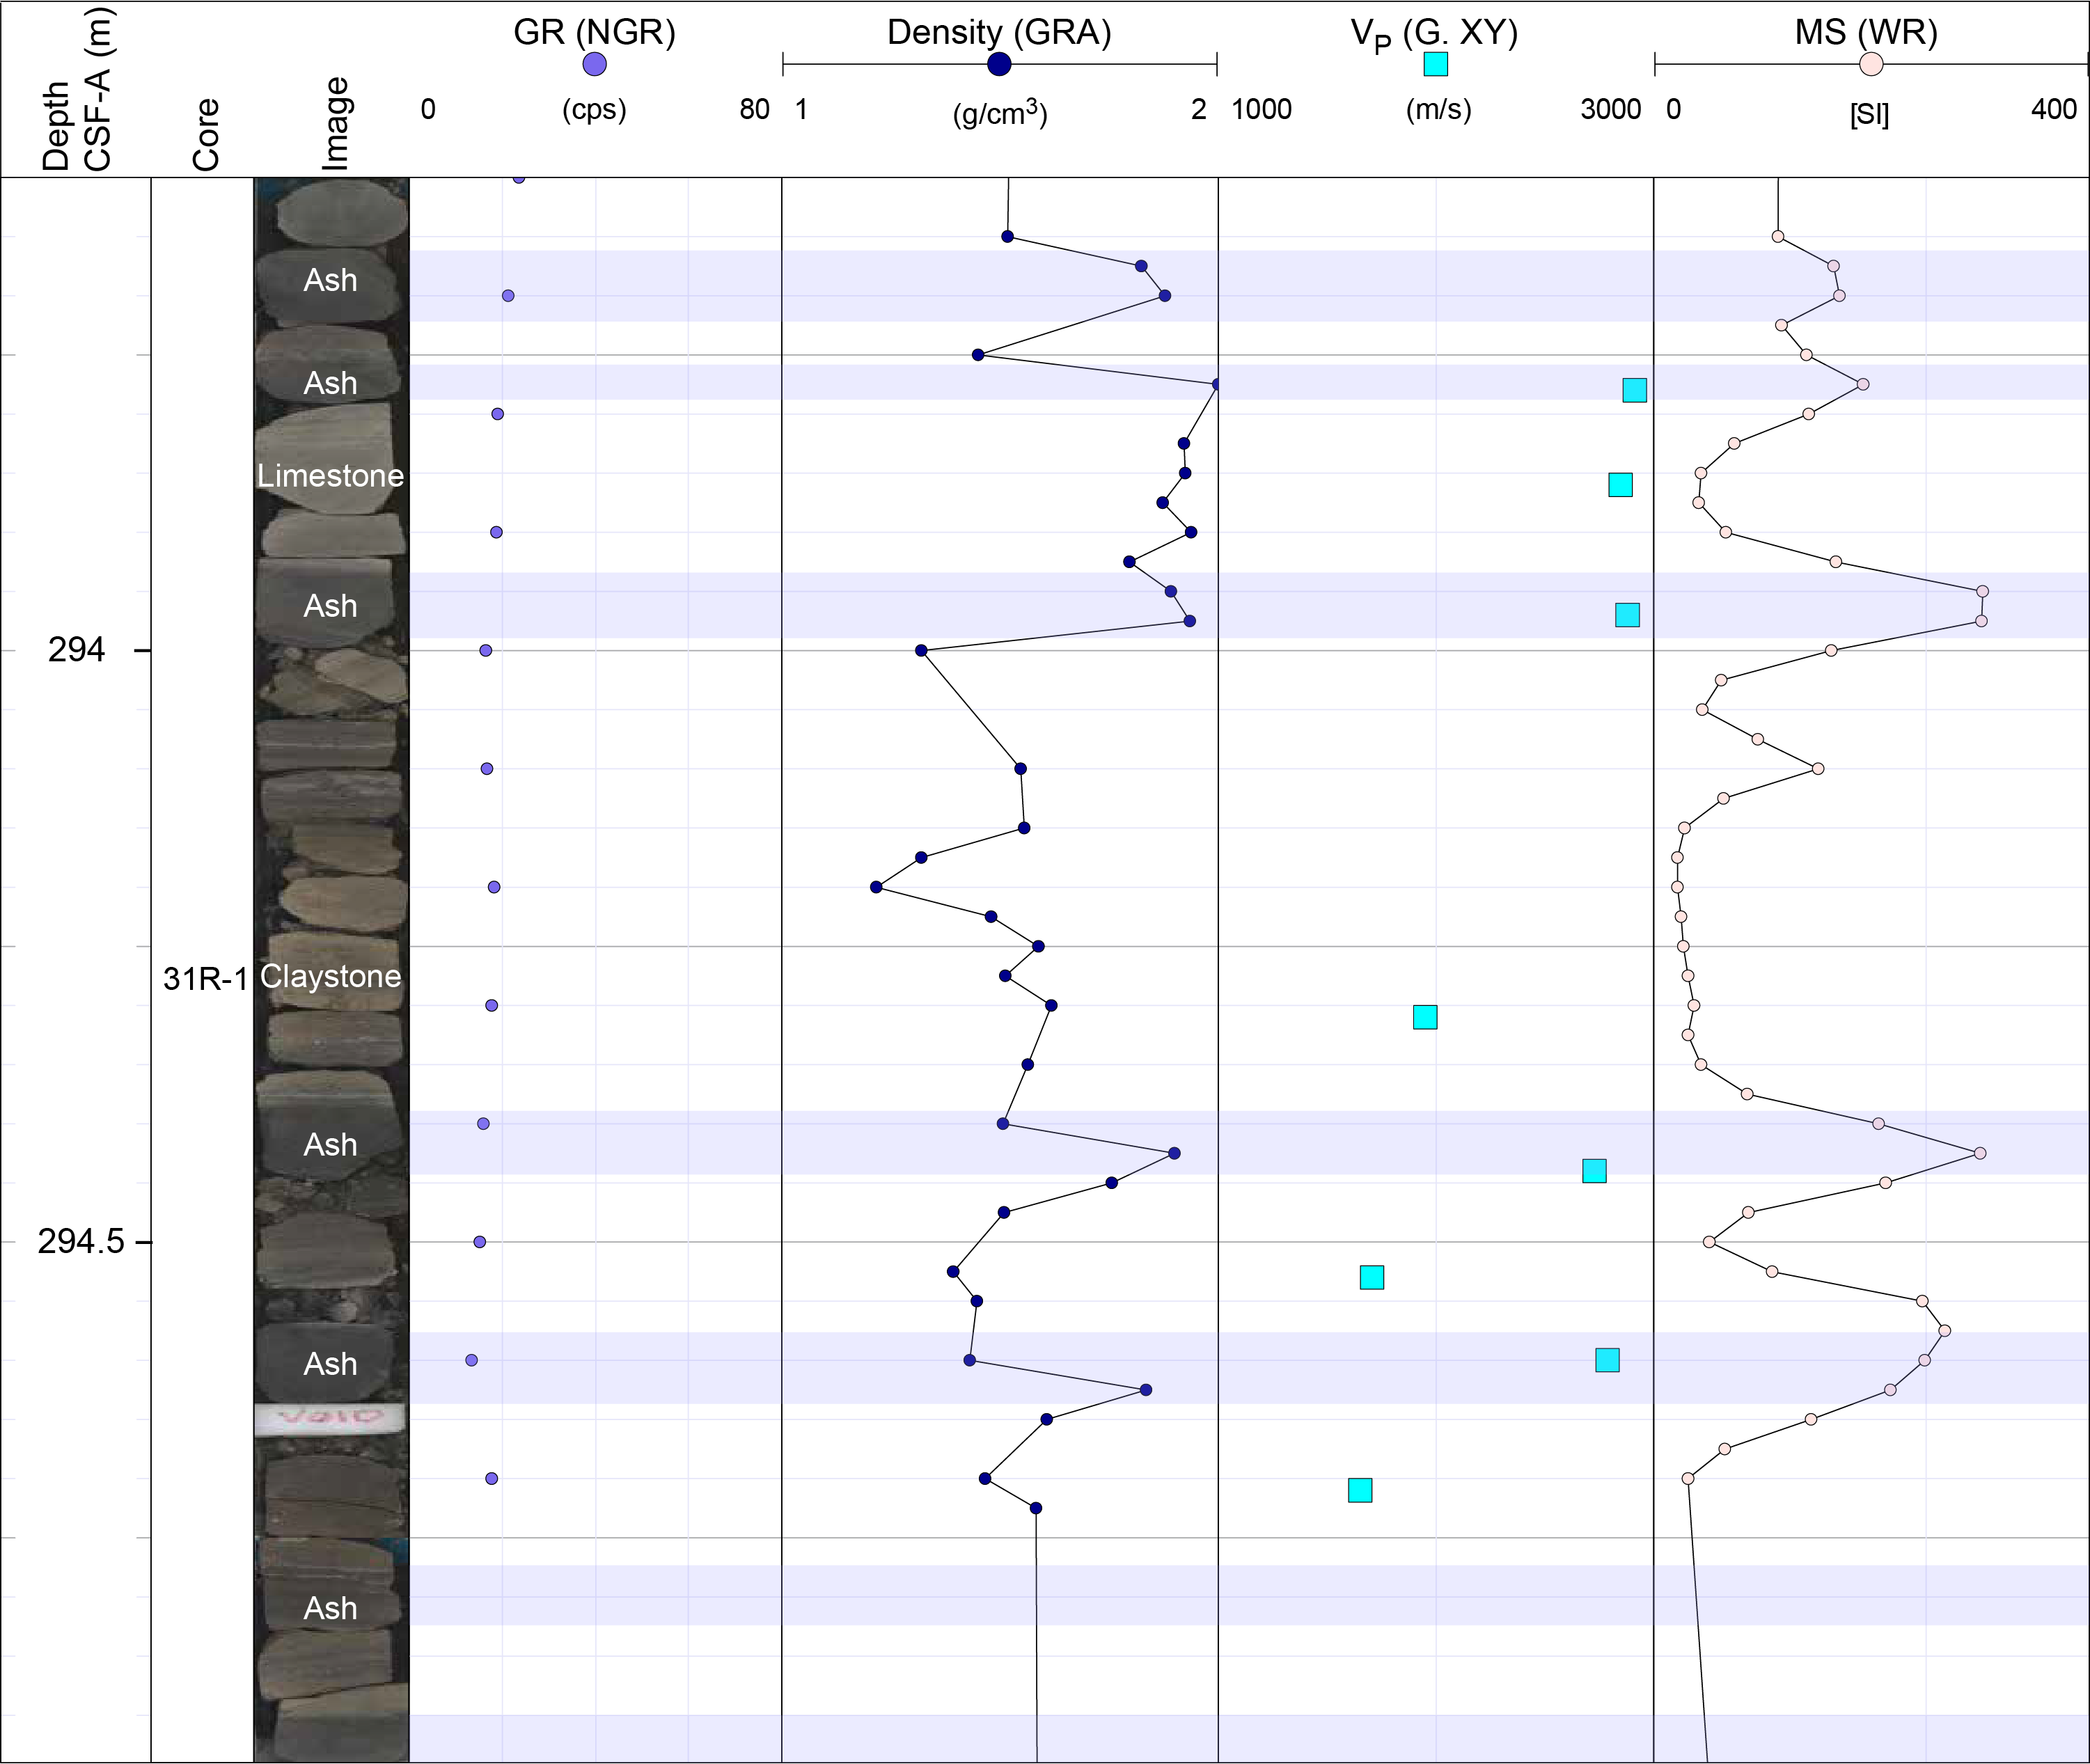
Figure F44. Interlayered ash horizon vs. background claystone, Hole U1569A.
Starting at ~308 m CSF-A, the difference between the distinctive P-wave velocity groups decreases. Subunit Vb and Unit VI were not identified in this hole, probably because of low core recovery through this interval. Unit VII is characterized by more uniform P-wave velocities (~1600 m/s) and MS values (~10 × 10−5 [SI]) and an increase in bulk density from ~1.6 to ~1.8 g/cm3. NGR increases from ~15 to ~40 counts/s throughout the unit. GRA bulk density and NGR are highest at the top of Unit VIII at ~346 m CSF-A, and NGR is constant at ~25 counts/s below this depth. All properties show high scattering throughout Unit VIII.
In addition to continuous WRMSL and SHMG x and y measurements, 45 MAD samples were measured. MAD bulk densities range 1.32–3.02 g/cm3, and the highest values were measured in carbonates and nodules. Porosities vary between 11% and 80%. The extremely high values relate to unconsolidated clay in Subunit IIb. A total of 33 thermal conductivity measurements range 0.77–1.64 W/(m·K) throughout the borehole.
7.3. Hole U1570A
Hole U1570A is located 1512 m west of Hole U1569A. An overview of measured physical properties for Hole U1570A is given in Figure F45. The uppermost Units I and II comprise mostly poorly consolidated clays that feature similar physical properties as those observed in Units I and II in Hole U1569A. Units I, II, IV, IX, and X were identified in Hole U1570A. Bulk densities are considerably lower in Unit II than in Unit I, and GRA bulk densities decrease to 1.39 g/cm3 on average versus 1.71 g/cm3 for the unit above. Both NGR and MS continue to decrease with depth throughout this unit. The Unit I–II transition (~35 m CSF-A) is characterized by a downward and then stabilizing (low) trend in NGR (mean = ~24 counts/s). In the lower part of Unit II, WRMSL P-wave velocity values of ~1500 m/s are in agreement with measurements made using the SHMG. GRA bulk density values decrease from ~1.6 g/cm3 at the base of Unit I to ~1.4 g/cm3 at the base of Unit II.
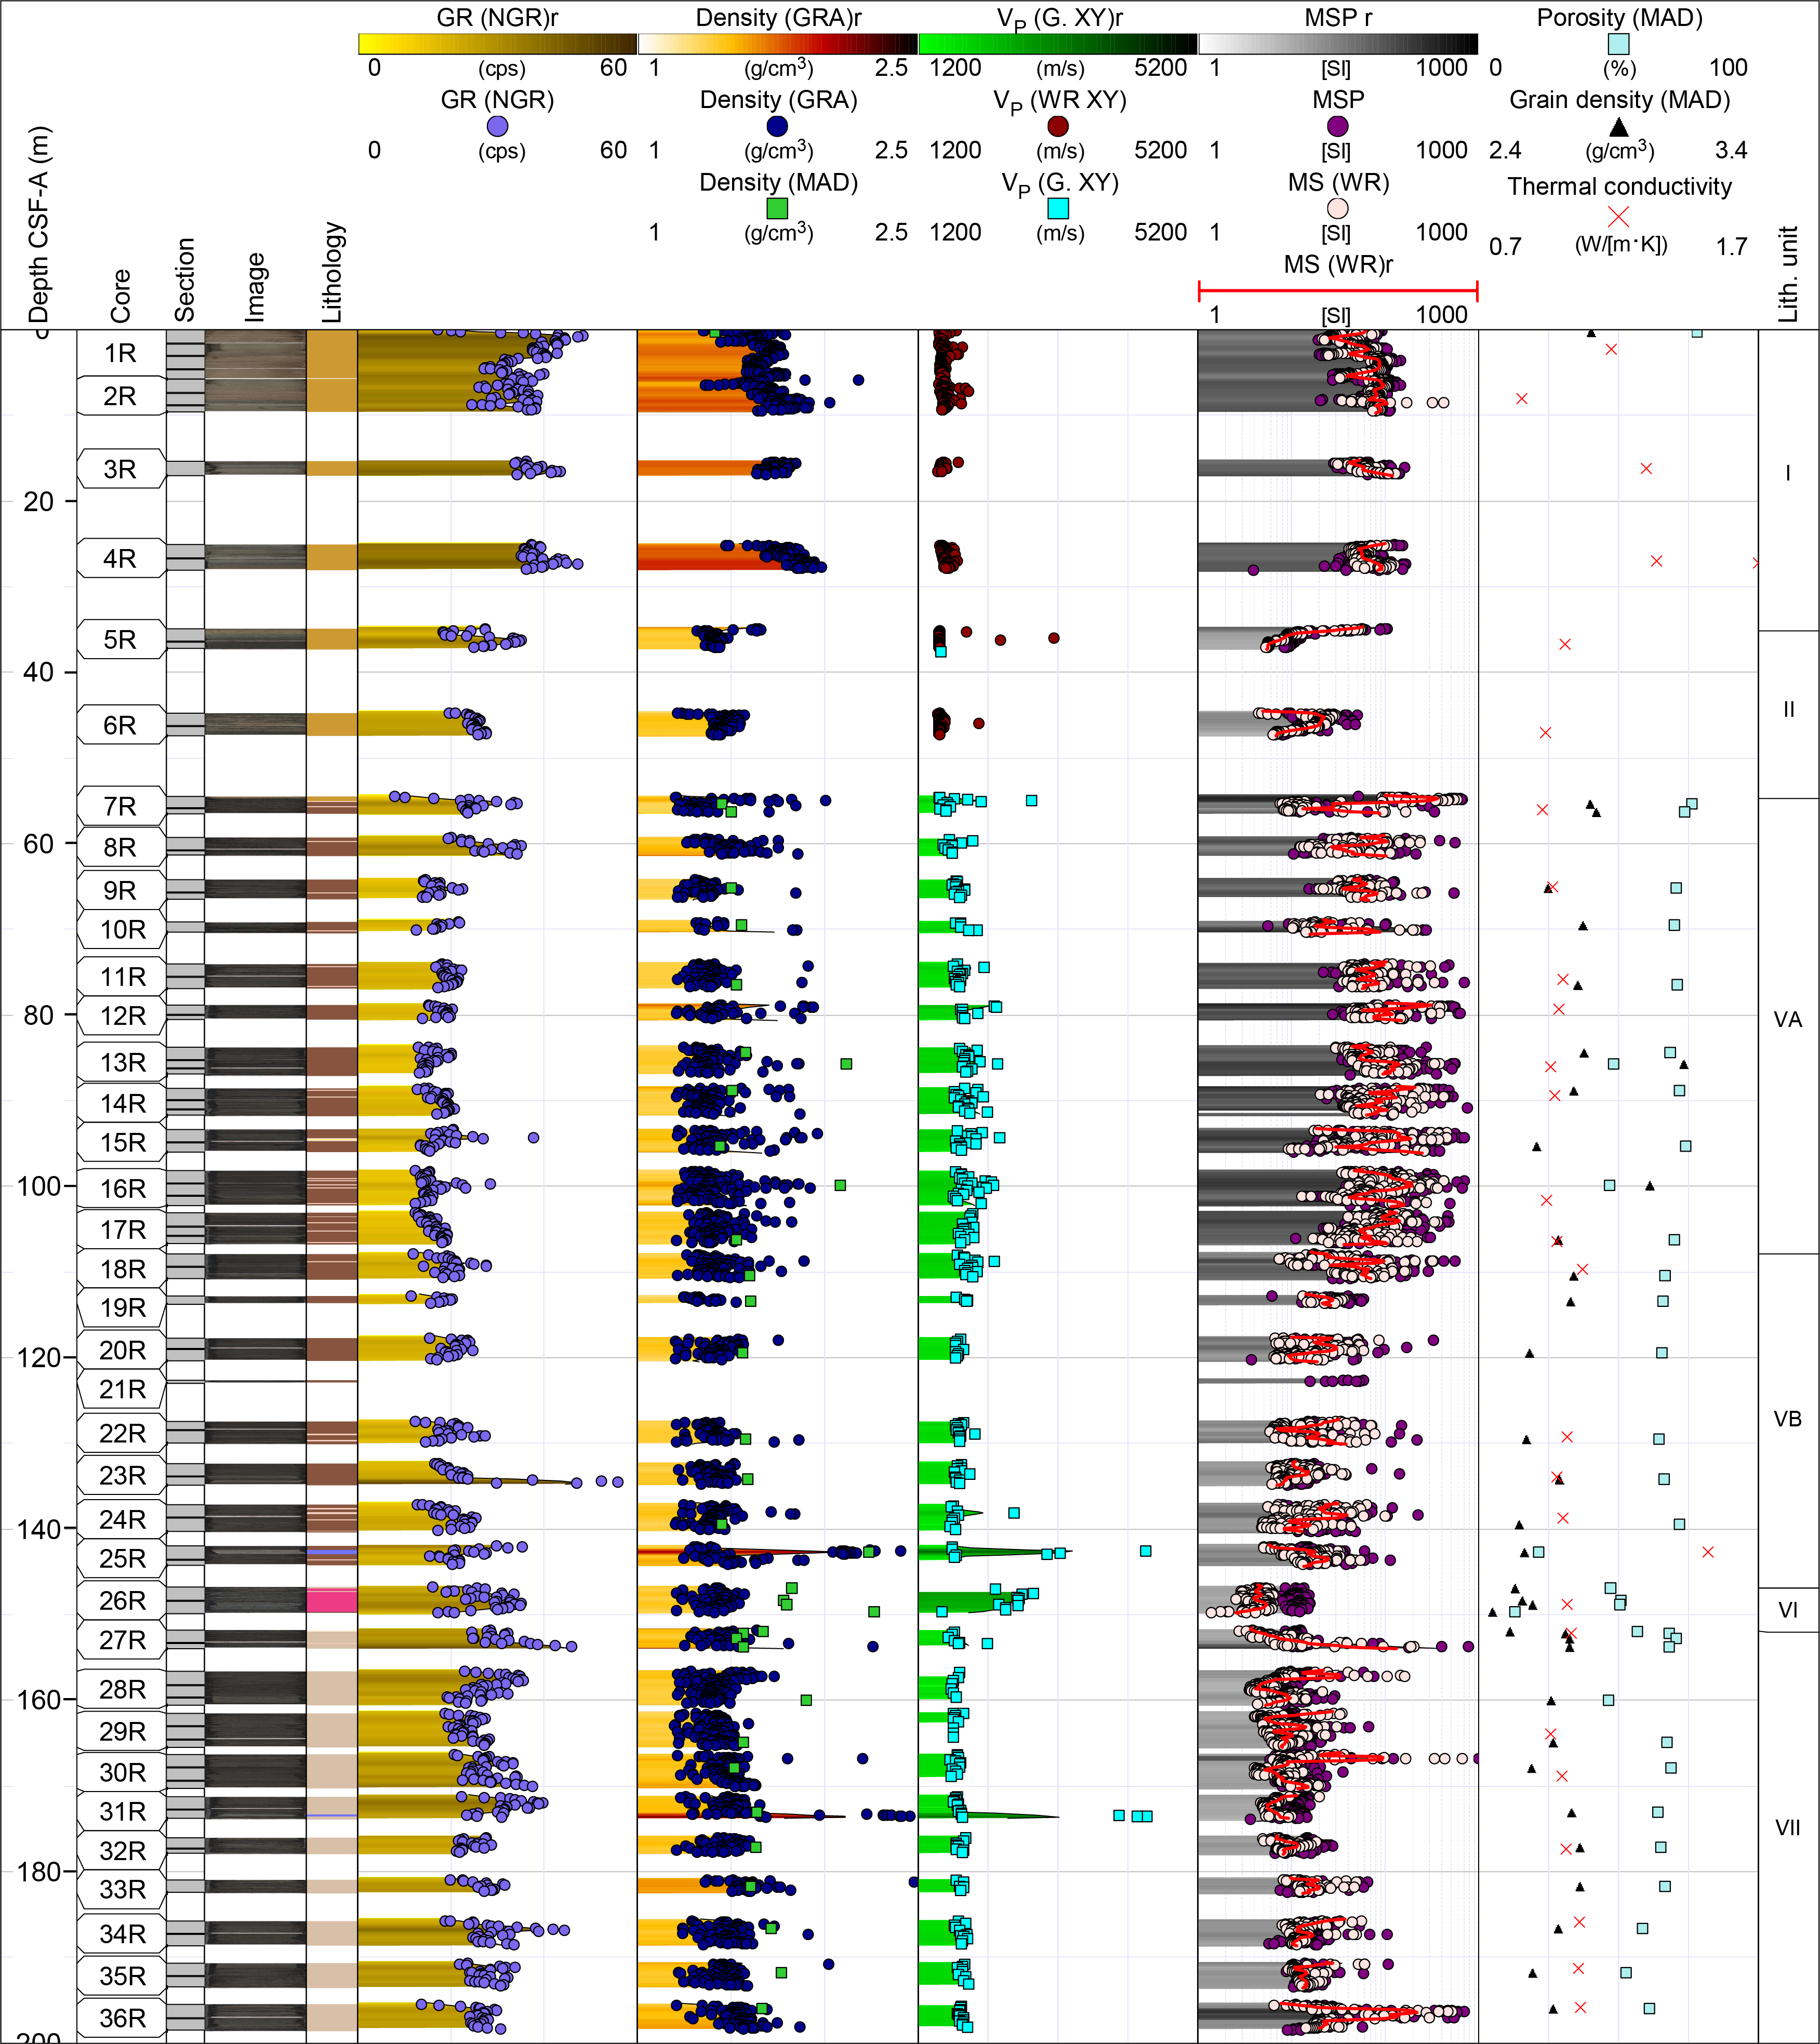
Figure F45. Physical properties, Hole U1570A.
Units III and IV were not identified in this hole.
The top of Subunit Va at ~55 m CSF-A is accompanied by a 500 × 10−5 [SI] increase in MS and GRA bulk density values as high as 2 g/cm3. The remainder of the unit is characterized by increased scattering in bulk density, P-wave velocity, and MS, likely due to the abundance of ash layers. P-wave velocities of ~1800 m/s are ~300 m/s higher than those observed in Unit II. MS decreases to background values of ~24.1 × 10⁻⁵ [SI] at ~108 m CSF-A, which marks the transition into Subunit Vb, where the still-abundant ash layers are more altered and weathered. No significant changes in mean P-wave velocities (1895 m/s), NGR (21 counts/s), and bulk densities (1.44 g/cm3) are observed over the transition; however, scatter is increased. Occasional spikes in P-wave velocities, NGR, and MS values mark the presence of ashes and carbonates to the dacite-dominated interval (Unit VI) recovered at ~150 m CSF-A. The interval features P-wave velocities that are substantially higher (average = ~2700 m/s). MS remains well constrained at ~10 × 10−5 [SI]. Unit VII features slightly higher P-wave velocities and bulk densities compared to Unit VI, with generally low MS and stable NGR that range ~20–35 counts/s.
A total of 28 thermal conductivity measurements were made throughout the borehole, ranging 0.85–1.71 W/(m·K). Unit II, Subunit Va, and Unit VII generally feature values representative of the background clay-rich sequence. A total of 37 MAD samples were analyzed; bulk density values range 1.41–2.26 g/cm3 and correlate well with the observed WRMSL bulk density trends. Porosities fall within a 13%–78% range.
7.4. Hole U1570B
Hole U1570B is the most westward borehole along the transect and is 1772 m from Hole U1570A (see Figure F1 in the Site U1565 chapter [Planke et al., 2023b]). Hole U1570B penetrates five lithostratigraphic units, two of which (Units I and II) were sampled in other holes. The uppermost part of Unit I is characterized by relatively high densities (mean = 1.68 g/cm3) and MS (mean = ~50 × 10−5 [SI]) that decrease to 1.44 g/cm3 and ~42 × 10−5 [SI], respectively, toward the base of this unit (Figure F46). Units III–VII are not observed in this hole. Unit VIII represents more than 40 m of dark gray claystone with silt that is characterized by constant density (mean = 1.41 g/cm3), MS (mean = ~8 × 10⁻⁵ [SI]), and NGR (mean = 26.4 counts/s). P-wave velocity in Unit VIII increases downward through the interval from ~1400 to 2000 m/s. Two measurements of thermal conductivity yielded 1 W/(m·K).
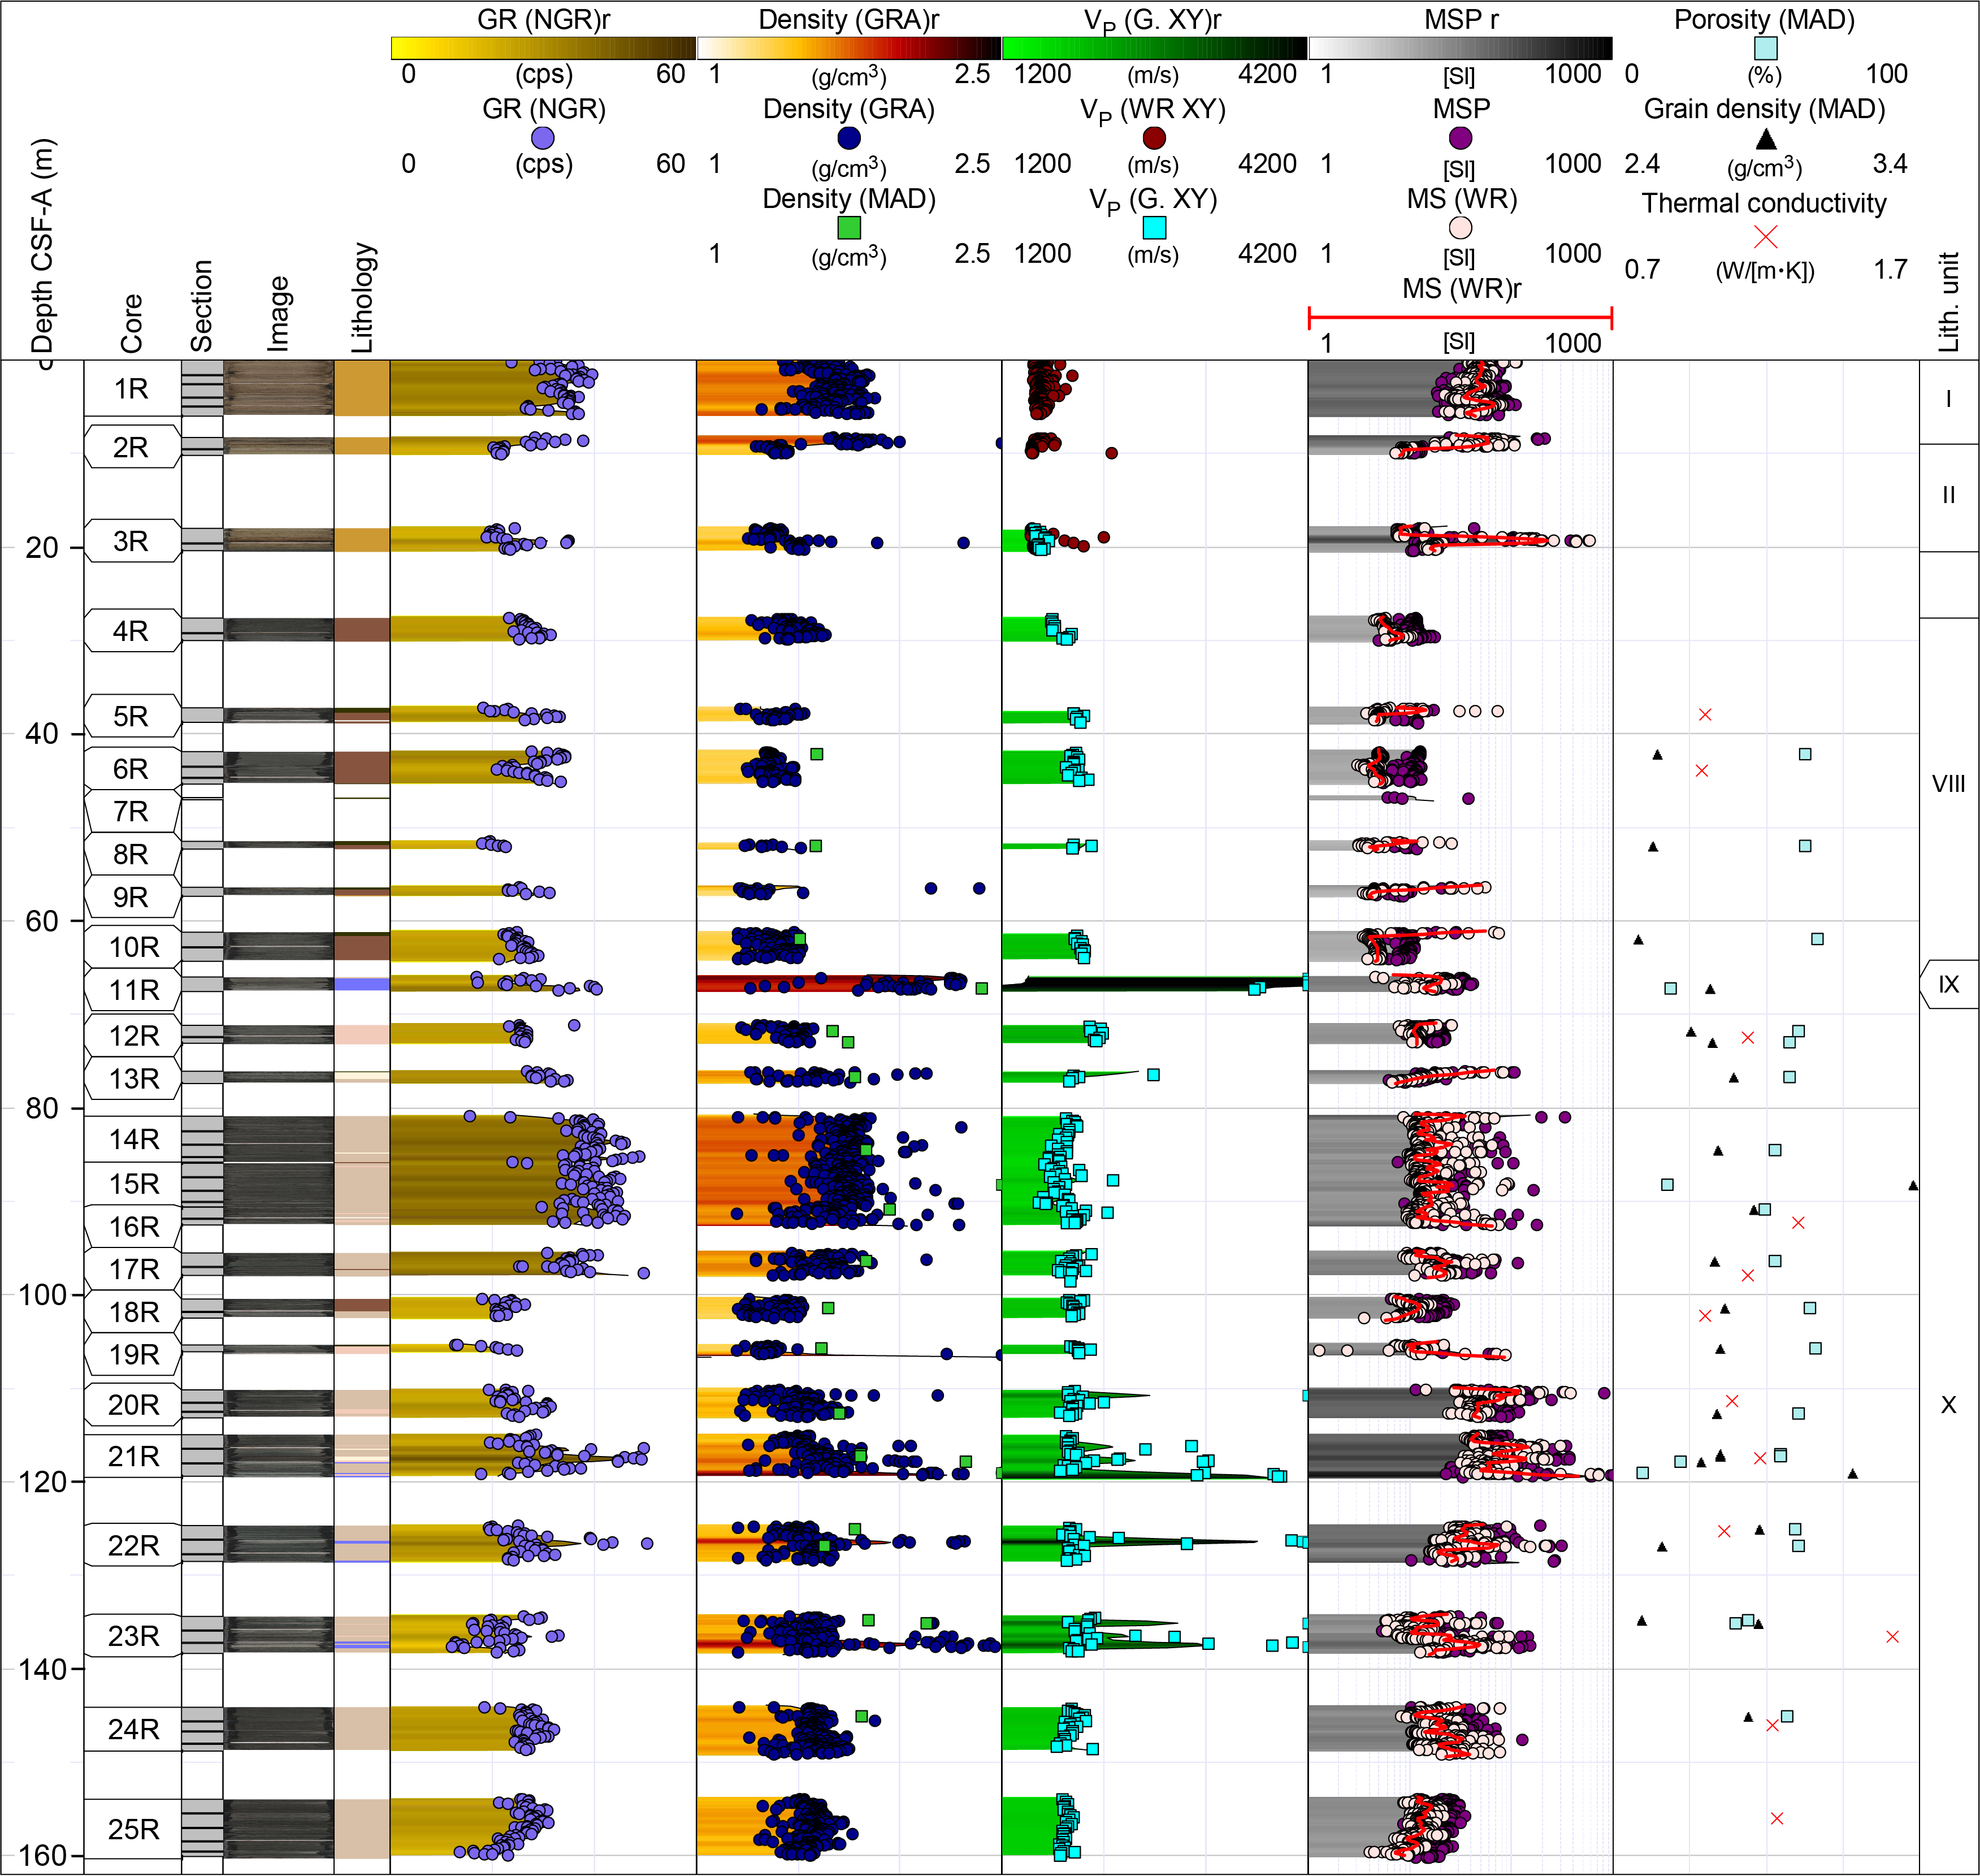
Figure F46. Physical properties, Hole U1570B.
Unit IX is a ~1 m thick limestone found at ~66 m CSF-A that is characterized by high P-wave velocity (mean = 4173 m/s), bulk density (mean = 2.05 g/cm3), and NGR (mean = 29.3 counts/s), although MS is relatively low (~25 × 10−5 [SI]). The lowermost Unit X, spanning ~67–163 m CSF-A, has generally high GRA bulk densities (mean = 1.61 g/cm3), P-wave velocities (mean = 2026 m/s), and NGR values (mean = 29.9 counts/s). Bulk densities are high across the interval spanning ~80–95 m CSF-A, which also features a drop in P-wave velocities and multiple spikes in NGR and MS. These variations in physical properties do not appear to correspond to a distinct unit; therefore, they may be indicative of the presence of ash layers.
A total of 23 MAD samples were collected from the recovered intervals. MAD bulk density is consistent with the WRMSL bulk density results. Grain densities range 2.48–3.38 g/cm3 (mean = 2.76 g/cm3), and porosities vary from 9% to 50%.
7.5. Hole U1570C
Hole U1570C is located 1072 m east of Hole U1570B and 700 m west of Hole U1570A. It penetrates four of the lithostratigraphic units identified in the area (see Lithostratigraphy; Figure F47). Units I and II are the same as in Hole U1569A, although much thinner. Unit I is ~35 m thick and returns similar high values of bulk density (mean = 1.72 g/cm3), P-wave velocity (mean = 1593 m/s), and NGR (mean = 31.9 counts/s). Recovery of Units II–VII was insufficient for representative physical properties analyses. Unit VIII, which starts at ~45 m CSF-A, features relatively constant physical properties that have the following mean values: bulk density = 1.45 g/cm3, P-wave velocity = 1577 m/s, MS = ~15 × 10−5 [SI], and NGR = 23.8 counts/s. All of these values are slightly lower than in Unit I. Although no lithologic change was described in the unit, different physical properties trends are observed between the upper and lower part from Core 396-U1570C-17R downcore. Here, MS scatter increases substantially and NGR increases by ~25 counts/s and remains consistent at this depth. Bulk density also increases to ~1.6 g/cm3 below the transition.
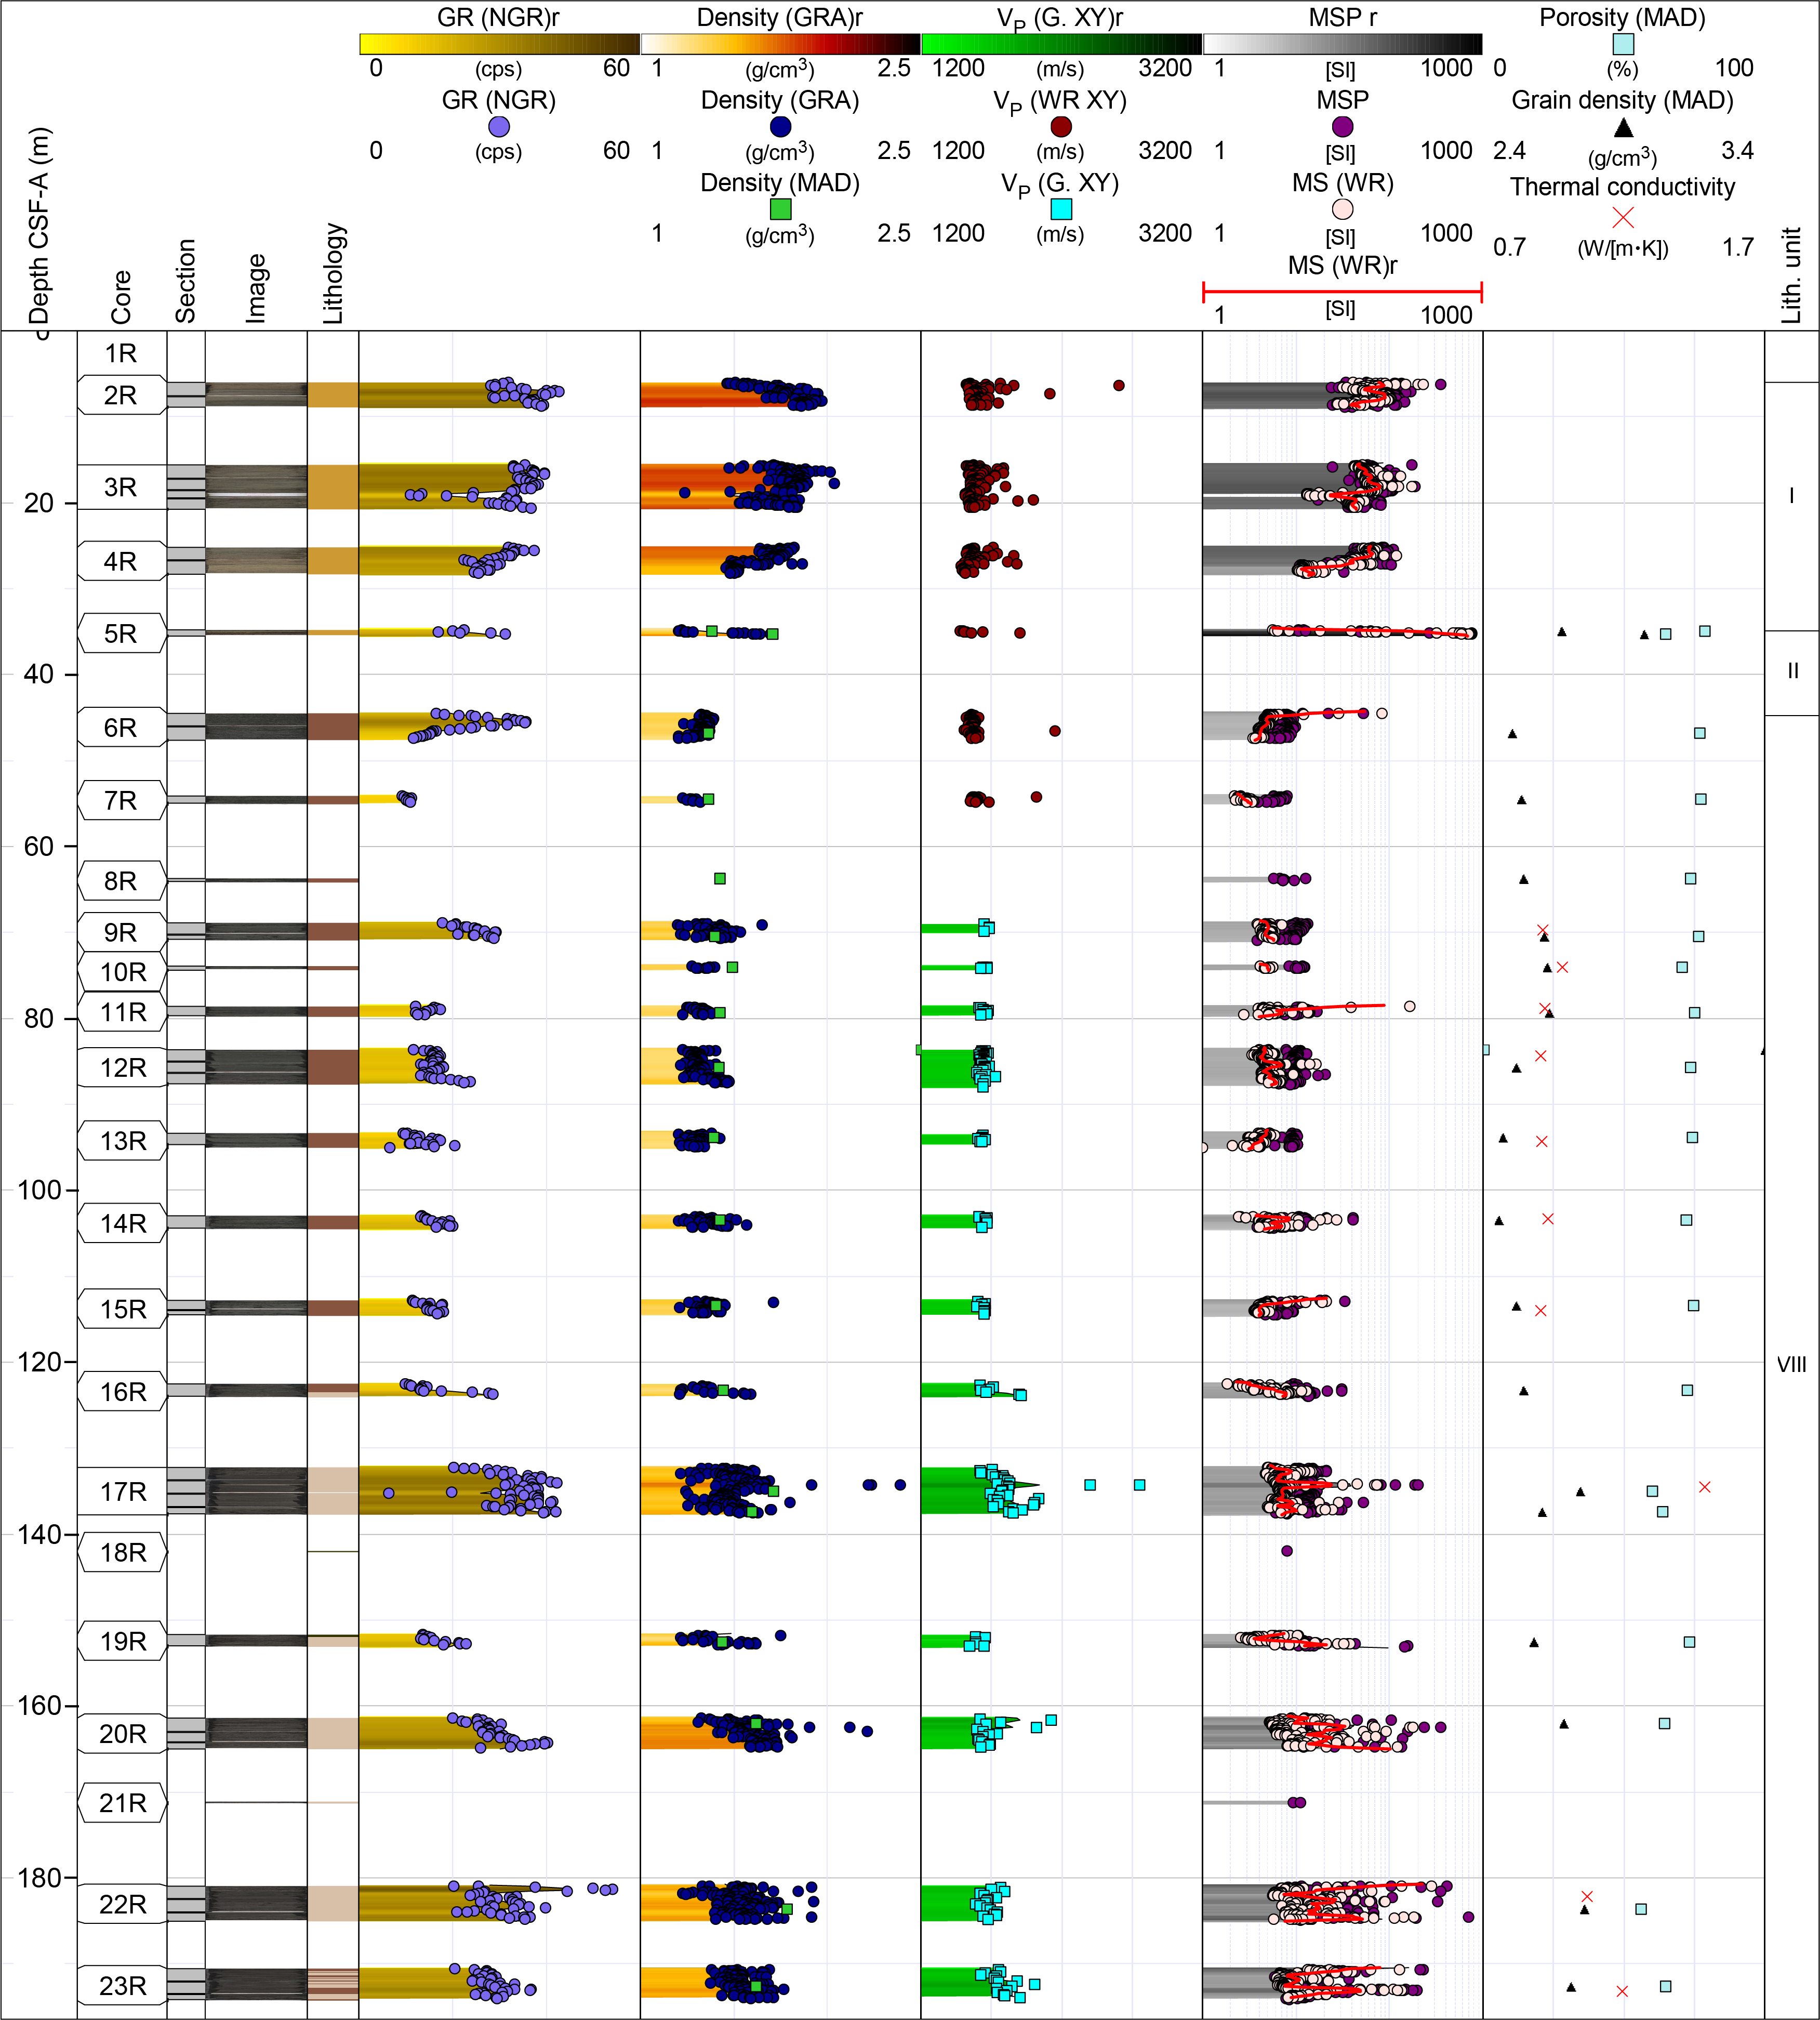
Figure F47. Physical properties, Hole U1570C.
A total of 18 MAD measurements were collected (12 in the uppermost three units and 7 in the underlying units). Bulk density of the Eocene and older section (below the uppermost three units) ranges 1.37–2.86 g/cm3 (local density outliers as high as 4.9 g/cm3 are linked to pyrite nodules, e.g., at 83.68 m CSF-A) (median = 1.32 g/cm3). The median grain density is 2.5 g/cm3, and porosity ranges 18%–79%. SHMG P-wave velocity measurements returned velocities in line with those recorded using the WRMSL. The average thermal conductivity is 1.02 W/m·K (n = 10).
7.6. Hole U1570D
Hole U1570D was the last to be drilled along the transect between Sites U1569 and U1570. It lies at a central location between Holes U1570C and U1570A. The recorded physical properties for Hole U1570D are shown in Figure F48. Because of low core recovery (25.25%), WRMSL data are mostly absent for the intervals covered by Units I–IV, and recovery only increases from the upper part of Subunit Va at ~96 m CSF-A.
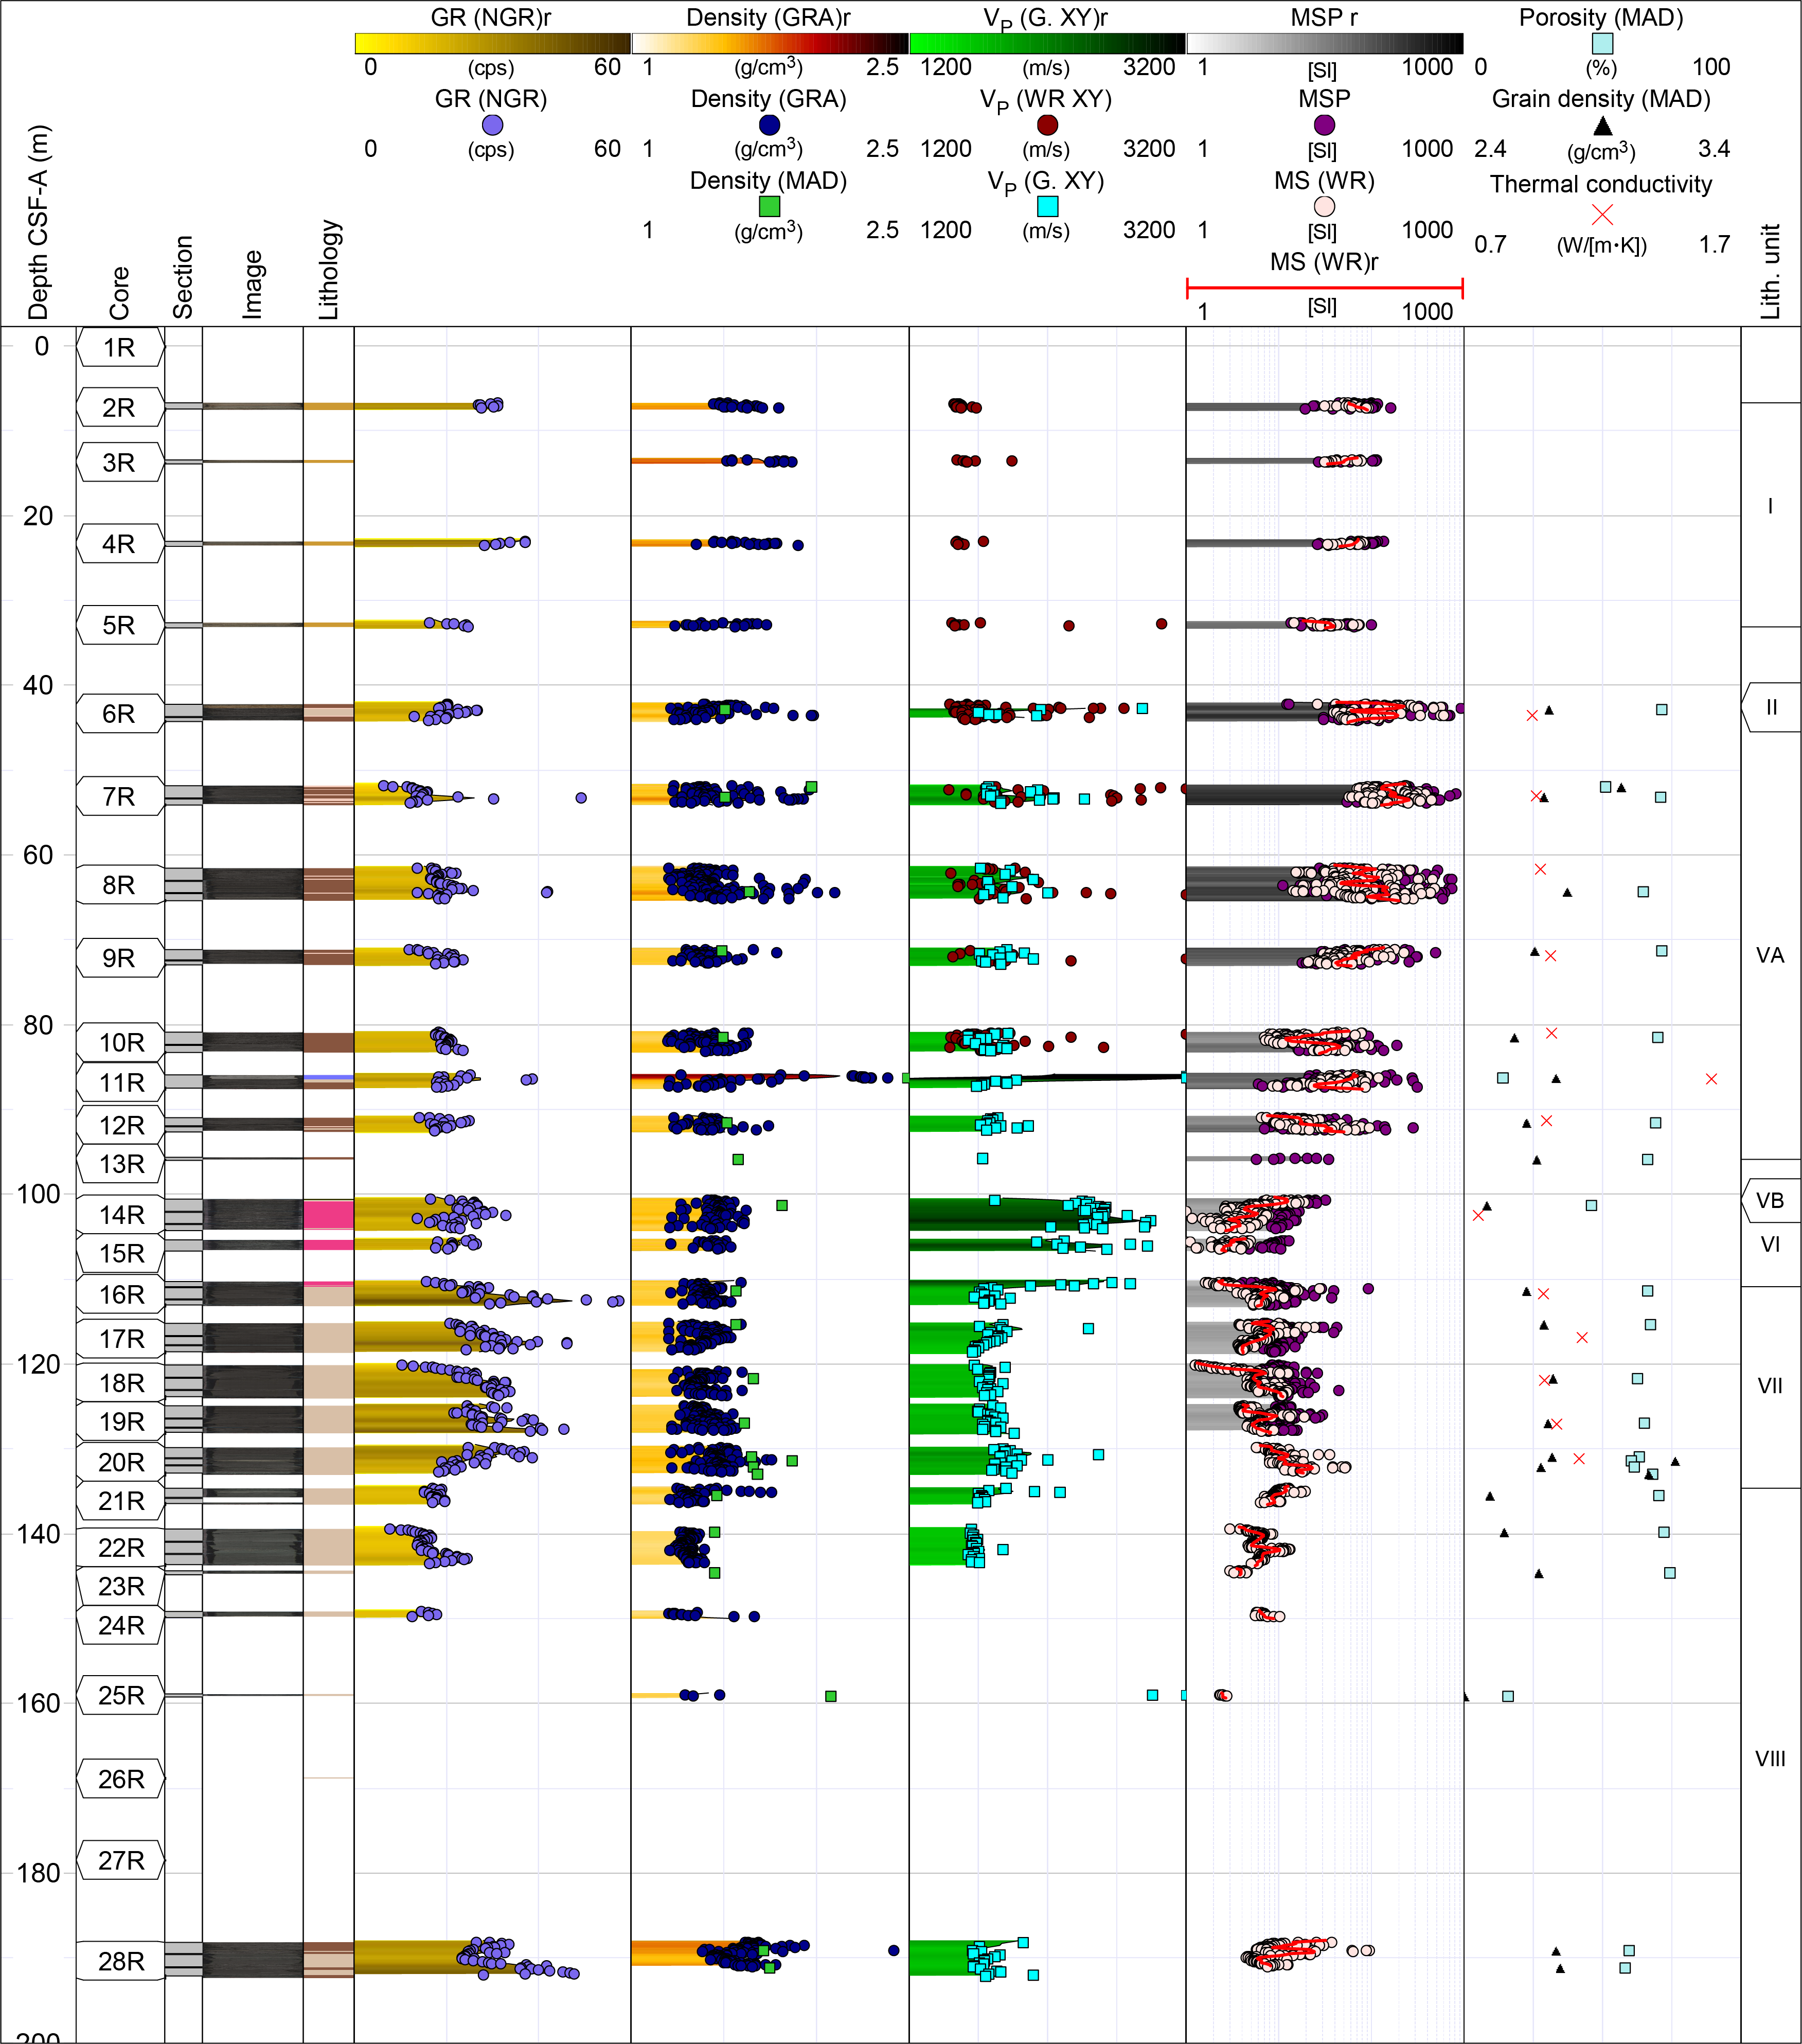
Figure F48. Physical properties, Hole U1570D.
Ash-rich Subunit Va features relatively high but scattered MS (average = ~90 × 10−5 [SI]) and P-wave velocities (average = ~1950 m/s). Bulk densities are uniform (average = ~1.47 g/cm3) throughout the unit. The thin interval covered by Subunit Vb is only 15 cm thick and only contains a minimal number of measurements. The few physical properties measurements taken indicate similar NGR, P-wave velocities, and bulk densities as in the subunit above, and MS is significantly lower with all values below ~32 × 10−5 [SI].
The top of the dacitic rocks at ~100 m CSF-A marks the end of a transition toward lower scatter and lower values in MS. The dacite unit features mean P-wave velocities of ~2500 m/s (Figure F49) similar in character to the unit observed in Hole U1570A. NGR throughout the intrusion is comparable to the NGR observed throughout Unit V. NGR is on average ~20 counts/s higher over the 110–135 m CSF-A interval covered by Unit VII. Average bulk density is ~1.45 g/cm3 across the dacite interval and Unit VII. A ~10 counts/s lower NGR and ~0.2 g/cm3 lower bulk density coincide with the start of Unit VIII. Poor recovery throughout Cores 396-U1570D-23R through 27R (<8%) prevents further trend analysis.
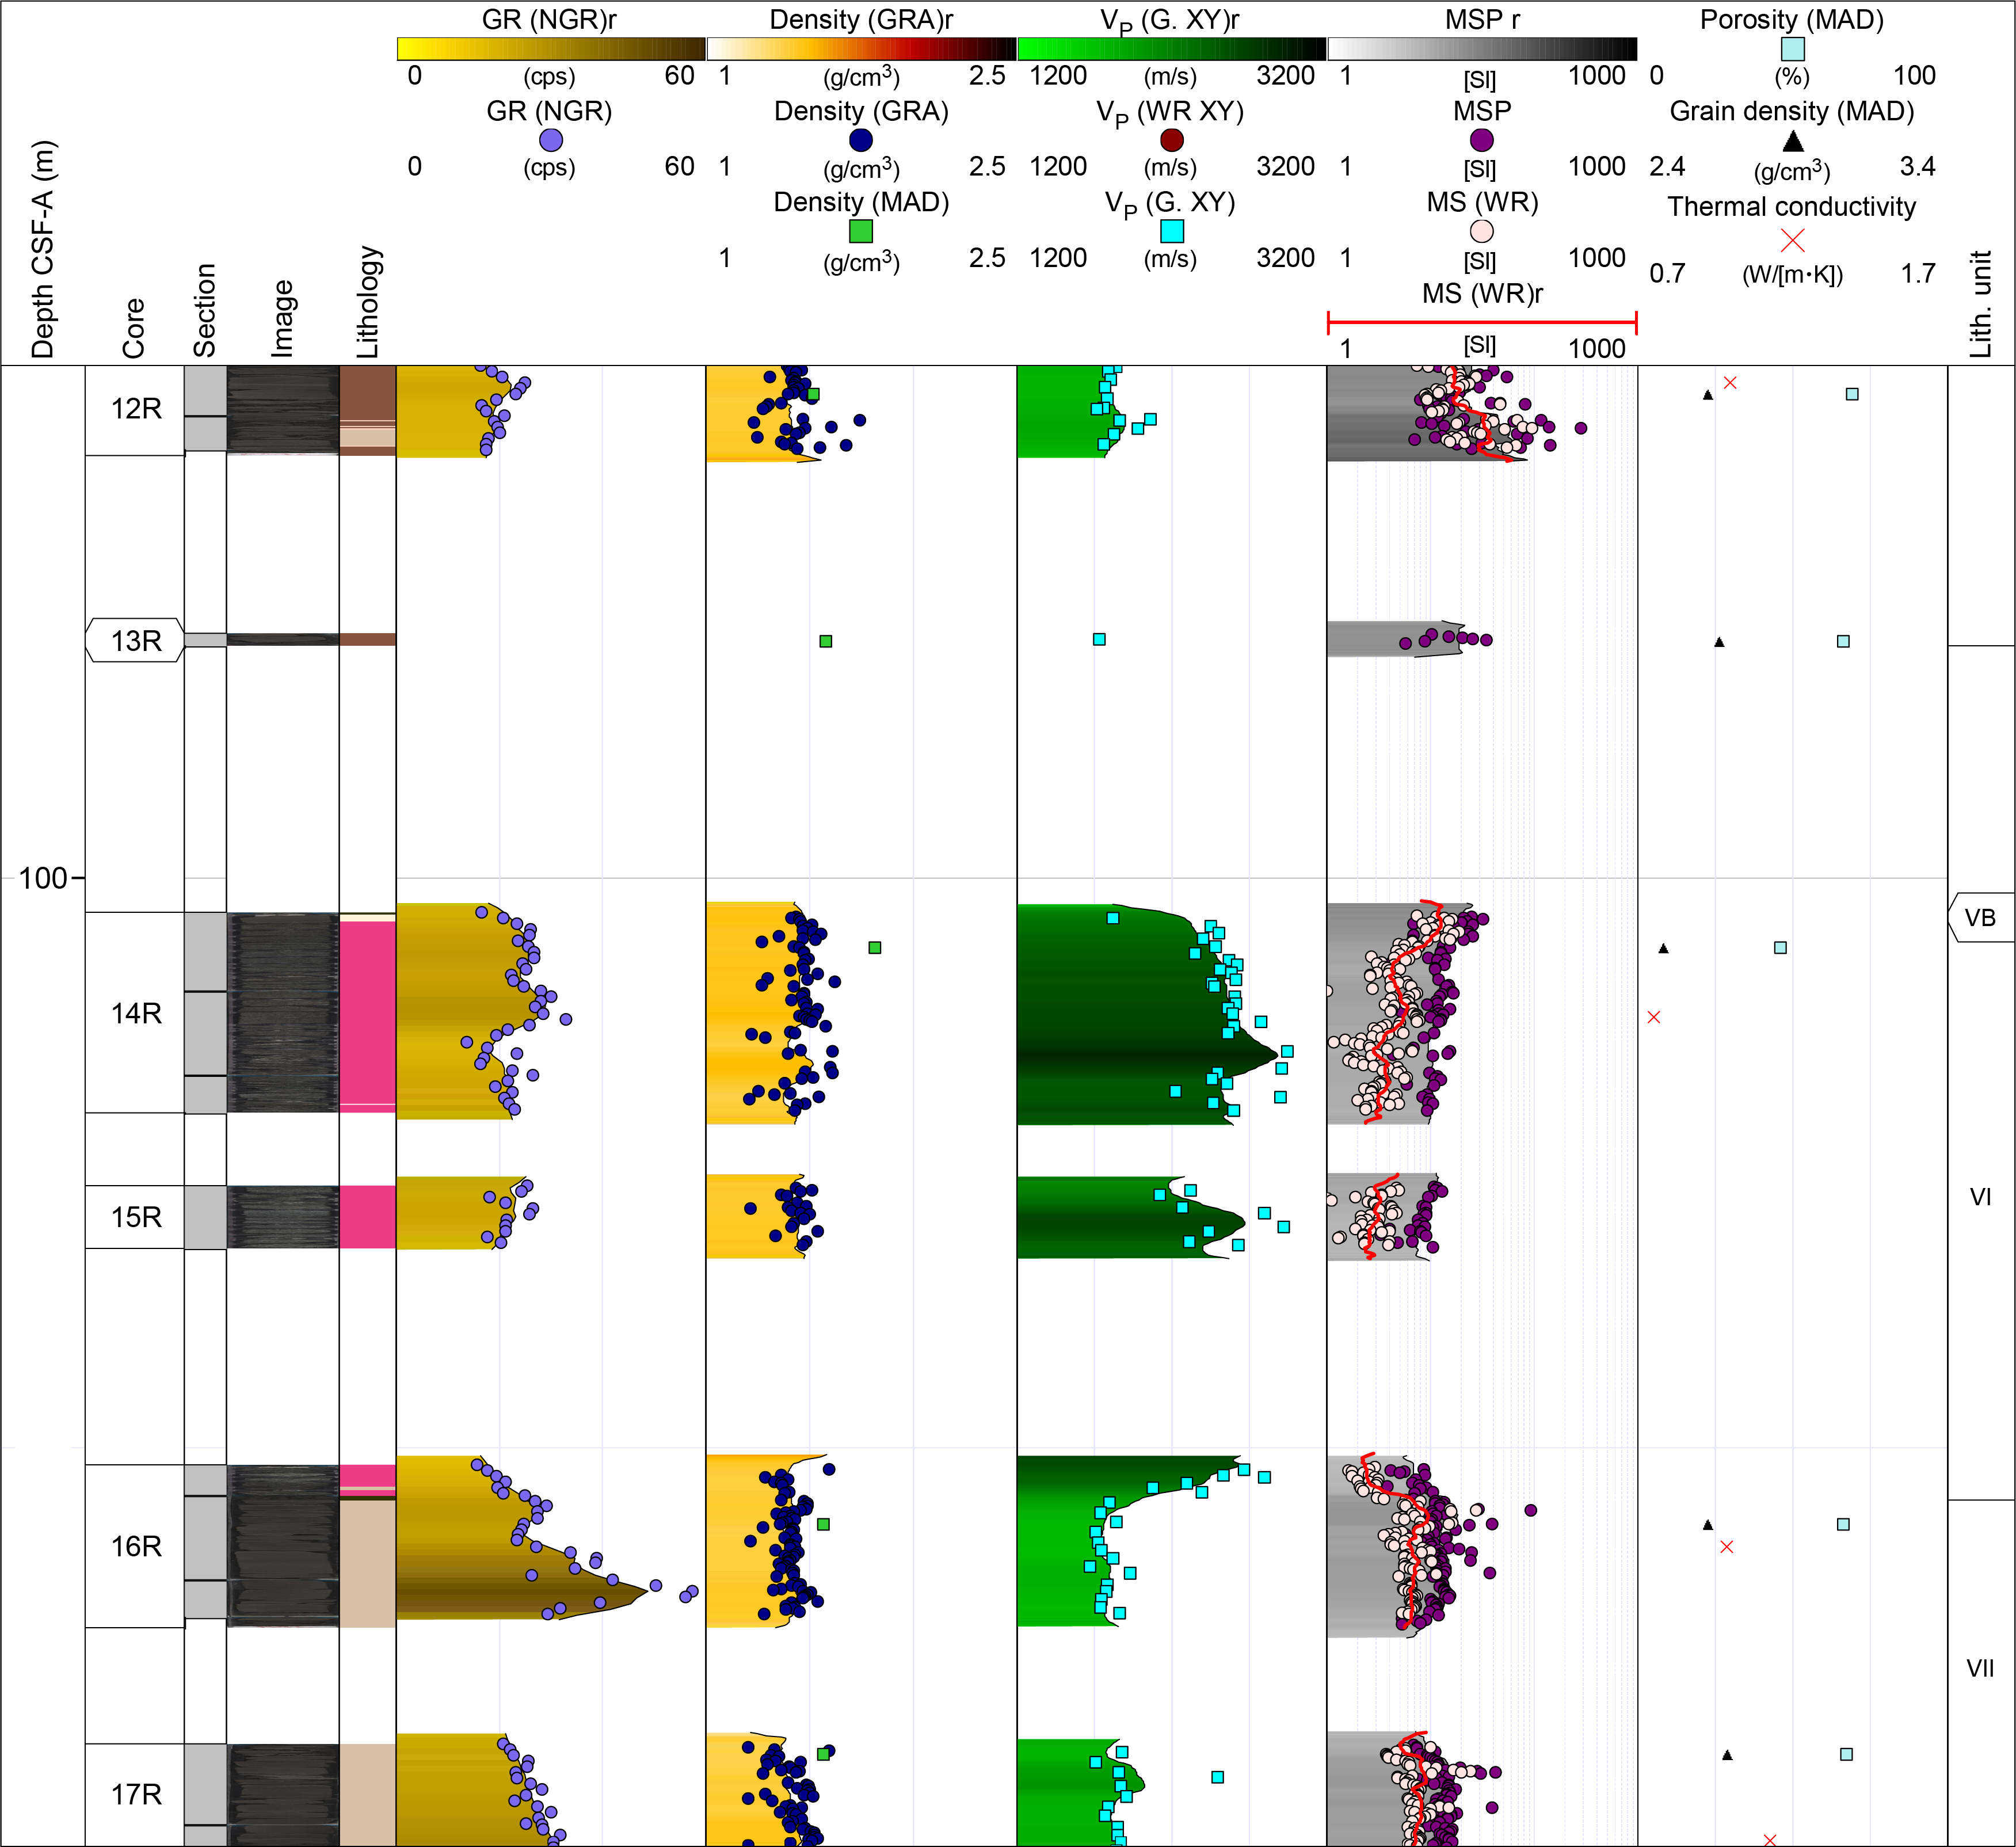
Figure F49. Dacite intrusion, Hole U1570D.
A total of 23 discrete samples were collected for MAD measurements from Units V–VIII. MAD bulk densities vary between 1.45 and 2.49 g/cm3. They are slightly higher than those recorded using the WRMSL GRA bulk density instrument that relates to the liner corrections that should be applied (see Physical properties in the Expedition 396 methods chapter [Planke et al., 2023a]). Thermal conductivity was measured for 16 samples from the same interval and ranges 0.75–1.59 W/(m·K).
7.7. Lithostratigraphic unit summaries
The following description combines data from across the five boreholes at Sites U1569 and U1570. Table T23 provides a summary of the main physical properties for the 10 defined lithostratigraphic units that generally feature distinct physical properties signatures. Across the five holes, 159 discrete MAD samples and 1344 P-wave velocity measurements were made on discrete samples to constrain and supplement automated measurements on the WRMSL and Section Half Multisensor Logger.
Unit I consists of Pleistocene–Holocene glacial and interglacial deposits. It thins from 77.8 m in Hole U1569A to 8.96 m in Hole U1570B. Unit I features relatively high bulk densities of 1.72 g/cm3, MS values of ~65 × 10−5 [SI], and NGR of 36 counts/s. P-wave velocities are roughly in line with the average across all units with mean values for WRMSL, SHMG, PWC, and PWB (z) measurements all falling within the range of 1500–1600 m/s.
Unit II is characterized by a gradual decrease in GRA bulk densities and NGR to 1.47 g/cm3 and 28.5 counts/s, respectively. The lowest MS values and P-wave velocities are measured for this unit, featuring minimal variation around the respective averages of ~20 × 10−5 [SI] and ~1570 m/s.
Unit III reverses the downward trend in MS, P-wave velocity, and bulk densities that define the overlying units. Only NGR remains low at ~20 counts/s, whereas slightly increased MS scatter marks the beginning of a multiunit interval with increased MS values that increase throughout Units IV and V.
Claystone-dominated, mid-Early Eocene Unit IV has bulk densities of ~1.57 g/cm3 that are closer to the multiunit average. As with Unit III, Unit IV is only observed in Hole U1569A. P-wave velocities are relatively low (~1520 m/s), although they are still higher than the lowermost part of Unit III. MS values are ~90 × 10−5 [SI] throughout the unit, which overlies ash-rich layers with higher MS values in Unit V. These are accompanied by deviations an order of magnitude higher for the MS data, the baseline of which is around the mean of ~100 × 10−5 [SI].
Subunits Va and Vb share increased P-wave velocities and MS values that are related to the ash layers. P-wave velocities in particular are ~400 m/s higher than those observed for any of the overlying units. GRA bulk densities are significantly lower (mean = ~1.45 g/cm3) than those recorded for the overlying Unit IV (mean = 1.57 g/cm3). Minor differences exist between Subunits Va and Vb. Subunit Va features an increase in the extent of MS scattering, slightly higher P-wave velocities, and slightly lower NGR. The opposite holds true for Subunit Vb. NGR increases downward throughout Unit VII.
Unit VI consists of dacites and is only encountered in Holes U1570A and U1570D. It has substantially higher P-wave velocity values, reaching as high as ~3000 m/s (average = ~2500 m/s). NGR is comparable to the surrounding units, and MS values are generally low (~10 × 10−5 [SI]).
Unit VII lies directly below the dacitic unit and is dominated by parallel-laminated, ash-rich mudstone sequences. GRA bulk densities are slightly higher than in the overlying unit (1.51 versus 1.43 g/cm3), and MS spikes are present at some depths, although there are not as many nor are the peaks as high as in the overlying units. This is interpreted to be a result of the altered state of the ash layers. NGR ranges ~10 to ~80 counts/s.
Unit VIII is found in all holes besides Hole U1570A, covering the transition from the MS highs in the units above to the much lower baseline MS values in the units below. The GRA bulk density of Unit VIII varies from 1.2 to 2.75 g/cm3 (average = 1.48 g/cm3). P-wave velocities reach 4116 m/s for the carbonate-cemented siltstones, the average WRMSL value in this unit is 1577 m/s, and the average SHMG value is 1770 m/s.
Unit IX (top = 66.09 m CSF-A) comprises a ~130 cm thick limestone that was penetrated only in Hole U1570B. This lithostratigraphic unit is characterized by distinct physical properties. A single MAD sample has a bulk density of 2.4 g/cm3 and a porosity of 19%. This is significantly different from the adjacent layers. The averaged acoustic velocity measured using the SHMG is 4173 m/s, and the MS of this unit is ~30 × 10−5 [SI].
Unit X was penetrated in Hole U1570B only. It consists of a mudstone with ash layers alternating with the ash-rich carbonates. The average GRA bulk density of this layer is 1.61 g/cm3, and P-wave velocity varies from 1560 to 5119 m/s over the limestone with ash intervals. NGR ranges 12–50.4 counts/s (mean = 29.9 counts/s).
7.8. Summary
The profile of five boreholes at Sites U1569 (Hole U1569A) and U1570 (Holes U1570A–U1570D) allowed the identification of 10 lithostratigraphic units linked in most cases to distinct physical properties changes. The primary target of Sites U1569 and U1570 was to investigate the PETM, which forms a relatively high NGR (mean = 30 counts/s) interval (Unit VII) with lower MS than the surrounding strata with occasional spikes linked to volcanic ashes. The PETM sedimentary strata physical properties outside of these changes are conformable with marine basin deposition and relatively restricted postemplacement compaction.
A striking feature of the penetrated sedimentary sequences are the physical properties associated with abundant ash layers, best seen in Eocene Unit V. The dominantly basaltic ash layers typically return higher P-wave velocities (>2000 m/s compared to basin sediments <2000 m/s), MS values, bulk densities, and grain densities than the surrounding claystone-dominated sedimentary sequences. Another striking feature of the ash bed sequences is that the MS and P-wave velocity signatures of the ash beds begin to reduce with depth in Subunit Vb, and these changes appear to be provisionally linked to increasing alteration of the ash layers with depth.
Garnet-cordierite-graphite-bearing dacitic shallow igneous sheets (Unit VI) are penetrated at Site U1570 (Holes U1570A and U1570D). These igneous units return increased P-wave velocities compared to their surrounding sediments; however, at only ~2500 m/s average P-wave velocity, they are slower than would be expected for fresh crystalline rock, consistent with core observations of alteration. Bulk density of the units at ~1.45 g/cm3 are not high and overlap with the surrounding sediments, although MS also remains low. Isolated limestone stringers are identified in Unit IX and have some of the highest recorded P-wave velocities >5000 m/s at Sites U1569 and U1570.
8. Downhole measurements
On the Mimir High, wireline logging was conducted in Holes U1569A and U1570D to 404.6 and 200 m drilling depth below seafloor (DSF), respectively.
After coring was completed, Hole U1569A was prepared for logging and the drill pipe was pulled back to a logging depth of 84 m DSF. Wireline logging with the triple combo and FMS-sonic tool strings were planned for this hole; however, an obstruction was encountered at 127.4 m wireline log depth below seafloor (WSF) during the first deployment of the triple combo. Even after several attempts to break through, the logging tool could not be advanced. This led to a very limited open hole log data acquisition and ended further logging operations at Site U1569 (Table T24).
After coring operations were concluded in Hole U1570D, the hole was conditioned and the drill string was raised to 72 mbsf for wireline logging. Two logging runs each were performed using the triple combo and FMS-sonic tool strings (Table T25). Data from the main logging run is presented in this section unless otherwise indicated. The logs were also run while the tool strings descended into the well with calipers closed. Gamma ray (GR) was logged through the drill pipe to identify the seafloor, which shows a clear increase in GR response that was used to zero all logging runs to seafloor.
Wireline logging operations were successful in Hole U1570D, with a total open hole logged interval of ~117 m. However, depending on sensor position within the tool string, not all intervals were measured by all the tools. Data were sent for processing, depth matching, and data quality check to Columbia University’s Lamont-Doherty Earth Observatory, and the processed data were returned to the onboard logging team. The depth scale for all wireline data is presented as wireline log matched depth below seafloor (WMSF) in meters, whereas the associated core data uses the CSF-A depth scale in meters. No depth matching between core and wireline data is presented in this section, and comparisons between data sets are therefore only indicative.
8.1. Logging units
The six logging units defined in Hole U1570D are constrained by a combination of lithostratigraphy, physical properties, and wireline data (see Lithostratigraphy and Physical properties). Logging units are restricted to broad GR-based inferences above the drill string casing. In the main open hole logged interval in Hole U1570D, the wireline properties reveal several transitions that correspond closely to the lithostratigraphic units. Because of the limited recovery of wireline data in Hole U1569A and limited clear logging data variations in the recovered GR and resistivity measurements, no logging units are defined in Hole U1569A.
8.1.1 Hole U1569A
For completeness, a summary of the wireline traces for the short open hole logged interval in Hole U1569A along with the GR are presented in Figure F50. GR recorded within the casing reveals minor nonsystematic fluctuations around ~15 gAPI, whereas the open hole interval fluctuates between 40 and 50 gAPI. Spectral GR components K, Th, and U reveal similar trends except for the peak at ~89 m, where U is notably reduced compared to Th and K. Resistivity data reveal no systematic change over the recorded interval and cannot be robustly appraised because of the lack of caliper control.
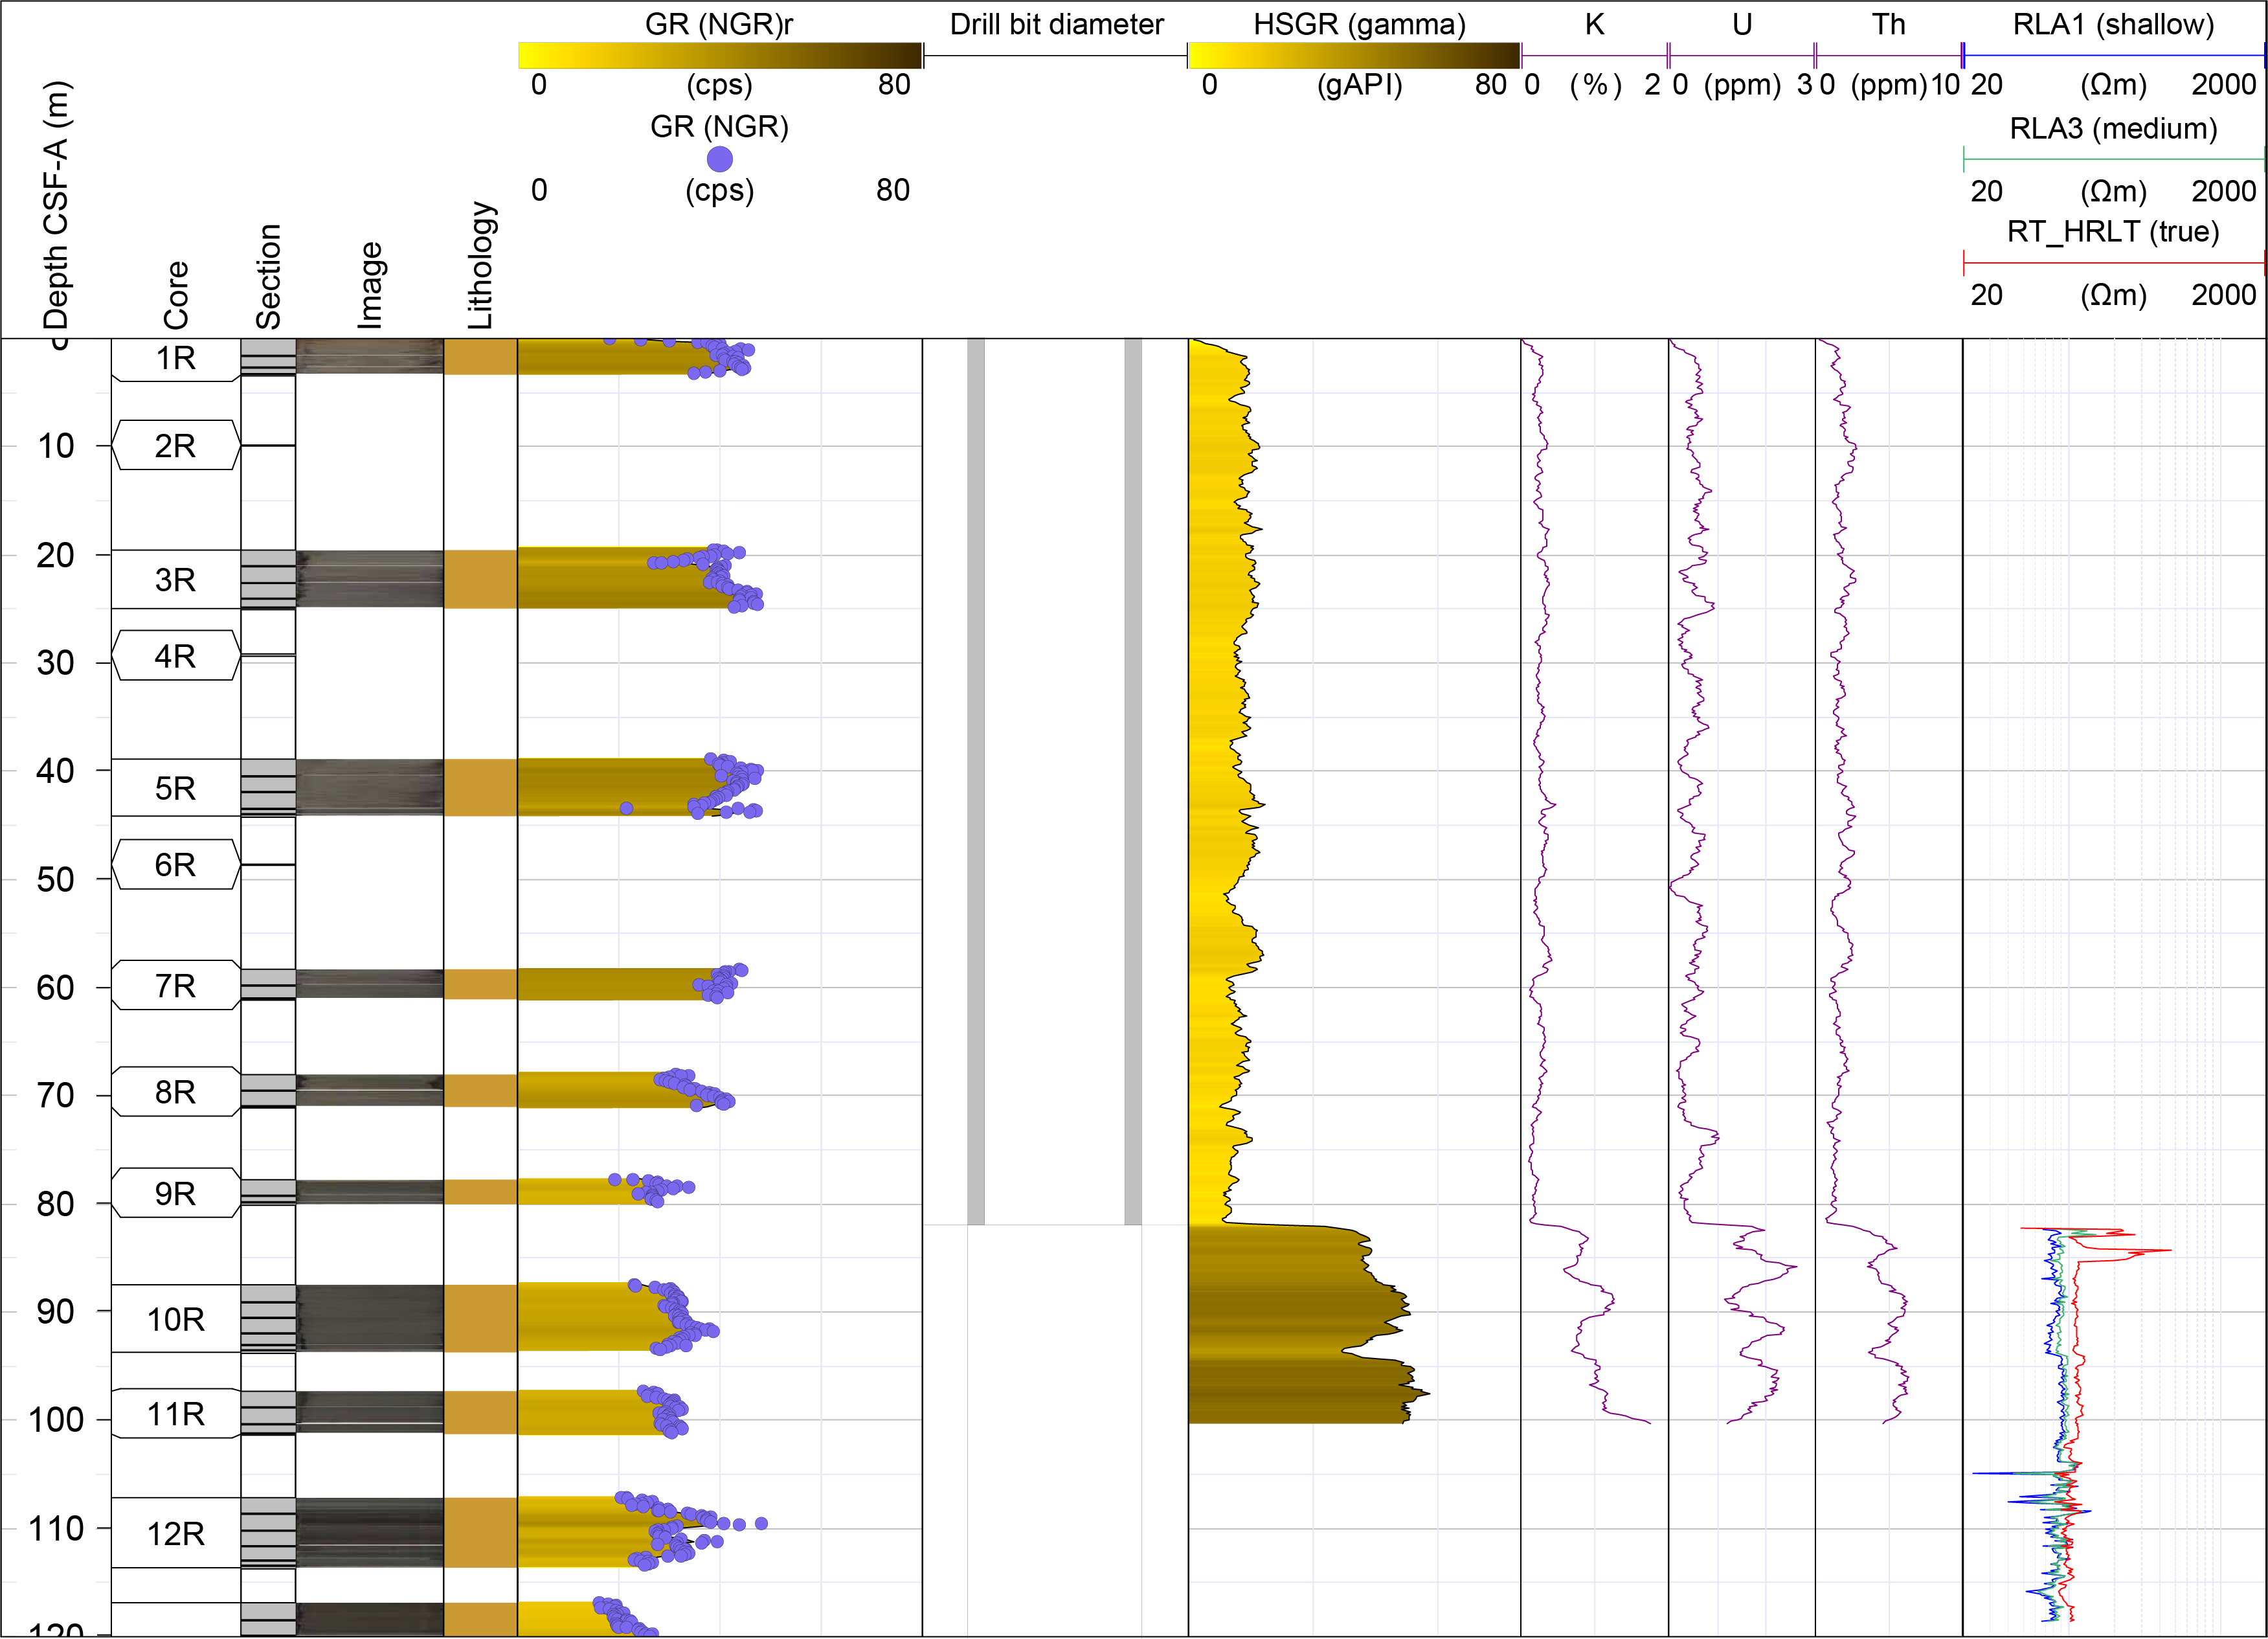
Figure F50. Wireline and GR logging, Hole U1570D.
8.1.2. Hole U1570D
A summary of selected wireline traces for the main open hole–logged interval in Hole U1570D are presented in Figure F51. In general, the borehole remained in reasonably good condition during logging, and the diameter dominantly remained <7 cm diameter expansion relative to the drill bit outer diameter (~25.1 cm). Few isolated washouts of greater magnitude were observed (e.g., ~151 m WMSF). GR, MS, and borehole caliper wireline traces are presented alongside core-derived measurements in Figure F52. The highly attenuated nature of wireline GR run behind the casing to the seafloor is clearly seen at ~72 m WMSF. In Figure F53, bulk density (RHOM), P-wave velocity (VP), photoelectric effect (PEF), and acoustic impedance (AI) (density × VP) are presented alongside core-derived measurements for the open hole section in Hole U1570D. The FMS image log data for the borehole are presented alongside the resistivity and GR in Figure F54. Generally good imaging was achieved over an open hole interval of ~110 m reaching the bottom of the logged hole interval.
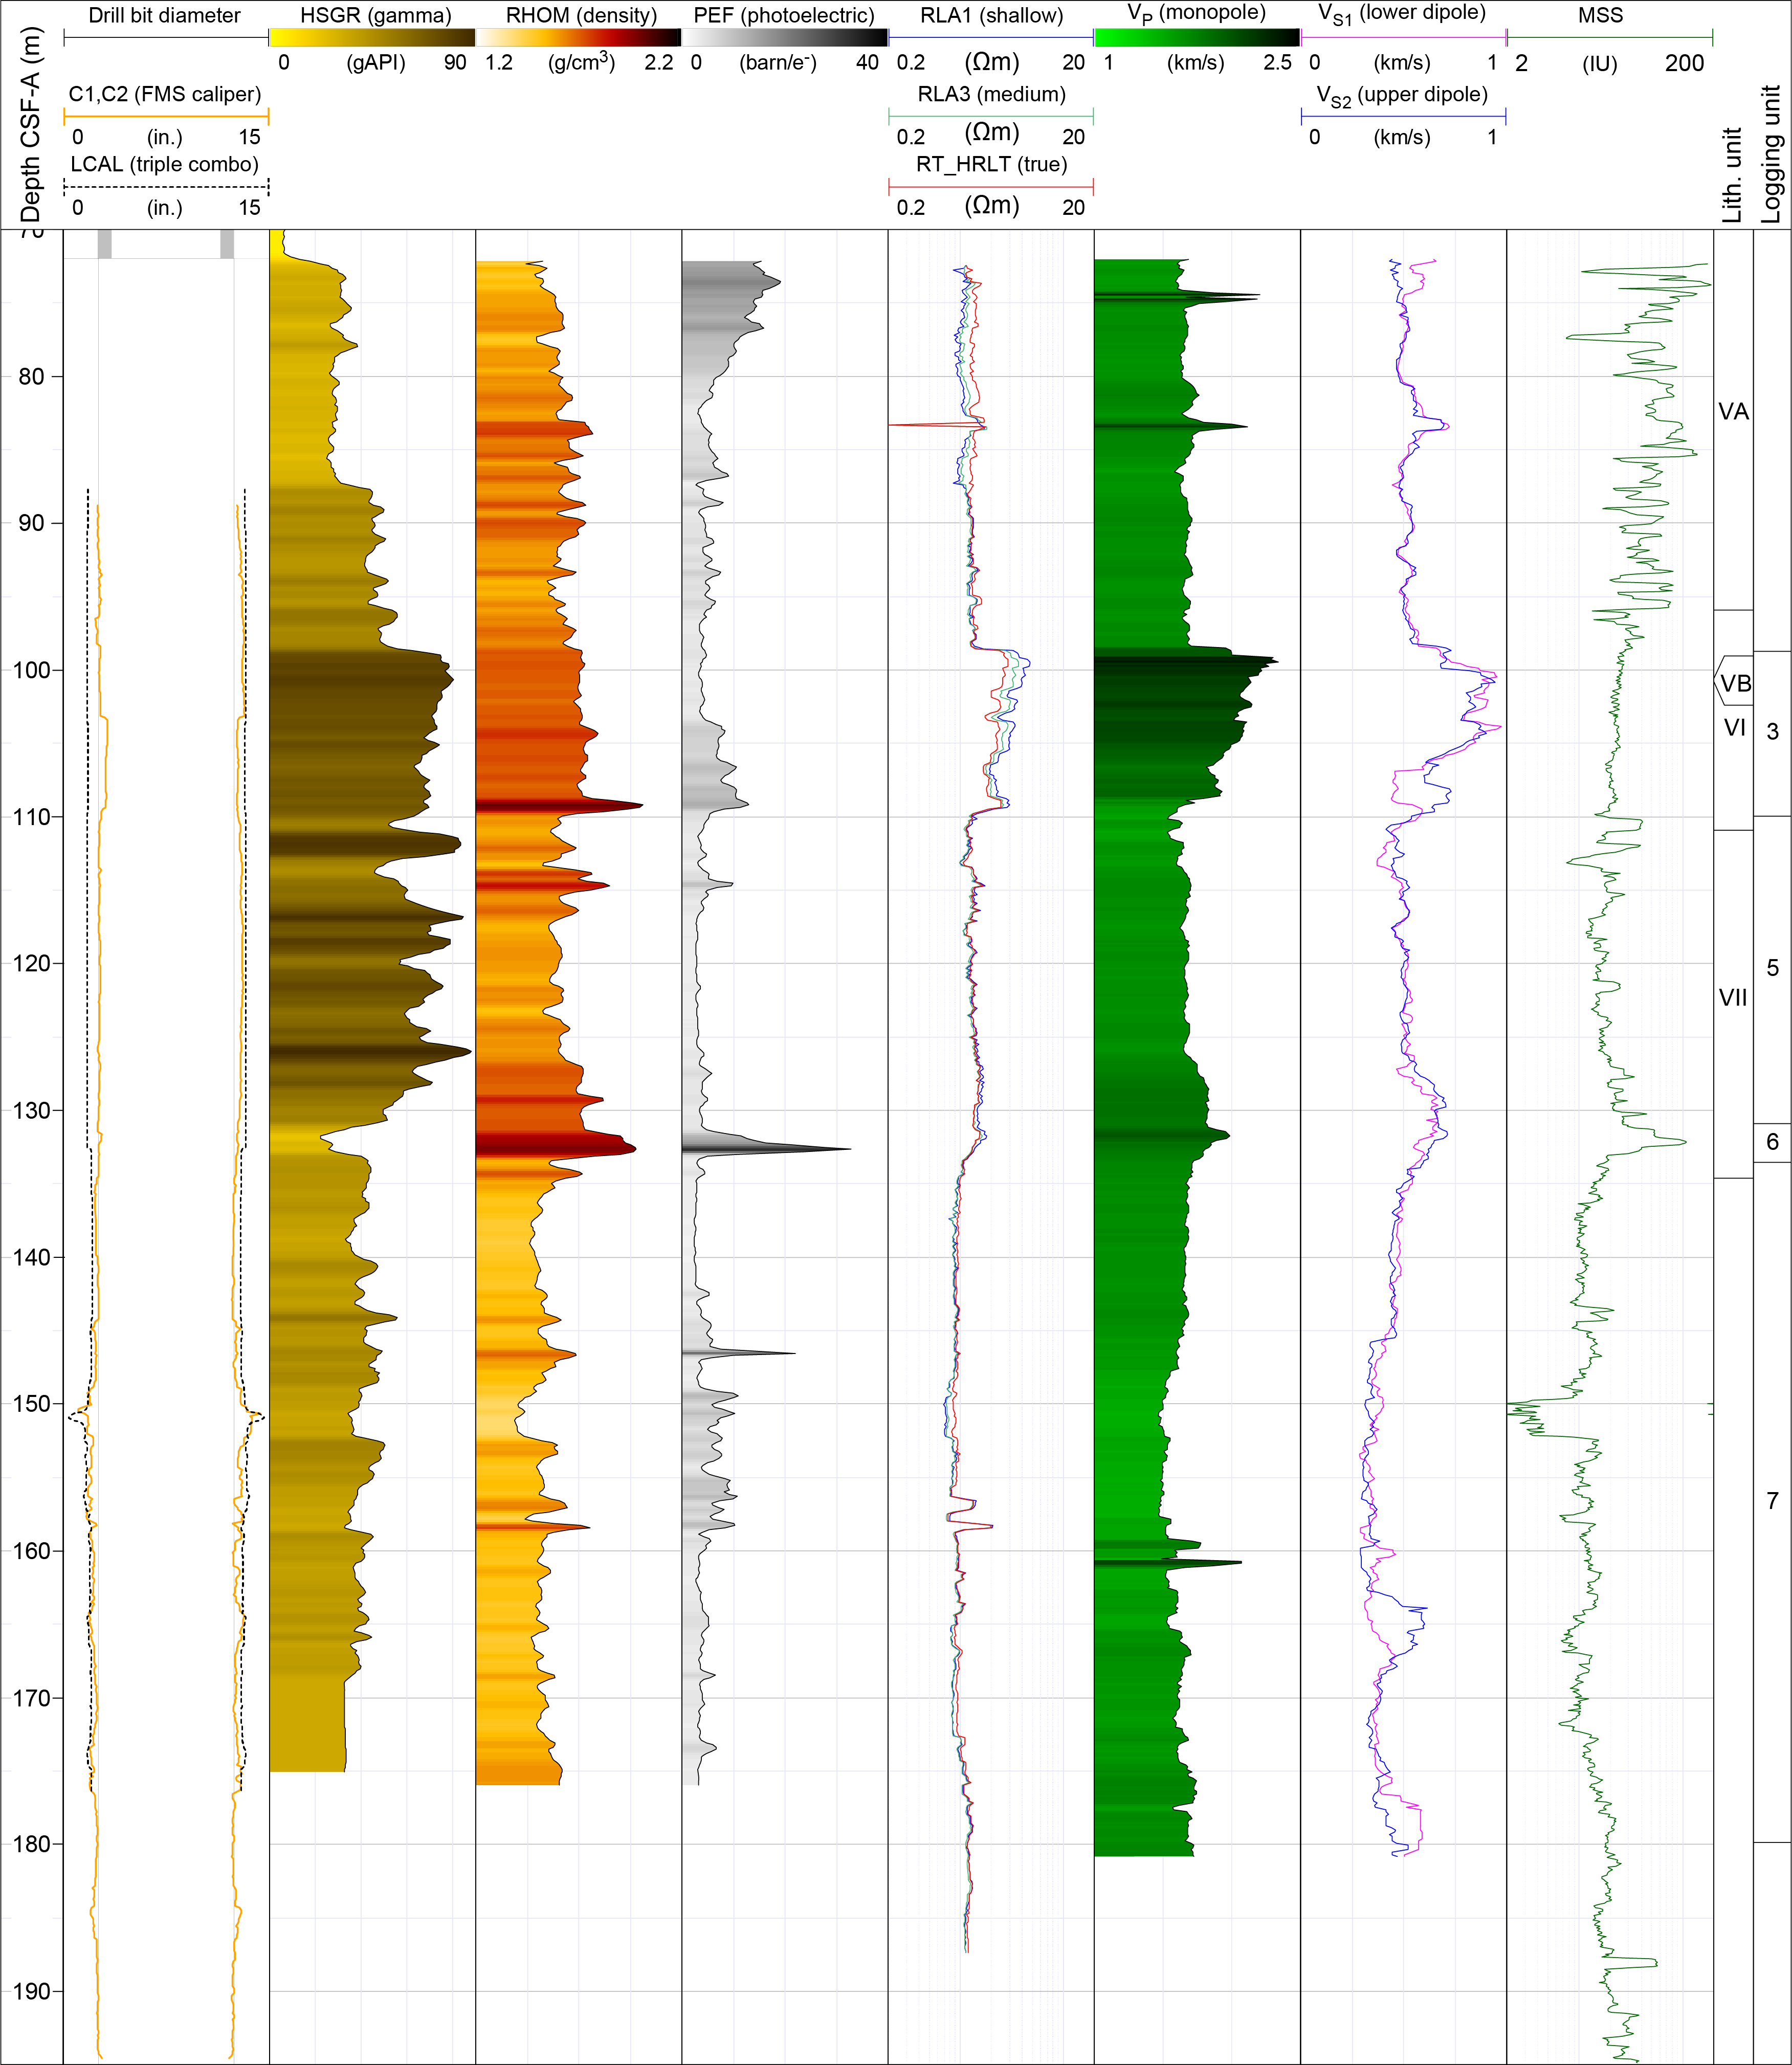
Figure F51. Wireline logging, Hole U1570D.
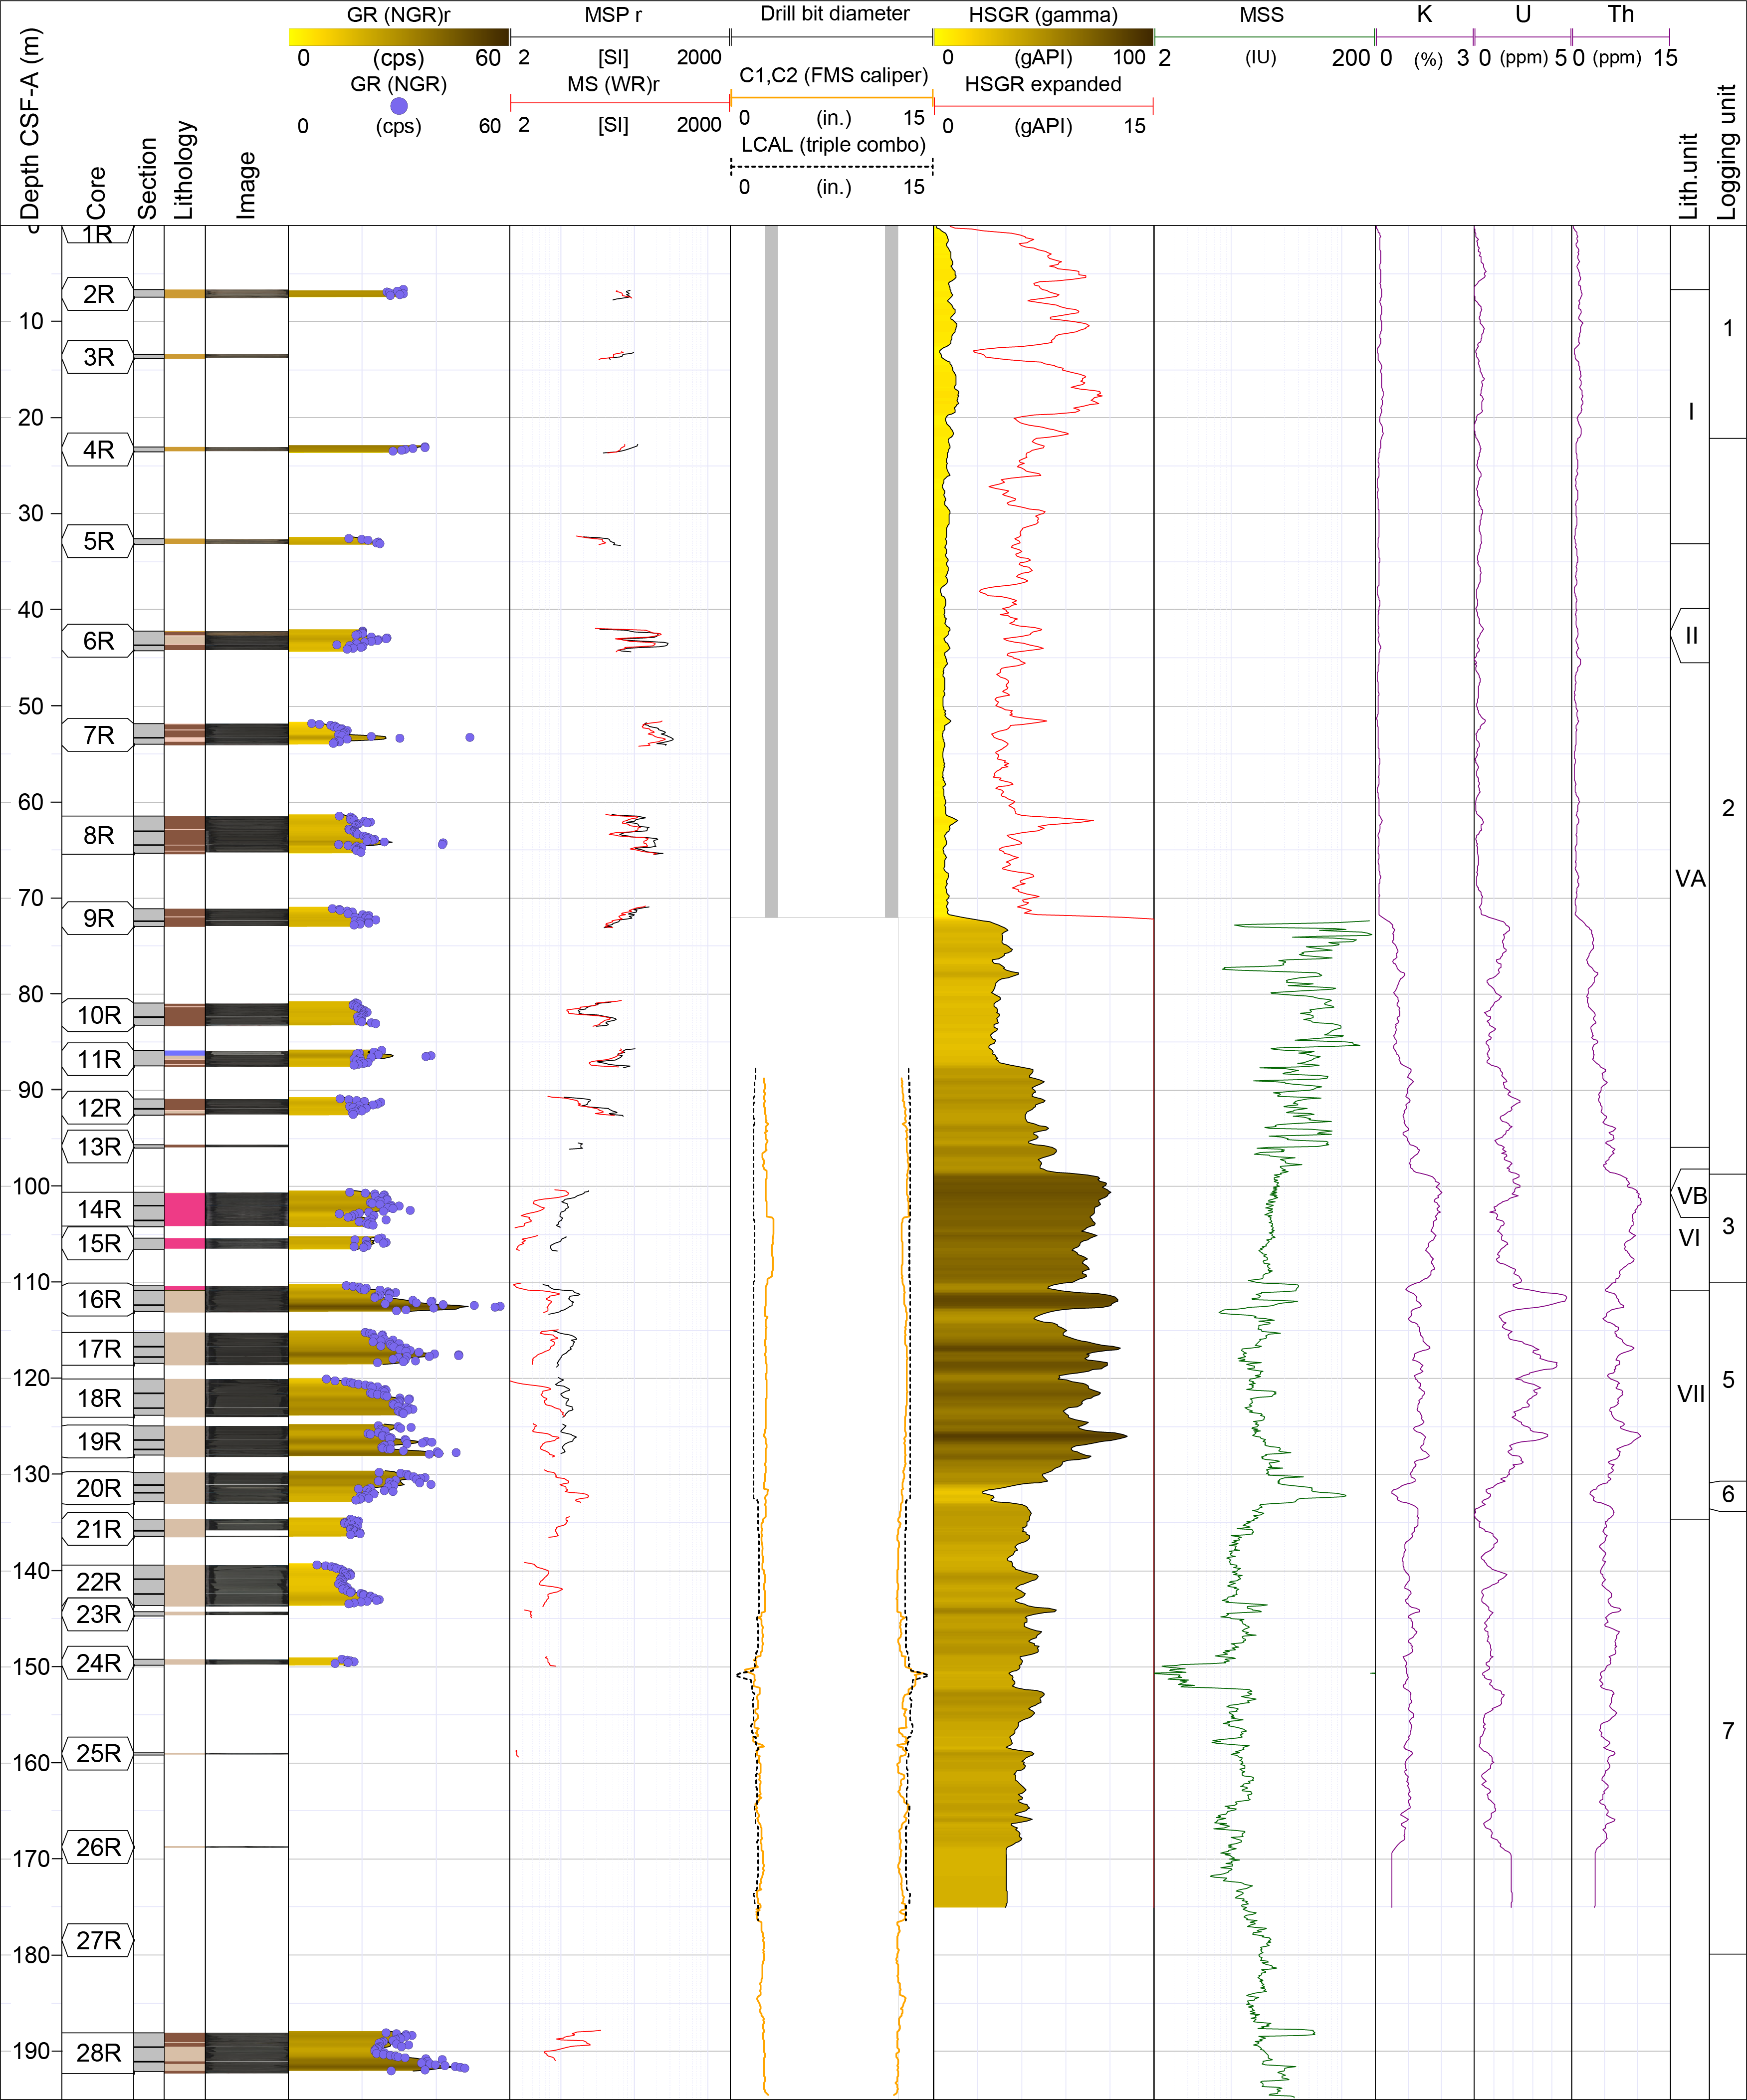
Figure F52. Wireline GR and MS, Hole U1569A.
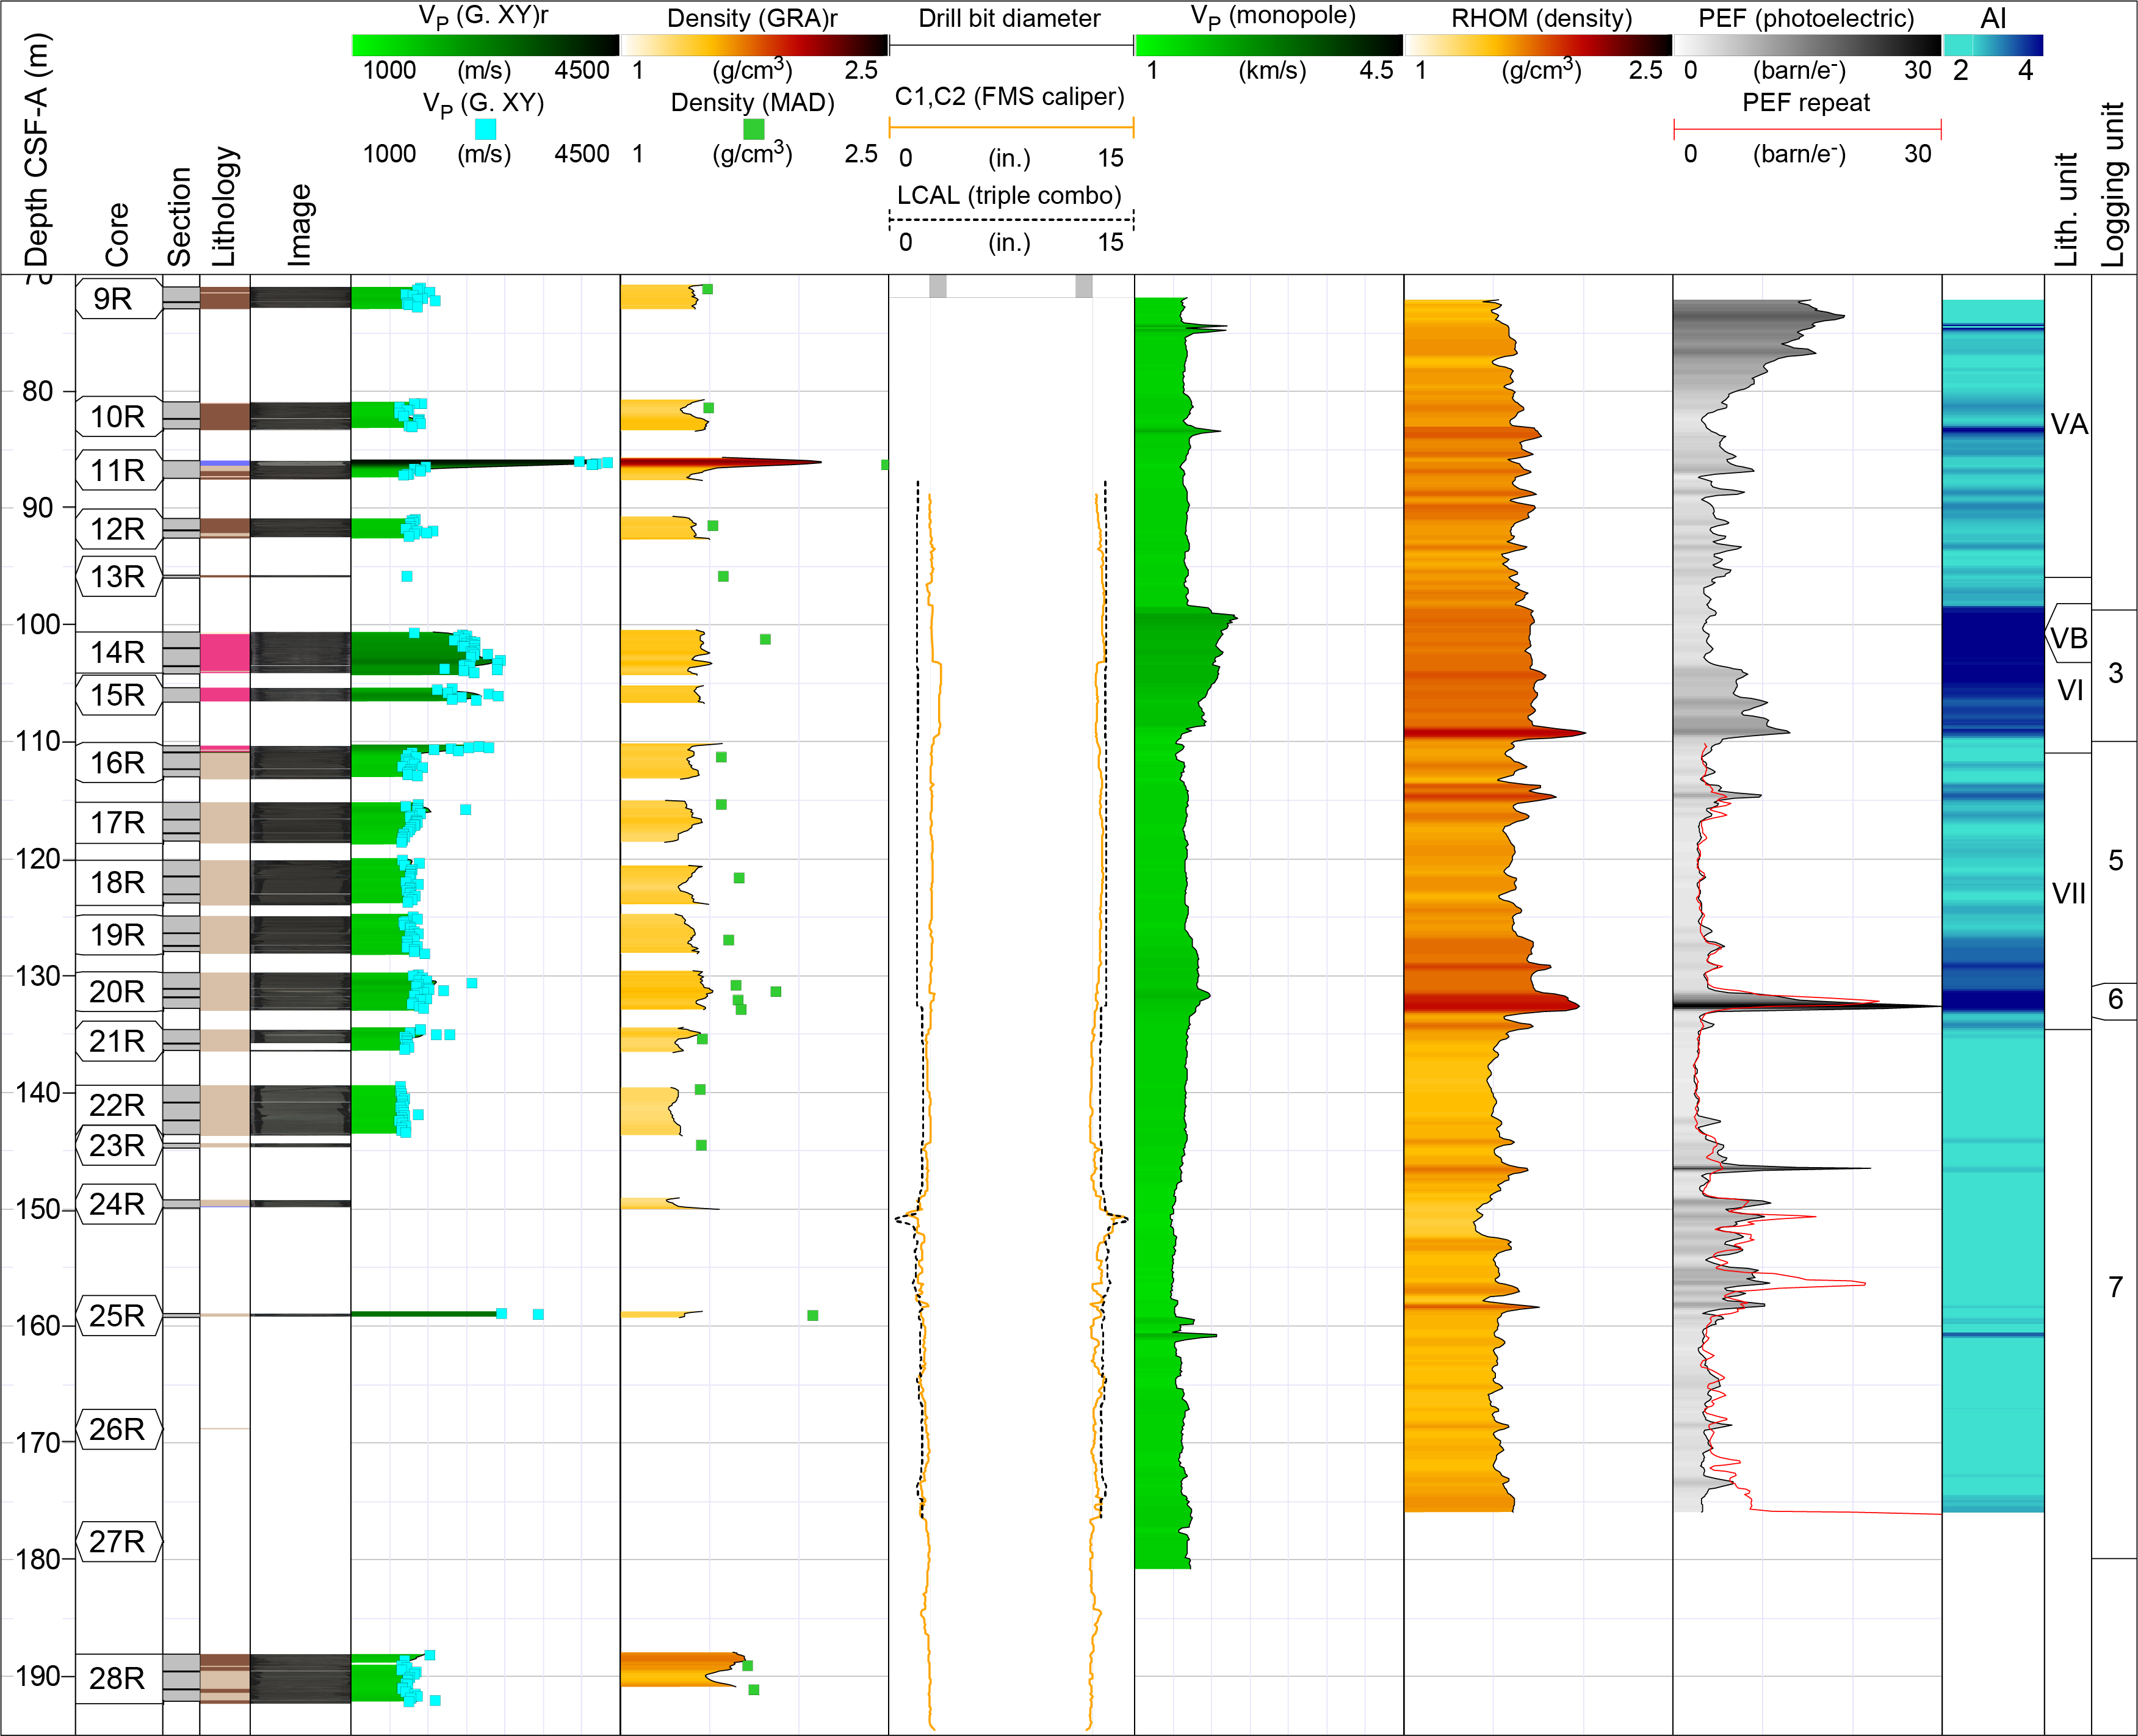
Figure F53. Wireline bulk density, PEF, sonic P-wave, and calculated AI, Hole U1569A.
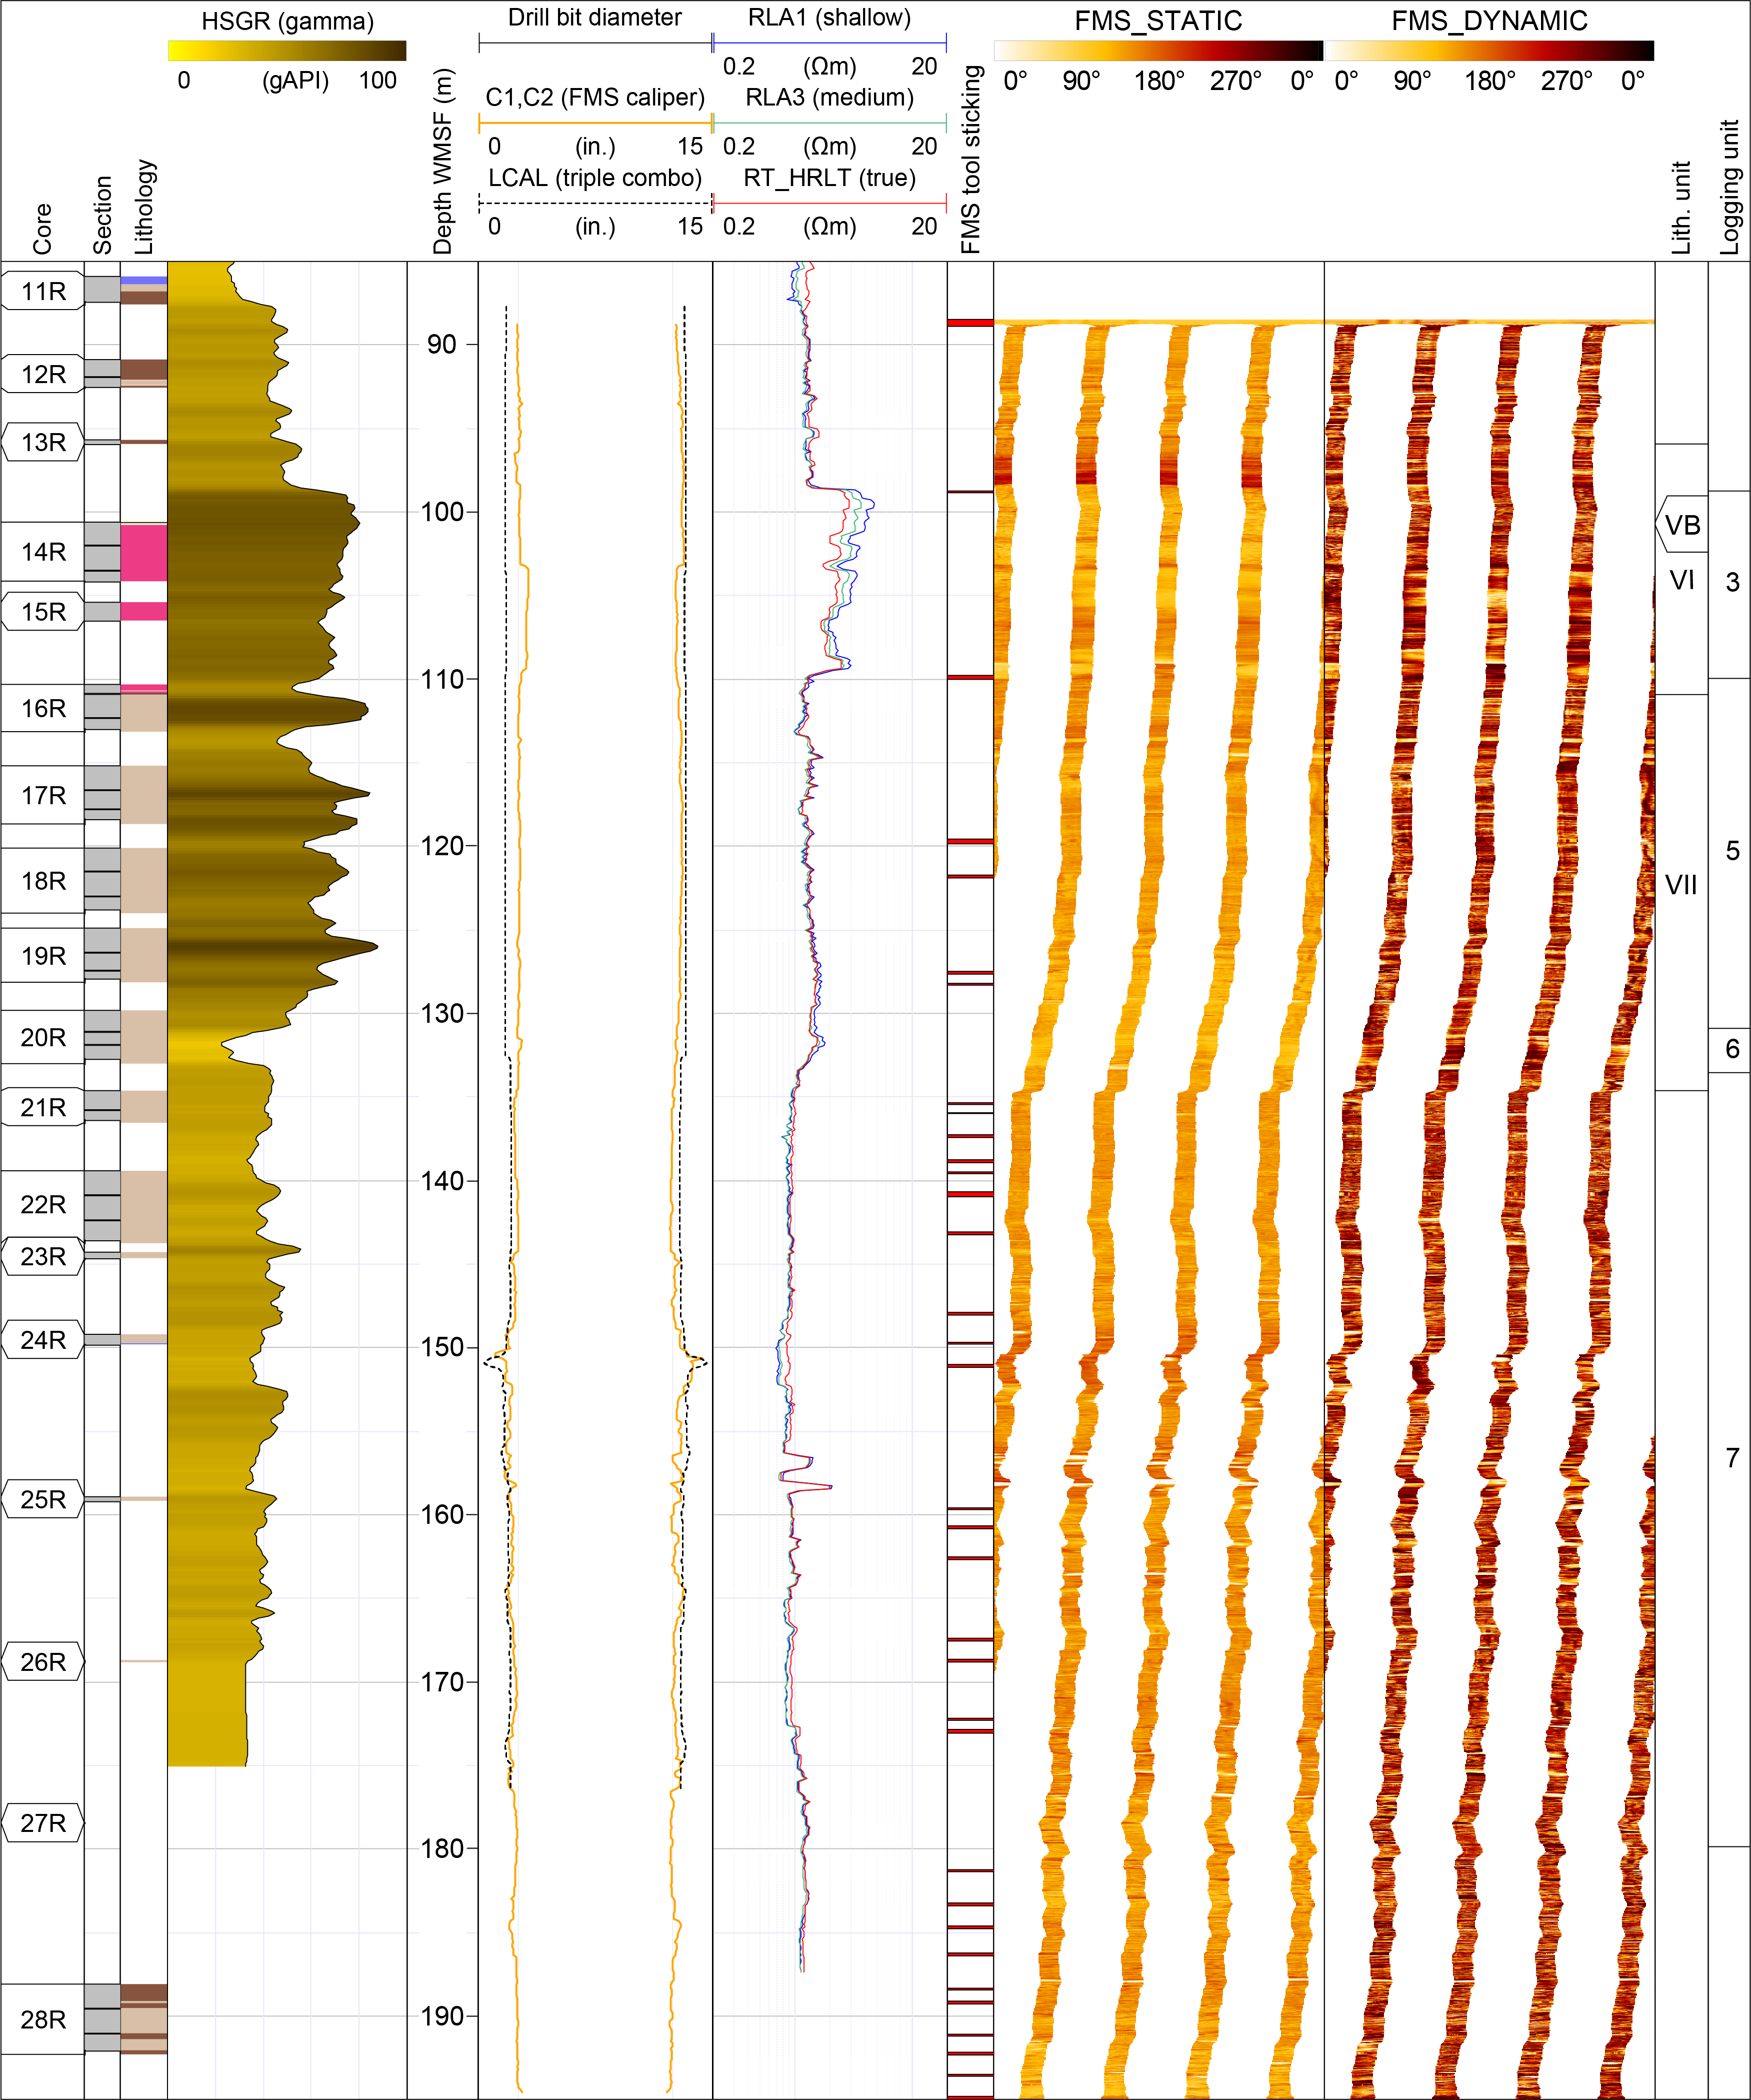
Figure F54. Wireline GR, resistivity, and FMS image, Hole U1570D.
8.1.2.1. Logging Units 1 and 2
Logging Units 1 and 2 span the interval logged behind the drill string casing that led to GR being severely subdued to ~72 m WMSF. Logging Unit 1 is best defined by slightly higher GR readings (~10 gAPI) from the seafloor to ~22 m WMSF compared to the underlying Logging Unit 2 (~4 gAPI). This change corresponds to the observed core-based NGR values for the poorly recovered Lithostratigraphic Units I and II. The open hole part of Logging Unit 2 reveals GR of ~45–50 gAPI, low bulk density of ~1.6–1.7 g/cm3, and low consistent VP of ~1.65 km/s (Figure F52). MS is highly serrated in character.
8.1.2.2. Logging Unit 3
Logging Unit 3 comprises a clearly defined wireline unit with relatively high VP (~1.8–2.3 km/s) and resistivity compared to its surrounding claystone-dominated sequence and corresponds closely to Lithostratigraphic Unit VI, a dacitic layer. Both VP and resistivity reduce with depth in the unit. Bulk density is slightly (by ~0.1 g/cm3) higher compared to the overlying Logging Unit 2. GR increases by 30 gAPI to 78 gAPI before gradually decreasing throughout the unit to ~67 gAPI. The interval reveals a sharp step-like upper contact in VP, GR, and resistivity (Figure F54) and displays a more diffuse boundary in VS and density. MS is almost constant at ~23 × 10−5 [SI] through the unit. The PEF log reveals a gradation of increasing PEF with depth through Logging Unit 3, whereas the basal contact is clearly defined by a sharp drop in density and PEF.
In Figure F55, the FMS image logging data is presented across Logging Unit 3. Image quality is generally very good and reveals a mottled internal structure clearly different from the overlying sediments of Logging Unit 3. The upper contact of the igneous unit is bulbous against the gently dipping overlying sediments; however, because of image resolution and high contrast in the resistivity of the two layers, there is no clear evidence to support or refute emplacement timing relative to the overlying sediments.
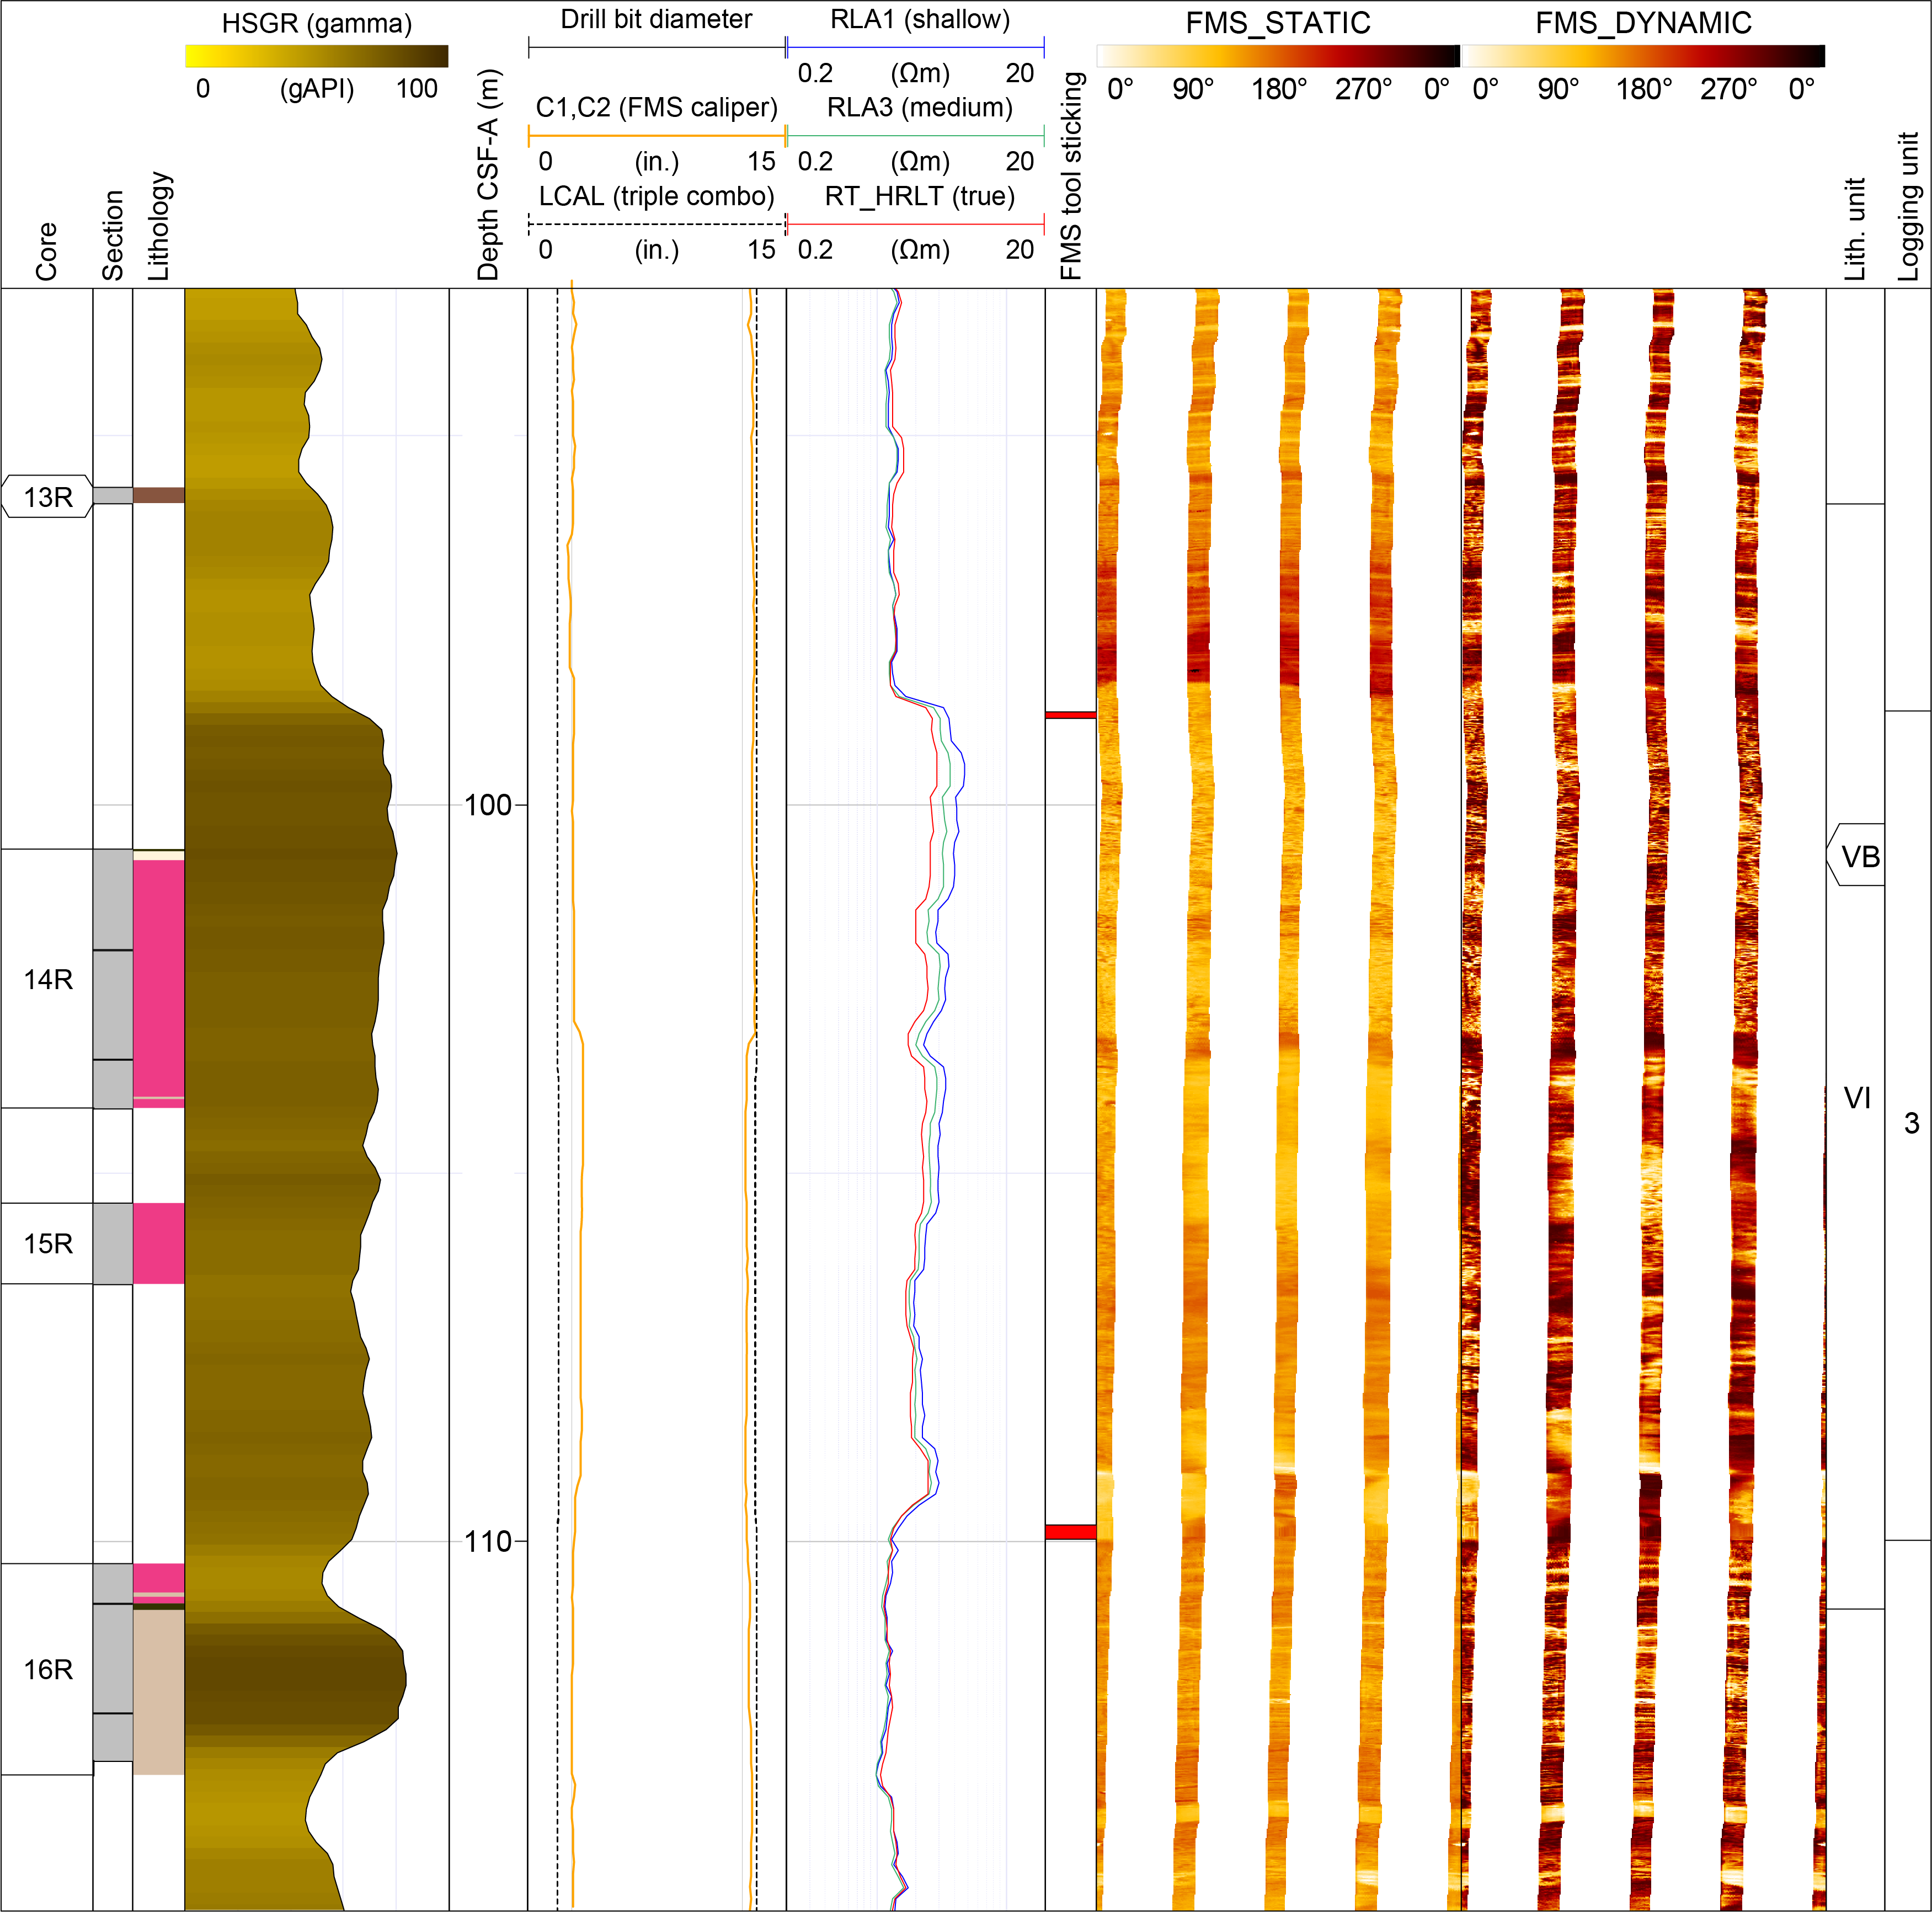
Figure F55. FMS image log coverage, Logging Unit 3.
8.1.2.3. Logging Unit 4
Logging Unit 4 comprises a relatively high GR interval that fluctuates between ~45 and 85 gAPI with generally consistent properties for the other wireline log signatures including PEF, resistivity, VP (~1.7 km/s), and VS (~0.5 km/s) and increases very slightly toward the bottom of the unit in all properties except GR, which decreases. MS reveals a less pronounced serrated profile than Logging Unit 2 along with lower absolute values (~10 × 10−5 to 40 × 10−5 [SI]).
8.1.2.4. Logging Unit 5
Logging Unit 5 comprises a thin ~3 m interval with elevated density (~1.95 g/cm3) and VP (2 km/s) and extreme PEF enrichment as high as ~33 barn/e− coupled with a GR reduction. No clear caliper anomaly other than a minor downward narrowing of the triple combo single arm caliper is seen, and the consistent cross-log correlation of properties therefore appears robust and linked to a stratigraphic change of properties. Elevated MS is also seen in the wireline log data, which corresponds to an equivalent increase in core MS. The physical properties change relates to pale ash layers just above the PEF anomaly, although incomplete core recovery between Cores 396-U1570D-20R and 21R of 1.6 m restricts a full comparison. Also plotted in Figure F52 is the repeat triple combo logging run for the PEF log, which highlights that the anomaly is present in both runs and suggests it relates to a real property of the formation at the time of logging, regardless of whether it could be linked to, for example, barite mud invasion or the true geology.
8.1.2.5. Logging Unit 6
The remainder of the logged section in Hole U1570D is assigned to Logging Unit 6, which comprises a generally consistent sequence with minor fluctuations in GR, density, and PEF. Minor peaks in density, PEF, resistivity, and VP are seen in the interval between ~44 and 60 m WMSF, whereas a distinct low MS interval is seen between ~50 and 52 m WMSF, which could be partly linked to a caliper washout at this depth.
8.2. Summary
Logging operations in Hole U1569A were cut short because of hole collapse, which resulted in restricted data acquisition, and without the calipers opening proper borehole corrections could not be obtained. In contrast, Hole U1570D was logged successfully using the triple combo and FMS-sonic tool strings over an open hole interval of ~123 m. Logging resulted in the improved characterization of the evolved igneous units in the section through integration of the FMS image log and resistivity data. FMS image log data clearly reveal at least three composite intervals with intervening conductive mixed sediments in the high-resistivity igneous unit. The wireline data gives an important continuous record of physical properties across the Paleogene stratigraphy, including clear associations between MS and ash layers identified from the core.
References
Allen, S.R., and McPhie, J., 2003. Phenocryst fragments in rhyolitic lavas and lava domes. Journal of Volcanology and Geothermal Research, 126(3–4):263–283. https://doi.org/
Baby, G., Guillocheau, F., Boulogne, C., Robin, C., and Dall’Asta, M., 2018. Uplift history of a transform continental margin revealed by the stratigraphic record: the case of the Agulhas transform margin along the Southern African Plateau. Tectonophysics, 731–732:104–130. https://doi.org/
Bach, P., Smith, I.E.M., and Malpas, J.G., 2012. The origin of garnets in andesitic rocks from the Northland arc, New Zealand, and their implication for sub-arc processes. Journal of Petrology, 53(6):1169–1195. https://doi.org/
Basile, C., and Allemand, P., 2002. Erosion and flexural uplift along transform faults. Geophysical Journal International, 151(2):646–653. https://doi.org/
Berndt, C., Mjelde, R., Planke,S., Shimamura, H., and Faleide, J.I., 2001a. Controls on the tectono-magmatic evolution of a volcanic transform margin: the Vøring transform margin, NE Atlantic. Marine Geophysical Research, 22:133–152. https://doi.org/
Berndt, C., Planke, S., Alvestad, E., Tsikalas, F., and Rasmussen, T., 2001b. Seismic volcanostratigraphy of the Norwegian Margin: constraints on tectonomagmatic break-up processes. Journal of the Geological Society (London, UK), 158(3):413–426. https://doi.org/
Berndt, C., Skogly, O.P., Planke, S., Eldholm, O., and Mjelde, R., 2000. High-velocity breakup-related sills in the Vøring Basin, off Norway. Journal of Geophysical Research: Solid Earth, 105(B12):28443–28454. https://doi.org/
Berner, R.A., 1980. Early Diagenesis: A Theoretical Approach: Princeton, NJ (Princeton University Press).
Bijl, P.K., 2022. DINOSTRAT: a global database of the stratigraphic and paleolatitudinal distribution of Mesozoic–Cenozoic organic-walled dinoflagellate cysts. Earth Syst. Sci. Data, 14(2):579–617. https://doi.org/
Bujak, J., and Mudge, D., 1994. A high-resolution North Sea Eocene dinocyst zonation. Journal of the Geological Society (London, UK), 151(3):449–462. https://doi.org/
Bünz, S., and Shipboard Scientists, 2020. CAGE-20-4 cruise report. High-resolution 2D and 3D seismic investigations on the Møre and Vøring margins. UiT The Arctic University of Norway report, 47.
Cas, R.A.F., and Simmons, J.M., 2018. Why deep-water eruptions are so different from subaerial eruptions. Frontiers in Earth Science, 6:198. https://doi.org/
Chadima, M., and Hrouda, F., 2006. Remasoft 3.0 a user-friendly paleomagnetic data browser and analyzer. Travaux Géophysiques, 27:20–21.
Chester, R., and Jickells, T., 2012. Marine Geochemistry, 3rd edition: London (Wiley-Blackwell). https://doi.org/
Dybkjær, K., Rasmussen, E.S., Eidvin, T., Grøsfjeld, K., Riis, F., Piasecki, S., and Śliwińska, K.K., 2021. A new stratigraphic framework for the Miocene – Lower Pliocene deposits offshore Scandinavia: a multiscale approach. Geological Journal, 56(3):1699–1725. https://doi.org/
Egger, L.M., Sliwinska, K.K., van Peer, T.E., Liebrand, D., Lippert, P.C., Friedrich, O., Wilson, P.A., Norris, R.D., and Pross, J., 2016. Magnetostratigraphically-calibrated dinoflagellate cyst bioevents for the uppermost Eocene to lowermost Miocene of the western North Atlantic (IODP Expedition 342, Paleogene Newfoundland sediment drifts). Review of Palaeobotany and Palynology, 234:159–185. https://doi.org/
Eldrett, J.S., Greenwood, D.R., Polling, M., Brinkhuis, H., and Sluijs, A., 2014. A seasonality trigger for carbon injection at the Paleocene–Eocene Thermal Maximum. Climate of the Past, 10(2):759–769. https://doi.org/
Fenner, J., 1994. Diatoms of the Fur Formation, their taxonomy and biostratigraphic interpretation–results from the Harre borehole, Denmark. Aarhus Geoscience, 1(99):131.
Frieling, J., Svensen, H.H., Planke, S., Cramwinckel, M.J., Selnes, H., and Sluijs, A., 2016. Thermogenic methane release as a cause for the long duration of the PETM. Proceedings of the National Academy of Sciences of the United States of America, 113(43):12059–12064. https://doi.org/
Frost, B.R., Barnes, C.G., Colins, W.J., Arculus, R.J., Ellis, D.J., and Frost, C.D., 2001. A geochemical classification for granitic rocks. Journal of Petrology, 42(11):2033–2048. https://doi.org/
Gernigon, L., Zastrozhnov, D., Planke, S., Manton, B., Abdelmalak, M.M., Olesen, O., Maharjan, D., Faleide, J.I., and Myklebust, R., 2021. A digital compilation of structural and magmatic elements of the mid-Norwegian continental margin. Norwegian Journal of Geology, 101. https://doi.org/
Gieskes, J.M., and Lawrence, J.R., 1981. Alteration of volcanic matter in deep sea sediments: evidence from the chemical composition of interstitial waters from deep sea drilling cores. Geochimica et Cosmochimica Acta, 45(10):1687–1703. https://doi.org/
Gifkins, C.C., McPhie, J., and Allen, R.L., 2002. Pumiceous rhyolitic peperite in ancient submarine volcanic successions. Journal of Volcanology and Geothermal Research, 114(1–2):181–203. https://doi.org/
Gradstein, F.M., Ogg, J.G., Schmitz, M.D., and Ogg, G.M. (Eds.), 2012. The Geological Time Scale 2012: Amsterdam (Elsevier). https://doi.org/
Greinert, J., and Derkachev, A., 2004. Glendonites and methane-derived Mg-calcites in the Sea of Okhotsk, eastern Siberia: implications of a venting-related ikaite/glendonite formation. Marine Geology, 204(1–2):129–144. https://doi.org/
Hembury, D.J., Palmer, M.R., Fones, G.R., Mills, R.A., Marsh, R., and Jones, M.T., 2012. Uptake of dissolved oxygen during marine diagenesis of fresh volcanic material. Geochimica et Cosmochimica Acta, 84:353–368. https://doi.org/
Homann, M., 1991. Diatomeen der Fur-Formation (Alttertiär) aus dem Limfjord-Gebiet, Nordjütland/Dänemark. Geologisches Jahrbuch, Reihe A: Allgemeine und Regionale Geologie Bundesrepublik Deutschland und Nachbargebiete, Tektonik, Stratigraphie, Palaeontologie, 123:3–285.
Isson, T.T., and Planavsky, N.J., 2018. Reverse weathering as a long-term stabilizer of marine pH and planetary climate. Nature, 560(7719):471–475. https://doi.org/
Kawabata, H., and Takafuji, N., 2005. Origin of garnet crystals in calc-alkaline volcanic rocks from the Setouchi volcanic belt, Japan. Mineralogical Magazine, 69(6):951–971. https://doi.org/
Le Maitre, R.W., 1989. A Classification of Igneous Rocks and Glossary of Terms: Boston (Blackwell).
Lebedeva-Ivanova, N., Millett, J., et al., 2021. Fast-track seismic data processing report for data from CAGE20-4 cruise. VBPR Report.
Longman, J., Gernon, T.M., Palmer, M.R., Jones, M.T., Stokke, E.W., and Svensen, H.H., 2021. Marine diagenesis of tephra aided the Palaeocene-Eocene Thermal Maximum termination. Earth and Planetary Science Letters, 571:117101. https://doi.org/
Lorenzo, J.M., and Wessel, P., 1997. Flexure across a continent–ocean fracture zone: the northern Falkland/Malvinas Plateau, South Atlantic. Geo-Marine Letters, 17(1):110–118. https://doi.org/
Mercier de Lépinay, M., Loncke, L., Basile, C., Roest, W.R., Patriat, M., Maillard, A., and De Clarens, P., 2016. Transform continental margins – Part 2: A worldwide review. Tectonophysics, 693:96–115. https://doi.org/
Michalopoulos, P., and Aller, R.C., 1995. Rapid clay mineral formation in Amazon Delta sediments: reverse weathering and oceanic elemental cycles. Science, 270(5236):614–617. https://doi.org/
Mitsui, K., and Taguchi, K., 1977. Silica mineral diagenesis in Neogene Tertiary shales in the Tempoku District, Hokkaido, Japan. Journal of Sedimentary Research, 47(1):158–167. https://doi.org/
Mjelde, R., Raum, T., Kandilarov, A., Murai, Y., and Takanami, T., 2009. Crustal structure and evolution of the outer Møre Margin, NE Atlantic. Tectonophysics, 468(1):224–243. https://doi.org/
Mudge, D.C., and Bujak, J.P., 1994. Eocene stratigraphy of the North Sea Basin. Marine and Petroleum Geology, 11(2):166–181. https://doi.org/
Mudge, D.C., and Bujak, J.P., 1996. An integrated stratigraphy for the Paleocene and Eocene of the North Sea. In Knox, R.W.O., Corfield, R.M., and Dunay, R.E. (Eds.), Correlation of the Early Paleogene in Northwest Europe. Geological Society Special Publication, 101: 91–113. https://doi.org/
Mudge, D.C., and Bujak, J.P., 2001. Biostratigraphic evidence for evolving palaeoenvironments in the lower Paleogene of the Faeroe–Shetland Basin. Marine and Petroleum Geology, 18(5):577–590. https://doi.org/
Munksgaard, N., 1985. A non-magmatic origin for compositionally zoned euhedral garnets in silicic Neogene volcanics from SE Spain. Neues Jahrbuch fuer Mineralogie (Abhandlungen), 1985(H.2):73–82.
Munsterman, D.K., and Brinkhuis, H., 2004. A southern North Sea Miocene dinoflagellate cyst zonation. Geologie en Mijnbouw, 83(4):267–285. https://doi.org/
Oreshkina, T.V., and Radionova, E.P., 2014. Diatom record of the Paleocene–Eocene Thermal Maximum in marine paleobasins of Central Russia, Transuralia and adjacent regions. Nova Hedwigia, Beiheft, 143:307–336.
Planke, S., Berndt, C., Alvarez Zarikian, C.A., Agarwal, A., Andrews, G.D.M., Betlem, P., Bhattacharya, J., Brinkhuis, H., Chatterjee, S., Christopoulou, M., Clementi, V.J., Ferré, E.C., Filina, I.Y., Frieling, J., Guo, P., Harper, D.T., Jones, M.T., Lambart, S., Longman, J., Millett, J.M., Mohn, G., Nakaoka, R., Scherer, R.P., Tegner, C., Varela, N., Wang, M., Xu, W., and Yager, S.L., 2023a. Expedition 396 methods. In Planke, S., Berndt, C., Alvarez Zarikian, C.A., and the Expedition 396 Scientists, Mid-Norwegian Margin Magmatism and Paleoclimate Implications. Proceedings of the International Ocean Discovery Program, 396: College Station, TX (International Ocean Discovery Program). https://doi.org/
Planke, S., Berndt, C., Alvarez Zarikian, C.A., Agarwal, A., Andrews, G.D.M., Betlem, P., Bhattacharya, J., Brinkhuis, H., Chatterjee, S., Christopoulou, M., Clementi, V.J., Ferré, E.C., Filina, I.Y., Frieling, J., Guo, P., Harper, D.T., Jones, M.T., Lambart, S., Longman, J., Millett, J.M., Mohn, G., Nakaoka, R., Scherer, R.P., Tegner, C., Varela, N., Wang, M., Xu, W., and Yager, S.L., 2023b. Site U1565. In Planke, S., Berndt, C., Alvarez Zarikian, C.A., and the Expedition 396 Scientists, Mid-Norwegian Margin Magmatism and Paleoclimate Implications. Proceedings of the International Ocean Discovery Program, 396: College Station, TX (International Ocean Discovery Program). https://doi.org/
Planke, S., Berndt, C., Alvarez Zarikian, C.A., Agarwal, A., Andrews, G.D.M., Betlem, P., Bhattacharya, J., Brinkhuis, H., Chatterjee, S., Christopoulou, M., Clementi, V.J., Ferré, E.C., Filina, I.Y., Frieling, J., Guo, P., Harper, D.T., Jones, M.T., Lambart, S., Longman, J., Millett, J.M., Mohn, G., Nakaoka, R., Scherer, R.P., Tegner, C., Varela, N., Wang, M., Xu, W., and Yager, S.L., 2023c. Sites U1567 and U1568. In Planke, S., Berndt, C., Alvarez Zarikian, C.A., and the Expedition 396 Scientists, Mid-Norwegian Margin Magmatism and Paleoclimate Implications. Proceedings of the International Ocean Discovery Program, 396: College Station, TX (International Ocean Discovery Program). https://doi.org/
Polteau, S., Planke, S., Zastrozhnov, D., Abdelmalak, M.M., Lebedeva-Ivanova, N., Planke, E.E., Svensen, H.H., Mazzini, A., Gernigon, L., Myklebust, R., Kjølhamar, B.E., Pedersen, R.B., Sandstå, N.R., and Bünz, S., 2020. Upper Cretaceous-Paleogene stratigraphy and development of the Mímir high, Vøring transform margin, Norwegian Sea. Marine and Petroleum Geology, 122:104717. https://doi.org/
Scherer, R.P., Gladenkov, A.Y., and Barron, J.A., 2007. Methods and applications of Cenozoic marine diatom biostratigraphy. In Strratt, S., Pond Scum to Carbon Sink: Geological and Environmental Applications of the Diatoms. The Paleontological Society Papers, 13: 61–83. https://doi.org/
Spiegler, D., and Jansen, E., 1989. Planktonic foraminifer biostratigraphy of Norwegian Sea sediments: ODP Leg 104. In Eldholm, O., Thiede, J., Taylor, E., et al., Proceedings of the Ocean Drilling Program, Scientific Results, 104: College Station, TX (Ocean Drilling Program), 681–696. https://doi.org/
Torres, M.E., Hong, W.-L., Solomon, E.A., Milliken, K., Kim, J.-H., Sample, J.C., Teichert, B.M.A., and Wallmann, K., 2020. Silicate weathering in anoxic marine sediment as a requirement for authigenic carbonate burial. Earth-Science Reviews, 200:102960. https://doi.org/
Vågnes, E., 1997. Uplift at thermo-mechanically coupled ocean–continent transforms: modeled at the Senja Fracture Zone, southwestern Barents Sea. Geo-Marine Letters, 17:100–109.
Vieira, M., Mahdi, S., and Holmes, N., 2020. High resolution biostratigraphic zonation for the UK central North Sea Paleocene. Marine and Petroleum Geology, 117:104400. https://doi.org/
Witkowski, J., Harwood, D.M., Wade, B.S., and Bryłka, K., 2020. Rethinking the chronology of early Paleogene sediments in the western North Atlantic using diatom biostratigraphy. Marine Geology, 424:106168. https://doi.org/
Zeck, H.P., and Williams, I.S., 2002. Inherited and magmatic zircon from Neogene Hoyazo cordierite dacite, SE Spain—anatectic source rock provenance and magmatic evolution: in memoriam Professor Chris Powell, 2001.07.21. Journal of Petrology, 43(6):1089–1104. https://doi.org/
Zijderveld, J.D.A., 2013. A. C. demagnetization of rocks: analysis of results. In Collinson, D.W., Creer, K.M., and Runcorn, S.K. (Eds.), Methods in Paleomagnetism. Developments in Solid Earth Geophysics, 3: New York (Elsevier), 254–286. https://doi.org/