Knutz, P.C., Jennings, A.E., Childress, L.B., and the Expedition 400 Scientists
Proceedings of the International Ocean Discovery Program Volume 400
publications.iodp.org
https://doi.org/10.14379/iodp.proc.400.201.2025
Data report: gas hydrate assessment in Baffin Bay at IODP Expedition 400 drill sites1
Fawz Naim,2 Ann E. Cook,3 Paul C. Knutz,2 Anne E. Jennings,2 Laurel B. Childress,2 Raquel M. Bryant,2 Samantha K. Cargill,2 Helen K. Coxall,2 Tracy D. Frank,2 Georgia R. Grant,2 Rachael E. Gray,2 Sandrine Le Houedec,2 Libby Ives,2 Vikash Kumar,2 Jannik Martens,2 Mei Nelissen,2 Volkan Özen,2 Sandra Passchier,2 Lara F. Pérez,2 Jian Ren,2 Brian W. Romans,2 Osamu Seki,2 Philip Staudigel,2 Lisa Tauxe,2 Emily J. Tibbett,2 Yuka Yokoyama,2 Yancheng Zhang,2 and Heike Zimmermann2
1 Naim, F., Cook, A.E., Knutz, P.C., Jennings, A.E., Childress, L.B., Bryant, R.M., Cargill, S.K., Coxall, H.K., Frank, T.D., Grant, G.R., Gray, R.E., Le Houedec, S., Ives, L., Kumar, V., Martens, J., Nelissen, M., Özen, V., Passchier, S., Pérez, L.F., Ren, J., Romans, B.W., Seki, O., Staudigel, P., Tauxe, L., Tibbett, E.J., Yokoyama, Y., Zhang, Y., and Zimmermann, H., 2025. Data report: gas hydrate assessment in Baffin Bay at IODP Expedition 400 drill sites. In Knutz, P.C., Jennings, A.E., Childress, L.B., and the Expedition 400 Scientists, NW Greenland Glaciated Margin. Proceedings of the International Ocean Discovery Program, 400: College Station, TX (International Ocean Discovery Program). https://doi.org/10.14379/iodp.proc.400.201.2025
2 Expedition 400 Scientists’ affiliations. Correspondence author: fawz4225@gmail.com
3 School of Earth Sciences, The Ohio State University, USA.
Abstract
A gas hydrate assessment at International Ocean Discovery Program Expedition 400 drill sites was conducted using downhole logging and core data. Here, we calculate and present the base of gas hydrate stability zone at Expedition 400 drill sites in Baffin Bay, northwest Greenland. We used data from downhole logs and sediment cores from Sites U1603, U1604, U1607, and U1608 to assess hydrate and did not find evidence for the presence of hydrate. At Site U1606, only core data were acquired that showed a decrease in pore water salinity, potentially indicating the presence of hydrate; however, further confirmation was not possible due to the unavailability of downhole logging data. Because of the limitation of the acquired data at the drill sites, a further assessment to confirm the presence of hydrate was not possible. Although hydrate was not identified at any drill sites, hydrate might still be present in the region.
1. Introduction
International Ocean Discovery Program (IODP) Expedition 400 acquired long sedimentary records and downhole logs from six sites (U1603–U1608) on the northwest Greenland margin (Figure F1) aimed at studying the evolution of the northern Greenland ice sheet (NGrIS) (Knutz et al., 2025b). In this report, we use standard physical property and geochemistry measurements that were acquired on the sediment cores in combination with downhole logging data to evaluate the presence of gas hydrate at Expedition 400 drill sites. Hydrate is an ice-like crystalline solid that consists of a gas molecule entrapped inside a cage-like structure of water molecules (Ruppel, 2011; Sloan and Koh, 2007). Hydrate is found in marine sediments on continental margins worldwide (Ruppel, 2011; Sloan and Koh, 2007).
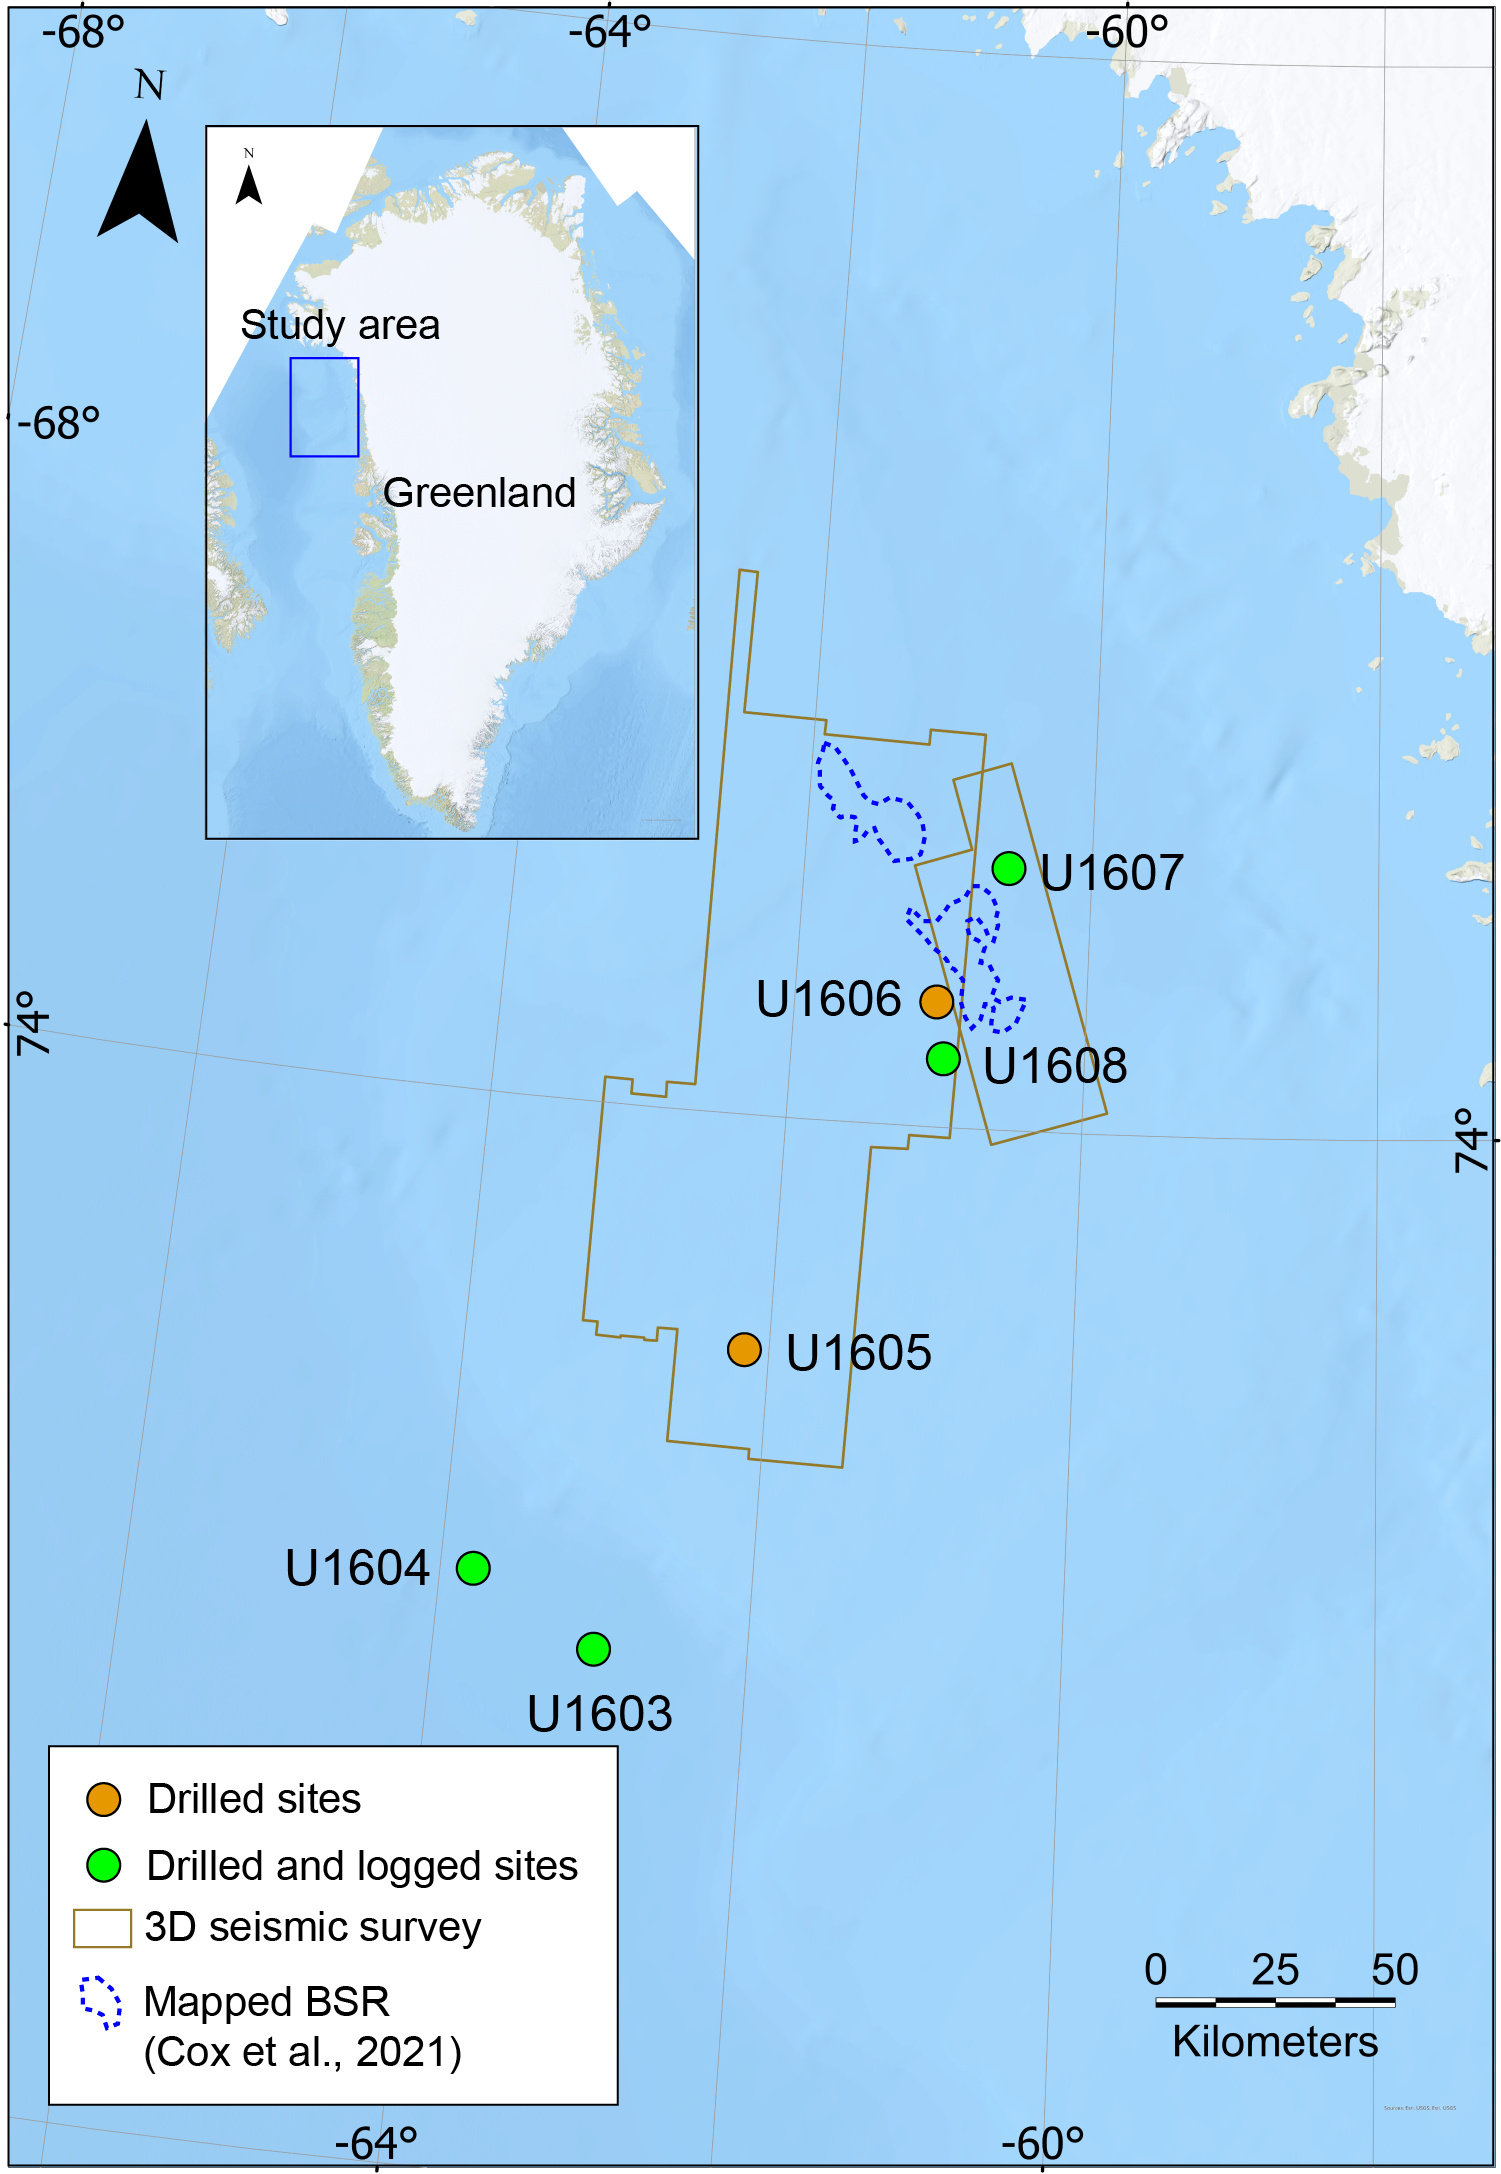
Figure F1. Expedition 400 drill site locations.
1.1. Background
The key objectives of Expedition 400 were to evaluate past dynamics of the NGrIS in the context of glacial–interglacial variability, understand ice sheet response to ocean-climate forcing, and provide insights into past ice-free conditions in Greenland (Knutz et al., 2025b). Moreover, geochemical proxy measurements from Expedition 400 are being used to evaluate oceanographic and atmospheric changes over the last ~25 My.
Physical property measurements were collected on cores, including natural gamma radiation, bulk density, thermal conductivity, magnetic susceptibility, P-wave velocity, and porosity (Knutz et al., 2025a). Core samples were used to measure the gas composition using gas chromatograph analysis. In addition, sediment cores were split and described to understand sediment type, structure, and depositional history in the region.
The physical property data were used to tie the cores to seismic data before the downhole logs were acquired. This helped the science party to interpret the drilled depth with reference to the target horizons on seismic data. However, the physical property measurements such as bulk density, P-wave velocity, and porosity are sensitive to changes in the pressure conditions and may be prone to errors. When the sediment cores are brought on board from the subseafloor in situ conditions, the loss in pressure results in core expansion, which causes a drop in the bulk density and compressional velocity and eventually an increase in porosity.
Downhole wireline logs acquire a variety of physical property measurements after the hole is drilled (Ellis and Singer, 2007). To acquire wireline downhole logs, a set of tools is lowered into the hole and then pulled upward from the bottom of the hole to the seafloor (Ellis and Singer, 2007). Logging measurements are acquired in both directions: going down and pulling the tools up the hole. This is done to ensure the accuracy and consistency of the acquired data. The downhole logs are then processed in the onboard software and used to interpret the physical properties of the sediments.
The addition of downhole logging introduces several advantages over coring alone. Downhole logging provides in situ measurements of the physical properties of sediments where measurements are collected by the tools inside the borehole. This gives an accurate measurement of physical properties such as bulk density. In contrast, sediment cores are brought on board where physical property measurements are acquired at room temperature and pressure. The sediments expand during core recovery due to a change in pressure on board as compared to within the borehole, which alters the physical properties of the sediments. Moreover, the sediment cores are not always complete because they can fall out of the core barrel. In addition, some measurements, such as resistivity and compressional velocity, are acquired in situ with a higher accuracy. These limitations with core acquisition make it important to measure the physical properties within the borehole.
1.2. Natural gas hydrate
Gas hydrate is an ice-like crystalline solid that consists of a gas molecule (mostly methane) surrounded by a cage of water molecules (Sloan and Koh, 2007). Hydrate is stable in low temperature and high pressure conditions that are present in marine continental margins or under permafrost in high-latitude regions (Claypool and Kvenvolden, 1983; Tishchenko et al., 2005). Hydrate is an important component of the global carbon cycle and hosts 5%–20% of global mobile carbon (Buffett and Archer, 2004; Milkov, 2004). Moreover, hydrate is considered a potential natural gas resource (Boswell et al., 2016).
In the context of the Scientific Ocean Drilling 2050 Framework, which discusses the importance of future scientific ocean drilling, hydrate plays an important role for various scientific reasons. Hydrate is considered an important component of the climate system feedbacks because its destabilization could release carbon into the atmosphere and affect the climate system (Koppers and Coggon, 2020). Moreover, hydrate is a potential geohazard because it can dissociate to release free gas and increase pore pressure that may trigger submarine landslides (Koppers and Coggon, 2020; Kvenvolden, 1993).
1.3. Presence of hydrate in Baffin Bay
Cox et al. (2021) conducted the first gas hydrate study in Melville Bay, offshore northwest Greenland, using 3D seismic data to identify gas hydrate indicators, called bottom-simulating reflections (BSRs). BSRs are caused by the presence of free gas at the base of the hydrate stability zone (BHSZ) (Haacke et al., 2007; Shipley et al., 1979). BSRs are reflections on seismic data with a polarity opposite to that of the seafloor (Sheriff, 1975). Cox et al. (2021) identified BSRs spread across an area of 537 km2 in Melville Bay. These features are more prominent in regions with dipping stratigraphy where the amplitude of the BSR is higher as compared to the regions with stratigraphy parallel to the seafloor (Cox et al., 2021). However, the study did not find evidence for gas migration on seismic data from deep sediments into the hydrate stability zone. Using the depth of the identified BSR from seismic data, Cox et al. (2021) estimate the geothermal gradient on the northwest Greenland margin to be between 40° and 59°C/km with an average of 49°C/km. Because the BSRs are located in close proximity to the IODP Expedition 400 drill sites (Figure F1), the core and log data obtained during the expedition provide suitable background data for assessing the presence of gas hydrates on the northwest Greenland glaciated margin.
2. Methods
2.1. Estimating the zone of hydrate occurrence
To assess hydrate at the Expedition 400 drill sites, we first estimate the BHSZ at each site. BHSZ defines the depth below the seafloor within which hydrate is stable for specific temperature and pressure conditions (Sloan and Koh, 2007). We estimate BHSZ using the measured water depth, seafloor temperature, geothermal gradient, pore water salinity, and gas composition (Sloan and Koh, 2007). The water depth at each site was measured during drilling. The temperature at and below the seafloor was measured to 119 meters below seafloor (mbsf) using the advanced piston corer temperature (APCT-3) tool in Holes U1603A and U1604A. These temperature data were used to calculate the geothermal gradient for Sites U1603 and U1604. For Sites U1605, U1606, U1607, and U1608, we estimated the seafloor temperature using World Ocean Atlas (WOA) temperature database hosted by National Oceanic and Atmospheric Administration (NOAA) (Boyer et al., 2018). WOA hosts water column temperature in offshore regions around the globe from the mean sea level to 50–100 m above the seafloor. We defined a relationship between the bottommost water column temperature and water depth in Melville Bay, offshore northwest Greenland, and estimated the seafloor temperature for the measured water depth at each site. We estimated the geothermal gradient for Sites U1605, U1606, U1607, and U1608 using the geothermal gradient range estimated by Cox et al. (2021) from the BSR depths. The pore water salinity was measured on board by extracting the pore water from the sediment cores (Knutz et al., 2025a). We use pore water salinity to estimate background salinity, which refers to the salinity of in situ pore water, as an input for computing BHSZ at each drill site (Malinverno et al., 2008). Finally, the gas composition was measured using a gas chromatograph. The gas concentration at all sites was primarily methane (>99%). Therefore, methane is the only gas used for the BHSZ calculation.
In addition to the BHSZ, which defines the base of hydrate stability, an upper boundary for hydrate occurrence is usually defined by the sulfate–methane transition zone (SMTZ). Note that this is true only in areas not located near a site of active gas advection, which includes the Expedition 400 sites. The SMTZ is the depth where the downward diffusing sulfate meets the methane migrating up from the sediments below (Borowski et al., 1999). The pore water samples acquired on board are used to estimate the concentration of different ions including but not limited to sulfate, chloride, bromide, and magnesium (Knutz, et al., 2025a). The SMTZ is estimated by measuring sulfate concentration from the pore water samples and methane concentration from headspace gas samples. For each site, we use the SMTZ and the BHSZ to define a depth interval where hydrate would likely occur (Table T1).
2.2. Hydrate assessment with well logs
Each site with downhole logging data was assessed for the presence of hydrate using resistivity, bulk density, and compressional velocity logs acquired using wireline logging tools attached to the tool string (Knutz et al., 2025c; Knutz et al., 2025d; Knutz et al., 2025e; Knutz et al., 2025f). To interpret hydrate using resistivity, we first calculated the background resistivity (R o) using Archie’s equation (Archie, 1942). Ro refers to the resistivity of sediments that are 100% saturated with water. When hydrate is present, the measured resistivity increases above Ro because hydrate is resistive and elevates the resistivity even if present in small amounts (Goldberg et al., 2010; Majumdar et al., 2017):
(1)
where Rw is the pore water resistivity, ϕ is the porosity, and m is the cementation exponent, which is an Archie parameter that relates to the cementation of the sediment (Ellis and Singer, 2007). We computed Rw from the algorithm developed by Fofonoff and Millard (1983) using salinity, temperature, and pressure.
We calculated porosity from the bulk density log in each hole using the equation (Ellis and Singer, 2007):
(2)
where ρg is the grain density, ρw is the pore water density, and ρb is the measured bulk density log in each logged hole. For ρg, we use an average of 2.73 g/cm3 from the moisture and density (MAD) measurements for Sites U1603, U1604, U1607, and U1608 acquired on board (Knutz et al., 2025a). We used a ρw of 1.03 g/cm3 for brine-rich pore water (Ellis and Singer, 2007). For estimating m, we initially used m = 2 for the complete interval for each hole and adjusted it so that Ro matches the measured resistivity in water-saturated sediments to define a specific m for each hole. We use m = 1.8 for Hole U1603D, m = 2 for Hole U1604B, and m = 2.1 for Holes U1607A and U1608A.
To calculate porosity, the bulk density log can be edited in intervals where the hole is washed out or not intact. We show an example of log editing in the interval 115–125 mbsf in Track 2 in Hole U1603D (Figure F2). A washed-out hole affects the bulk density log because it has a shallow depth of investigation into the formation; depth of investigation is the radial distance from the borehole wall into the formation that a logging tool can detect (Ellis and Singer, 2007). The bulk density log from the Hostile Environment Litho-Density Sonde (HLDS) used during Expedition 400 measured 15 cm into the formation (https://mlp.ldeo.columbia.edu/logdb/technology/schlumberger-wireline-tools/hostile-environment-litho-density-sonde-hlds).
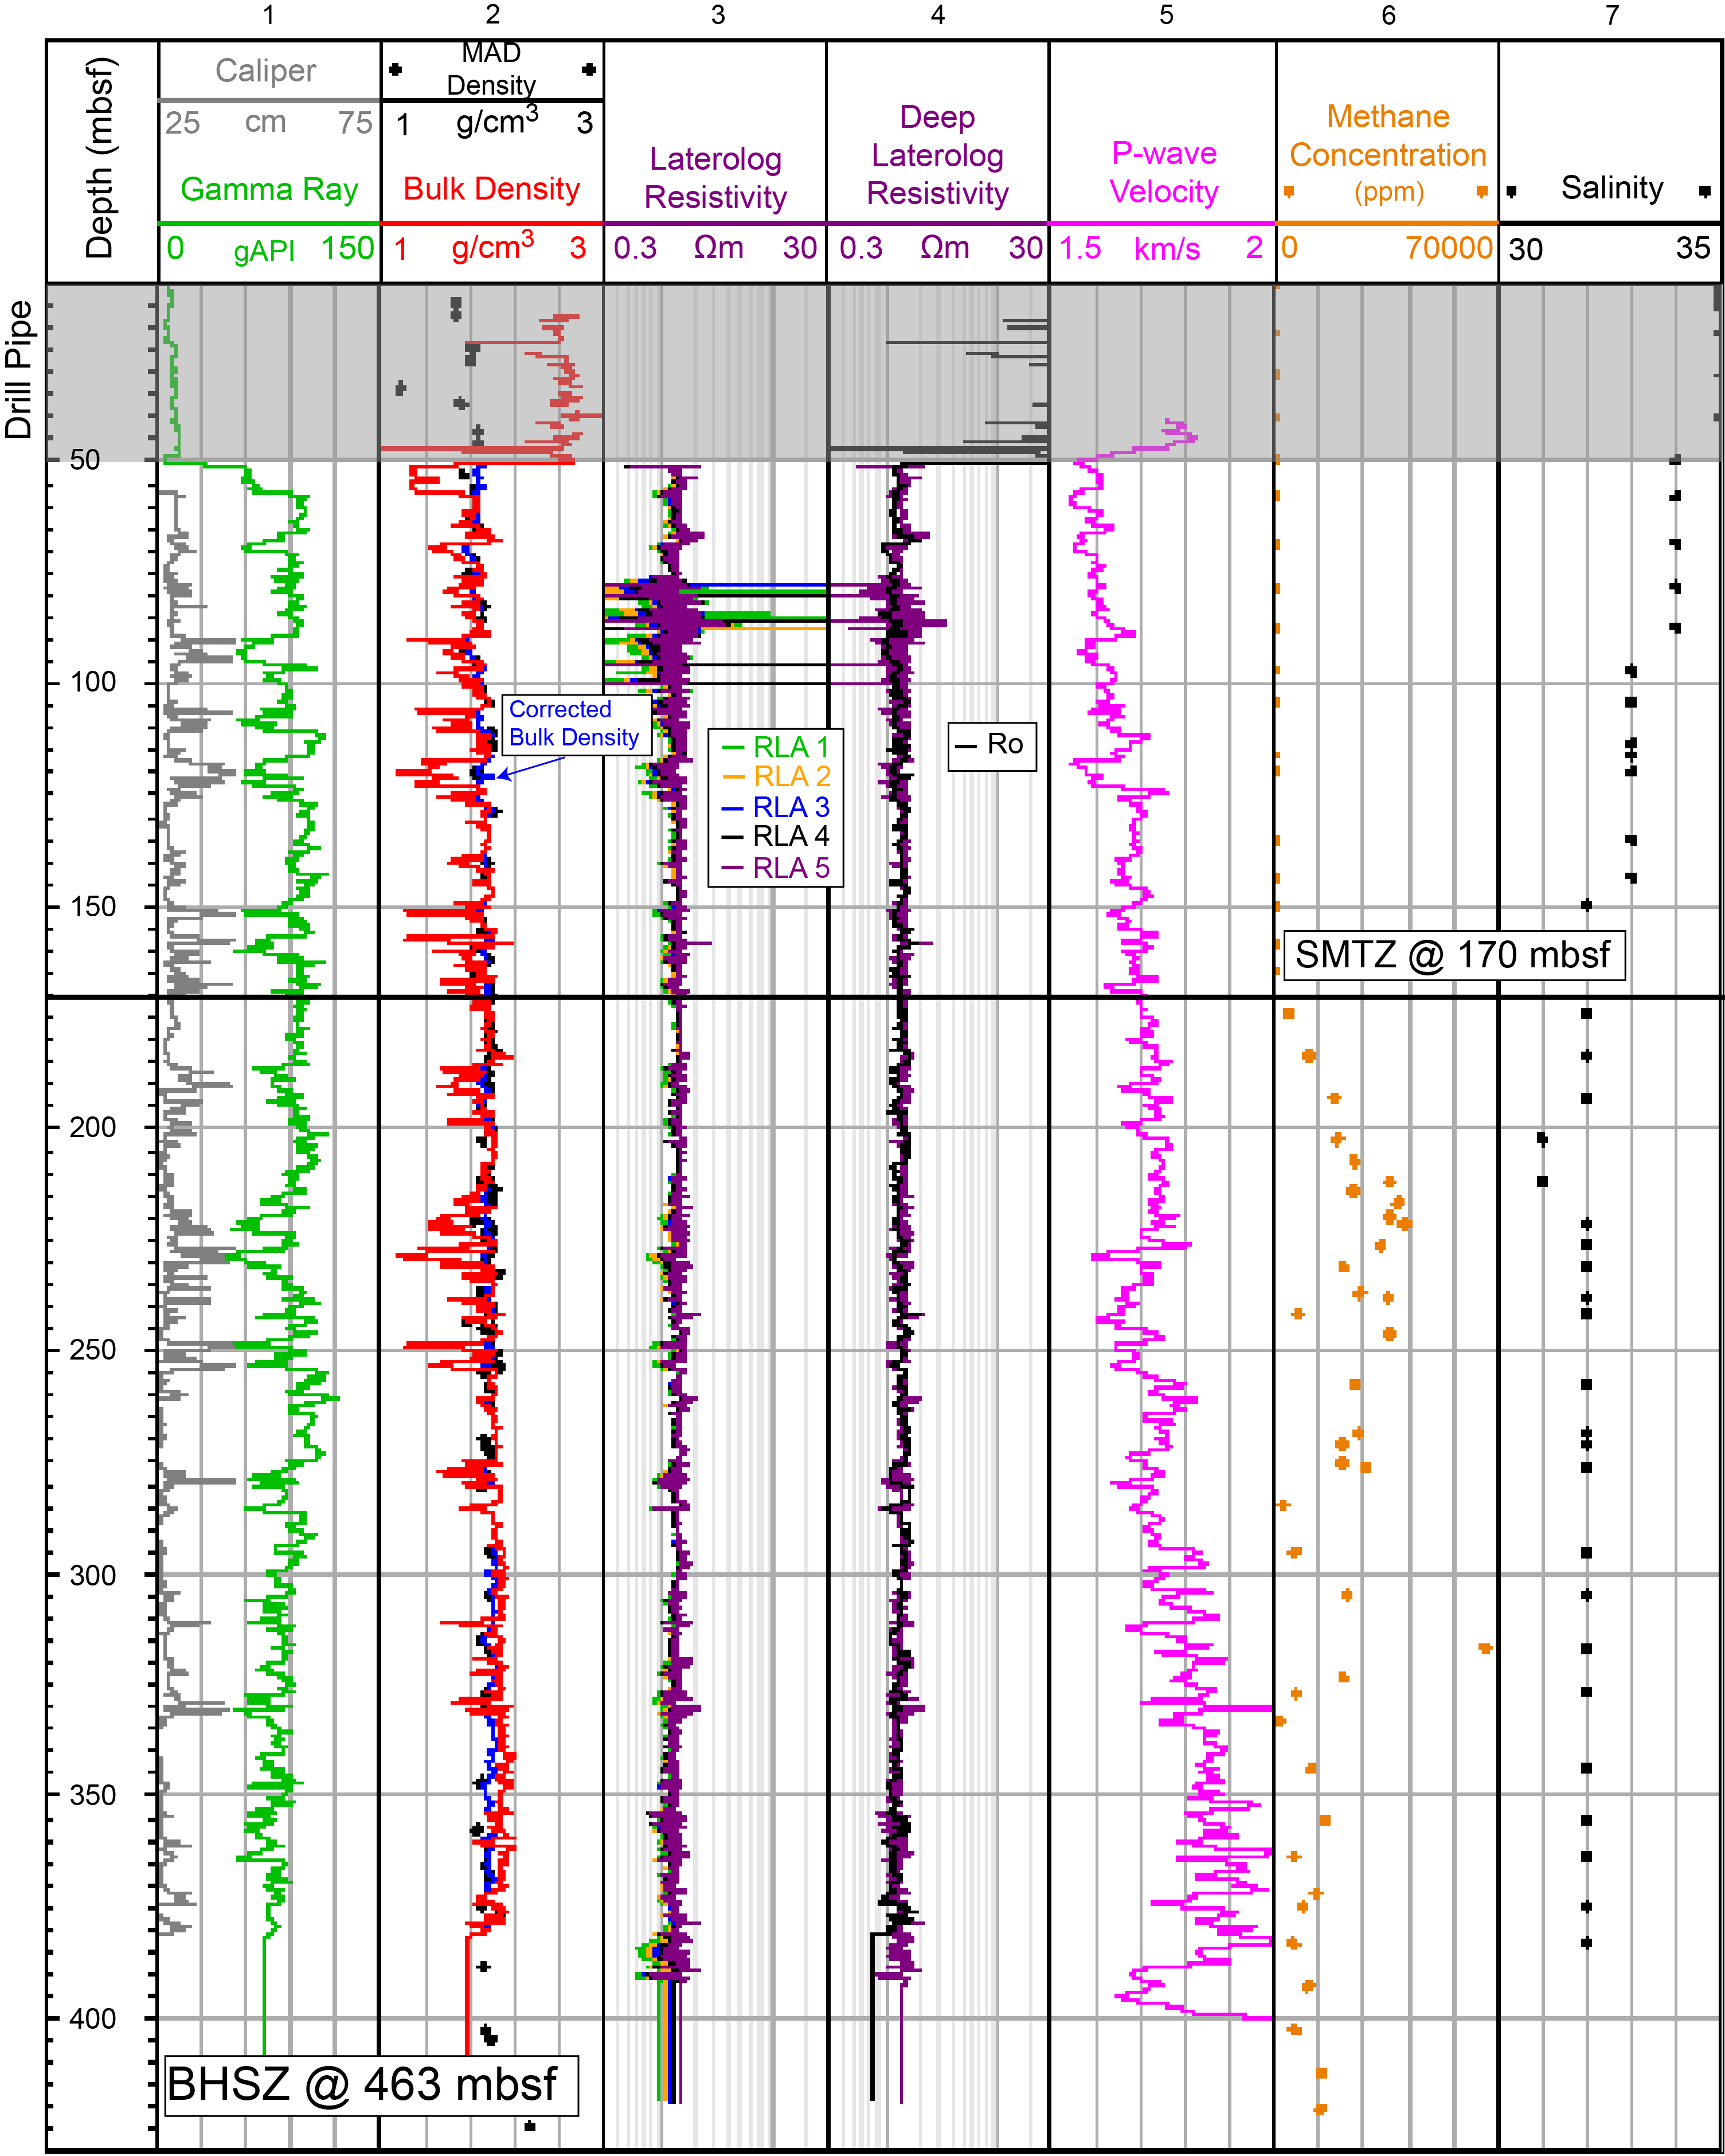
Figure F2. Downhole logs, Hole U1603D, and core data, Site U1603.
2.3. Hydrate assessment from core data
Hydrate can be assessed using core data from the shipboard gas chromatograph and pore water salinity measurements (Knutz et al., 2025a). Gas chromatography is the first analysis conducted aboard the research vessel (R/V) JOIDES Resolution. Therefore, the gas chromatograph readings provide the first insight into the intervals that have elevated gas concentrations. The elevated gas concentrations might potentially indicate intervals with hydrate because hydrate dissociation releases free gas and freshwater into the pore spaces (Claypool and Kvenvolden, 1983; Sloan and Koh, 2007). The pore water salinity would be expected to drop as compared to the background salinity at the drill sites due to the release of freshwater into the pore spaces from hydrate dissociation (Ussler and Paull, 1995). However, low-frequency pore water salinity measurements of 1–2 readings every 10 m may not capture the presence of hydrate because the hydrate needs to be sampled directly. Because of the limitations with the resolution of pore water salinity data acquired on board, it may not be possible to identify the presence of hydrate using only core data. Instead, downhole logging data would provide more accurate data to detect hydrate. This is because the downhole logs can detect hydrate even in small concentrations and acquire data in the in situ temperature and pressure conditions.
3. Hydrate assessment at the drill site locations
For each logged hole, five different laterolog resistivity measurements were acquired (RLA 1 to RLA 5) (Knutz et al., 2025a). Laterolog resistivity is measured by using electrodes that guide the current flow into the formation and prevent the current from flowing in other directions (Ellis and Singer, 2007). Laterolog resistivity is acquired in boreholes that use low-resistivity drilling muds such as seawater (Ellis and Singer, 2007). The different resistivity measurements provide resistivity for several depths of penetration into the formation (Ellis and Singer, 2007). For example, RLA 1 reads the shallowest and mostly represents the resistivity near the borehole. The depth of penetration increases from RLA 1 to RLA 5 and can read as much as 130 cm into the formation (https://iodp.tamu.edu/tools/logging/TRIPLE/hrla.html).
We interpreted RLA 5 or deep laterolog resistivity with reference to the calculated R o and observe an increase in RLA 5 in Holes U1603D and U1604B. For example, the interval 74–96 mbsf in Hole U1603D shows an increase in RLA 5 above Ro (Figure F2). Similarly, RLA 5 resistivity shows an increase with reference to Ro in the interval 75–100 mbsf in Hole U1604B (Figure F3). However, both the increases in resistivity in Holes U1603D and U1604B are above the SMTZ (Figures F2, F3). Therefore, these increases in resistivity do not indicate hydrate at the two sites. The logged Holes U1607A and U1608A have several intervals below the SMTZ where the measured resistivity RLA 5 spikes (Figures F4, F5). For example, the interval between 135 and 150 mbsf in Hole U1607A shows an increase in RLA 5, however RLA 5 does not increase above Ro; this interval is described as a bioturbated mud and sand from sediment core analysis (Knutz et al., 2025b). Moreover, the downhole logging data in this interval show high bulk density and P-wave velocity that does not indicate hydrate. The methane concentration between 135 and 150 mbsf varies from 30,000 to 40,000 ppm, indicating there is likely free gas present at specific depths where the gas concentration is measured. The pore water salinity does not decrease in the interval between 135 and 150 mbsf and follows the background salinity of 32 (Figure F4), suggesting that no hydrate is present in this interval.
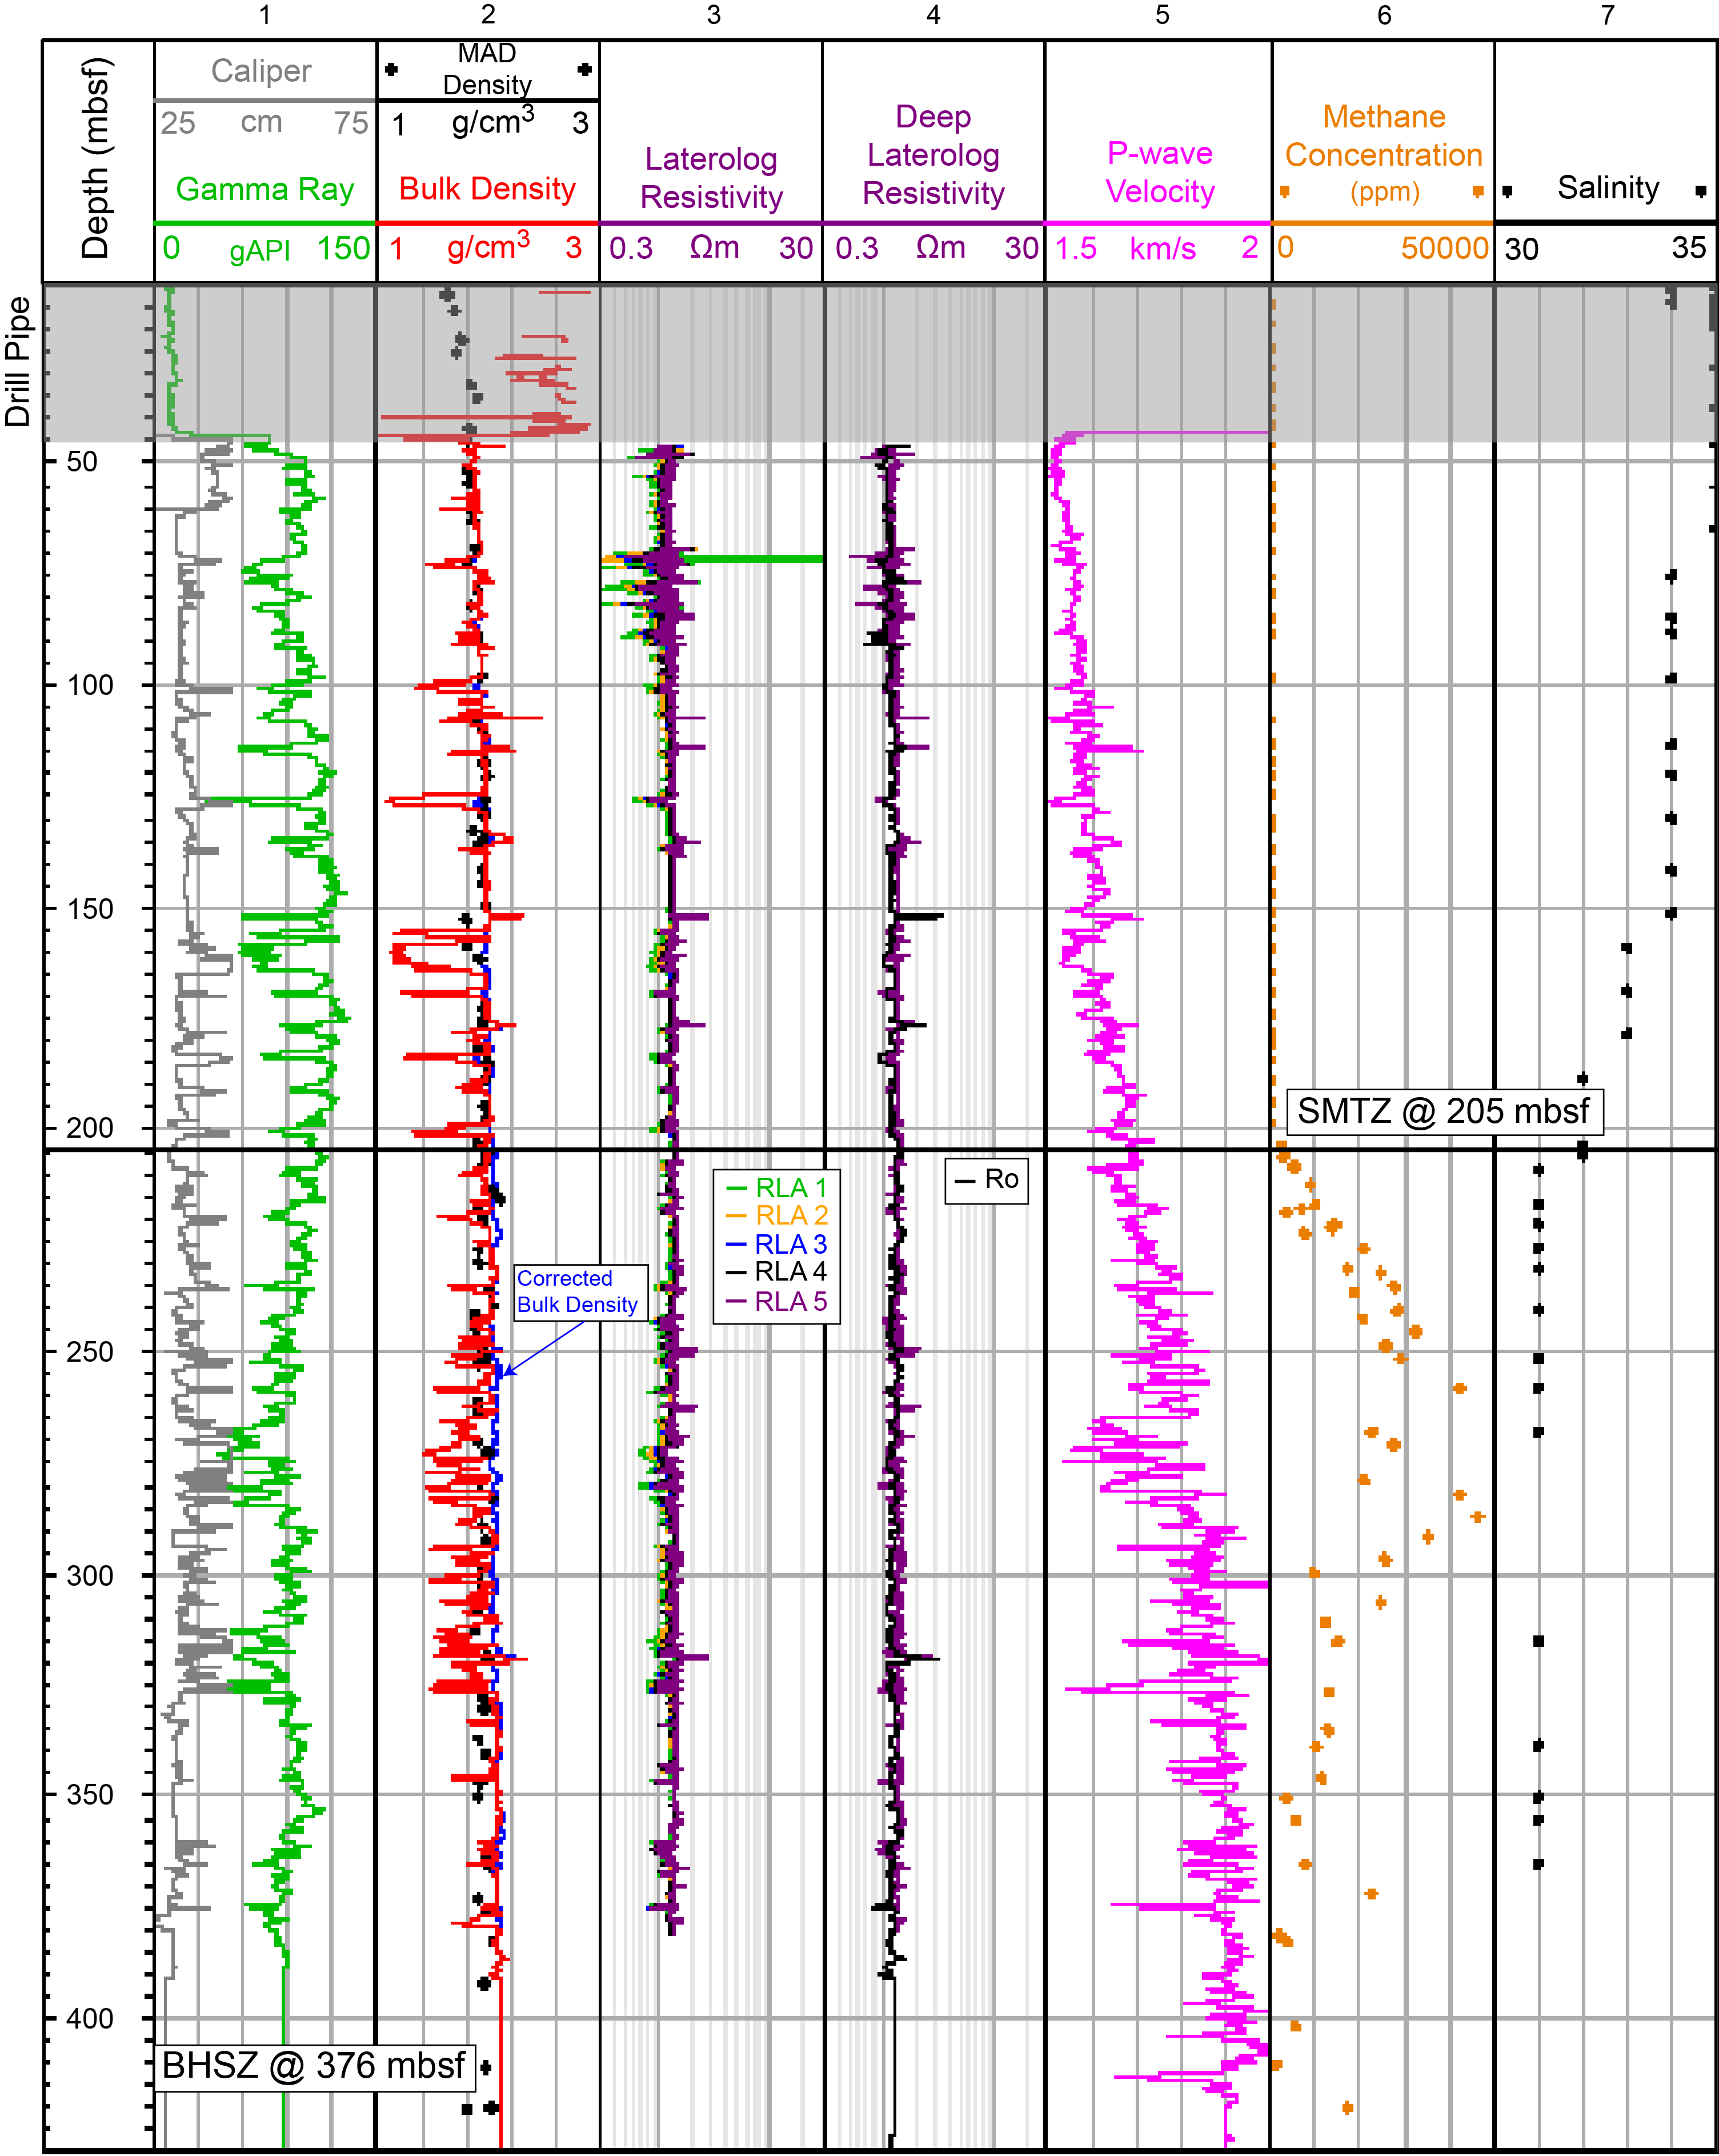
Figure F3. Downhole logs, Hole U1604B, and core data, Site U1604.
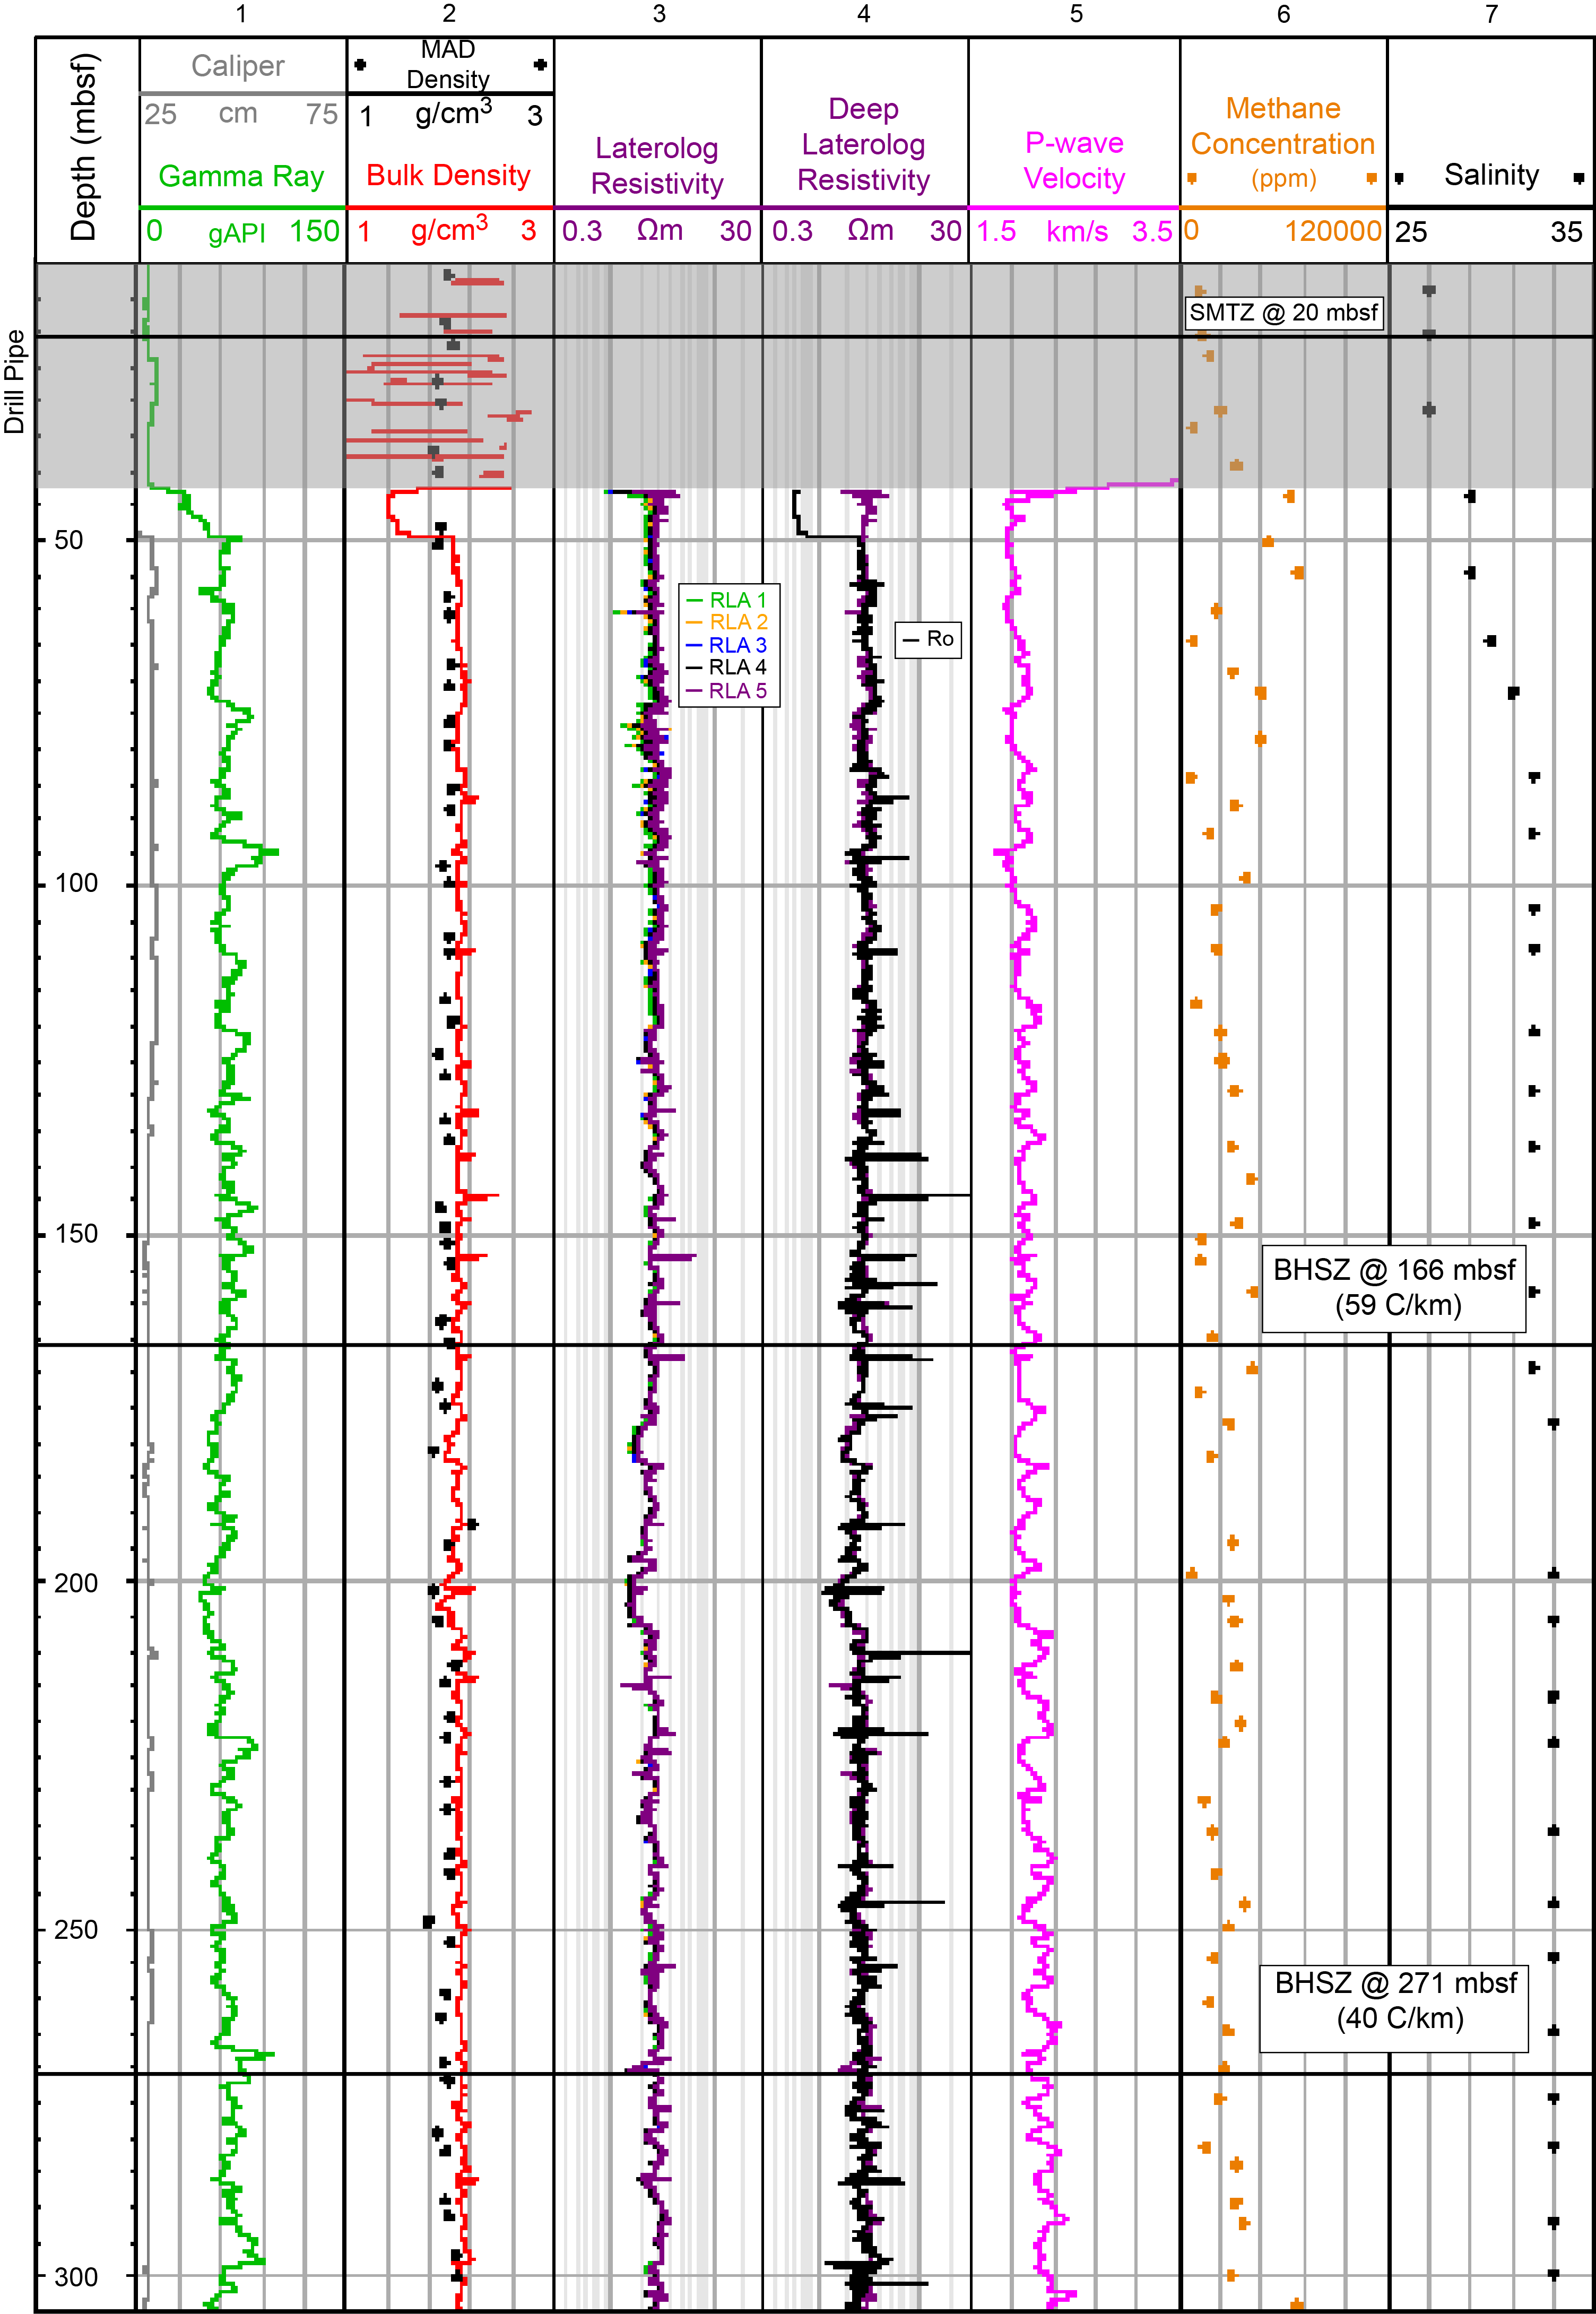
Figure F4. Downhole logs, Hole U1607A, and core data, Site U1607.
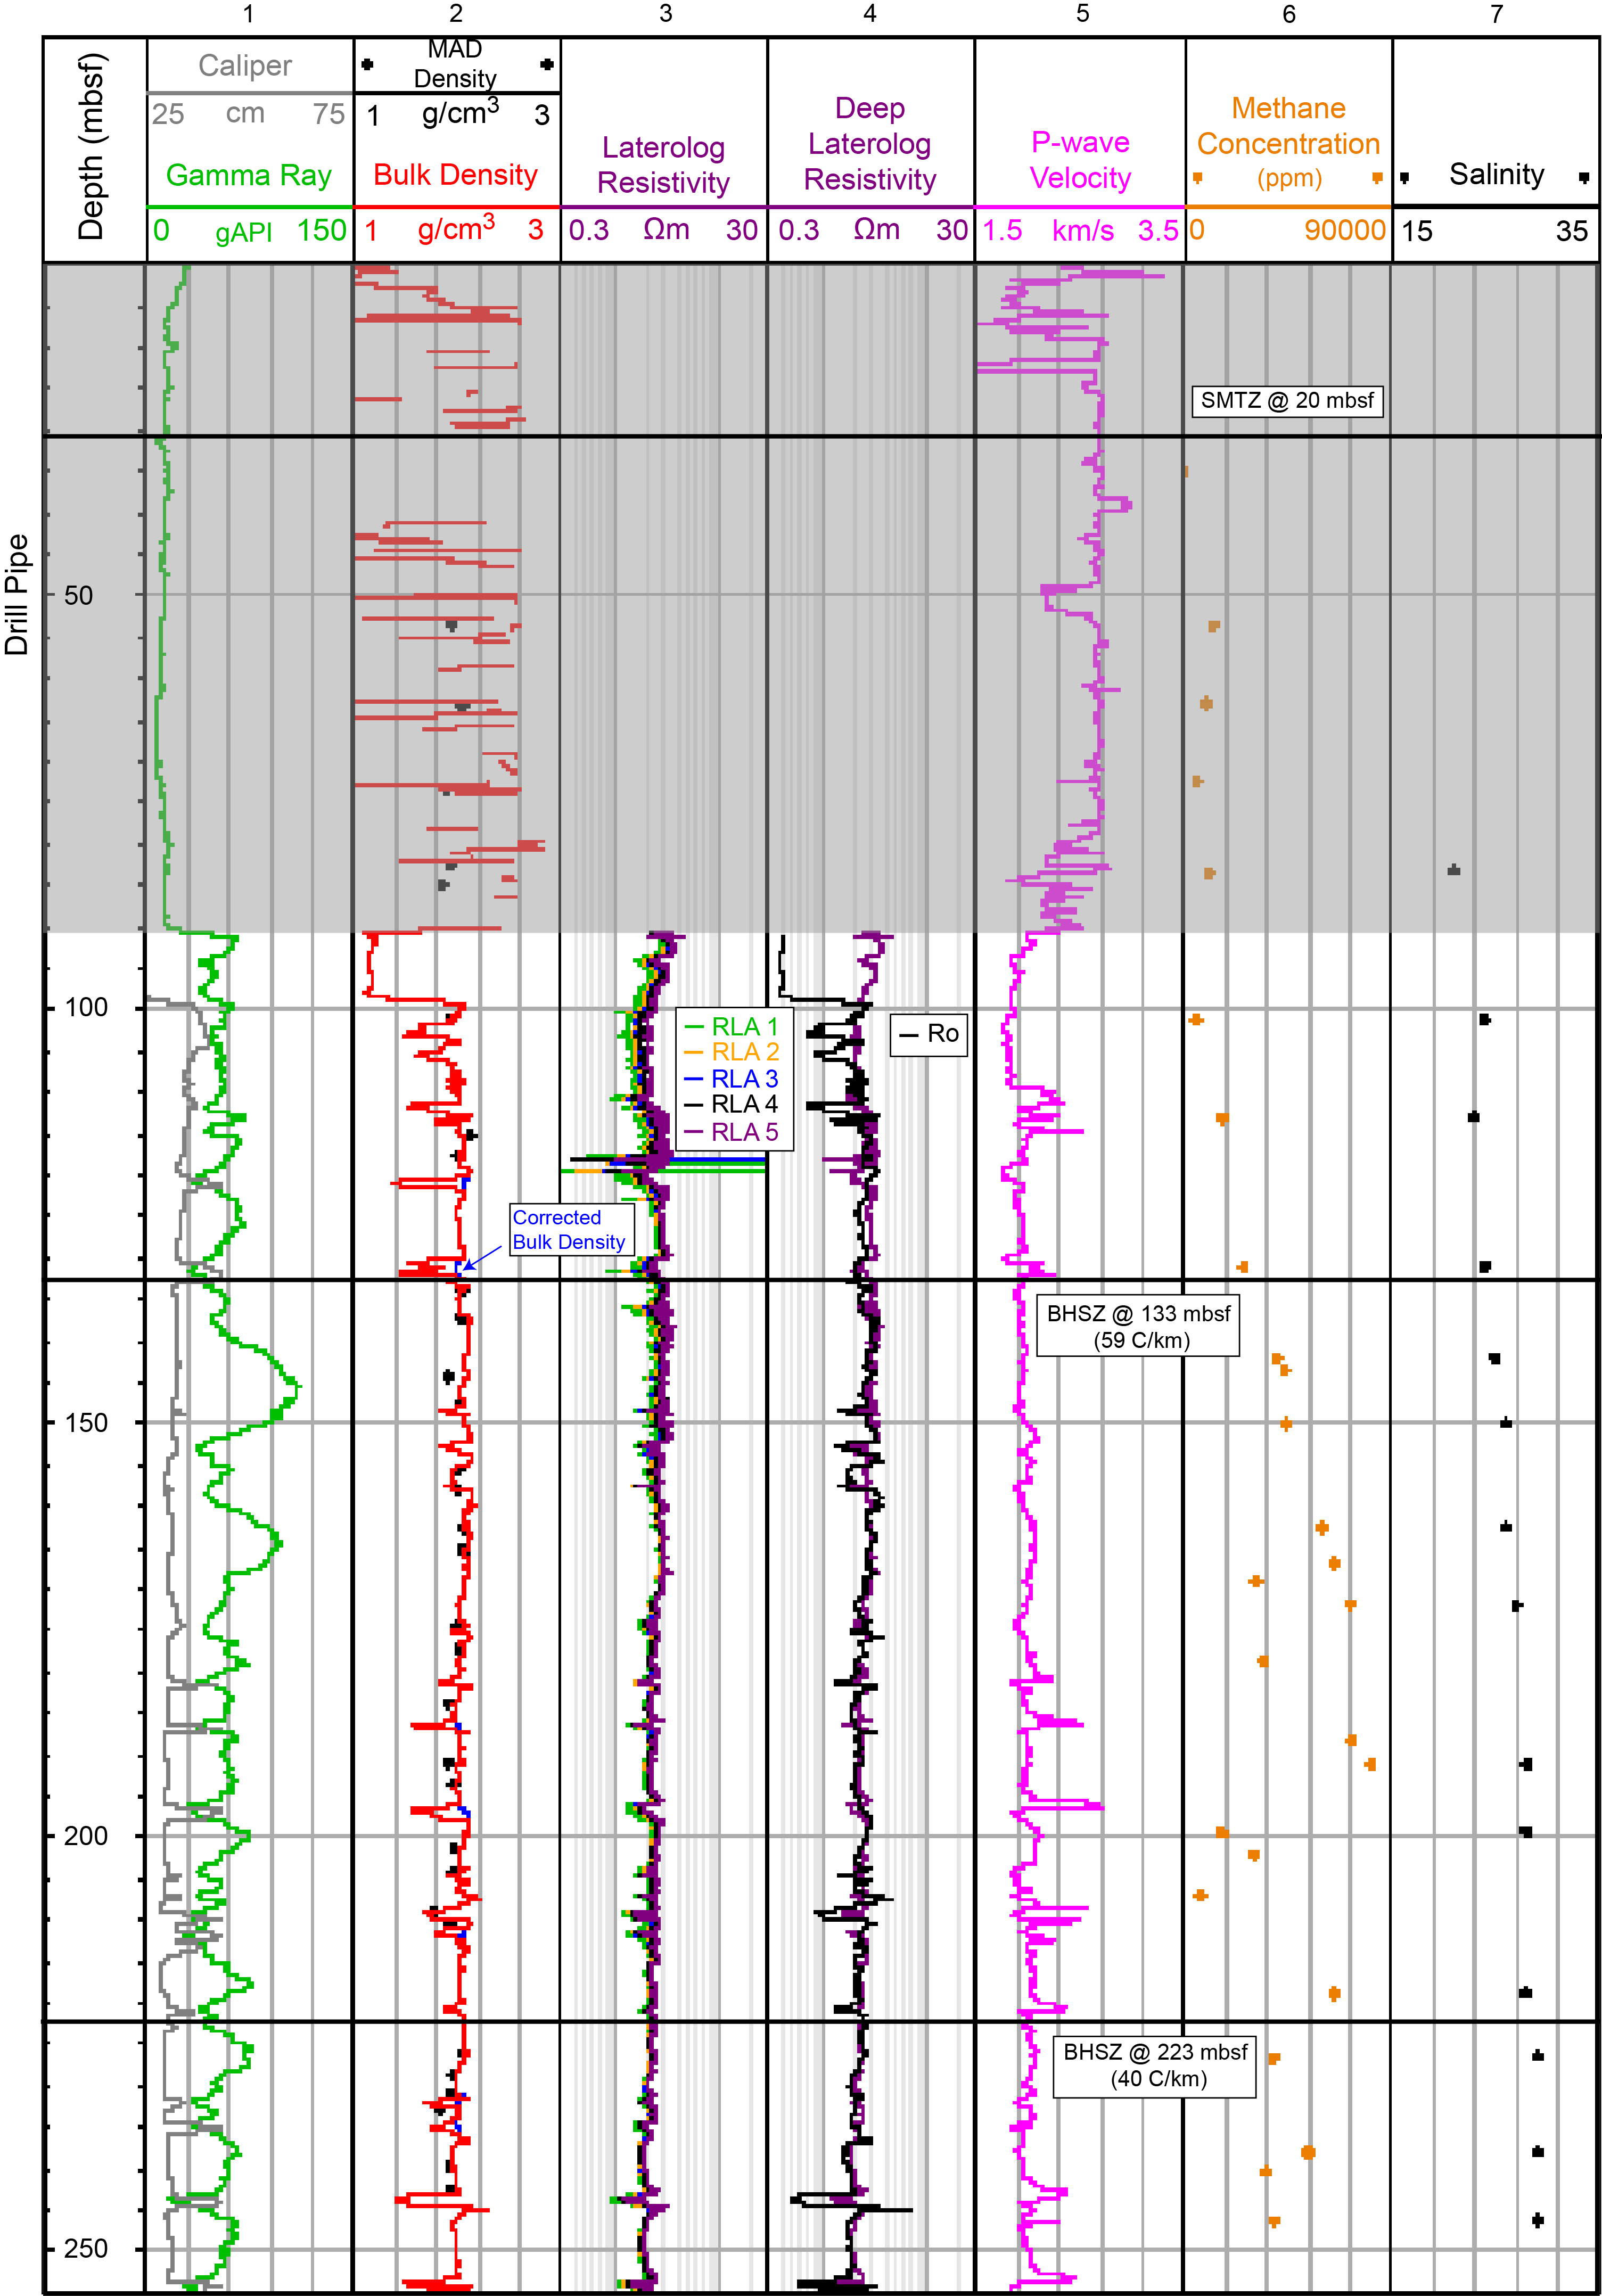
Figure F5. Downhole logs, Hole U1608A, and core data, Site U1608.
Downhole logging data were not acquired at Site U1606. Therefore, we only use the available core data to assess hydrate (Figure F6). At Site U1606, we observe that the pore water salinity drops substantially in the interval below 150 mbsf and reads between 12 and 16. The salinity increases to the background value of 31 at the bottom of the hole. Additionally, the methane concentration is observed to vary from 5,000 to 40,000 ppm below 150 mbsf and increases to 70,000 ppm at 180 mbsf. These measurements might be indicative of the presence of hydrate at Site U1606. However, it is not possible to make a conclusion without a resistivity measurement from downhole logging.
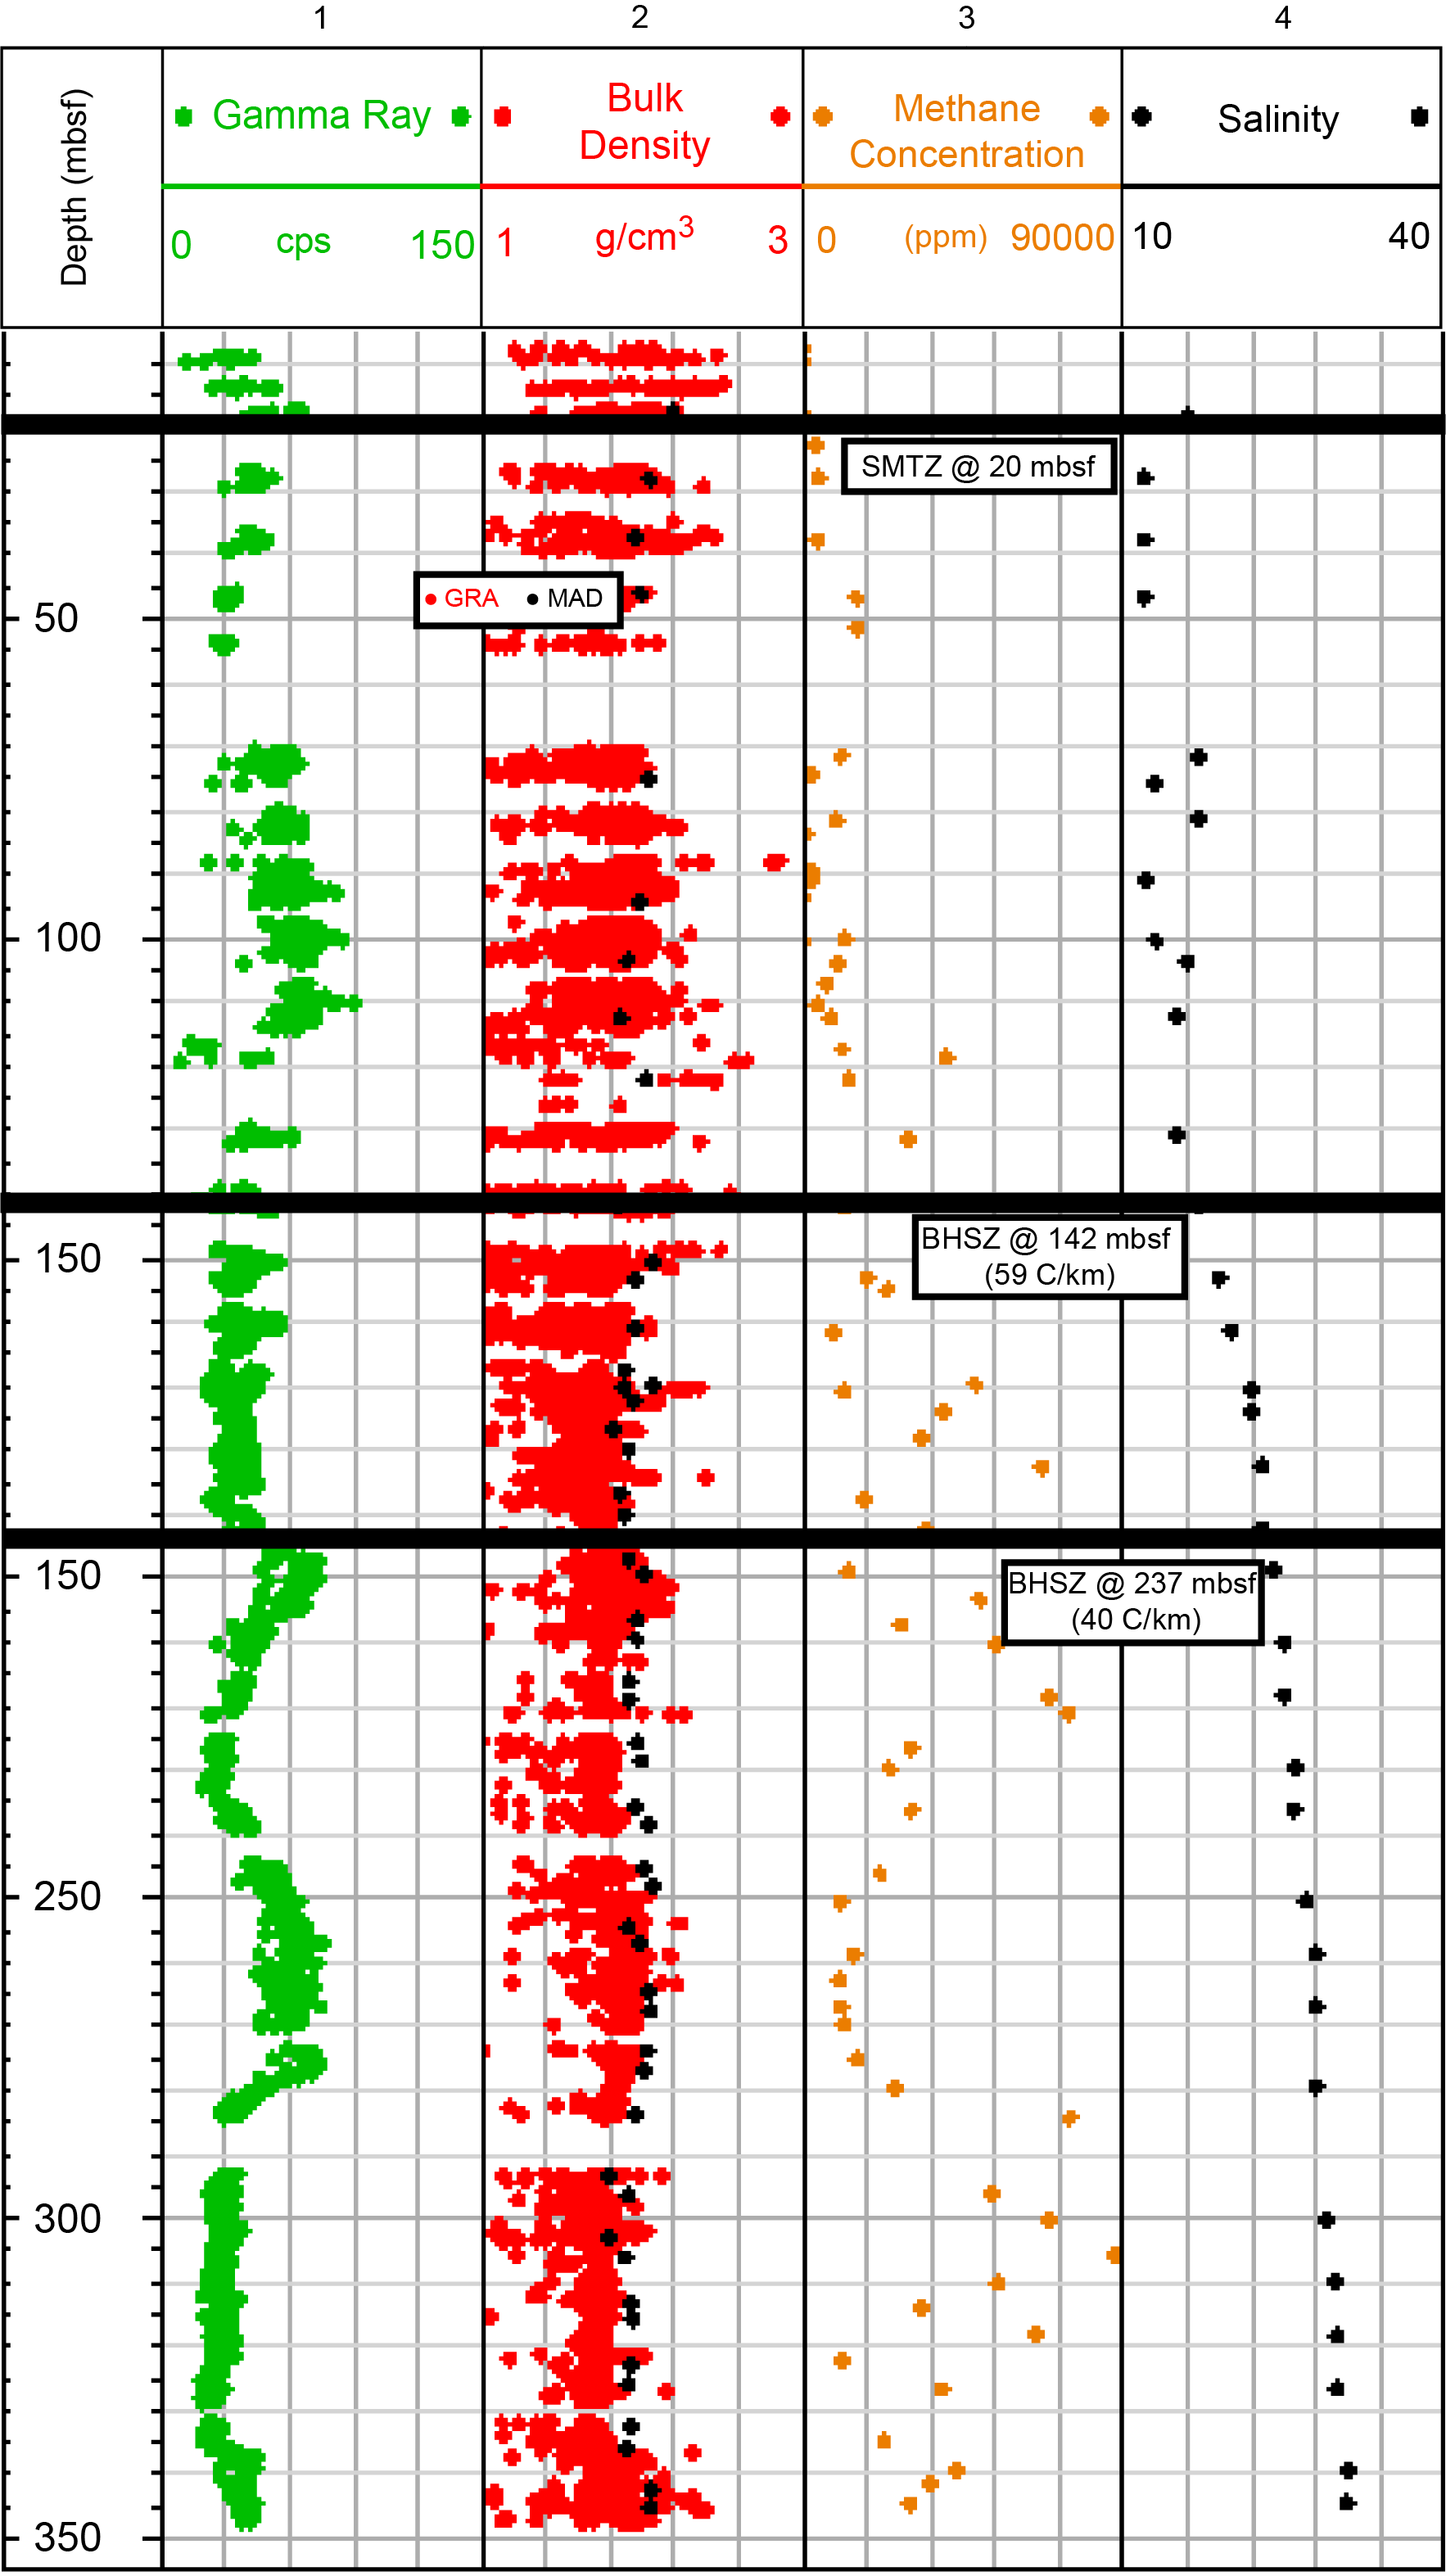
Figure F6. Core data, Site U1606.
4. Limitations of the acquired data
Although we did not observe gas hydrate using the acquired core and downhole logging data from Expedition 400, hydrate might still be present at the drill site locations. For example, the absence of downhole logs at Site U1606 presents a limitation to further characterize hydrate. In addition, no downhole logs were acquired in the upper 50 m in Hole U1607A or in the upper 90 m in the Hole U1608A (Figures F4, F5). This is due to a standard procedure on IODP expeditions, where the steel drill pipe is lowered into the hole for the upper 50–100 m to maintain hole stability during logging.
Additionally, there were limitations with the acquired sediment cores at each drill site. The cores expand upon being brought on board due to a decrease in pressure at the surface as compared to the in situ pressure. This expansion in the cores introduces uncertainties in the core depth as compared to the downhole logs as described by Malinverno et al., (2008). This depth uncertainty cannot be ignored because it might cause a depth offset of several centimeters to several meters with reference to the downhole logging data. This might mean that the presence of high gas concentrations and low pore water salinities in an interval indicating a potential presence of hydrate (Malinverno et al., 2008) might be offset by several meters with reference to the downhole logging data.
5. Conclusions
We did not find hydrate at Expedition 400 sites using the acquired data from cores and downhole logs. However, the presence of hydrate at Expedition 400 sites cannot be confirmed or denied due to the limitations of the acquired data. Moreover, the proximity of the BSR identified by Cox et al. (2021) to the Expedition 400 sites provide evidence that hydrate is present in the study area in Baffin Bay. Although our BHSZ calculation at the drill site locations does not directly link with the scientific objectives of Expedition 400, the BHSZ results will still be useful for any future research on hydrate in Baffin Bay.
6. Acknowledgments
This research used the data acquired by IODP Expedition 400. We thank and acknowledge IODP, Texas A&M staff, Schlumberger and the JOIDES Resolution crew. We thank Schlumberger for donating Techlog software. F. Naim was supported by IODP Salary Support.
References
Archie, G.E., 1942. The electrical resistivity log as an aid in determining some reservoir characteristics. Transactions of the AIME, 146(01):54–62. https://doi.org/10.2118/942054-G
Borowski, W.S., Paull, C.K., and Ussler, W., 1999. Global and local variations of interstitial sulfate gradients in deep-water, continental margin sediments: Sensitivity to underlying methane and gas hydrates. Marine Geology, 159(1):131–154. https://doi.org/10.1016/S0025-3227(99)00004-3
Boswell, R., Shipp, C., Reichel, T., Shelander, D., Saeki, T., Frye, M., Shedd, W., Collett, T.S., and McConnell, D.R., 2016. Prospecting for marine gas hydrate resources. Interpretation, 4(1):SA13–SA24. https://doi.org/10.1190/INT-2015-0036.1
Boyer, T.P., García, H.E., Locarnini, R.A., Zweng, M.M., Mishonov, A.V., Reagan, J.R., Weathers, K.A., Baranova, O.K., Paver, C.R., Seidov, D., and Smolyar, I.V., 2018. World Ocean Atlas 2018. NOAA National Centers for Environmental Information. https://www.ncei.noaa.gov/archive/accession/NCEI-WOA18
Buffett, B., and Archer, D., 2004. Global inventory of methane clathrate: sensitivity to changes in the deep ocean. Earth and Planetary Science Letters, 227(3):185–199. https://doi.org/10.1016/j.epsl.2004.09.005
Claypool, G.E., and Kvenvolden, K.A., 1983. Methane and other hydrocarbon gases in marine sediment. Annual Review of Earth and Planetary Sciences, 11(1):299–327. https://doi.org/10.1146/annurev.ea.11.050183.001503
Cox, D.R., Huuse, M., Newton, A.M.W., Sarkar, A.D., and Knutz, P.C., 2021. Shallow gas and gas hydrate occurrences on the northwest Greenland shelf margin. Marine Geology, 432:106382. https://doi.org/10.1016/j.margeo.2020.106382
Ellis, D.V., and Singer, J.M., 2007. Well Logging for Earth Scientists (2nd edition): New York (Elsevier). https://doi.org/10.1007/978-1-4020-4602-5
Fofonoff, N.P., and Millard Jr, R.C., 1983. Algorithms for the computation of fundamental properties of seawater. UNESCO Technical Papers in Marine Sciences, 44:1–53. https://doi.org/10.25607/OBP-1450
Goldberg, D.S., Kleinberg, R.L., Weinberger, J.L., Malinverno, A., McLellan, P.J., and Collett, T.S., 2010. Evaluation of natural gas-hydrate systems using borehole logs. In Riedel, M., Willoughby, E.C., and Chopra, S. (Eds.), Geophysical Characterization of Gas Hydrates. SEG Geophysical Developments Series, 14:239–261. https://doi.org/10.1190/1.9781560802197.ch16
Haacke, R.R., Westbrook, G.K., and Hyndman, R.D., 2007. Gas hydrate, fluid flow and free gas: Formation of the bottom-simulating reflector. Earth and Planetary Science Letters, 261(3):407–420. https://doi.org/10.1016/j.epsl.2007.07.008
Knutz, P.C., Jennings, A.E., Childress, L.B., Bryant, R., Cargill, S.K., Coxall, H.K., Frank, T.D., Grant, G.R., Gray, R.E., Ives, L., Kumar, V., Le Houedec, S., Martens, J., Naim, F., Nelissen, M., Özen, V., Passchier, S., Pérez, L.F., Ren, J., Romans, B.W., Seki, O., Staudigel, P., Tauxe, L., Tibbett, E.J., Yokoyama, Y., Zhang, Y., and Zimmermann, H., 2025a. Expedition 400 methods. In Knutz, P.C., Jennings, A.E., Childress, L.B., and the Expedition 400 Scientists, NW Greenland Glaciated Margin. Proceedings of the International Ocean Discovery Program, 400: College Station, TX (International Ocean Discovery Program). https://doi.org/10.14379/iodp.proc.400.102.2025
Knutz, P.C., Jennings, A.E., Childress, L.B., Bryant, R., Cargill, S.K., Coxall, H.K., Frank, T.D., Grant, G.R., Gray, R.E., Ives, L., Kumar, V., Le Houedec, S., Martens, J., Naim, F., Nelissen, M., Özen, V., Passchier, S., Pérez, L.F., Ren, J., Romans, B.W., Seki, O., Staudigel, P., Tauxe, L., Tibbett, E.J., Yokoyama, Y., Zhang, Y., and Zimmermann, H., 2025b. Expedition 400 summary. In Knutz, P.C., Jennings, A.E., Childress, L.B., and the Expedition 400 Scientists, NW Greenland Glaciated Margin. Proceedings of the International Ocean Discovery Program, 400: College Station, TX (International Ocean Discovery Program). https://doi.org/10.14379/iodp.proc.400.101.2025
Knutz, P.C., Jennings, A.E., Childress, L.B., Bryant, R., Cargill, S.K., Coxall, H.K., Frank, T.D., Grant, G.R., Gray, R.E., Ives, L., Kumar, V., Le Houedec, S., Martens, J., Naim, F., Nelissen, M., Özen, V., Passchier, S., Pérez, L.F., Ren, J., Romans, B.W., Seki, O., Staudigel, P., Tauxe, L., Tibbett, E.J., Yokoyama, Y., Zhang, Y., and Zimmermann, H., 2025c. Site U1603. In Knutz, P.C., Jennings, A.E., Childress, L.B., and the Expedition 400 Scientists, NW Greenland Glaciated Margin. Proceedings of the International Ocean Discovery Program, 400: College Station, TX (International Ocean Discovery Program). https://doi.org/10.14379/iodp.proc.400.103.2025
Knutz, P.C., Jennings, A.E., Childress, L.B., Bryant, R., Cargill, S.K., Coxall, H.K., Frank, T.D., Grant, G.R., Gray, R.E., Ives, L., Kumar, V., Le Houedec, S., Martens, J., Naim, F., Nelissen, M., Özen, V., Passchier, S., Pérez, L.F., Ren, J., Romans, B.W., Seki, O., Staudigel, P., Tauxe, L., Tibbett, E.J., Yokoyama, Y., Zhang, Y., and Zimmermann, H., 2025d. Site U1604. In Knutz, P.C., Jennings, A.E., Childress, L.B., and the Expedition 400 Scientists, NW Greenland Glaciated Margin. Proceedings of the International Ocean Discovery Program, 400: College Station, TX (International Ocean Discovery Program). https://doi.org/10.14379/iodp.proc.400.104.2025
Knutz, P.C., Jennings, A.E., Childress, L.B., Bryant, R., Cargill, S.K., Coxall, H.K., Frank, T.D., Grant, G.R., Gray, R.E., Ives, L., Kumar, V., Le Houedec, S., Martens, J., Naim, F., Nelissen, M., Özen, V., Passchier, S., Pérez, L.F., Ren, J., Romans, B.W., Seki, O., Staudigel, P., Tauxe, L., Tibbett, E.J., Yokoyama, Y., Zhang, Y., and Zimmermann, H., 2025e. Site U1607. In Knutz, P.C., Jennings, A.E., Childress, L.B., and the Expedition 400 Scientists, NW Greenland Glaciated Margin. Proceedings of the International Ocean Discovery Program, 400: College Station, TX (International Ocean Discovery Program). https://doi.org/10.14379/iodp.proc.400.107.2025
Knutz, P.C., Jennings, A.E., Childress, L.B., Bryant, R., Cargill, S.K., Coxall, H.K., Frank, T.D., Grant, G.R., Gray, R.E., Ives, L., Kumar, V., Le Houedec, S., Martens, J., Naim, F., Nelissen, M., Özen, V., Passchier, S., Pérez, L.F., Ren, J., Romans, B.W., Seki, O., Staudigel, P., Tauxe, L., Tibbett, E.J., Yokoyama, Y., Zhang, Y., and Zimmermann, H., 2025f. Site U1608. In Knutz, P.C., Jennings, A.E., Childress, L.B., and the Expedition 400 Scientists, NW Greenland Glaciated Margin. Proceedings of the International Ocean Discovery Program, 400: College Station, TX (International Ocean Discovery Program). https://doi.org/10.14379/iodp.proc.400.108.2025
Koppers, A., and Coggon, R. (Eds.), 2020. Exploring Earth by Scientific Ocean Drilling: 2050 Science Framework: San Diego, CA (UC San Diego Library). https://doi.org/10.6075/J0W66J9H
Kvenvolden, K.A., 1993. Gas hydrates—geological perspective and global change. Reviews of Geophysics, 31(2):173–187. https://doi.org/10.1029/93RG00268
Majumdar, U., Cook, A.E., Scharenberg, M., Burchwell, A., Ismail, S., Frye, M., and Shedd, W., 2017. Semi-quantitative gas hydrate assessment from petroleum industry well logs in the northern Gulf of Mexico. Marine and Petroleum Geology, 85:233–241. https://doi.org/10.1016/j.marpetgeo.2017.05.009
Malinverno, A., Kastner, M., Torres, M.E., and Wortmann, U.G., 2008. Gas hydrate occurrence from pore water chlorinity and downhole logs in a transect across the northern Cascadia margin (Integrated Ocean Drilling Program Expedition 311). Journal of Geophysical Research: Solid Earth, 113. https://doi.org/10.1029/2008JB005702
Milkov, A.V., 2004. Global estimates of hydrate-bound gas in marine sediments: how much is really out there? Earth-Science Reviews, 66(3):183–197. https://doi.org/10.1016/j.earscirev.2003.11.002
Ruppel, C.D., 2011. Methane hydrates and contemporary climate change. Nature Education Knowledge, 3(10). https://www.nature.com/scitable/knowledge/library/methane-hydrates-and-contemporary-climate-change-24314790/
Sheriff, R.E., 1975. Factors affecting seismic amplitudes. Geophysical Prospecting, 23(1):125–138. https://doi.org/10.1111/j.1365-2478.1975.tb00685.x
Shipley, T.H., Houston, M.H., Buffler, R.T., Shaub, F.J., McMillen, K.J., Ladd, J.W., and Worzel, J.L., 1979. Seismic evidence for widespread possible gas hydrate horizons on continental slopes and rises. AAPG Bulletin, 63(14):2204–2213. https://doi.org/10.1306/2f91890a-16ce-11d7-8645000102c1865d
Sloan, E.D., Jr. & Koh, C.A., 2007. Clathrate Hydrates of Natural Gases (3rd ed.): Boca Raton (CRC Press). https://doi.org/10.1201/9781420008494
Tishchenko, P., Hensen, C., Wallmann, K., and Wong, C.S., 2005. Calculation of the stability and solubility of methane hydrate in seawater. Chemical Geology, 219(1):37–52. https://doi.org/10.1016/j.chemgeo.2005.02.008
Ussler, W., and Paull, C.K., 1995. Effects of ion exclusion and isotopic fractionation on pore water geochemistry during gas hydrate formation and decomposition. Geo-Marine Letters, 15(1):37–44. https://doi.org/10.1007/BF01204496