Lucchi, R.G., St. John, K.E.K., Ronge, T.A., and the Expedition 403 Scientists
Proceedings of the International Ocean Discovery Program Volume 403
publications.iodp.org
https://doi.org/10.14379/iodp.proc.403.107.2026
Site U16241
![]() R.G. Lucchi,
R.G. Lucchi,
![]() K.E.K. St. John,
K.E.K. St. John,
![]() T.A. Ronge,
T.A. Ronge,
![]() M.A. Barcena,
M.A. Barcena,
![]() S. De Schepper,
S. De Schepper,
![]() L.C. Duxbury,
L.C. Duxbury,
![]() A.C. Gebhardt,
A.C. Gebhardt,
![]() A. Gonzalez-Lanchas,
A. Gonzalez-Lanchas,
![]() G. Goss,
G. Goss,
![]() N.M. Greco,
N.M. Greco,
![]() J. Gruetzner,
J. Gruetzner,
![]() L. Haygood,
L. Haygood,
![]() K. Husum,
K. Husum,
![]() M. Iizuka,
M. Iizuka,
![]() A.K.I.U. Kapuge,
A.K.I.U. Kapuge,
![]() A.R. Lam,
A.R. Lam,
![]() O. Libman-Roshal,
O. Libman-Roshal,
![]() Y. Liu,
Y. Liu,
![]() L.R. Monito,
L.R. Monito,
![]() B.T. Reilly,
B.T. Reilly,
![]() Y. Rosenthal,
Y. Rosenthal,
![]() Y. Sakai,
Y. Sakai,
![]() A.V. Sijinkumar,
A.V. Sijinkumar,
![]() Y. Suganuma, and
Y. Suganuma, and
![]() Y. Zhong2
Y. Zhong2
1 Lucchi, R.G., St. John, K.E.K., Ronge, T.A., Barcena, M.A., De Schepper, S., Duxbury, L.C., Gebhardt, A.C., Gonzalez-Lanchas, A., Goss, G., Greco, N.M., Gruetzner, J., Haygood, L., Husum, K., Iizuka, M., Kapuge, A.K.I.U., Lam, A.R., Libman-Roshal, O., Liu, Y., Monito, L.R., Reilly, B.T., Rosenthal, Y., Sakai, Y., Sijinkumar, A.V., Suganuma, Y., and Zhong, Y., 2026. Site U1624. In Lucchi, R.G., St. John, K.E.K., Ronge, T.A., and the Expedition 403 Scientists, Eastern Fram Strait Paleo-Archive. Proceedings of the International Ocean Discovery Program, 403: College Station, TX (International Ocean Discovery Program). https://doi.org/10.14379/iodp.proc.403.107.2026
2 Expedition 403 Scientists’ affiliations.
1. Background and objectives
The Isfjorden drift coring site is located on the slope proximal area (~1320 m water depth) of a plastered sediment drift that developed along the western continental margin of Svalbard under the influence of the northward-flowing West Spitsbergen Current (WSC) (Rebesco et al., 2013) (Figure F1). The Isfjorden drift has built up over millions of years since the opening of the Fram Strait (17–10 Ma; Jakobsson et al., 2007; Engen et al., 2008; Ehlers and Jokat, 2013), which determined the onset of the contour current circulation system in the area (Eiken and Hinz, 1993; Gebhardt et al., 2014), with development of sediment drifts covering large areas of the European North Atlantic margin including the Norwegian Sea, Barents Sea, western Svalbard, and the eastern side of the Fram Strait (Laberg et al., 2005). Sediment drifts are depocenters developing under persistent bottom currents that substantially rework the sediments delivered to the marine environment through terrestrial and marine processes (Stow et al., 2002; Rebesco et al., 2014a). In addition to sediments, the bottom currents transport oxygen and nutrients along the margin, generating ideal environmental conditions for biological productivity, with sediments rich in carbonate biogenic fraction if postmortem diagenetic conditions allow for their preservation.
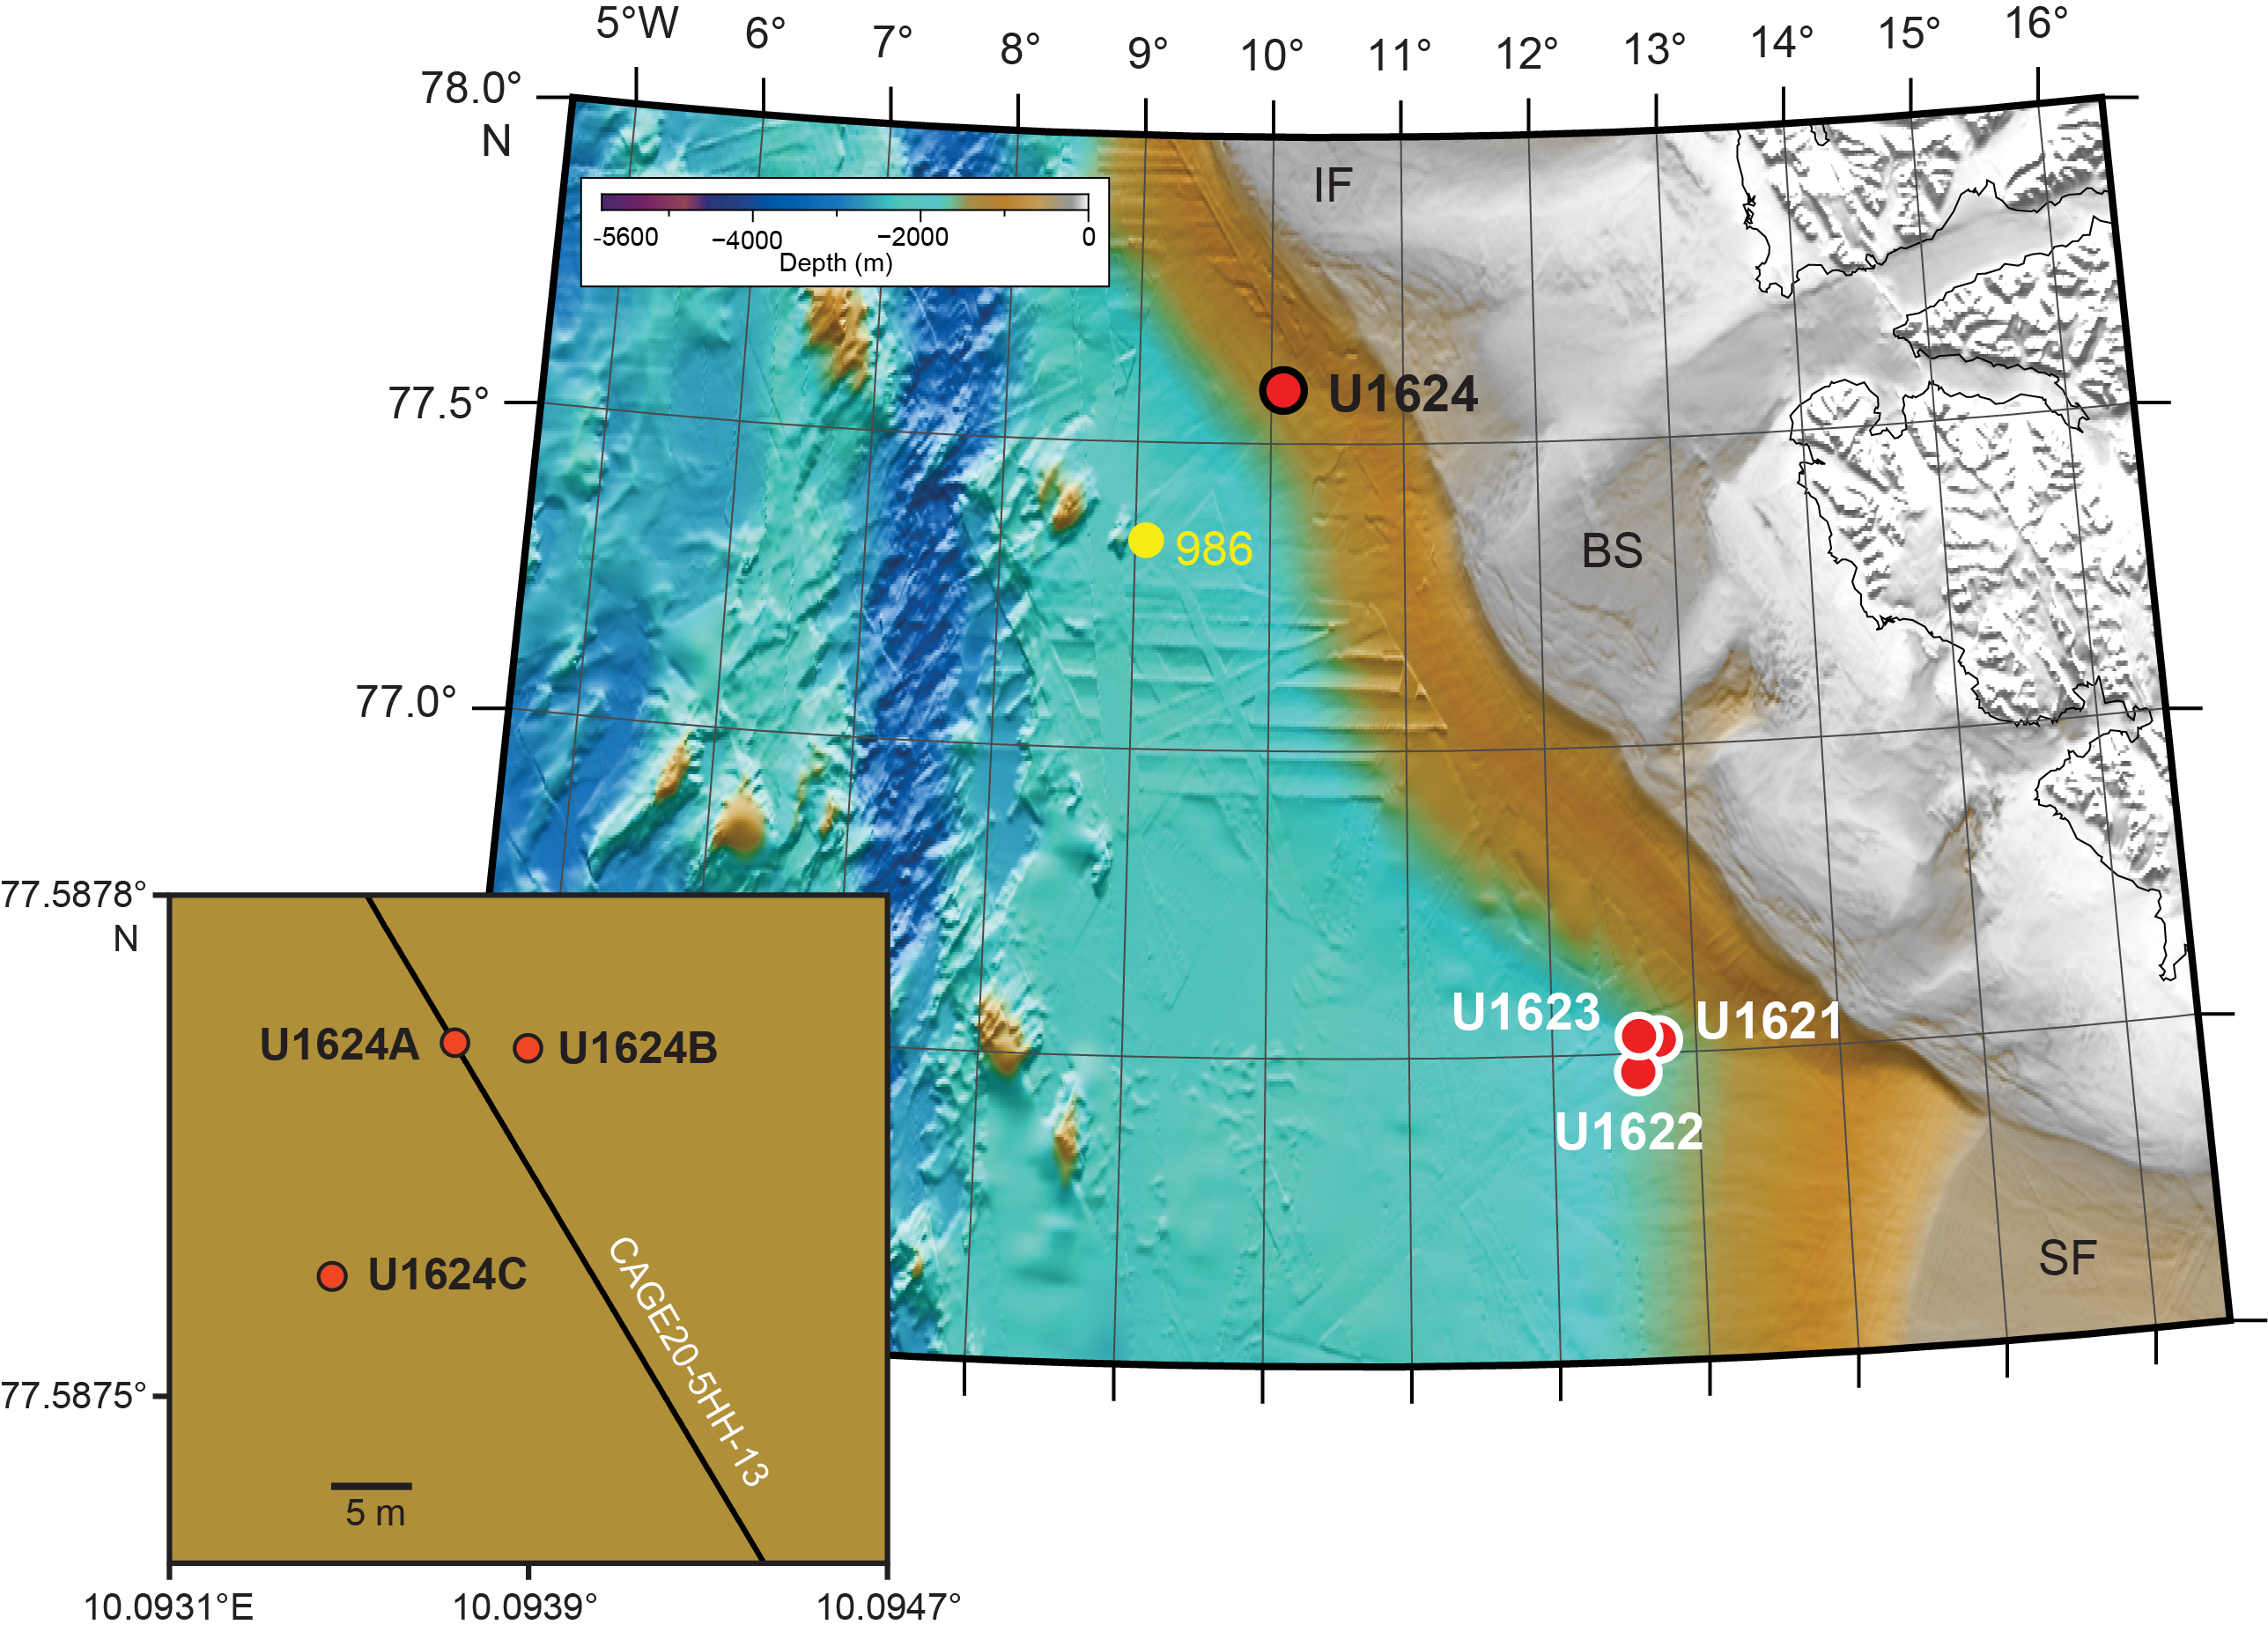
Figure F1. Bathymetric map.
A previous drill site, Site 986 (Ocean Drilling Program Leg 162; Shipboard Scientific Party, 1996; Raymo et al., 1999), is located in the deeper, distal slope facing the Isfjorden drift to examine the onset of glaciation in the European Arctic and establish the history of the paleo-Svalbard–Barents Sea Ice Sheet (SBSIS). At Site 986, a ~2.4 My sequence of primarily fine- to coarse-grained siliciclastic sediments with varying amounts of gravel, interpreted as ice-rafted debris and considered to represent the depositional record after the onset of the Northern Hemisphere glaciation, was recovered. The sequence contains a main shift in the glacial style with an increased volume of debris flow sedimentation that was related to the onset of shelf-edge glaciations in the western margin of Svalbard (Raymo et al., 1999) considered to correspond to Seismic Reflector R4A dating ~1.3 Ma (Rebesco et al., 2014b) (Figure F2).
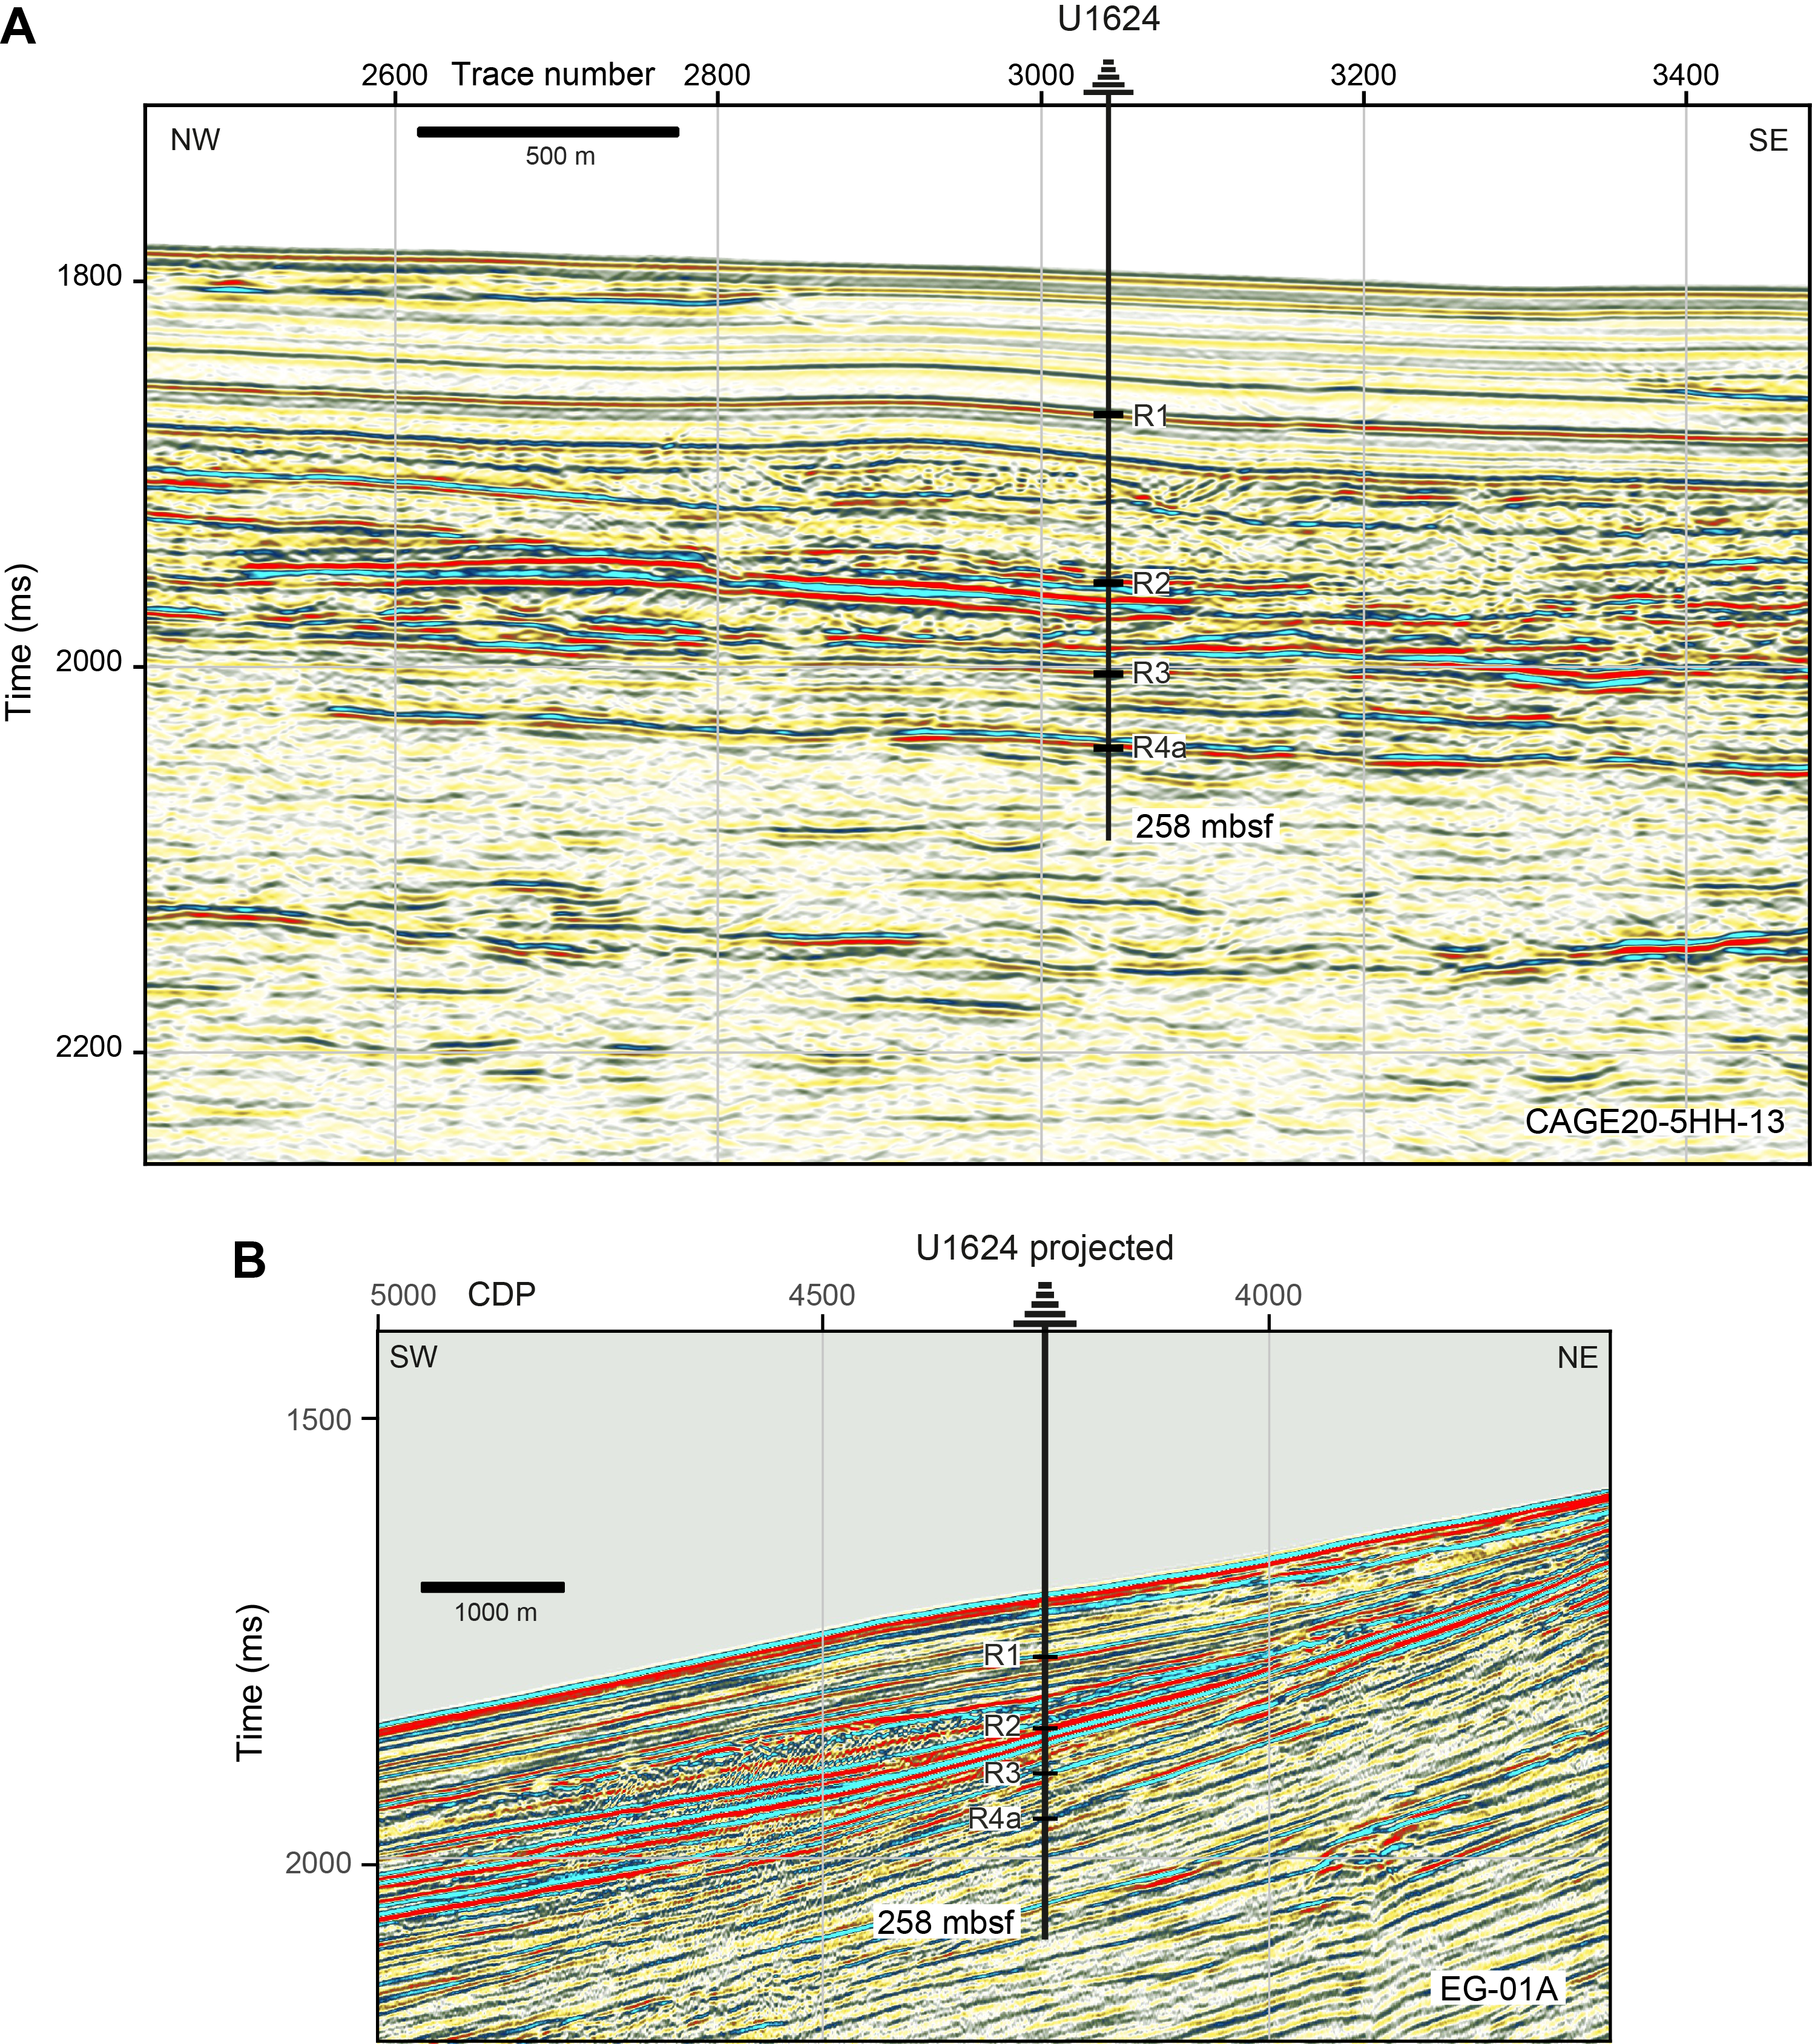
Figure F2. Seismic profile.
The Isfjorden drift drill Site U1624 was specifically designed to recover an expanded sedimentary sequence in a slope proximal area to reconstruct the dynamic of the paleo-SBSIS under past oceanographic and climatic forcing after the onset of shelf-edge glaciations. Because of its close location to the continental shelf break and former ice sheet terminus during glacial maximum, the Isfjorden drift contains most of the meltwater events associated with the paleo–ice sheet decay deriving from ocean and climate forcing. Sited between the Bellsund Trough Mouth Fan (TMF) to the south and the Isfjorden TMF to the north, the Isfjorden drift was partially shielded from the massive glacigenic input building TMFs, allowing also for a partial preservation of the interglacial contouritic sedimentation that can provide biostratigraphic and paleoceanographic constraints.
Piston cores collected in this area demonstrate that, aside from the proximal location, the Isfjorden drift is an excellent setting to recover continuous, relatively expanded and datable sedimentary sequences. The 2014 Eurofleets2-PREPARED project (Lucchi et al., 2014) recovered a long Calypso piston core containing a continuous, submillennial paleoclimatic record spanning the last 60 ky for which a robust age model was defined through paleomagnetic and biostratigraphic analyses and radiocarbon dating of the biogenic carbonate fraction collected from the interglacial contouritic sedimentation (Caricchi et al., 2019, 2020). The sedimentologic analyses indicated the presence of glacial debris flows recording shelf-edge glaciations and an extensive record of plumites, indicating ice sheet melting that appears well developed at the site because of its proximal location to the shelf edge (Caricchi et al., 2019).
Located close to the Bellsund drift, the Isfjorden drift site will give complementary information on the WSC characteristics and variability, allowing us to discriminate between climate-driven events related to local or regional effects. Three holes were drilled at Site U1624 to a maximum depth of 258 meters below seafloor (mbsf) at a 1320 m water depth.
The research objectives for this site include the following:
- Stratigraphic reconstruction of the paleo-SBSIS dynamics since the onset of Pleistocene shelf-edge glaciation;
- Study of ocean-cryosphere interactions and forcing mechanisms on the paleo–ice sheet dynamics; and
- The identification of tipping points between the late stages of glaciations and the onset of glacial terminations.
2. Operations
In total, we spent 3.23 days at Site U1624, penetrating to a maximum depth of 258 mbsf with a combined penetration of 517.3 m. The cored interval of 517.3 m resulted in a recovered length of 464.62 m. Site U1624 consists of three holes that stretch across a 25 m interval (5 m between Holes U1624A and U1624B; 20 m between Holes U1624B and U1624C). Hole U1624A is located on Seismic Line CAGE20-5HH-13, and all three holes are located just southeast of Seismic Line EG-01A. We took 89 cores in total: 25% with the advanced piston corer (APC) system (22 cores), 27% with the half-length APC (HLAPC) system (24 cores), and 48% with the extended core barrel (XCB) system (43 cores). To minimize magnetic overprinting on the cored sediment, nonmagnetic collars and core barrels were used for all APC and HLAPC coring. Holes U1624B and U1624C had intervals where the sediments significantly expanded due to the presence of gas, resulting in recoveries sometimes exceeding 100%, as well as intervals of poor recovery due to the presence of glacial clast-rich deposits (Table T1). To mitigate the impact of expansion and the potential for core disturbance and to release the pressure, holes were drilled into the liner by the drill crew on the rig floor and the technical staff on the core receiving platform. In addition, most XCB cores were advanced by 6–8 m to allow for gas expansion.
To more easily communicate shipboard results, core depth below seafloor, Method A (CSF-A), depths in this chapter are reported as mbsf unless otherwise noted.
2.1. Hole U1624A
The vessel made the 71.6 nmi transit to Site U1624 in 6.06 h with an average speed of 11.8 kt. Thrusters were down and secured at 0557 h, and the vessel was switched to dynamic positioning (DP) mode at 0600 h local time (UTC + 2 h) on 18 July 2024, starting operations at Site U1624. Hole U1624A is located at 77°35.2627′N, 10°05.6277′E, which lies along Seismic Line CAGE20-5HH-13 and is just southeast of Cross-line EG-01A. An APC/XCB bottom hole assembly (BHA) was assembled and deployed. A precision depth recorder (PDR) reading was taken on site arrival, and the bit was lowered to 1312.2 meters below sea level (mbsl). Hole U1624A was spudded at 1100 h. The core barrel was recovered; however, the core was pushed onto the rig floor by water pressure in the liner before the liner was moved to the catwalk. It was decided to terminate coring in Hole U1624A to achieve a better mudline core. The seafloor was estimated to be 1319.8 mbsl based on recovery in Core 1H.
One core was taken in Hole U1624A over a 1.3 m interval with 1.33 m of recovery (102%) (Table T1).
2.2. Hole U1624B
The vessel was offset 5 m east, and Hole U1624B was spudded at 1140 h on 18 July 2024. The seafloor was estimated to be 1319.8 mbsl based on recovery from Core 403-U1624B-1H. APC coring continued through Core 10H to 86.9 mbsf. There was a partial stroke on Core 10H, and it was decided to try one HLAPC core (11F). The core resulted in a full stroke, and an additional APC core was attempted but resulted in a partial stroke with only 1.9 m of recovery. The HLAPC system was deployed to advance the hole to 145.3 mbsf (Cores 13F–24F). Core 24F resulted in a partial stroke with 0.12 m of recovery, and it was decided to advance the hole using the XCB system from 145.3 to the target depth of 258.0 mbsf. The bit was pulled out of the hole, clearing the seafloor at 0022 h on 20 July. Operations were forced to stop due to a worldwide computer outage caused by the program CrowdStrike. During this time, the instrument hosts and databases were unavailable. The marine computer specialists worked to get the computers and databases back online as quickly as possible, and operations resumed within 2 h.
A total of 45 cores were taken over a 258.0 m interval, recovering 223.05 m of sediment (87%). The APC system was deployed for 11 cores over an 88.8 m interval with 81.23 m of recovery (82%), the HLAPC system was deployed for 13 cores over a 56.5 m interval with 60.53 m of recovery (107%), and the XCB system was deployed for 21 cores over a 112.7 m interval, recovering 81.29 m of sediment (87%) (Table T1). Temperature measurements using the advanced piston corer temperature (APCT-3) tool were taken on Cores 4H, 7H, 10H and 14F. Nonmagnetic core barrels were used on all APC and HLAPC cores. Total time on Hole U1624B was 36.75 h (1.5 days).
2.3. Hole U1624C
The vessel was offset 20 m at 225°, and Hole U1624C was spudded at 0241 h on 20 July 2024. The seafloor was estimated to be 1319.6 mbsl based on recovery from Core 1H. Coring continued with the APC system to 87.7 mbsf. Core 10H was a partial stroke, and coring switched to the HLAPC system to 137.6 mbsf (Cores 11F–21F). Core 21F was a partial stroke, and coring switched to the XCB system to advance the hole to the target depth of 258.0 mbsf. The drill string was pulled up, and the bit cleared the seafloor at 0751 h and the rig floor at 1115 h. The vessel switched from DP to cruise mode and was underway to Site U1623 at 1121 h, ending Site U1624.
A total of 36 cores were taken over a 258.0 m interval, recovering 240.24 m of sediment (93%). The APC system was deployed for 10 cores over an 87.7 m interval with 76.05 m of recovery (87%); the HLAPC system was deployed for 11 cores over a 49.9 m interval with 53.06 m of recovery (106%); and the XCB system was deployed for 22 cores over a 120.4 m interval, recovering 111.13 m of sediment (92%). Nonmagnetic core barrels were used on all APC and HLAPC cores.
3. Lithostratigraphy
The lithostratigraphic summary of Site U1624 is informed by observations of cores from Holes U1624B and U1624C. Hole U1624A consists of one core (approximately 1.3 m) and will not be discussed in this summary. The total recovered Site U1624 sequence consists of 89 cores (517.3 m of cored sediment and 464.62 m of recovered sediment). The sediments are siliciclastic and primarily composed of soft to firm dark gray (2.5Y 4/1, 5Y 4/1, and N 4/) (Figure F3A) silty clay, with coarser intervals containing reddish gray (10R 5/1, 2.5YR 5/1, and 5YR 5/2) to dark reddish gray (10R 3/1, 10R 4/1, 2.5YR 3/1, 2.5YR 4/1, and 5YR 4/2) sandy mud (Figure F3B) and diamicton intervals (Figure F3C). The lithologies contain varying amounts of detrital clasts with a range of sizes. Clast abundance ranges from dispersed (<1% of the split core surface) to common (1%–5%) to abundant (5%–30%). When clast abundance is between 1% and 30%, contains clasts > 2 cm in size, and is poorly sorted, the lithology is designated as a diamicton. Overall, there is a decrease in silty clay and an increase in diamicton intervals with depth. Diamicton (Figure F3C) dominates the Site U1624 record deeper than ~202 mbsf. Examples of the most common sedimentologic features are shown in Figure F4.
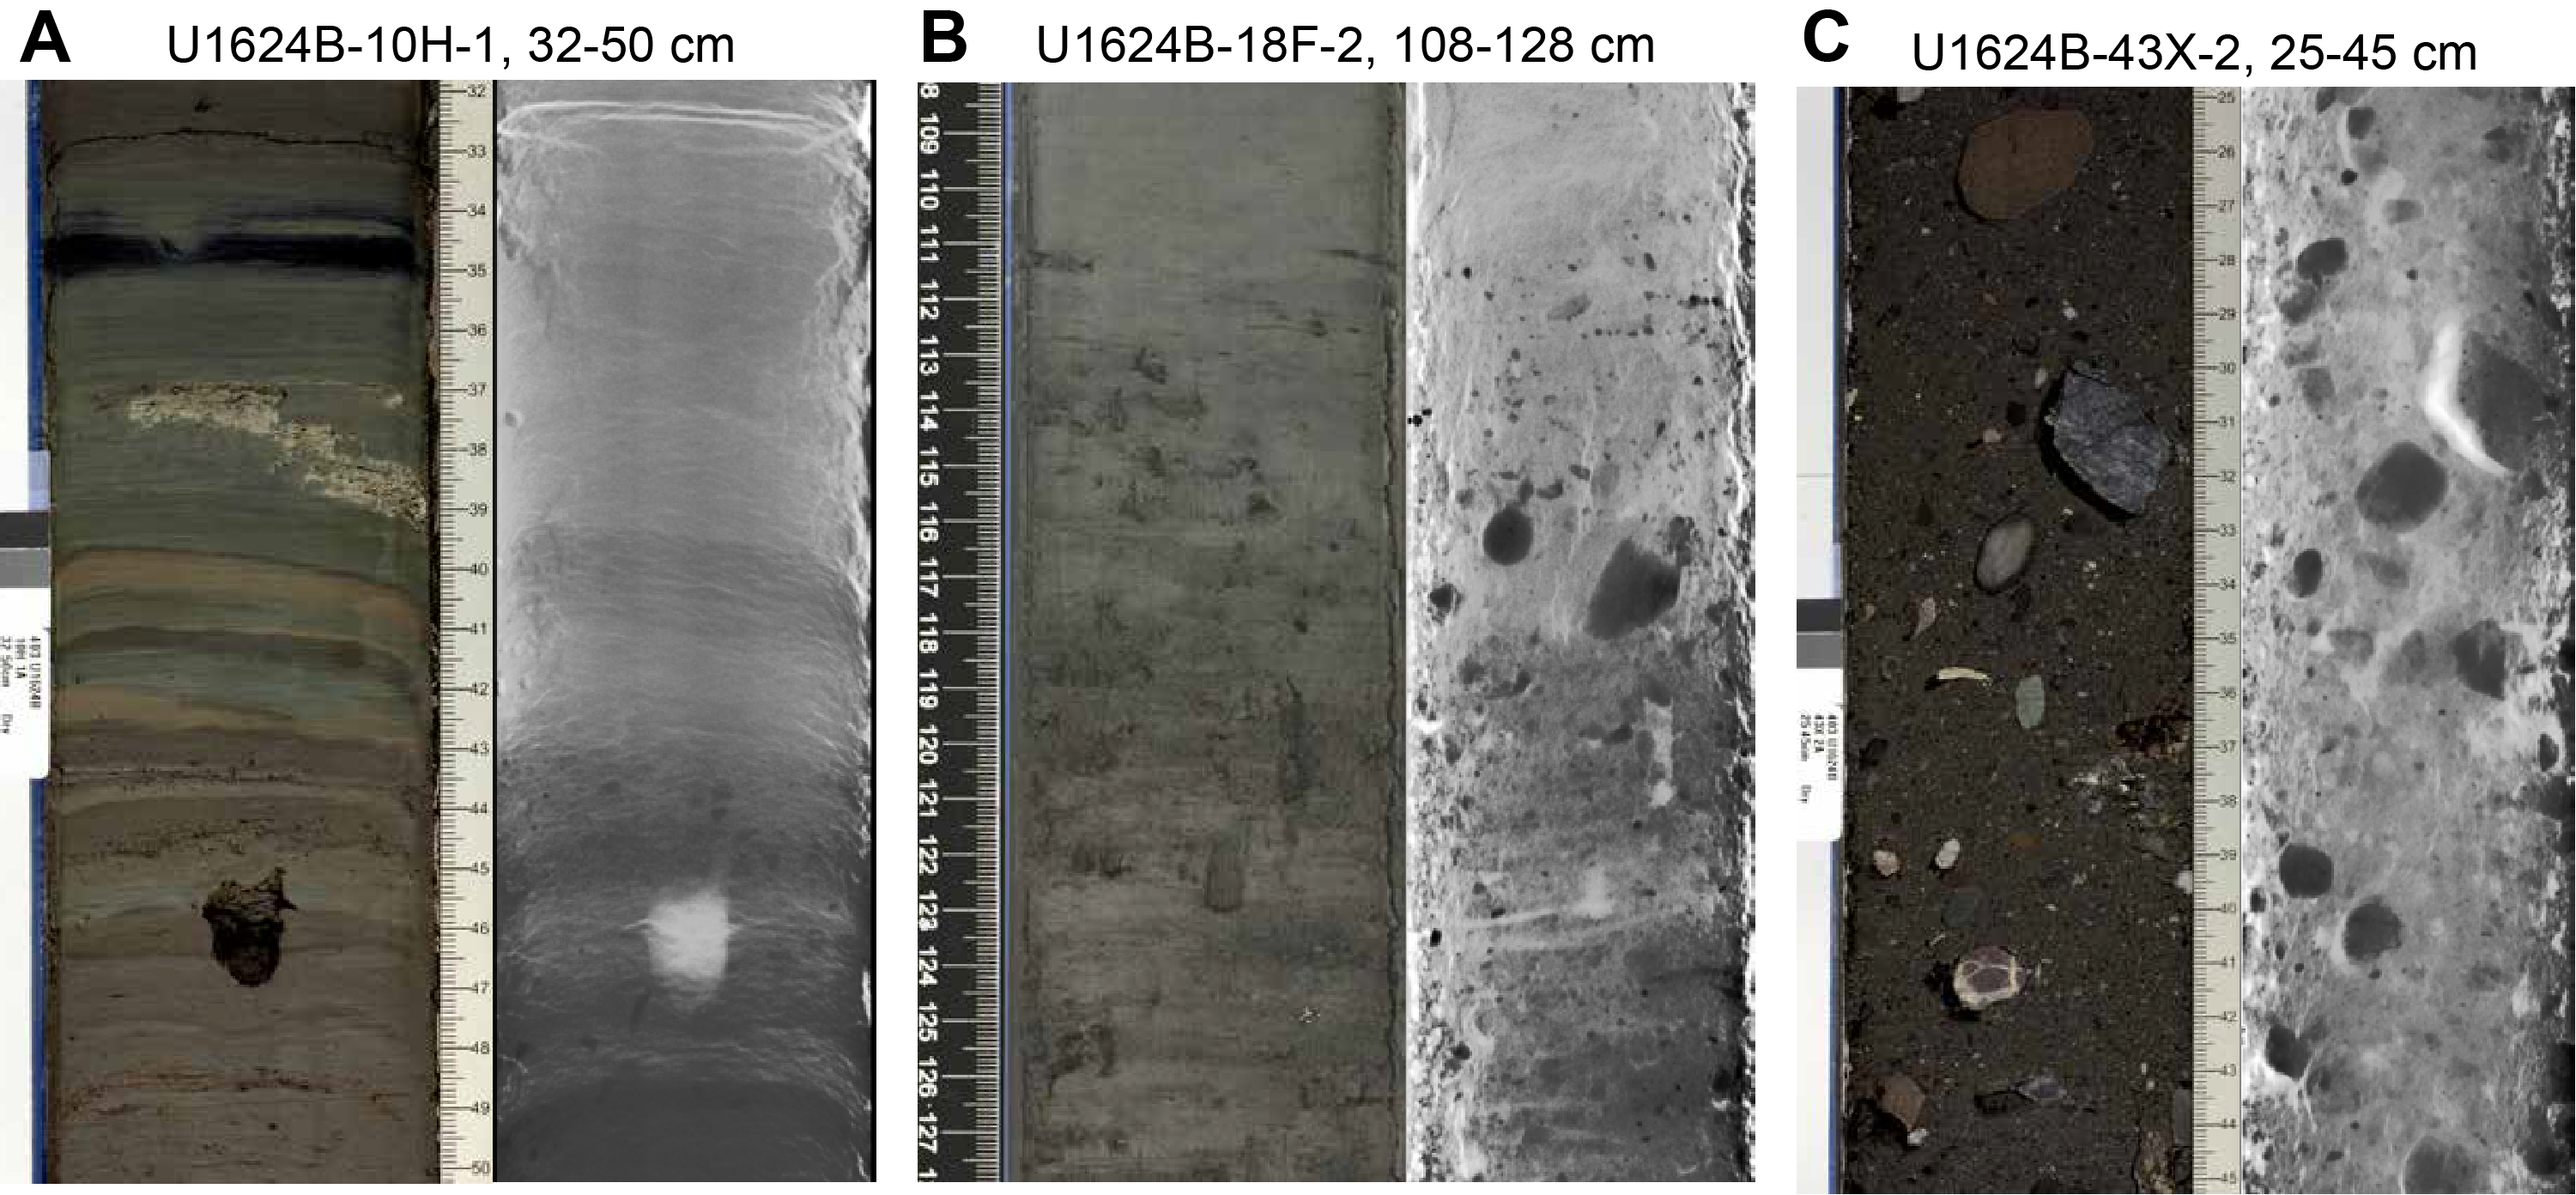
Figure F3. Lithologic boundaries.
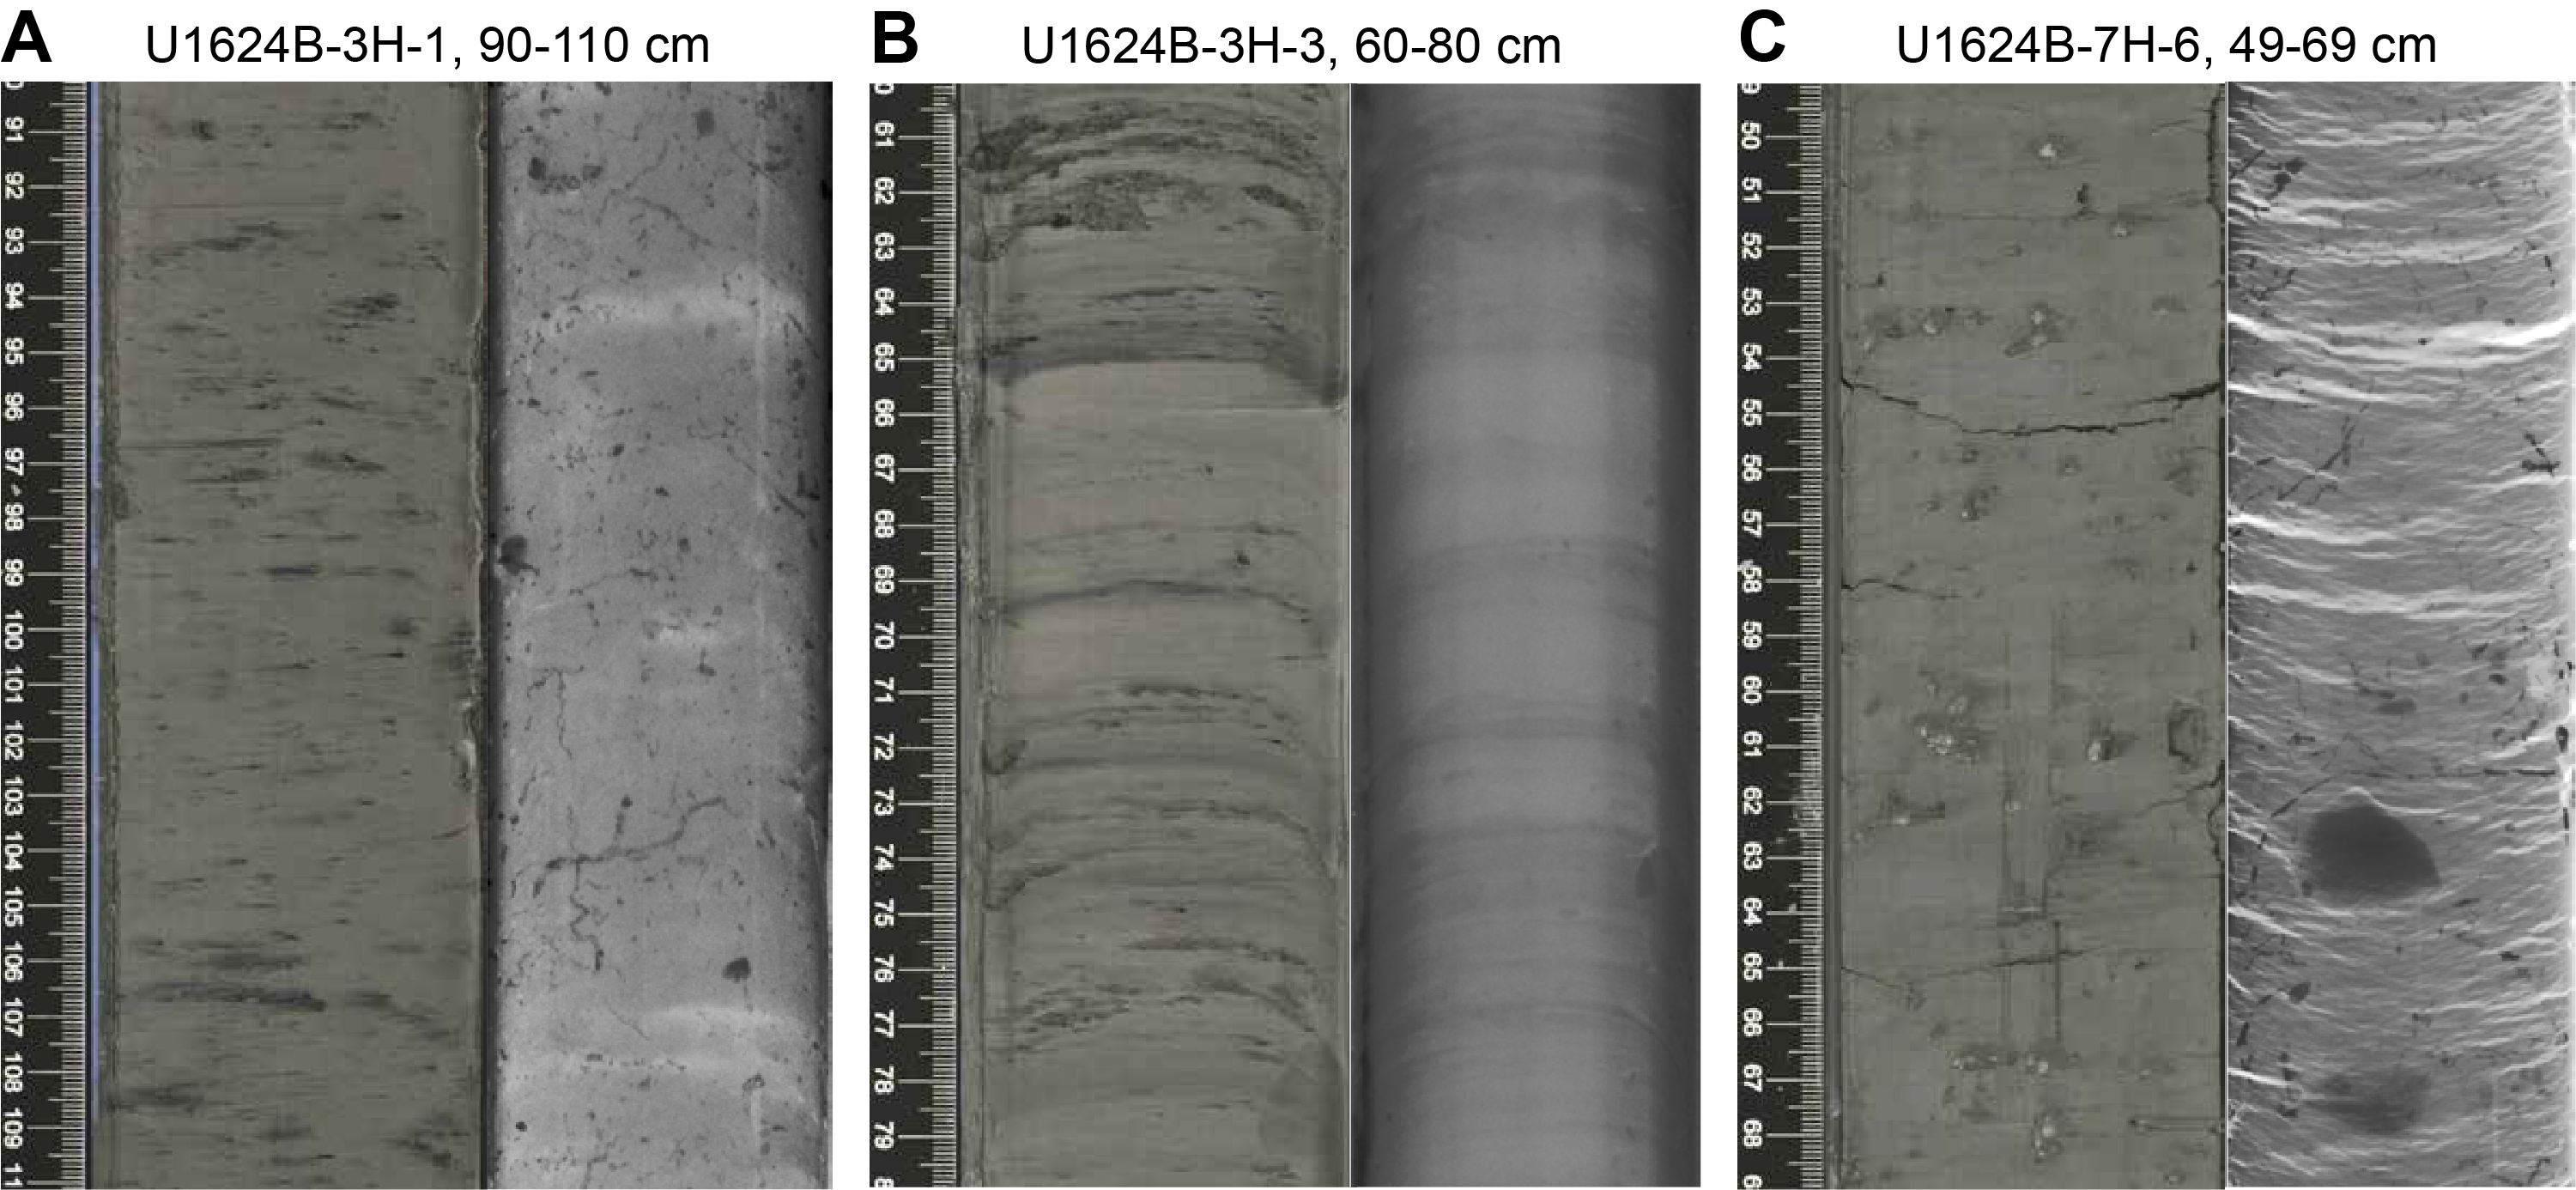
Figure F4. Common structural features.
Sedimentary structures were not always visible on the split core surface (i.e., described as structureless), but primary (e.g., lamination) structures could mostly be observed in the X-radiographs available for both holes.
Unlike other Expedition 403 sites, sediments at Site U1624 did not exhibit prominent diagenetic features other than small iron sulfide minerals observed on the split core surface toward the bottom of each hole.
The lithologies and sedimentary features of Holes U1624B and U1624C are summarized in Figures F5 and F6, respectively. Hole-specific plots of magnetic susceptibility (MS), natural gamma radiation (NGR), gamma ray attenuation (GRA) density, and sediment color reflectance (CIELAB L*, a*, and b*) data show downhole changes co-varying with lithologic changes. CIELAB L* and a* change from displaying high-amplitude variations between 0 and 85.51 mbsf to displaying lower amplitude variations to the base of the hole. CIELAB b* shows a decreasing trend downhole, also with less amplitude changes. The MS data throughout Holes U1624B and U1624C mostly range 0–200 IU. The downhole MS curve does not show any significant changes downhole except for higher values around ~70–80 mbsf in both holes. In intervals with good core recovery, NGR, and density data appear to co-vary, with higher amplitude variations between ~85.51 and 160 mbsf.
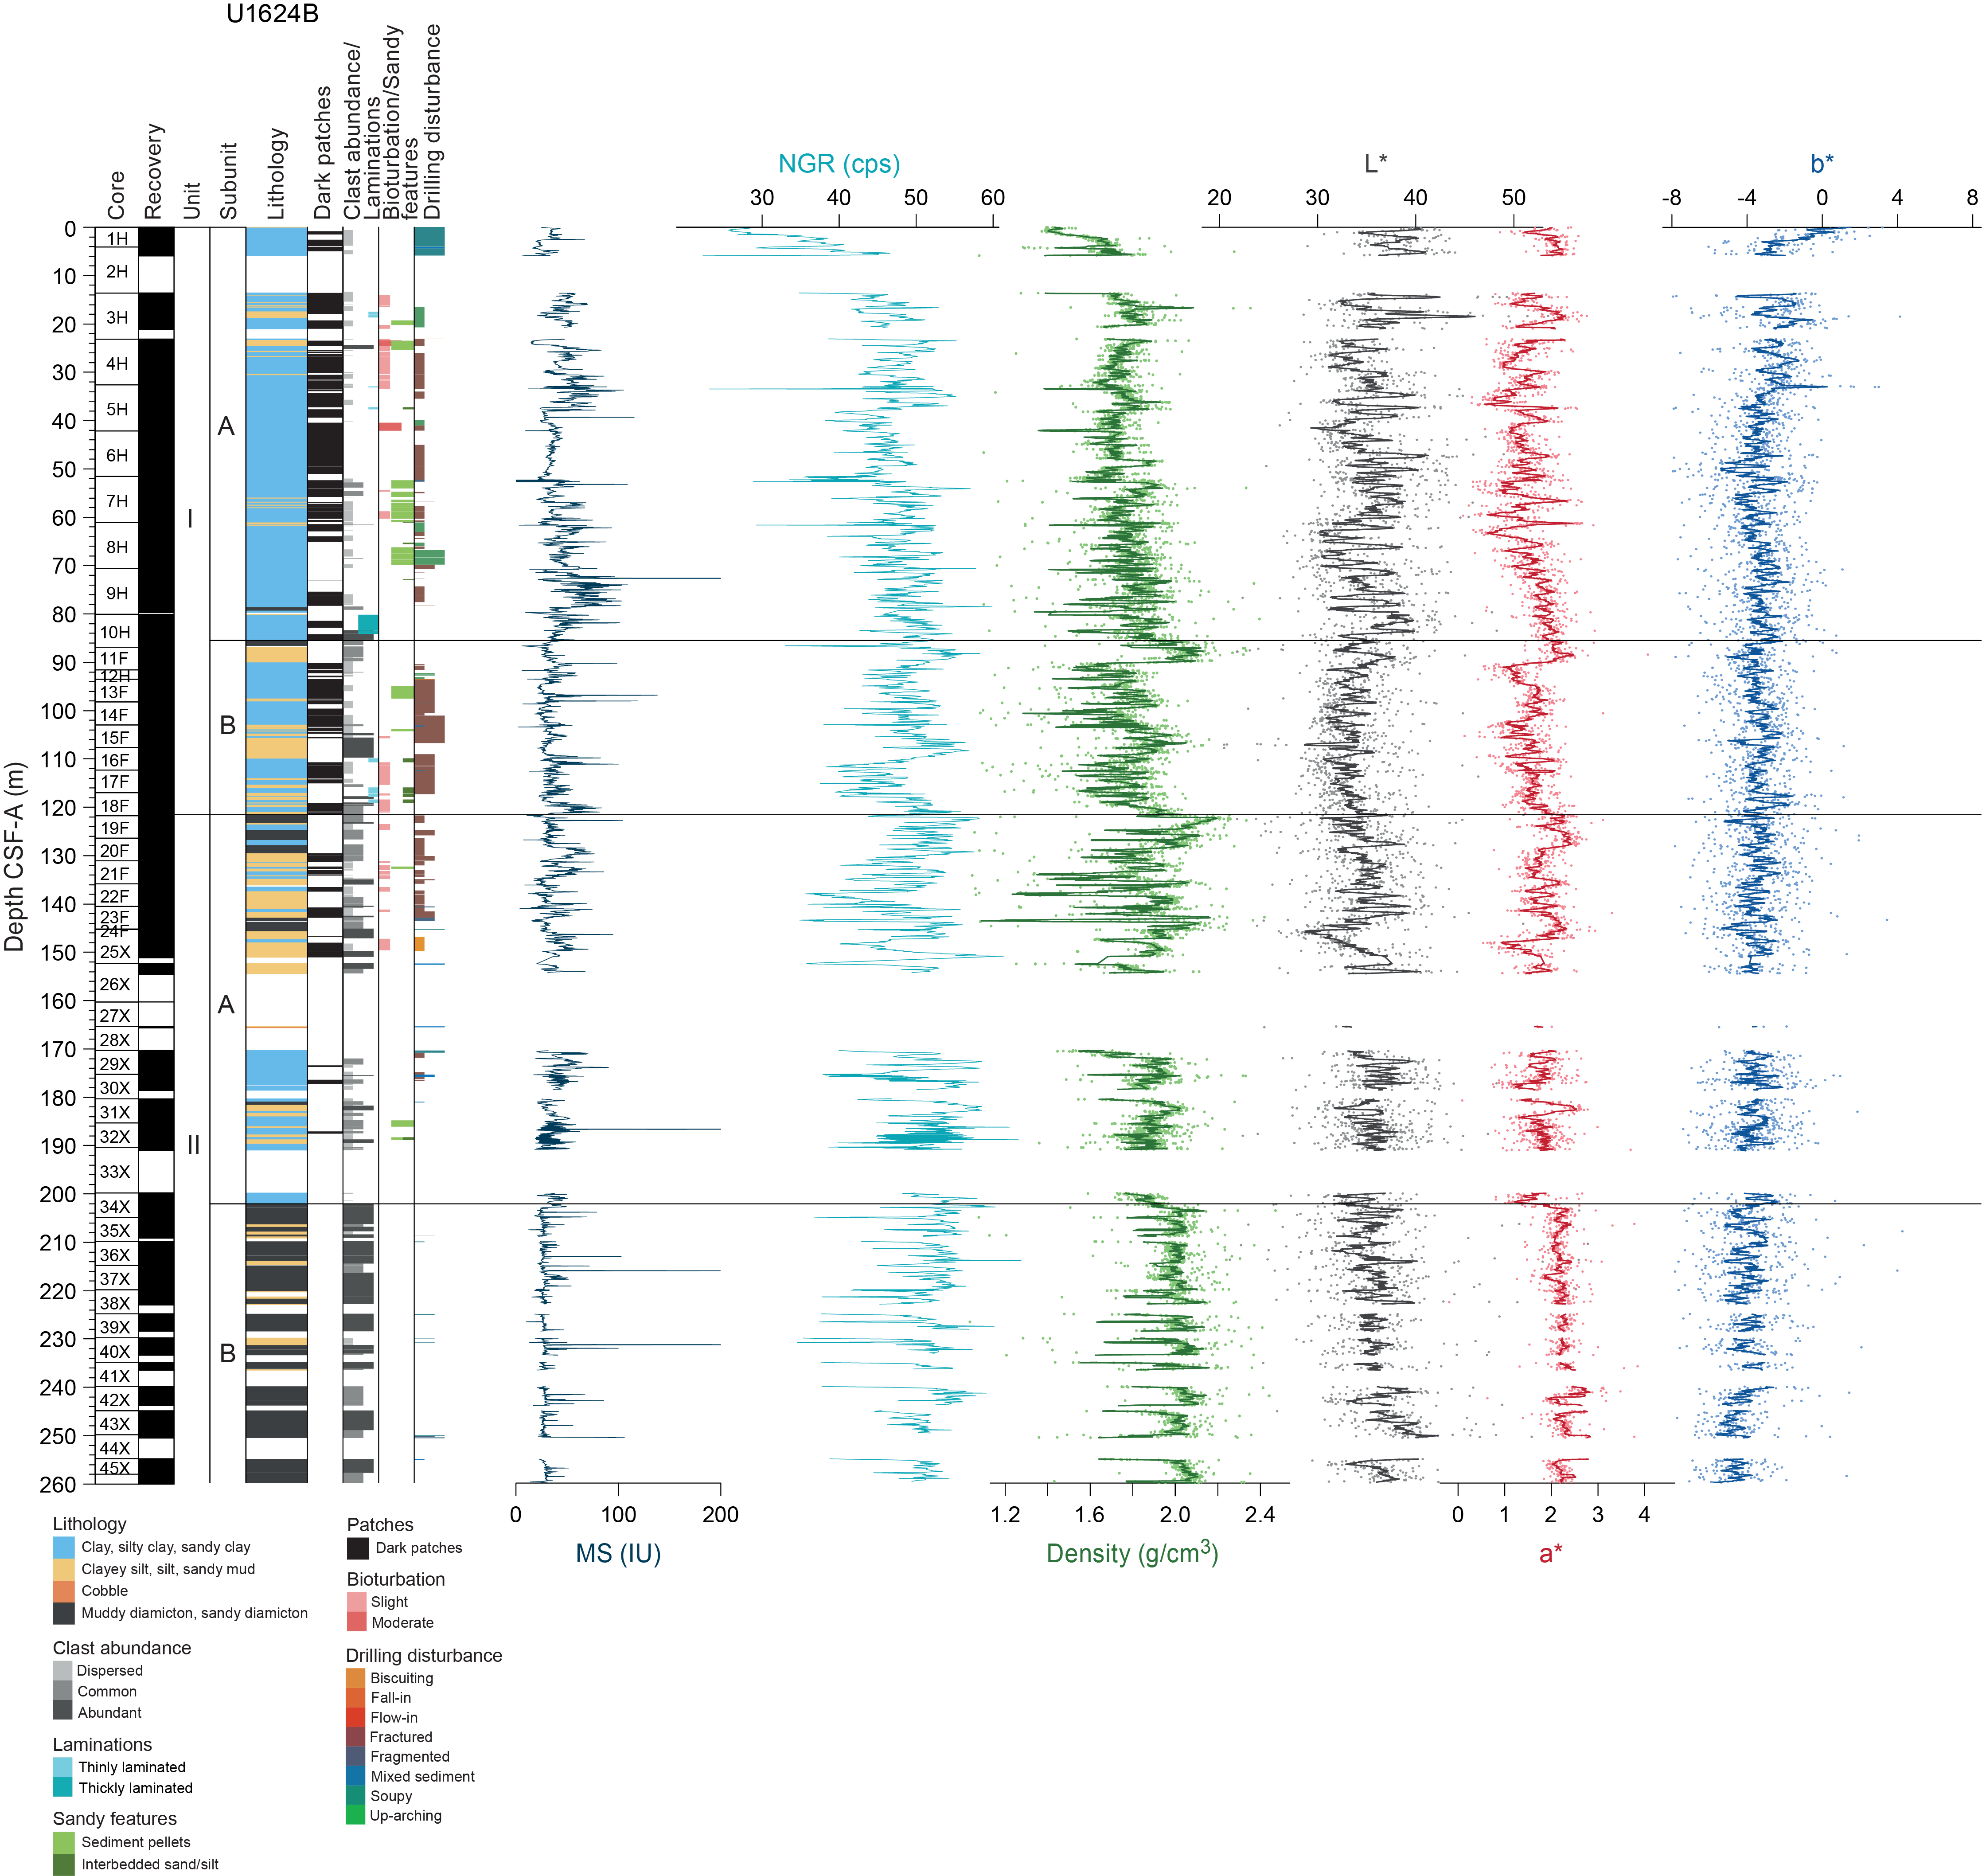
Figure F5. Physical properties, Hole U1624B.
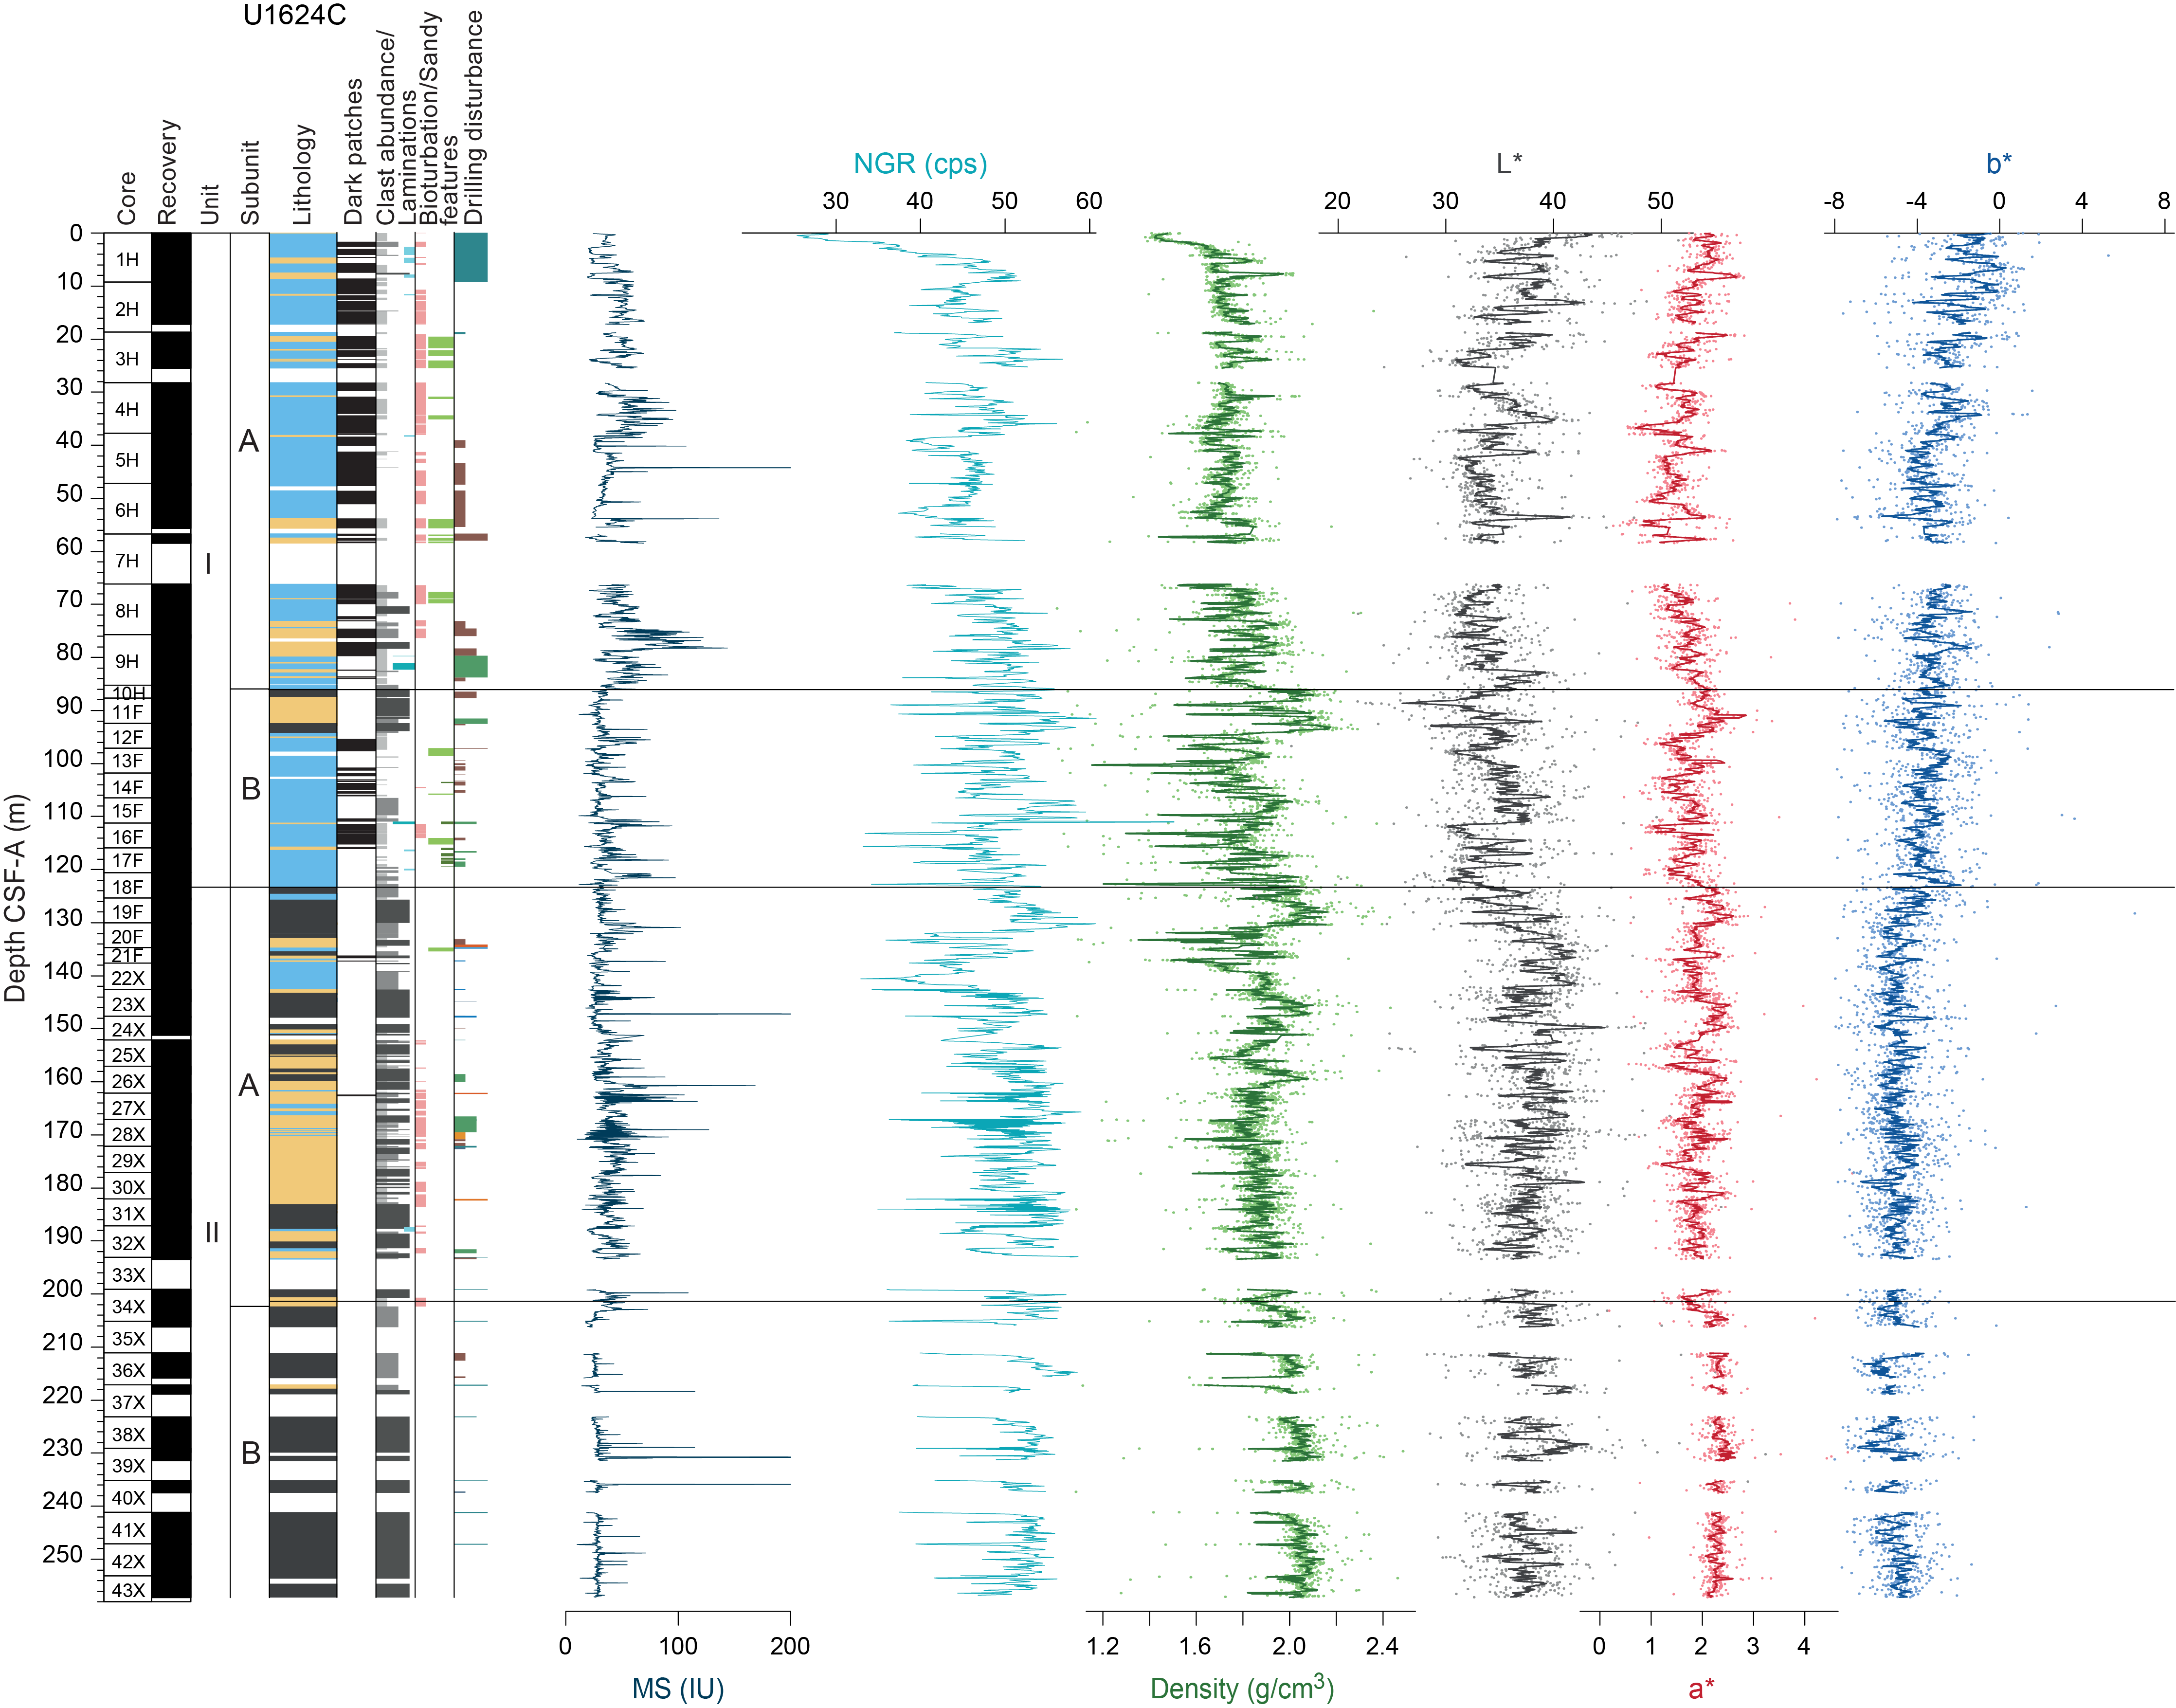
Figure F6. Physical properties, Hole U1624C.
Based on the primary (i.e., detrital siliciclastic) lithologic characteristics, two lithostratigraphic units and additional subunits are defined for Site U1624 (Table T2). Lithologic characteristics such as grain-size changes (e.g., clay versus silty clay), presence of bioturbation, clast abundance, and appearance of sand patches from both Holes U1624B and U1624C were used to define the stratigraphic units and subunits at Site U1624. The stratigraphic boundaries were first placed in Hole U1624B and were subsequently identified in Hole U1624C based on lithologic consistency and stratigraphic correlation on the CSF-A scale (see Stratigraphic correlation) (Figure F7).
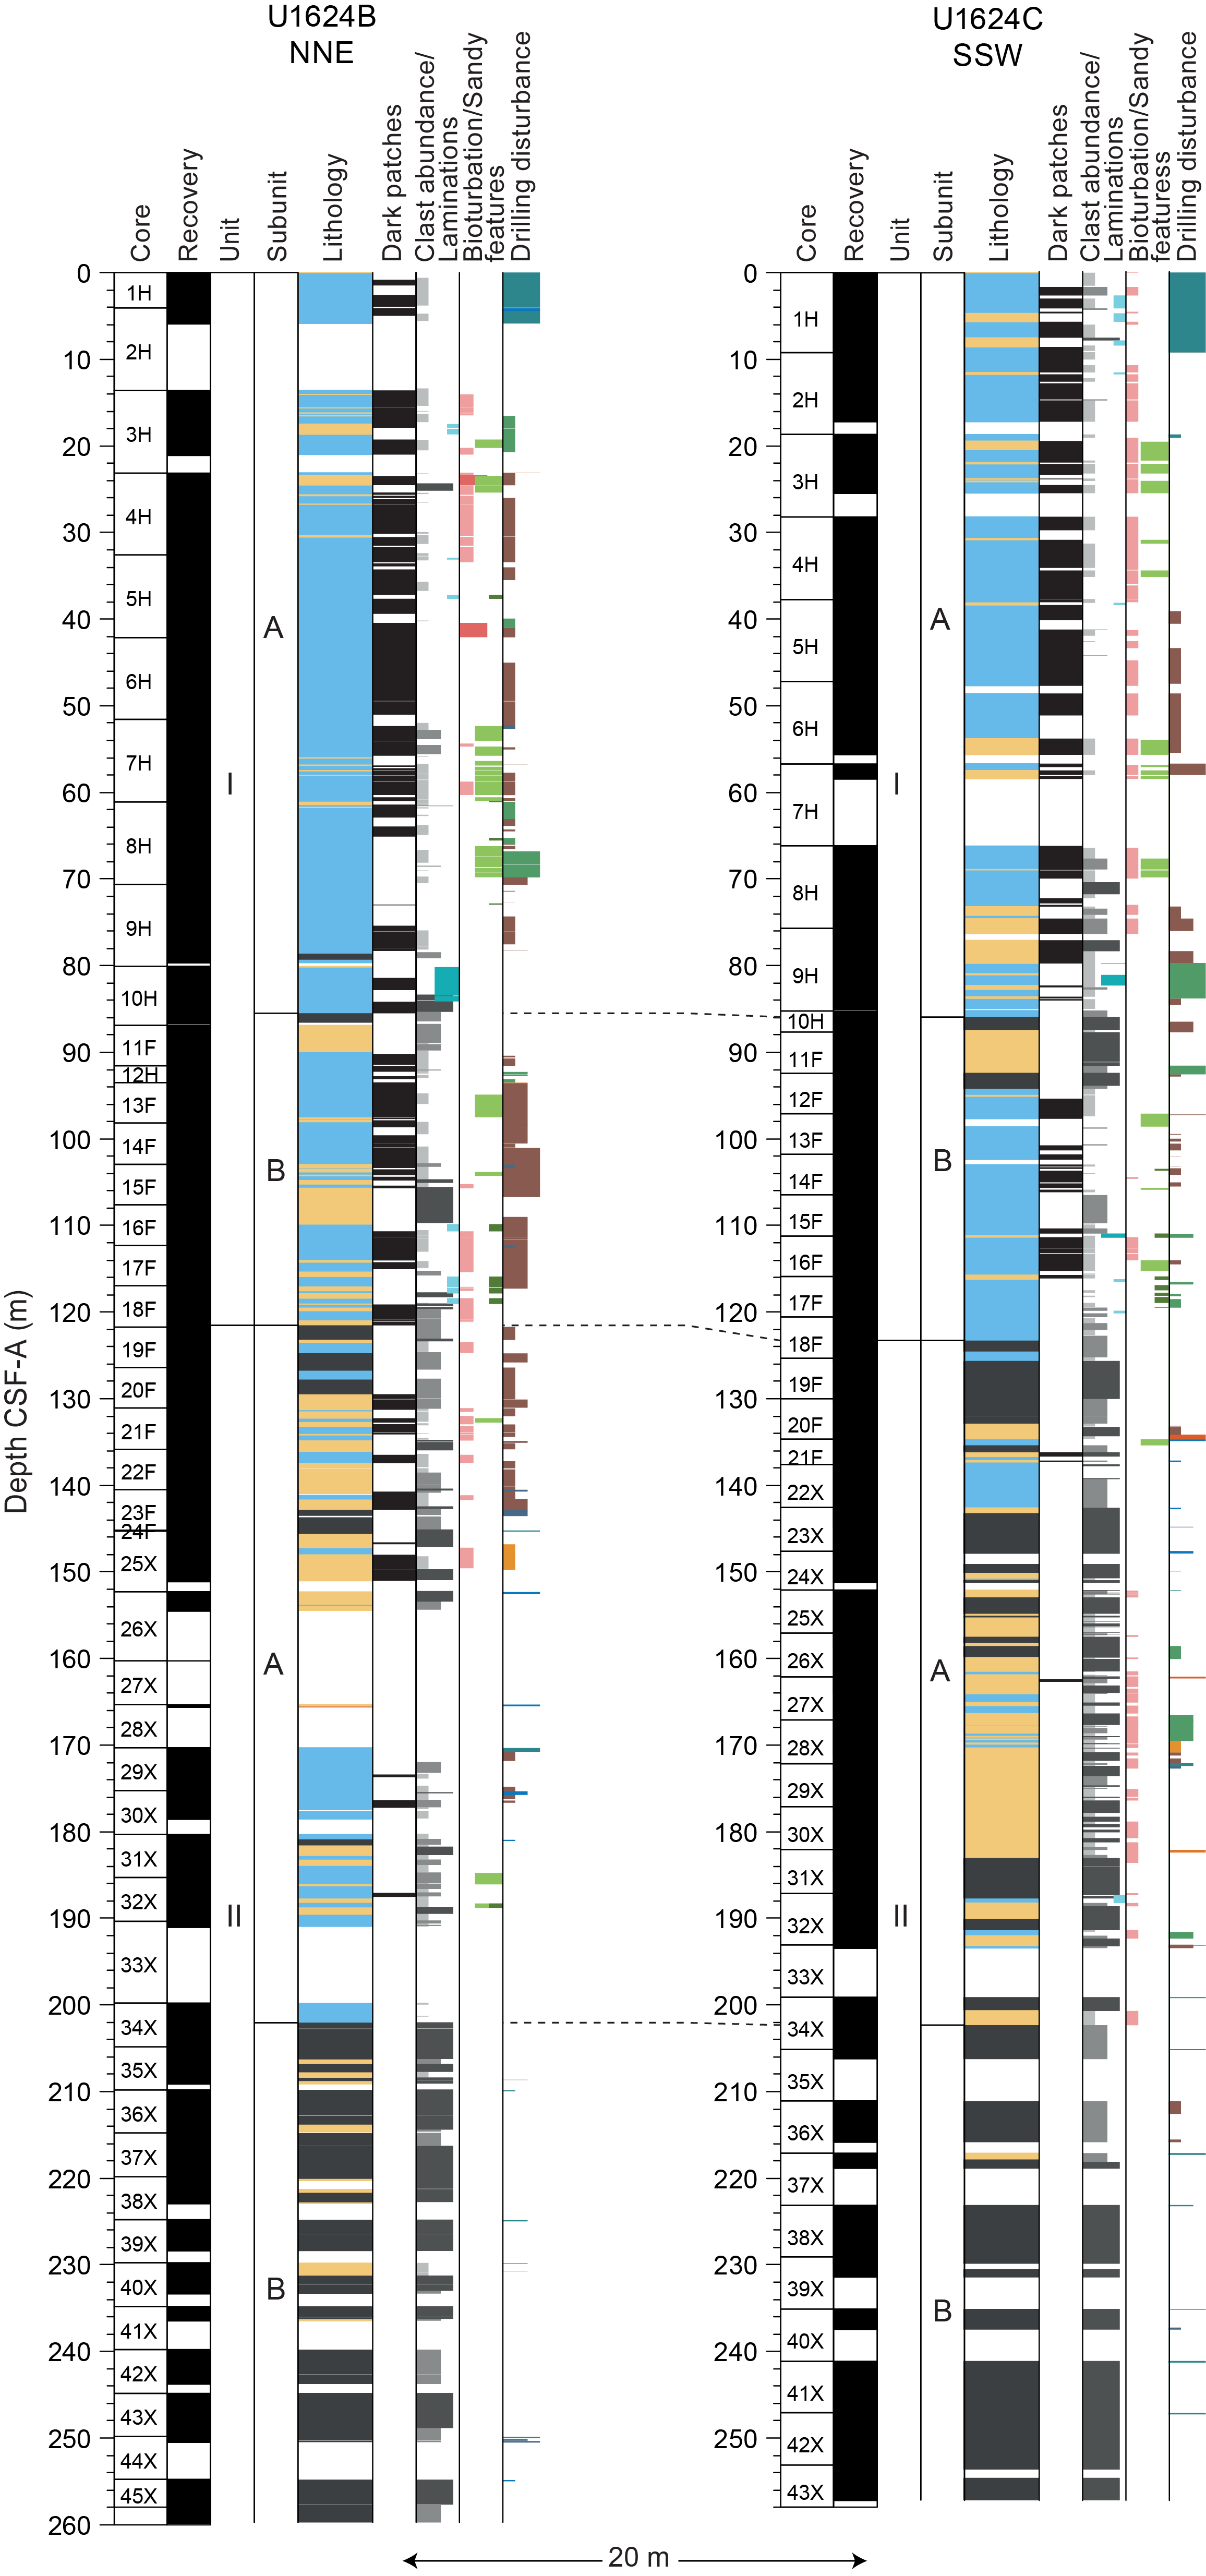
Figure F7. Lithologic correlation.
The degree of core recovery, drilling disturbance, and gas expansion (Figure F7) is similar between holes; however, these vary with depth and type of coring method employed. APC cores from all holes exhibit slight to moderate coring disturbances. XCB cores are slightly to moderately disturbed with short (a few tens of centimeters long) finer grained intervals being more affected by biscuiting disturbance than intervals with coarser material (diamicton; see Paleomagnetism).
3.1. Lithostratigraphic unit descriptions
3.1.1. Unit I
- Intervals: 403-U1624B-1H-1 through 18F-CC; 403-U1624C-1H-1 to bottom of 18F-2
- Depths: Hole U1624B = 0–121.54 mbsf; Hole U1624C = 0–123.30 mbsf
- Age: Holocene to Late Pleistocene
Lithostratigraphic Unit I is composed dominantly of clay and silty clay with occasional coarser intervals of clayey silt and sandy mud (Figure F7). Laminated intervals are occasionally present in the uppermost ~120 m of Site U1624 (e.g., Figure F3A). Dark patches on the split core surface (Figure F4A) are most prevalent over this same depth range, as are thin interbedded layers of sand and/or silt (Figure F4B) within the silty clay, and sand patches (Figure F4C).
Unit I exhibits variable mineralogy, with some intervals in the uppermost 80 m of Hole U1624B containing a nonbiogenic carbonate fraction (Figures F8, F9). Intervals of slight to moderate bioturbation are present (Figure F7). Physical properties of density, NGR, and CIELAB a* show possible cyclic fluctuations, whereas MS shows several prominent peaks. In each hole, Unit I is characterized by the transition from fine-grained sediments to coarse sandy mud to the occurrence of diamicton intervals toward the bottom of the unit (Figure F7). Unit I is divided into two subunits (IA and IB) based on differences in the clay/silty clay abundance, occurrence of sand patches, and presence of diamicton.
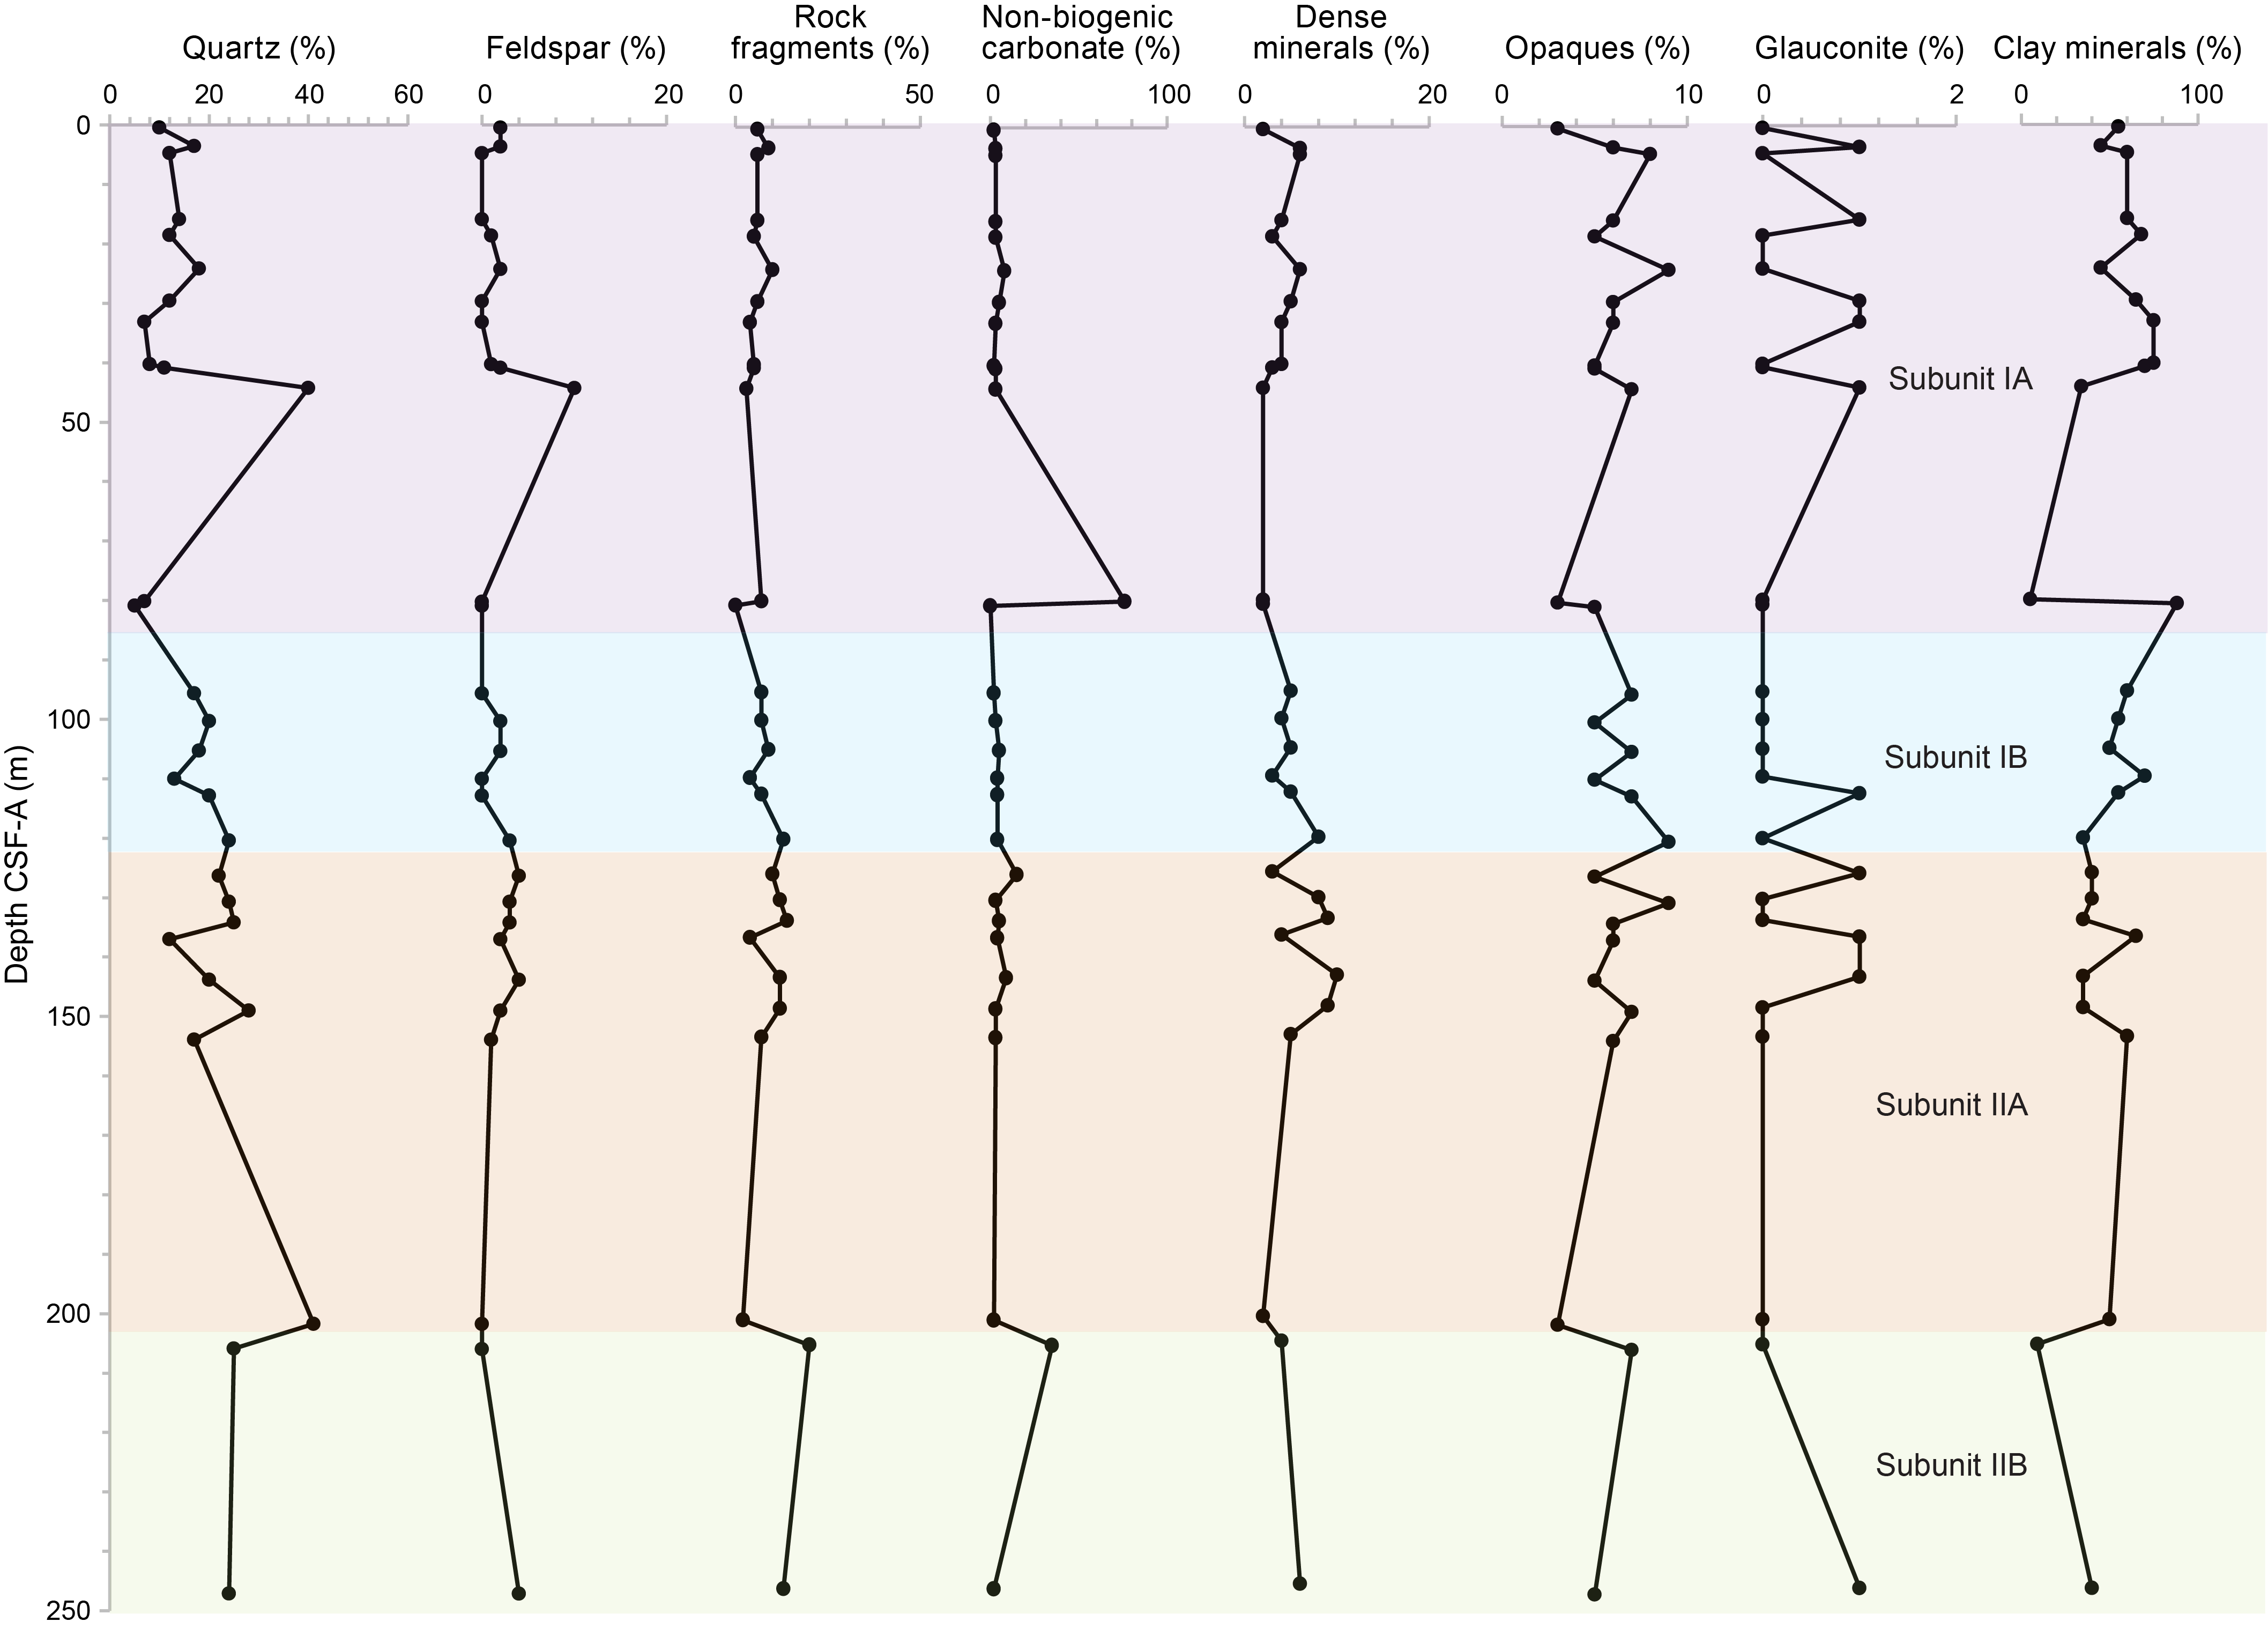
Figure F8. Downhole mineralogy, Hole U1624B.
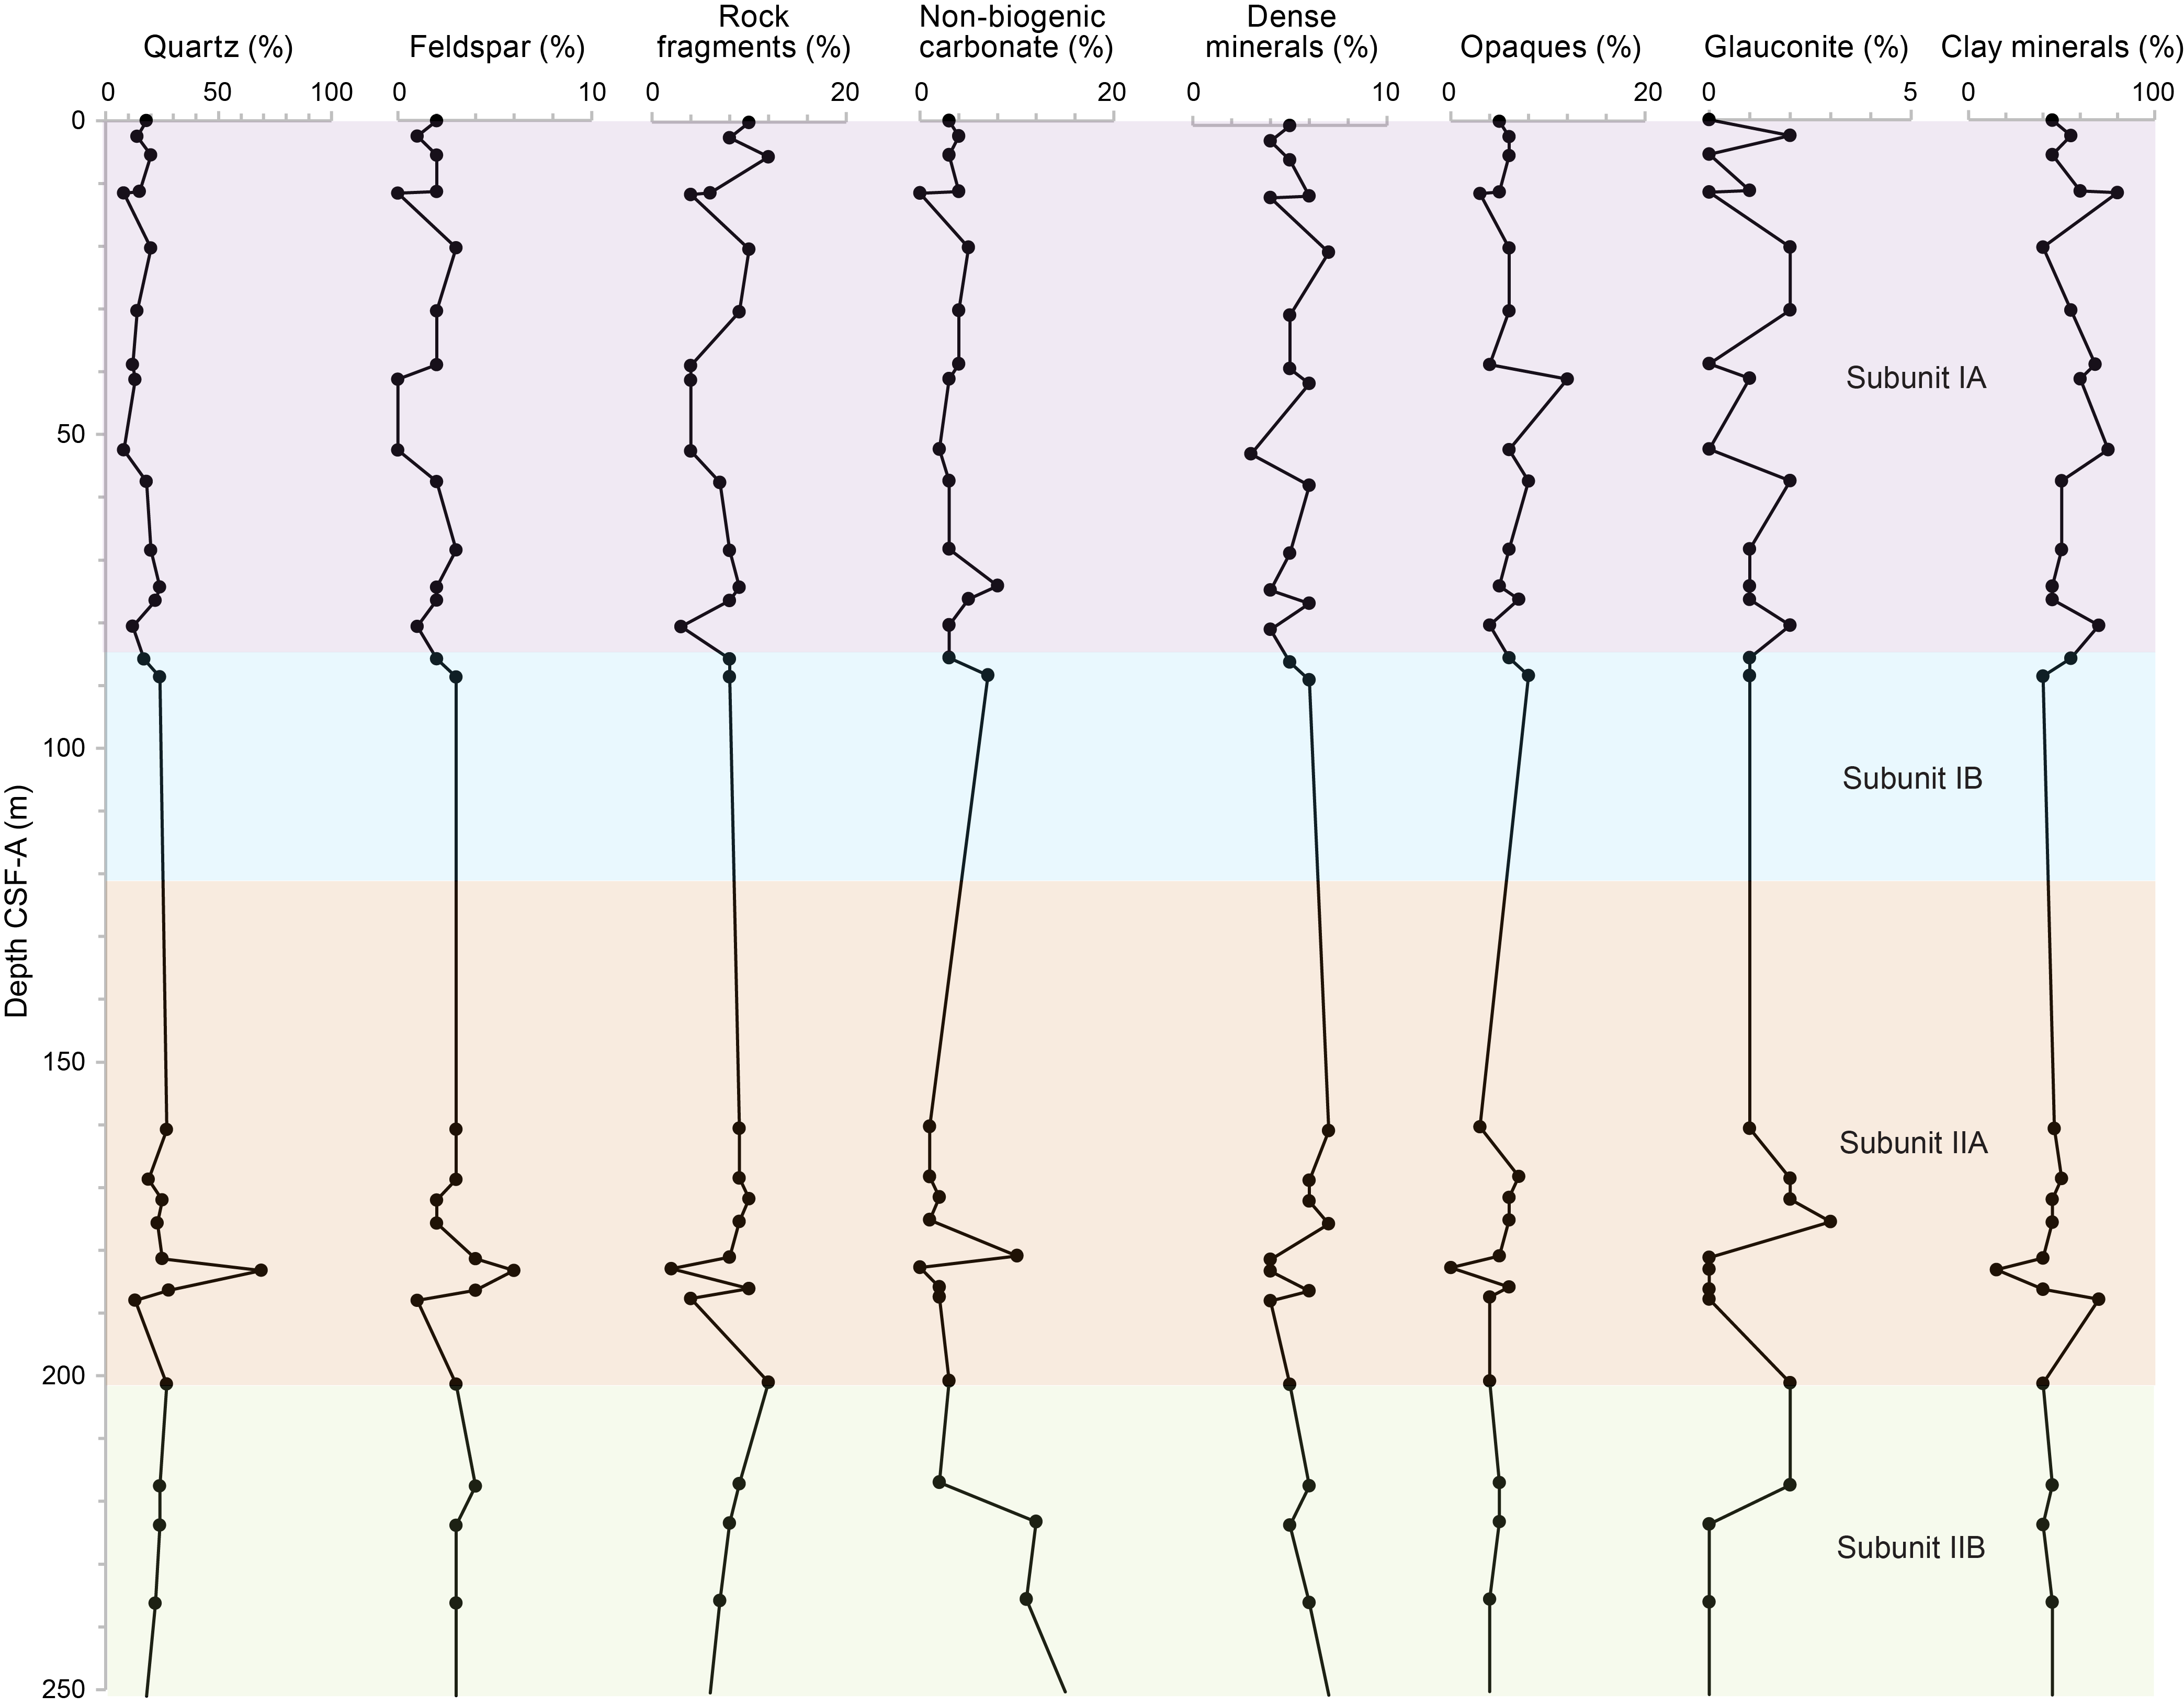
Figure F9. Downhole mineralogy, Hole U1624C.
3.1.1.1. Subunit IA
- Intervals: 403-U1624B-1H-1 to bottom of 10H-4; 403-U1624C-1H to 10H-1, 75 cm
- Depths: Hole U1624B = 0–85.51 mbsf; Hole U1624C = 0–85.95 mbsf
Lithostratigraphic Subunit IA is the shallowest subunit and is composed of soft sediments consisting of clay, silty clay, and occasionally coarser intervals of clayey silt/sandy mud. Slight bioturbation is present in the upper half of Subunit IA in Hole U1624B and throughout Subunit IA in Hole U1624C. Dispersed clasts are present throughout most of Subunit IA in both holes, and gradually transition to common clasts in the deeper part of Subunit IA of Hole U1624C. Thin laminations are present in the upper part of the subunit, transitioning to thick laminations toward the bottom. Sand patches are present throughout (Figures F5, F6).
3.1.1.2. Subunit IB
- Intervals: bottom of 403-U1624B-10H-4 to bottom of 18F-4; 403-U1624C-10H-1, 75 cm, to bottom of 18F-2
- Depths: Hole U1624B = 85.51–121.54 mbsf; Hole U1624C = 85.95–123.30 mbsf
The upper boundary of Lithostratigraphic Subunit IB is marked by the first occurrence of a diamicton (Figure F7). Subunit IB consists primarily of firm silty clay and coarser intervals of sandy mud, with rare diamicton. Dispersed to common clasts are present throughout, and sediments are slightly bioturbated. Thin laminations and sand patches occur toward the bottom of the subunit. In both holes, the upper part of Subunit IB is characterized by a distinct interval of higher sediment density that corresponds to a clay/silty clay interval (Figures F5, F6).
3.1.2. Unit II
- Intervals: bottom of 403-U1624B-18F-4 through 45X (bottom of the hole); bottom of 403-U1624C-18F-2 through 43X (bottom of the hole)
- Depths: Hole U1624B = 121.54–259.79 mbsf; Hole U1624C = 123.30–257.18 mbsf
- Age: Middle Pleistocene
Lithostratigraphic Unit II is characterized by a consistent increase of diamicton intervals toward the bottom of the unit with a minor occurrence of silty clays (Figure F7). The upper part of Unit II is characterized by the presence of dark patches, sand patches, and silt layers interbedded with silty clay that are all absent in the lower part. Laminations are absent in Unit II with the exception of one short interval in Hole U1624C. Based on visual core observations and X-radiographs, the presence of clasts throughout Unit II is higher than in Unit I. Similar to Unit I, the common minerals observed in smear slides are clay minerals and quartz, with additional rock fragments, micas, and dense minerals (Figures F8, F9). Opaque minerals are prevalent throughout the section, and micrometer- to centimeter-scale iron sulfide nodules and clusters are observed on the split surface of the core and in smear slides observed by microscopic analysis. The biogenic components are absent in much of Unit II, as inferred from smear slide analyses. MS data show little change downhole, with only a few large peaks possibly associated with iron sulfide minerals. An interval of lower NGR and lower density occurs near the top of Unit II. CIELAB a*, b*, and L* show minor variability only. Unit II is divided into two subunits (IIA and IIB) on the basis of diamicton occurrences, presence of dark patches, sand patches, laminations, and bioturbation.
3.1.2.1. Subunit IIA
- Intervals: 403-U1624B-18F-CC to 34X-2, 76 cm; 403-U1624C-18F-3, 0 cm, to 34X-3, 24 cm
- Depths: Hole U1624B = 121.54–202.05 mbsf; Hole U1624C = 123.30–202.33 mbsf
Lithostratigraphic Subunit IIA is composed of firm coarse-grained sediments with recurring diamicton, and silty clay/sandy mud intervals (Figures F7, F10). There is a generally greater presence of diamicton and silty clay/sandy mud intervals in Hole U1624C. The upper part of Subunit IIA is characterized by abundant dark patches and silt intervals, and moderate to abundant clasts are present throughout. Slight bioturbation is present in the upper part of Subunit IIA in Hole U1624B and in the lower part of the subunit in Hole U1624C. There is a reduction in sand patches in Subunit IIA. Dark patches and silty intervals occur in the upper part of the subunit, and moderate to abundant clasts are present throughout (Figures F5, F6).
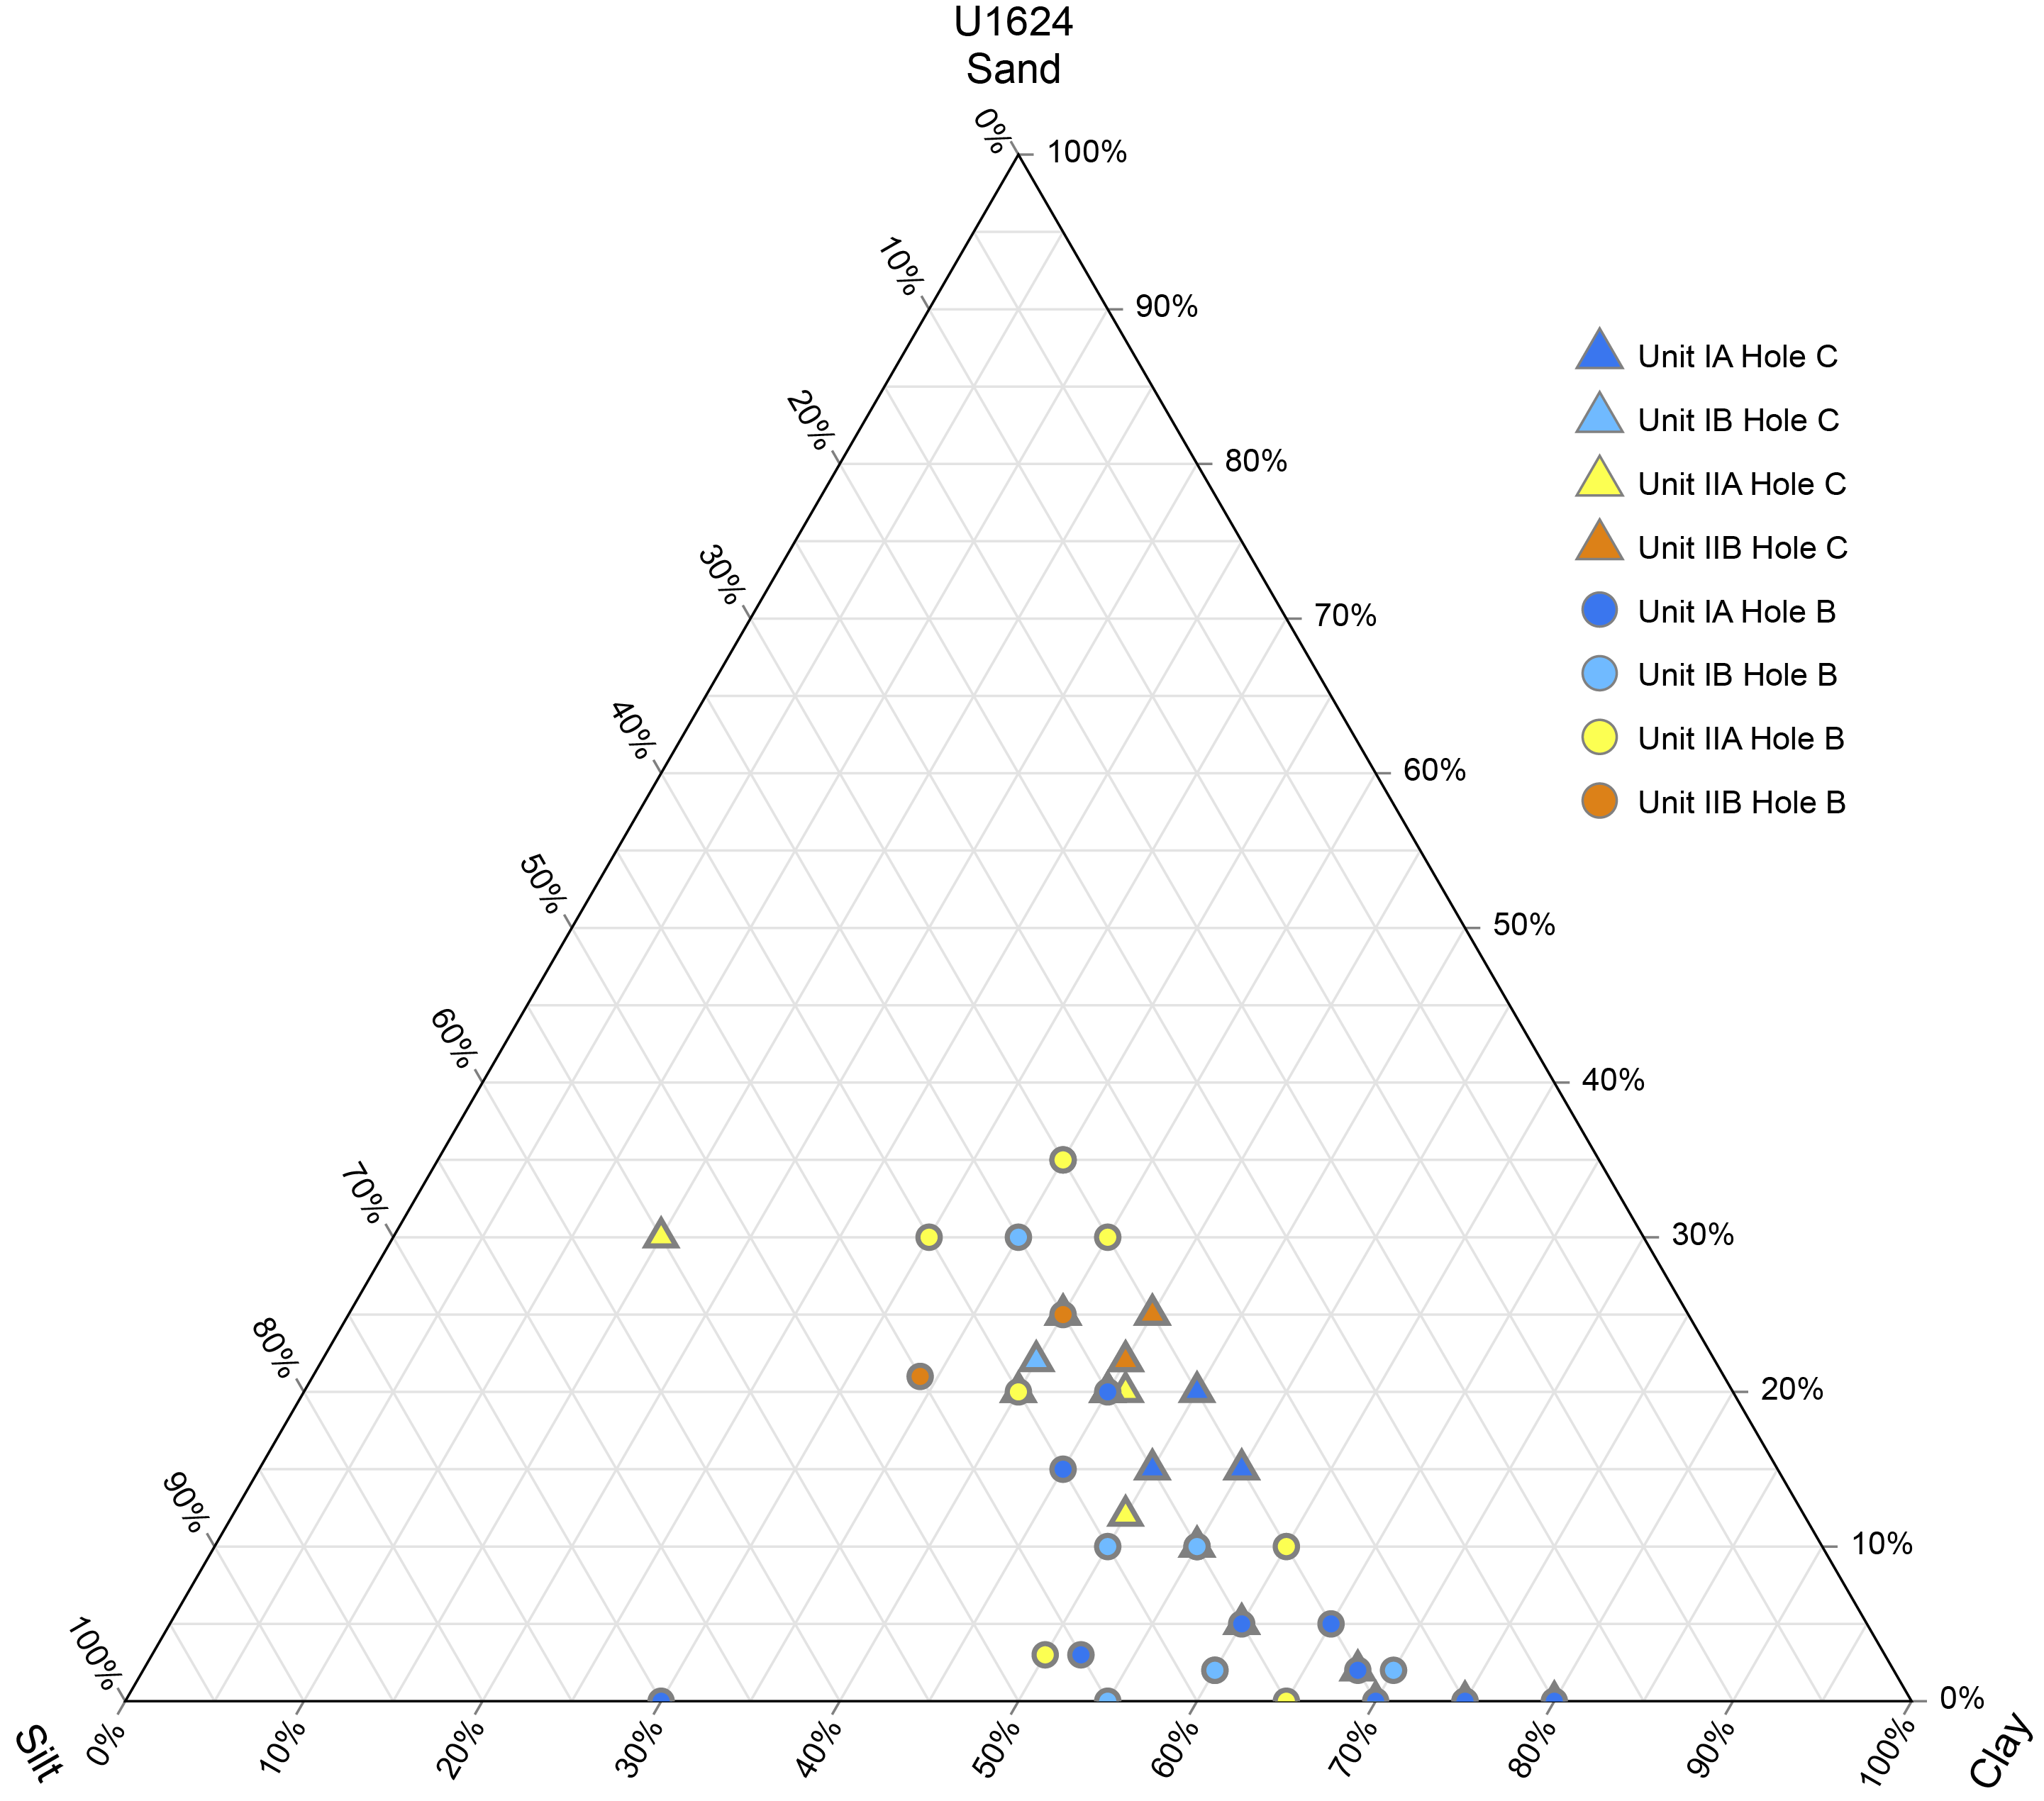
Figure F10. Sand, silt, and clay percentages.
3.1.2.2. Subunit IIB
- Intervals: 403-U1624B-34X-2, 76 cm, through 45X (bottom of the hole); 403-U1624C-34X-3, 24 cm, through 43X (bottom of the hole)
- Depths: Hole U1624B = 202.05–259.79 mbsf; Hole U1624C = 202.33–257.18 mbsf
The transition from Subunit IIA to Subunit IIB is defined by the increased occurrence of diamicton intervals in Subunit IIB. The lithology consists of firm coarse sediment with recurrent appearance of diamicton, clay, and clayey silt/sandy mud intervals in both holes. Moderate to abundant clasts ranging in size from 1–2 to >2 cm are found in the subunits (Figures F5, F6).
3.2. X-ray diffraction
X-ray diffraction (XRD) analysis was used to calculate the relative abundances of clay minerals kaolinite, illite, smectite, and chlorite (Figure F11) for Hole U1624B at a resolution of one sample per ~10 m. The relative abundance of kaolinite ranges between 11% and 38% (standard deviation [SD] = 7), showing a cyclic variation in the percentage, and a gradual decrease with depth in Hole U1624B. Illite varies from 26% to 67% (SD = 10), showing fewer variations throughout Unit I and Subunit IIA, with values averaging 46% (SD = 10), and a significant increase in Subunit IIB. Cyclic variations of smectite occur in Unit I. The maximum value (20%; SD = 4) of smectite occurs in the upper part of Subunit IIA, below which values gradually decrease. Smectite is absent in Subunit IIB. Chlorite relative abundances gradually increase downhole from Subunit IA to IB, ranging between 11% and 47% (SD = 8), but it sharply decreases in Subunit IIB.
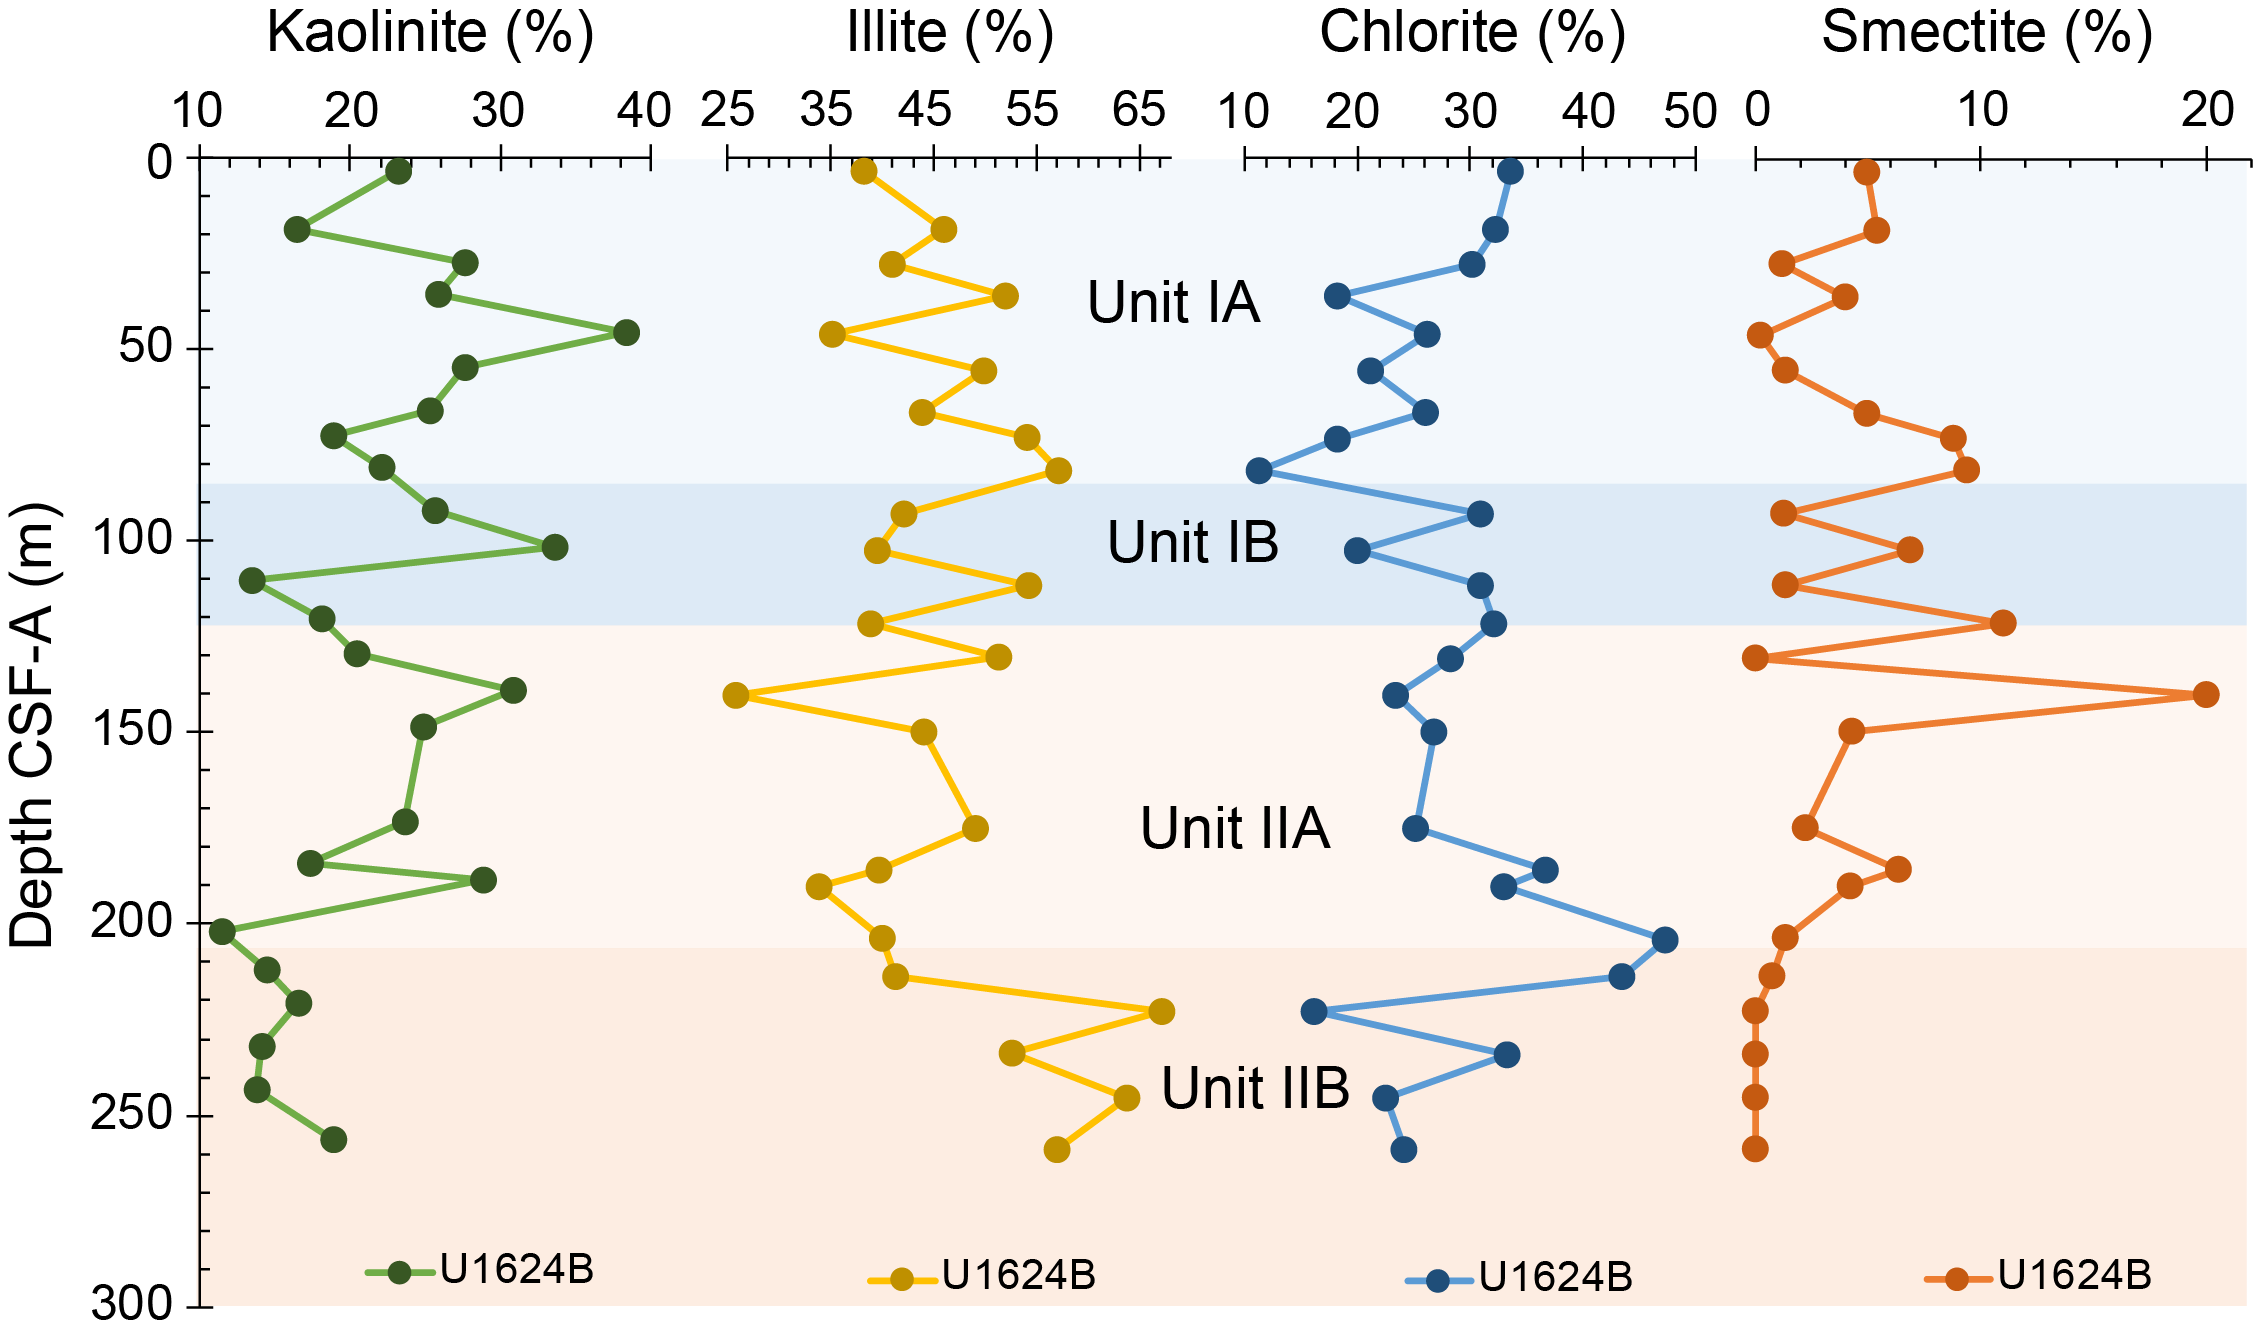
Figure F11. Clay analysis.
3.3. Preliminary interpretation
Site U1624 lies in the Isfjorden drift, located between the Isfjorden TMF and Bellsund TMF, and provides a comprehensive sedimentary record of Middle–Late Pleistocene shelf edge glaciation. The lithology at Site U1624 exhibits a transition from clast-rich diamicton in the lower part of the holes to bioturbated silty clay. This transition potentially suggests a shift from a proximal to the distal setting of the ice sheet. Subunit IIB is almost entirely composed of diamicton intervals, suggesting a prominent shelf edge glaciation delivering glaciogenic debris flows to the continental margin. The presence of glaciogenic debris flows is supported by the clay mineral assemblage that is mainly formed by illite with virtual absence of smectite (Lucchi et al., 2013). Minor occurrences of diamicton in Subunits IIA and IB indicate infrequent shelf edge glaciations after the first onset, with interlaminated silt and silty clay layers representing the facies of proximal plumites derived from the release of sediment-laden meltwaters during ice sheet decay (glacial terminations). The absence of diamicton and rare clasts in Subunit IA with bioturbated sediments may indicate a possible change of the paleo ice sheet dynamics under forcing climatic conditions.
4. Biostratigraphy and paleoenvironment
Holes U1624A–U1624C were analyzed for calcareous nannofossils and diatoms. Hole U1624B was analyzed for calcareous nannofossils, diatoms, dinoflagellate cysts (dinocysts), and planktonic foraminifers. Calcareous nannofossils are scarce at Site U1624, but four age markers were identified placing the uppermost ~154 m of the record within a Late Pleistocene age, plausibly younger than 0.9 Ma (Figure F12). Diatoms are only found at the very top of the site, not giving any age indication. The dinocyst assemblages are characteristic for the Late Pleistocene, but no specific markers are found (Table T3). The planktonic foraminifers show an overall Pleistocene age for Site U1624 (Figure F13). Overall, the observed microfossils at Site U1624 are characteristic of Arctic–polar conditions with (seasonal) sea ice (Figure F12). Some dinocyst assemblages also show intervals of relatively warm Atlantic water influence.
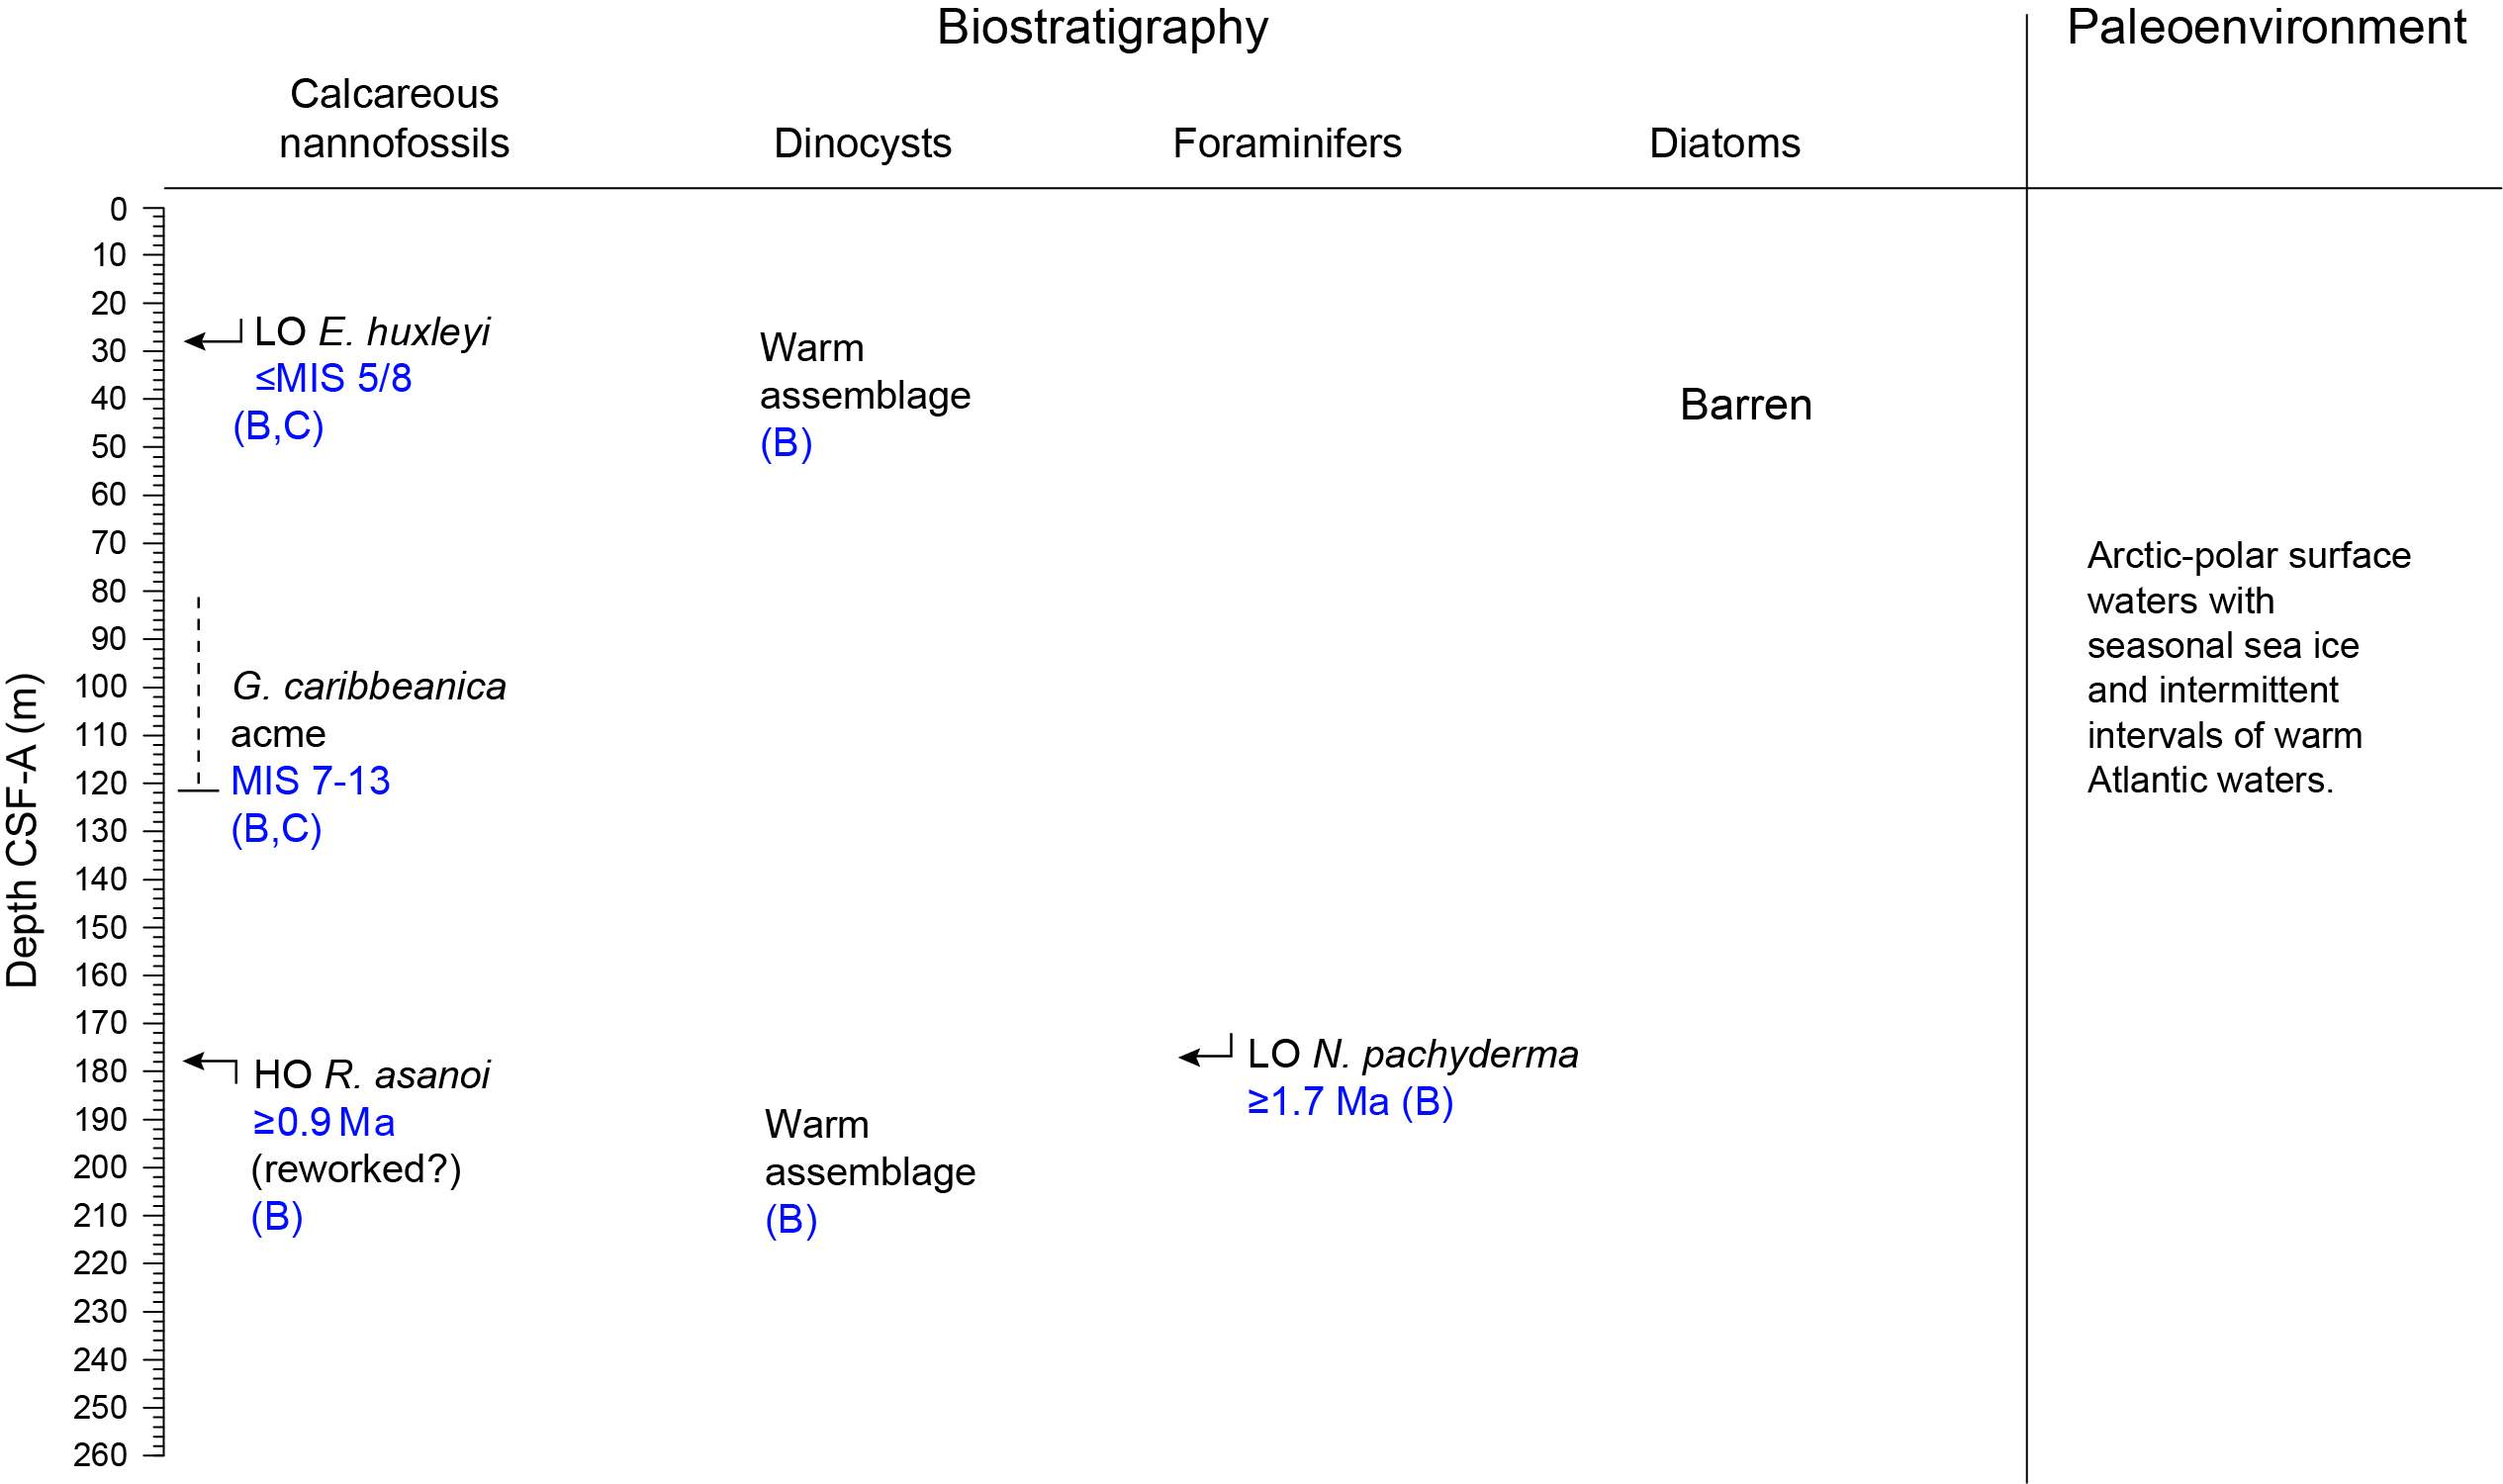
Figure F12. Biostratigraphic summary.
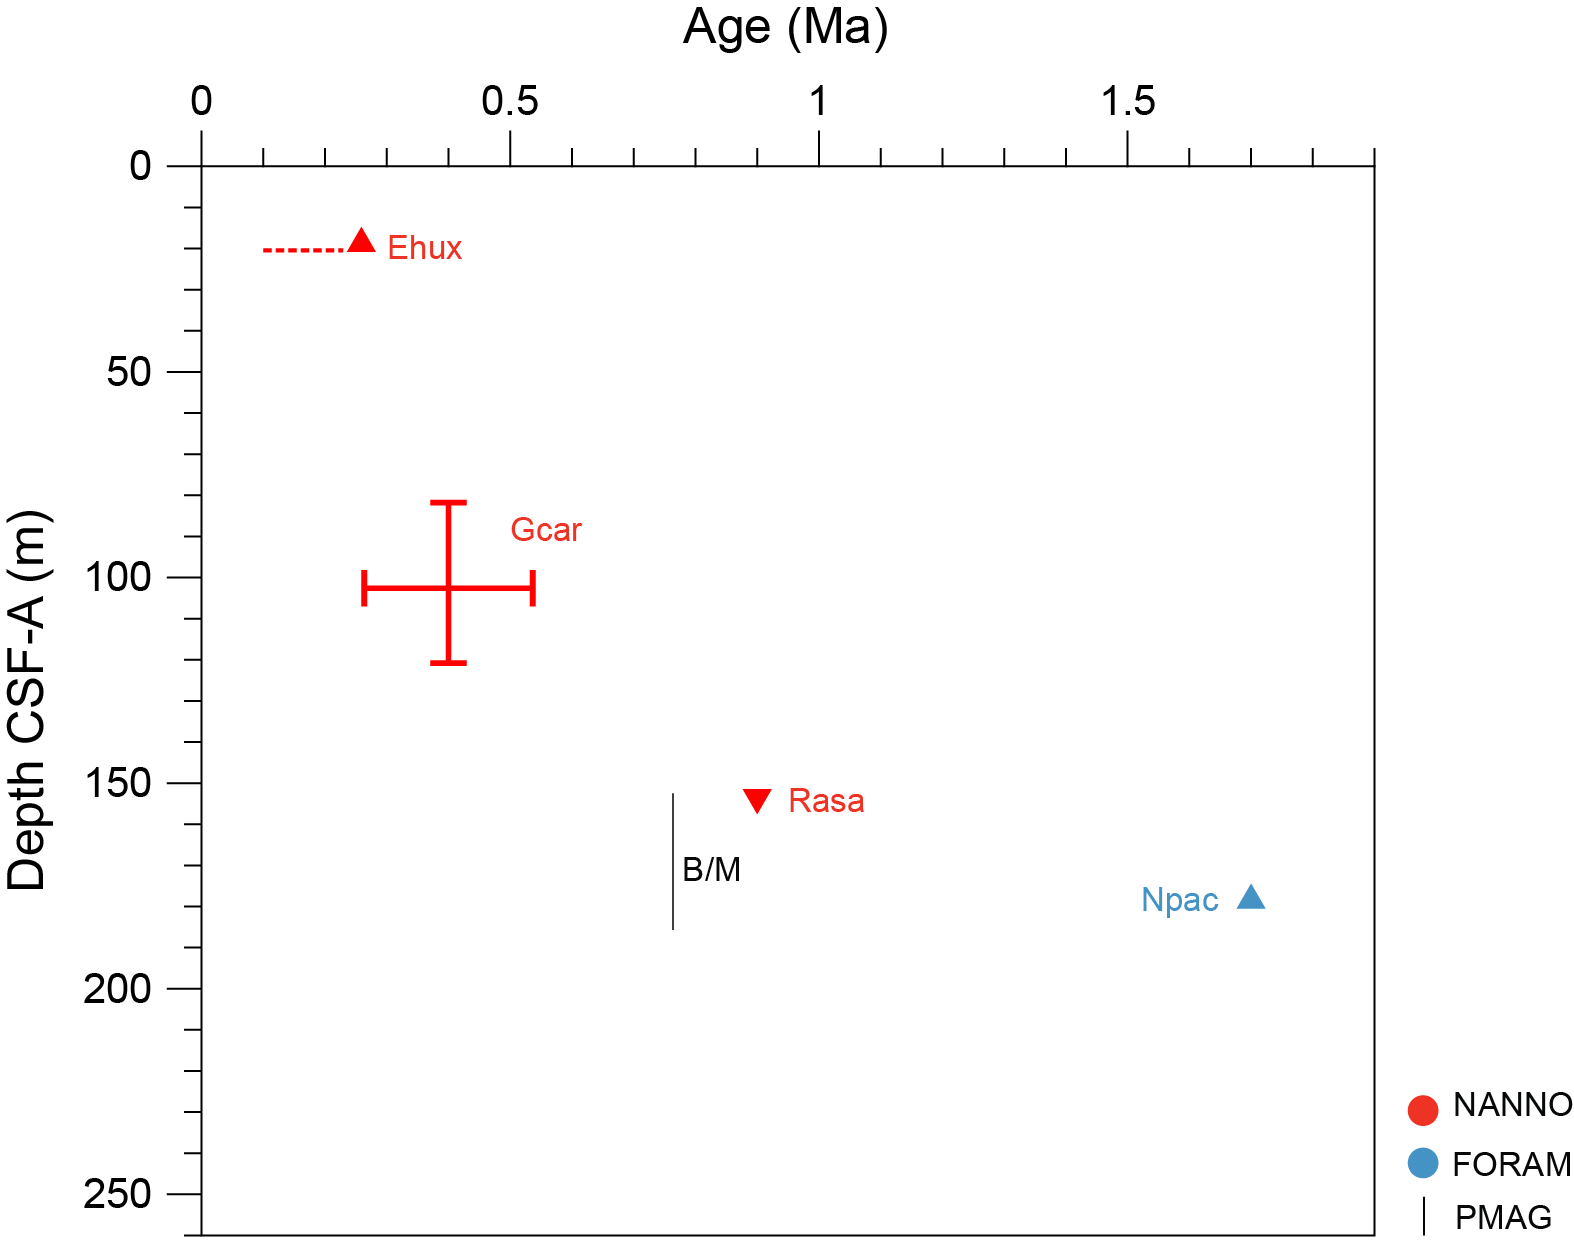
Figure F13. Age-depth model.
4.1. Calcareous nannofossils
In total, 115 samples were examined for the biostratigraphic characterization of nannofossil assemblages at Site U1624 (Figures F14, F15). All the core catchers from Holes U1624A and U1624B were analyzed. Additional samples were selected from split core sections (working halves) from Holes U1624B and U1624C after visual examination of sediments and physical properties (i.e., changes in MS).
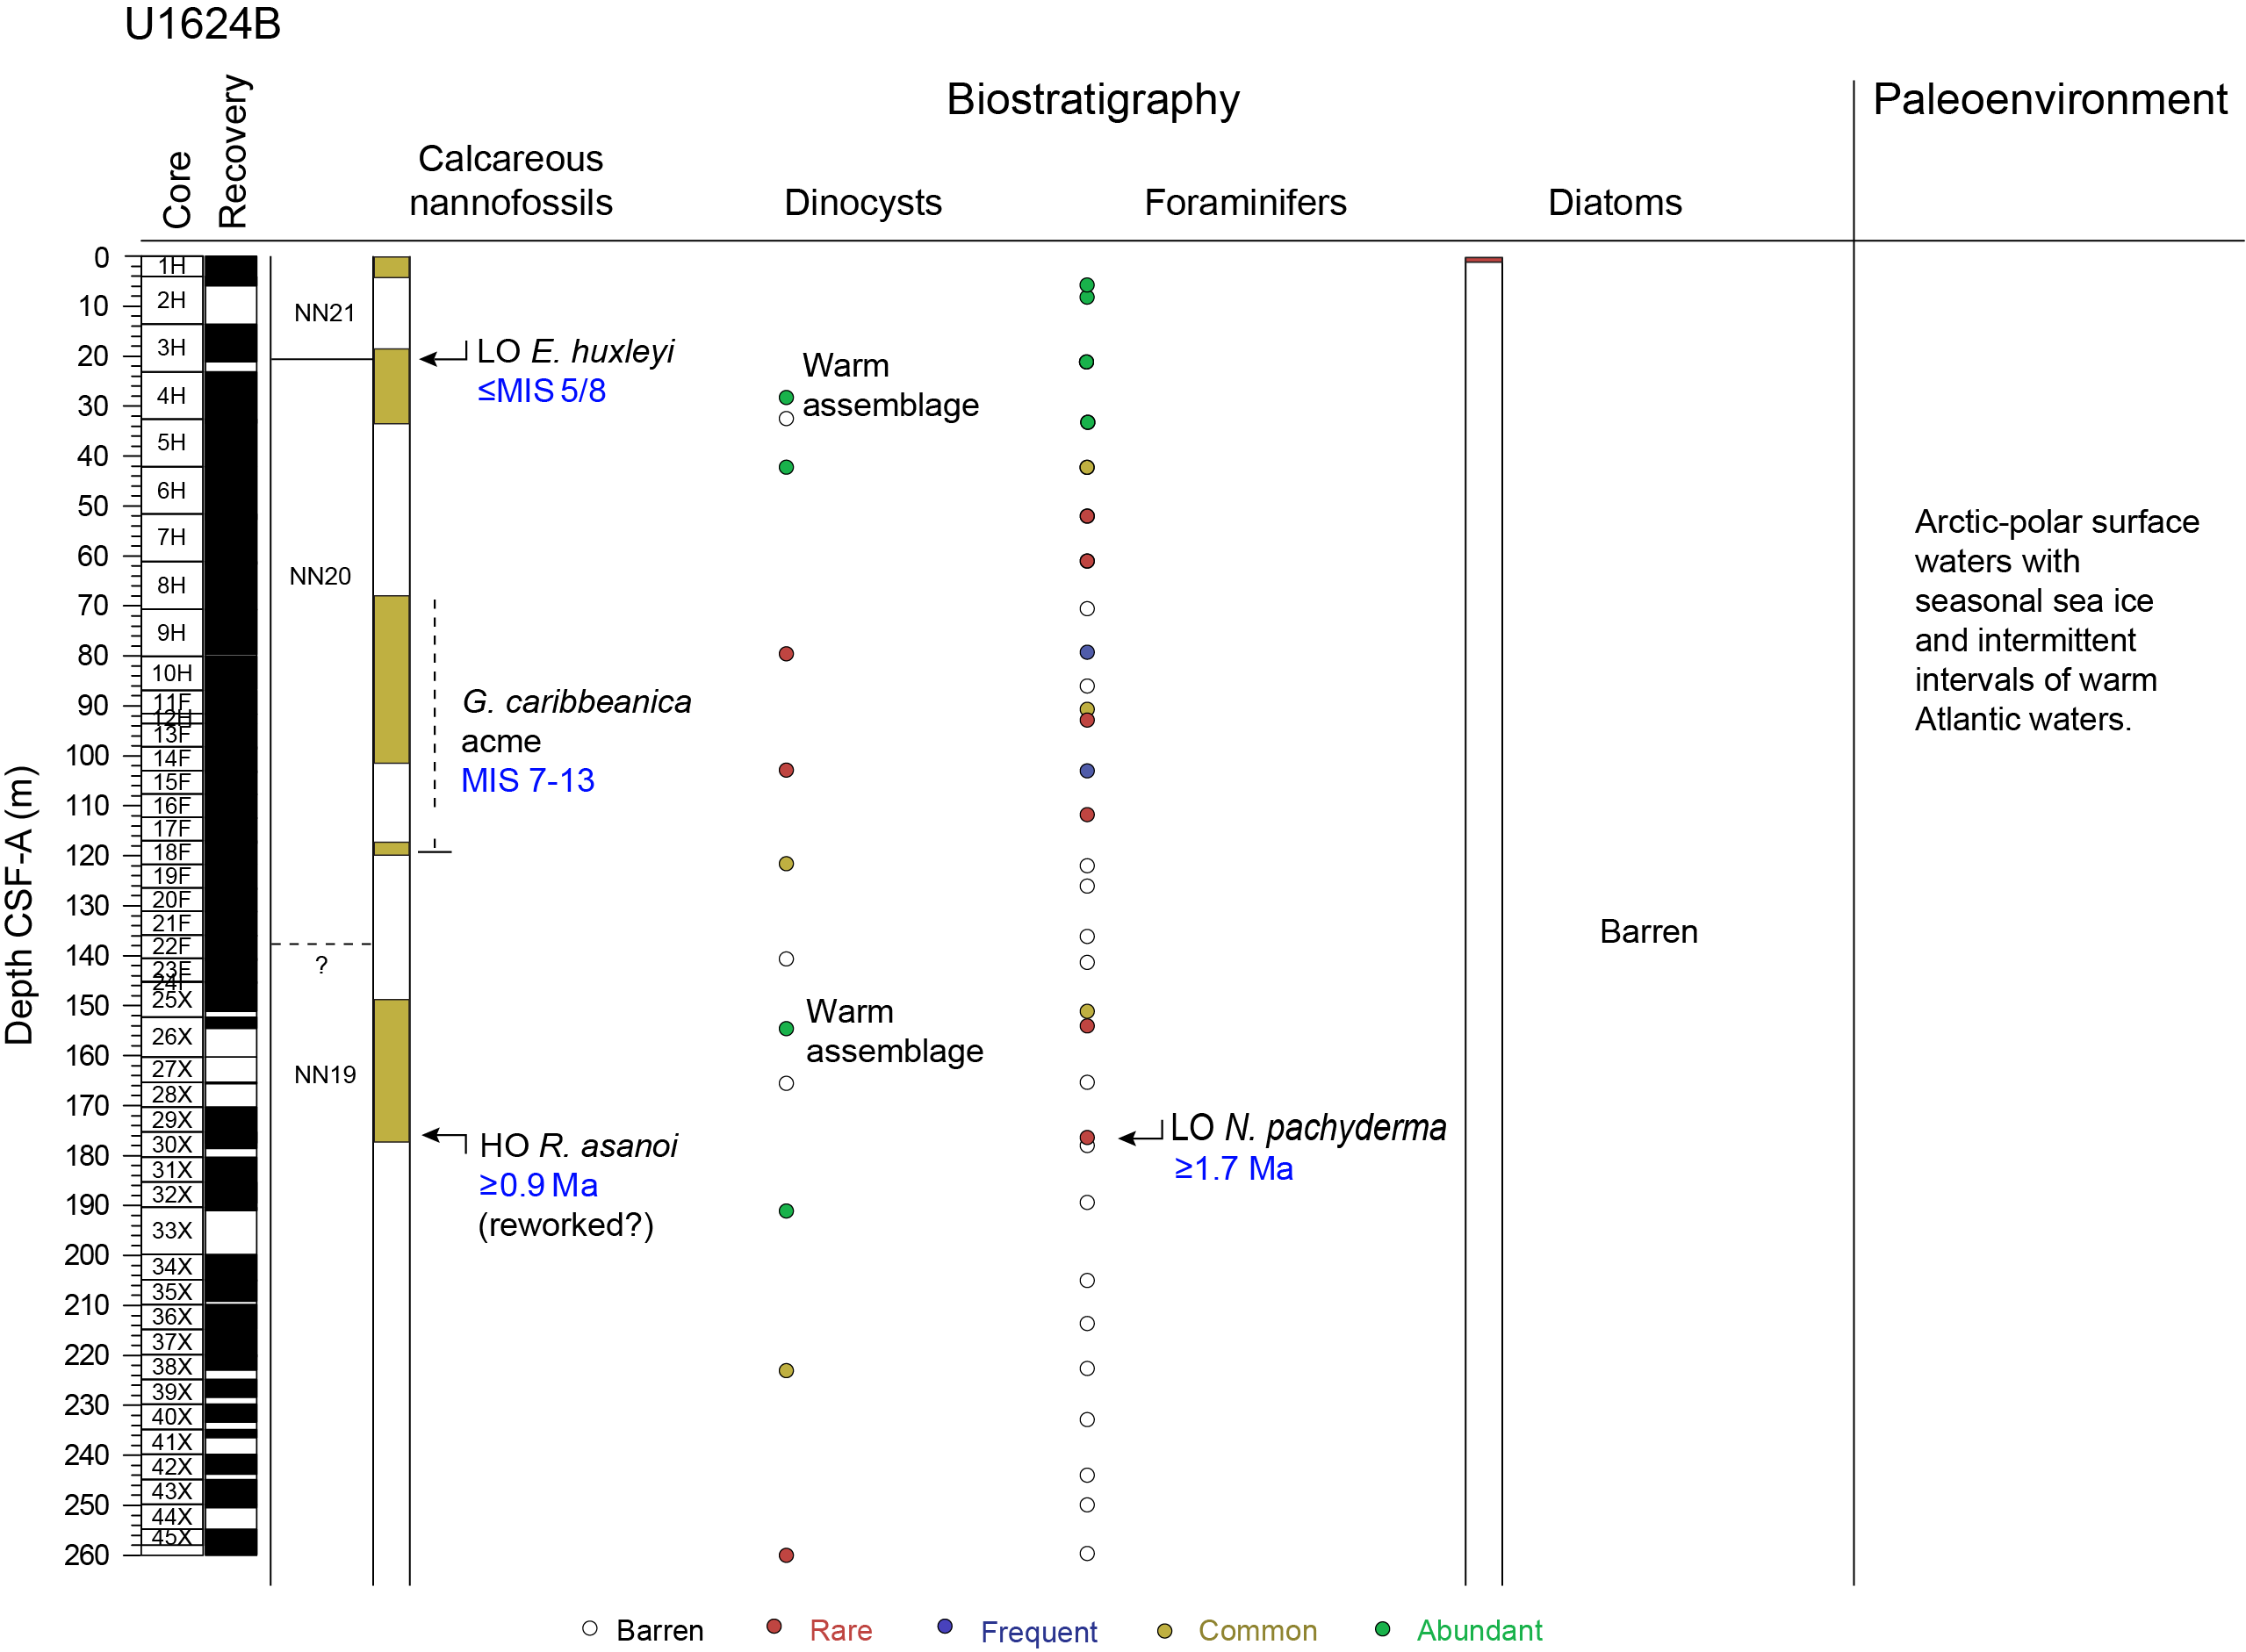
Figure F14. Biostratigraphy and paleoenvironment, Hole U1624B.
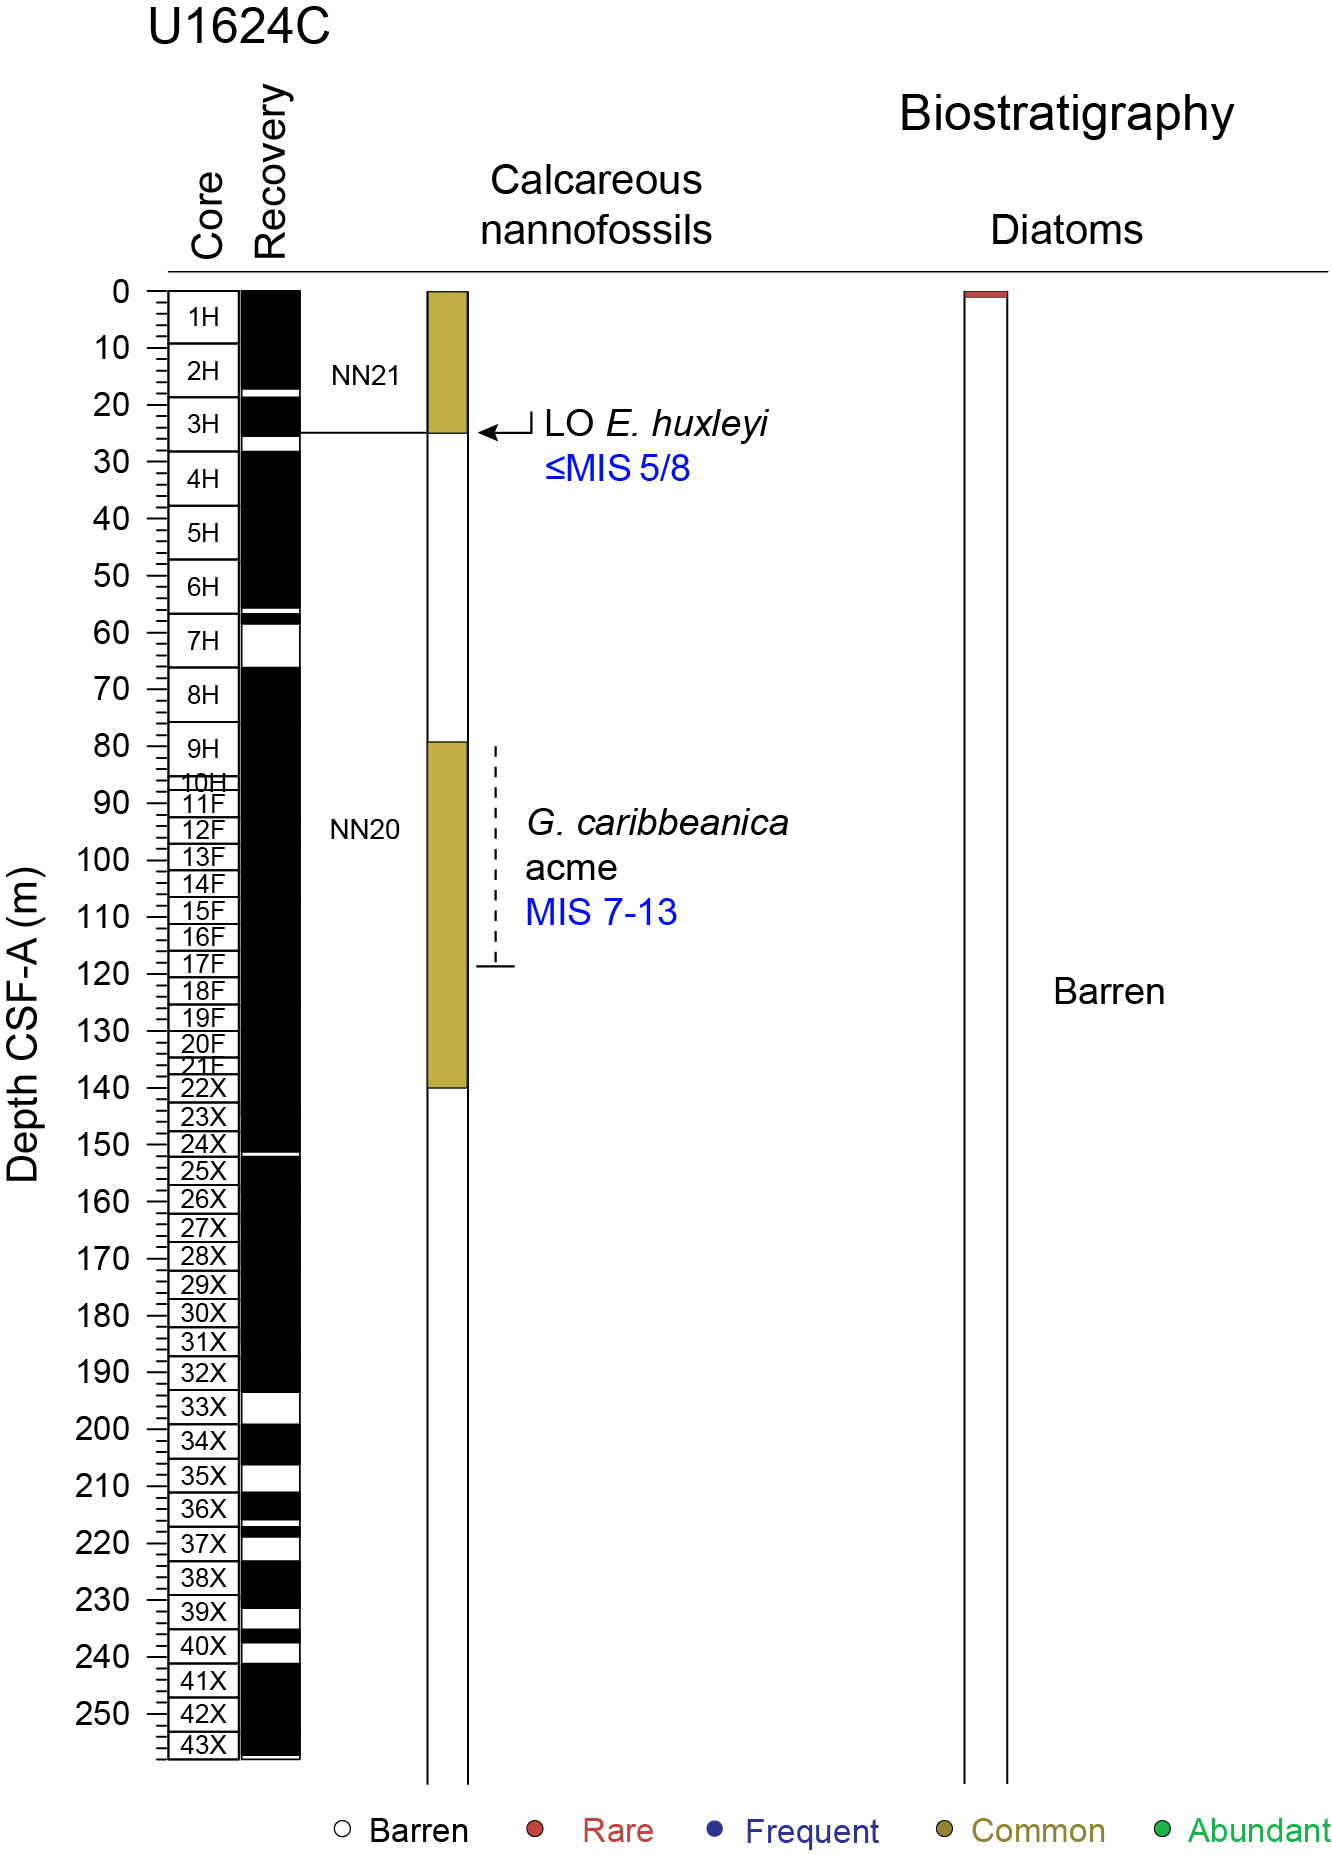
Figure F15. Biostratigraphy and paleoenvironment, Hole U1624C.
The representation of calcareous nannofossils in Holes U1624B and U1624C is scarce, and barren intervals are regularly alternated across the sequence. In the samples with calcareous nannofossil representation, the concentration of specimens ranges between rare and abundant. Calcareous nannofossils are more scarce toward the lower part of the sequence in both holes.
The diversity of calcareous nannofossils at Site U1624 is low, with a total of eight groups/taxa. This includes Emiliania huxleyi, small Gephyrocapsa, Gephyrocapsa caribbeanica, medium Gephyrocapsa, Reticulofenestra asanoi < 6 µm and R. asanoi > 6 µm, Coccolithus pelagicus, and Calcidiscus leptoporus. The preservation of specimens is good to moderate in the samples from both holes. Reworked nannofossils from older stratigraphic levels are occasionally present, with an abundance that ranges between rare and frequent.
Two calibrated events were determined in Hole U1624B and one in Hole U1624C. Together with this, complementary information from acme events and species/group presence in samples give a Late Pleistocene age for the sequence at Site U1624. Initial evidence of mid-Pleistocene age assignment will need to be constrained after further investigation at a higher resolution.
The lowest occurrence (LO) of E. huxleyi is recorded in Hole U1624B in Sample 3H-CC and in Hole U1624C in Sample 4H-2, 88 cm. According to the global calibration for this event, the 280 ka boundary, at Marine Isotope Stage (MIS) 8, can be identified (Thierstein et al., 1977). However, following the determination for the biostratigraphic characterization of this species in Arctic latitudes (Razmjooei et al., 2023), the age of these levels could be displaced up to MIS 5 (i.e.,130 ka). The uppermost part of the sequence in both holes corresponds to Zone NN21 by Martini (1971).
The acme event of G. caribbeanica is constrained in Hole U1624B between Samples 10H-1, 101 cm, and 18F-CC and in Hole U1624A between Samples 9H-4, 64 cm, and 18F-1, 34 cm. In agreement with the characterization of this event across the Atlantic latitudes (Flores et al., 2012; González-Lanchas et al., 2023) and in the Arctic Ocean (Razmjooei et al., 2023), an age range spanning between MISs 7 and 13 (191–524 ka) could be attributed to this part of the section in both holes at Site U1624.
In Hole U1624B, the species R. asanoi >6 µm is observed in Sample 26X-CC, possibly indicating the correspondence of this stratigraphic level to an age older than 0.9 Ma, according to the global calibration for the highest occurrence (HO) of this species (Wei, 1993; Raffi, 2002). The absence of further markers toward the end of the section and the overall scarcity of nannofossils in samples above and below this boundary obscured the assessment of this event and the discrimination of reworking. Further examination of samples at a higher resolution will be required to validate the identification of this boundary.
4.2. Diatoms and silicoflagellates
The study of diatoms at Site U1624 is based on the examination of 115 samples, including core catcher samples and additional samples from split core sections (working halves). Site U1624 is barren of diatoms, except in the uppermost sections of Holes U1624A and U1624B where abundance is rare, and preservation of the diatom assemblage is moderate (Figures F14, F15). In Hole U1624A, diatom abundance is rare in the core catcher of the first core (Sample 1H-CC; 1.3 mbsf). In Hole U1624B, diatoms were recorded in the very top of the hole (Sample 1H-1, 1 cm; 0.01 mbsf). Moreover, some intervals with fragments of diatoms were also observed in Samples 403-U1624B-2H-1, 60 cm (4.7 mbsf), and 16F-1, 56 cm (108.16 mbsf).
Diatom assemblage is mainly constituted by species such as Bacteriosira bathyomphala, Fragilariopsis oceanica, Thalassiosira nordenskioeldii, Coscinodiscus marginatus, Thalassionema nitzschioides var. nitzschioides, Chaetoceros in resting spore stage, and neritic species such as Paralia sulcata, which together represent a characteristic assemblage of the study area (Oksman et al., 2019).
No Neodenticula seminae or silicoflagellates are observed at this site.
4.3. Dinoflagellate cysts
Dinocysts were analyzed in 12 samples from Hole U1624B, including selected core catchers throughout the entire hole and 3 samples around the supposed transition from MIS 6 to MIS 5. The dinocyst assemblages did not include any biostratigraphic marker. In addition, several core catcher samples contained only a low number of dinocysts or were barren (Figure F14). The dinocyst assemblages from the nonbarren samples are characteristic for the Late Pleistocene. Heterotrophic taxa such as round brown cysts (RBC) and Brigantedinium are most abundant in the assemblages, likely reflecting nutrient-rich (seasonal) sea ice conditions (e.g., de Vernal et al., 2020). Two samples contain higher numbers of cysts of Protoceratium reticulatum, which reflect the influence of warmer Atlantic waters in the Fram Strait and Arctic Ocean (e.g., Matthiessen and Knies, 2001; Matthiessen et al., 2018).
Samples 403-U1624B-4H-CC, 22F-CC, and 28X-CC contain a considerable amount of reworked dinocysts and terrestrial palynomorphs, but they are barren of Pleistocene dinocysts. The other samples contain between 5 and 13 different taxa, which is comparable to the other sites of this expedition.
The set of three samples analyzed around the transition from MIS 6 to MIS 5 are characterized by a (seasonal) sea ice assemblage dominated by Islandinium minutum in Sample 403-U1624B-5H-CC (e.g., de Vernal et al., 2020), followed by the barren Sample 4H-CC and a warm Atlantic water dinocyst assemblage in Sample 4H-4, 69–81 cm. The latter sample is dominated by cysts of P. reticulatum, a species that is characteristic in Late Pleistocene interglacials of the Fram Strait (Matthiessen and Knies, 2001; Matthiessen et al., 2018).
Sample 403-U1624B-26X-CC contains a rich dinocyst assemblage (13 taxa) and likely corresponds to a warm interval in the Pleistocene. The dominant taxa are RBCs and Brigantedinium, and I. minutum is also present. Nevertheless, species like P. reticulatum, Nematosphaeropsis labyrinthus, Bitectatodinium tepikiense, and the acritarch Nannobarbophora walldalei are also present. Together, this suggests a seasonal sea ice environment, under the influence of warmer Atlantic waters (de Vernal et al., 2020). Pediastrum indicates the presence of freshwaters.
All other samples contain rare to abundant dinocysts and are low in diversity (4 or 5 taxa). In these samples, almost all encountered taxa are heterotrophic taxa (RBCs, Brigantedinium, or Islandinium brevispinosum). Occasionally an autotrophic species is encountered, such as B. tepikiense (Sample 403-U1624B-33X-CC), N. labyrinthus (Sample 14F-CC), or Spiniferites spp. (Samples 38X-CC and 45X-CC). The assemblage likely suggests a (seasonal) sea ice environment (de Vernal et al., 2020).
No biostratigraphic markers are encountered in Hole U1624B. Assemblages are typically Late Pleistocene in age, and, given the absence of markers such as Protoperidinium stellatum, Filisphaera filifera, and Habibacysta tectata, potentially the section in Hole U1624B is younger than 1–1.4 Ma (Matthiessen et al., 2018). An age assessment based on the absence of markers should be treated with care. The absence of species may not be a true signal, as absence may be caused by sample resolution, sediment recovery, and environmental conditions (i.e., too shallow environment).
4.4. Foraminifers
All 32 core catcher samples from Hole U1624B were analyzed for planktonic foraminifers. Planktonic foraminifers are present in the upper part of the record ranging from rare to abundant (Figure F14). At ~71 mbsf and below, barren intervals occur, and when foraminifers are present, their abundance is generally rare. Below 178 mbsf toward the bottom of Hole U1624B, foraminifers were not observed. Generally, the tests are highly abraded/dissolved or encrusted. There are no or very few fragments present.
The fauna is dominated by Neogloboquadrina pachyderma, which has its LO at 1.7 Ma in the North Atlantic (Weaver and Clement, 1986). Samples below the LO of N. pachyderma at 178.50 mbsf are barren of planktonic foraminifers; hence, the actual LO may be below this level. The fauna also comprises rare abundances of Globigerina bulloides, Globigerinita glutinata, Neogloboquadrina incompta, and Turborotalita quinqueloba. This type of fauna is characteristic of Arctic–polar water masses with low surface temperatures and possibly seasonal sea ice (e.g., Husum and Hald, 2012; Schiebel and Hemleben, 2017).
5. Paleomagnetism
Paleomagnetic investigation at Site U1624 focused on measurements of the natural remanent magnetization (NRM) before and after alternating field (AF) demagnetization of the archive-half sections and vertically oriented discrete cube samples. All archive-half sections were measured except some that had significant visible coring disturbance and core catchers. APC and HLAPC archive sections were measured before and after 10 and 15 mT peak AF demagnetization. Because XCB cores do not use nonmagnetic core barrels and are more susceptible to the viscous isothermal remanent magnetization (VIRM) drill string overprint (Richter et al., 2007), XCB archive-half sections from Hole U1624B were measured before and after 15 and 30 mT peak AF demagnetization and XCB archive-half sections from Hole U1624C were measured before and after 30 mT peak AF demagnetization. Sedimentary fabric was likely not preserved in many of the sediments recovered at the depths of XCB coring because these were often described as diamictons having high abundance of coarse material, and it only rarely displayed intact biscuits of undisturbed sediment (see Lithostratigraphy). This likely limits the potential for robust paleomagnetic reconstructions from these depths. Unlike most of the sites drilled during Expedition 403, Site U1624 did not display obvious large MS peaks that might be associated with high concentrations of authigenic greigite nodules (see Physical properties).
The archive section half data were supplemented by the study of discrete cube samples for which we could be more selective with the sampling interval, subject to more detailed AF demagnetization of the NRM and study of the rock magnetic properties of the sediment. One cube sample was taken every 5 m on average from Hole U1624B (i.e., two per APC core; one per HLAPC core); however, in a few cases, extra samples were taken from XCB cores where less-disturbed sediments and intact biscuits were present. Similarly, only one or no samples were taken from XCB cores that had no intervals of finer-grained sediments. The NRM of the discrete cube samples were stepwise demagnetized before and after 0, 10, 15, 20, 25, 30, 35, 40, and 45 mT peak AF using the superconducting rock magnetometer (SRM) and in-line AF demagnetization system. Select samples from XCB-cored intervals were subject to additional demagnetization at 50 and 60 mT peak AF; however, this additional demagnetization did not provide any additional clarity to the characteristic remanent magnetization (ChRM). These measurements were supplemented by measurements of the MS and anhysteretic remanent magnetization (ARM). ARMs of APC/HLAPC-cored and some XCB-cored sections were measured before and after 0, 15, 20, 25, 30, 40 peak AF demagnetization to allow for comparison between NRM and ARM coercivity. ARMs of the remaining XCB-cored sections were measured before and after 30 mT peak AF demagnetization.
5.1. Sediment magnetic properties
Site U1624 magnetic properties are quite different from other Expedition 403 sites in that ARM coercivities are relatively low through the entire recovered interval, with the maximum ratio of ARM after 30 mT peak AF demagnetization to initial ARM (ARM30mT/ARM) less than 0.7 (Figure F16). In comparison, Sites U1618–U1620 and U1623 all had values greater than 0.9, similar to the greigite-siderite nodules studied in detail at Sites U1618, U1619, and U1623 (see Paleomagnetism in the Site U1618 chapter [Lucchi et al., 2026b]; Paleomagnetism in the Site U1619 chapter [St. John et al., 2026a]; and Paleomagnetism in the Sites U1621–U1623 chapter [Lucchi et al., 2026c]). Like many of the other sites, Site U1624 displays a bimodal distribution in ARM30mT/ARM ratios. The mode centered on 0.45 is consistent across sites, but the prominent mode at 0.62 is only seen at Site U1624 and to a lesser degree at the Bellsund drift sites. Future work can provide a more complete understanding of the magnetic mineral assemblages at Site U1624 and their implications for the fidelity of the paleomagnetic signal with additional high field magnetic, thermal magnetic, scanning electron microscope/energy dispersive spectrometry (SEM/EDS), and XRD analyses.
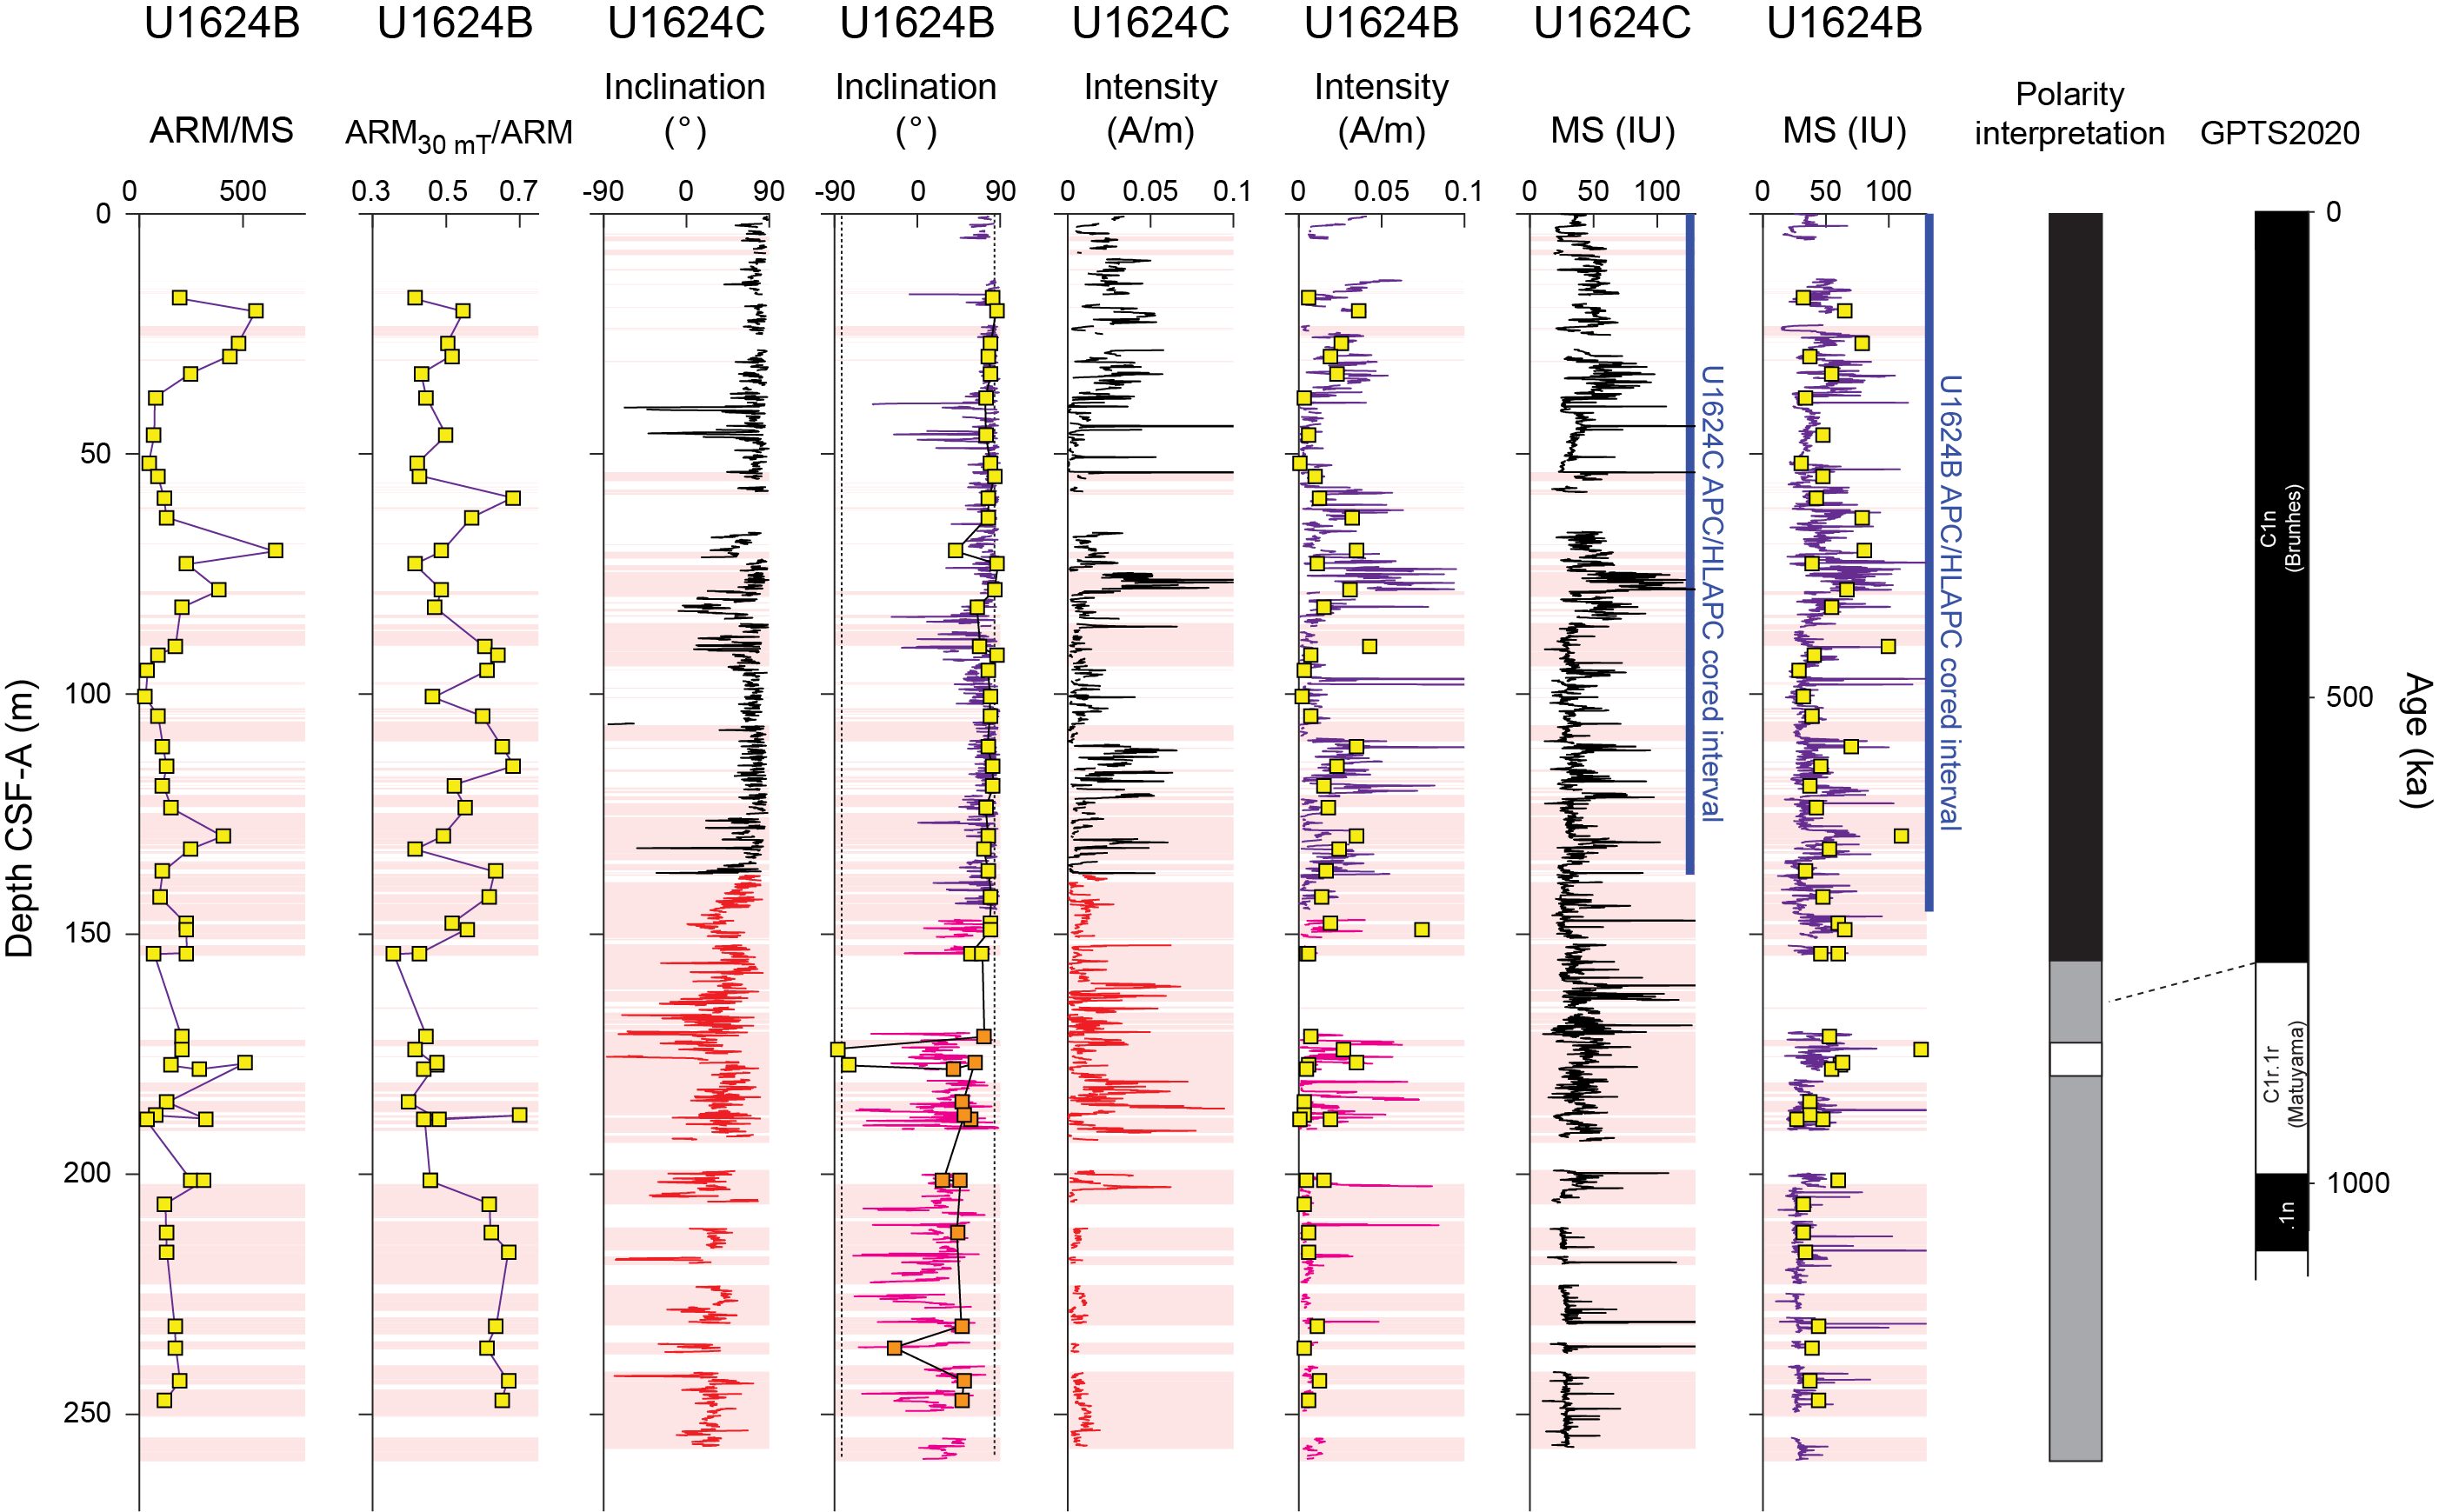
Figure F16. MS and paleomagnetic data.
5.2. Natural remanent magnetization
Of NRM intensities at Site U1624, 95% were between 6.7 × 10⁻³ and 1.6 × 10⁻¹ A/m. After 15 mT peak AF demagnetization in APC cores, this 95% interval of intensities was reduced to between 9.0 × 10⁻⁴ and 5.3 × 10⁻² A/m. After 30 mT peak AF demagnetization, the 95% interval of intensities remaining in XCB cores was between 6.0 × 10⁻⁴ and 4.8 × 10⁻² A/m.
Archive section half inclinations after the 15 mT peak AF demagnetization step in APC cores have a strong unimodal distribution with a peak around 80°, which is slightly lower than the expected value of 84° for a geocentric axial dipole (GAD) at Site U1624's latitude (Figure F17). The ChRM inclinations determined using principal component analysis for cube samples from APC-cored intervals display a similar distribution. Inclinations after the 30 mT peak AF demagnetization step in XCB cores show a broader unimodal distribution with peak around 30° that is significantly shallower than expected based on a GAD. ChRM inclinations determined from discrete cube samples also do not show a distribution that would be expected from a GAD, with the majority of samples around 50°. ChRM inclinations from cube samples taken from APC-cored sections are well defined with mean maximum angular deviation values (Kirschvink, 1980) of 3.8°, and 24 of 28 samples have maximum angular deviation values less than 5.0°. ChRM inclinations from cube samples taken from XCB-cored intervals are less well defined, with a mean maximum angular deviation value of 10.6° and only 8 of 22 samples having maximum angular deviation values less than 5°.
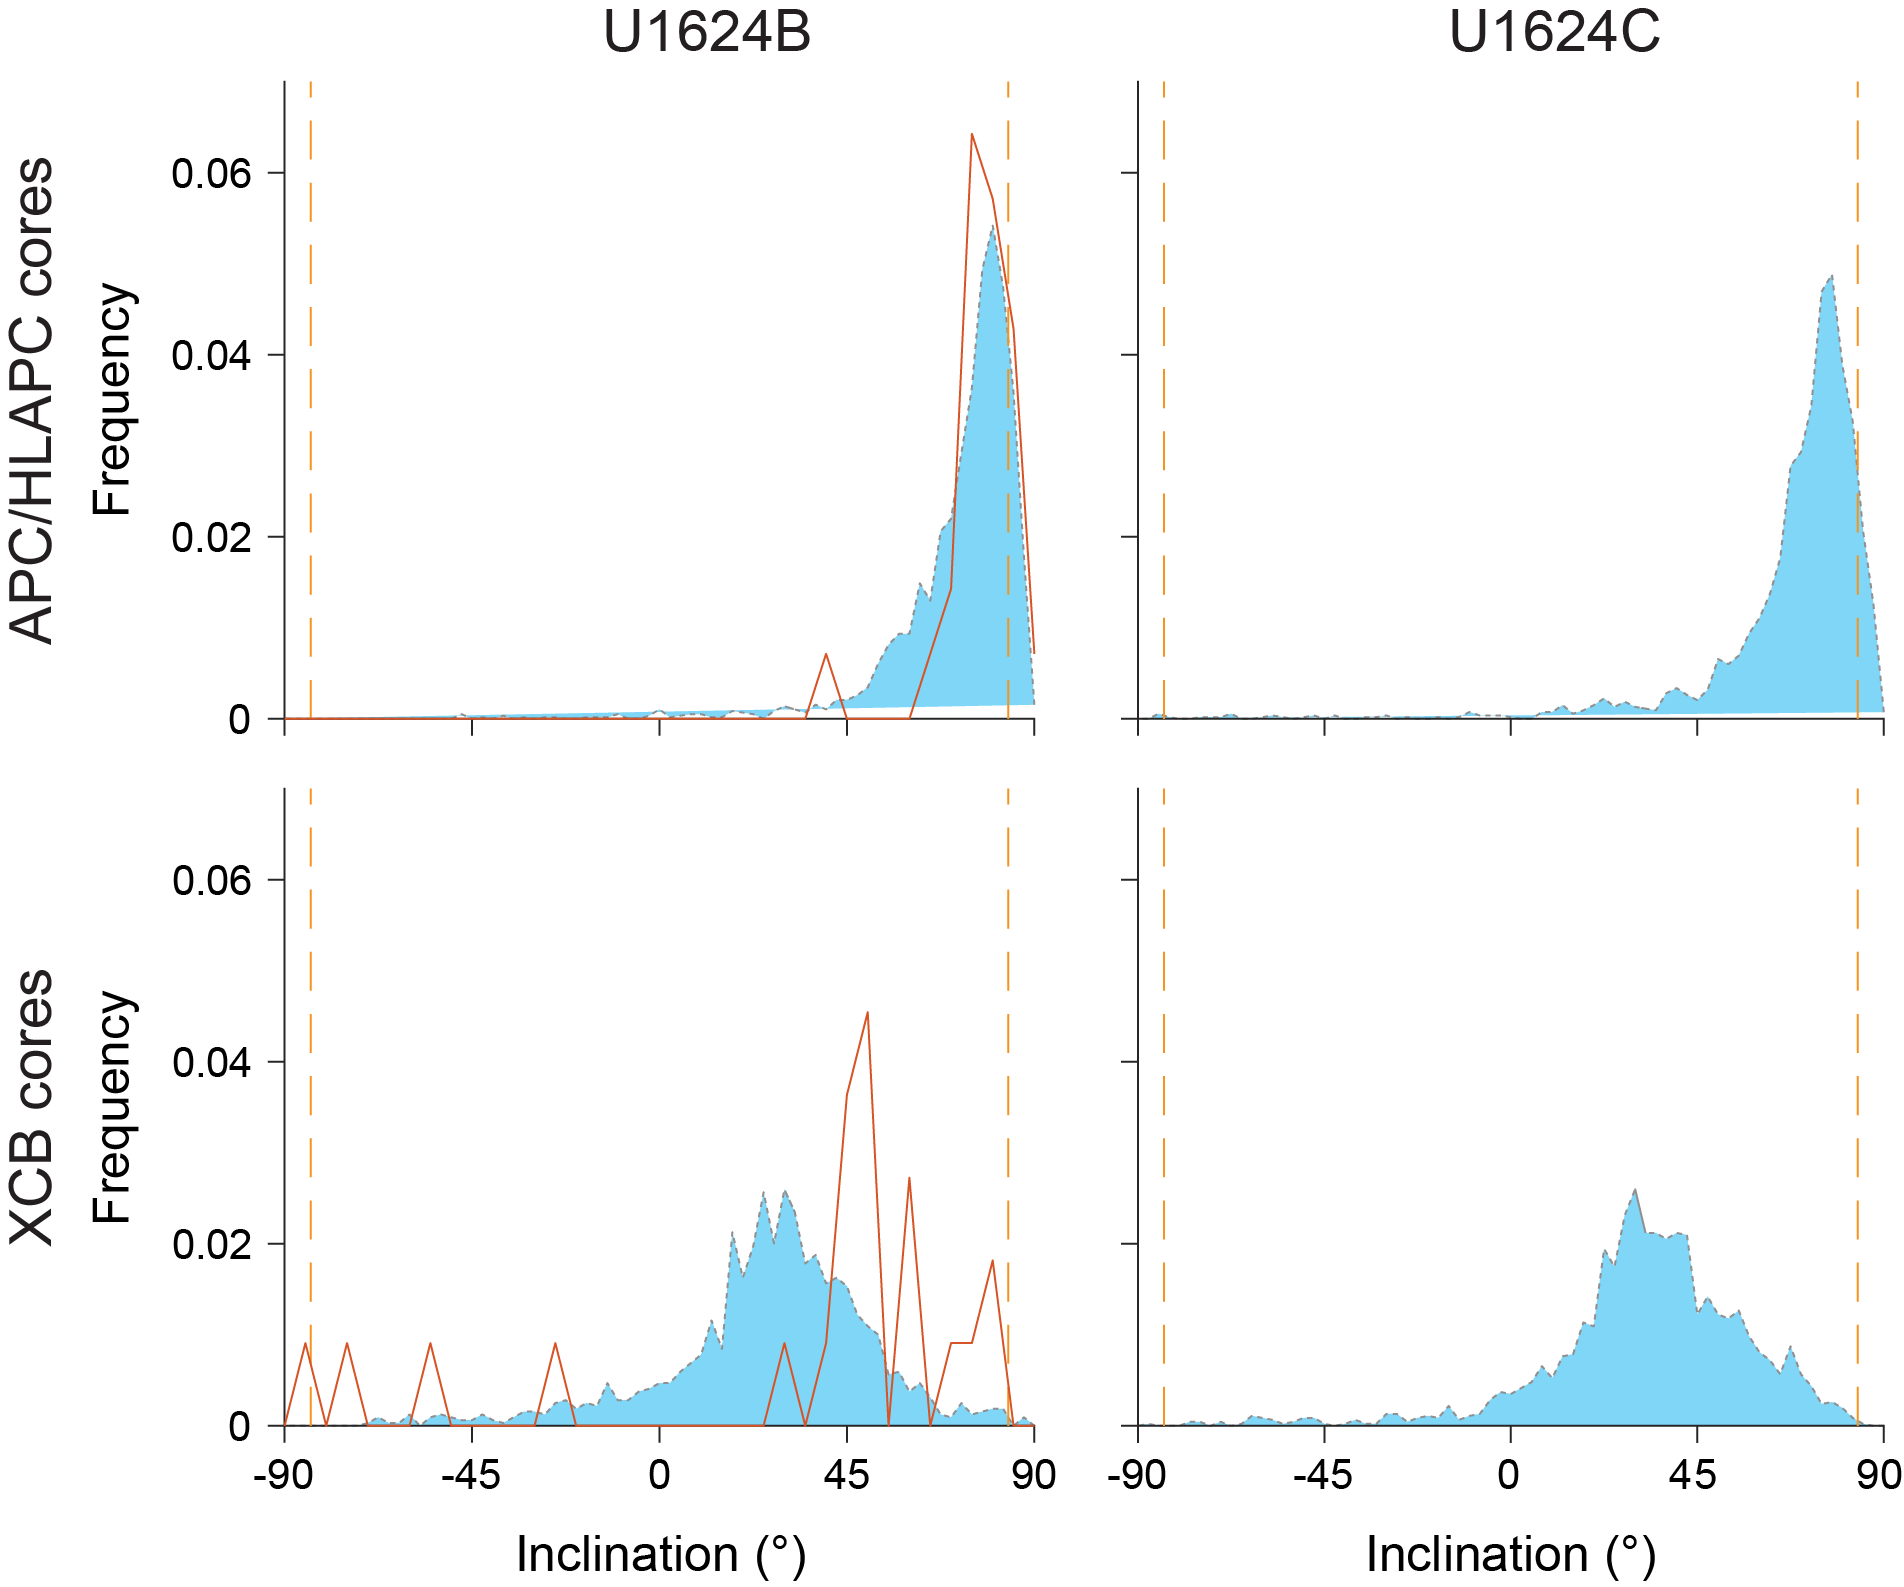
Figure F17. Inclination.
5.3. Magnetic stratigraphy
All APC-cored intervals (Hole U1624B = 0–145.3 mbsf; Hole U1624C = 0–137.6 mbsf) have excellent agreement between archive-half and discrete samples, were deposited during times of normal polarity, and can be assigned to Chron C1n (Brunhes), younger than 773 ka (Figure F16). The diamicton and sediments with abundant coarse material from the majority of XCB-cored intervals at Site U1624 likely do not preserve their original sedimentary fabric and rarely recovered intact biscuits. Based on visual observations and inclination distributions in both XCB archive section half and discrete cube data that are inconsistent with expected geomagnetic signals (Figure F17), we recommend careful evaluation of the sedimentary context before interpreting any XCB paleomagnetic data. Using split core photographs and X-ray images, we were able to confirm that samples from Cores 403-U1624B-25X (two samples with ChRM inclinations steep and positive), 26X (two samples with ChRM inclinations steep and positive), and 29X (two samples with ChRM inclinations steep and negative) were taken from intervals with intact biscuits and are likely reliable measurements. Examples from Core 29X are presented in Figure F18, illustrating intervals that have clear biscuiting versus intervals in which biscuiting is not observed. The steep and negative ChRM inclinations in Core 29X are from two sequential samples with reverse inclinations of −86° and −74° at 173.86 and 177.35 mbsf (29X-3, 57 cm, and 29X-5, 108 cm). A sample from the same core above these cubes at 171.37 mbsf (29X-1, 106 cm) has a steep and positive ChRM inclination of 73° but does not show clear biscuiting. Additional sampling, particularly between 50 and 60 cm in Section 29X-1, may help evaluate the reliability of this single data point (Figure F18). Likewise, a sample below these cubes at 178.14 mbsf (29X-6, 64 cm) appears to be from an interval with biscuiting, but it has a 38° value that is not consistent with expected normal or reverse inclinations for this latitude. Thus, although this approach may offer potential to improve the magnetic stratigraphy at Site U1624, there may be additional challenges with uncertainty that is difficult to assess. Using only samples that we were able to confirm were from intact biscuits using the split core and X-ray images and with inclinations that are consistent with expected values for this latitude, we find that the polarity transition is likely between 154.17 and 173.86 mbsf (Figure F16). There is limited potential to improve the magnetostratigraphy to provide precise age control below 145.3 mbsf in diamicton sediments. However, targeted sampling following careful assessment of split core and X-ray images from Holes U1624B and U1624C to identify intervals with intact biscuits may provide useful constraints. At this stage, we infer the onset of Chron C1n (the Matuyama/Brunhes boundary; 773 ka) must have occurred between 154.17 and 173.86 and the base of the recovered sediments must be older than 773 ka.
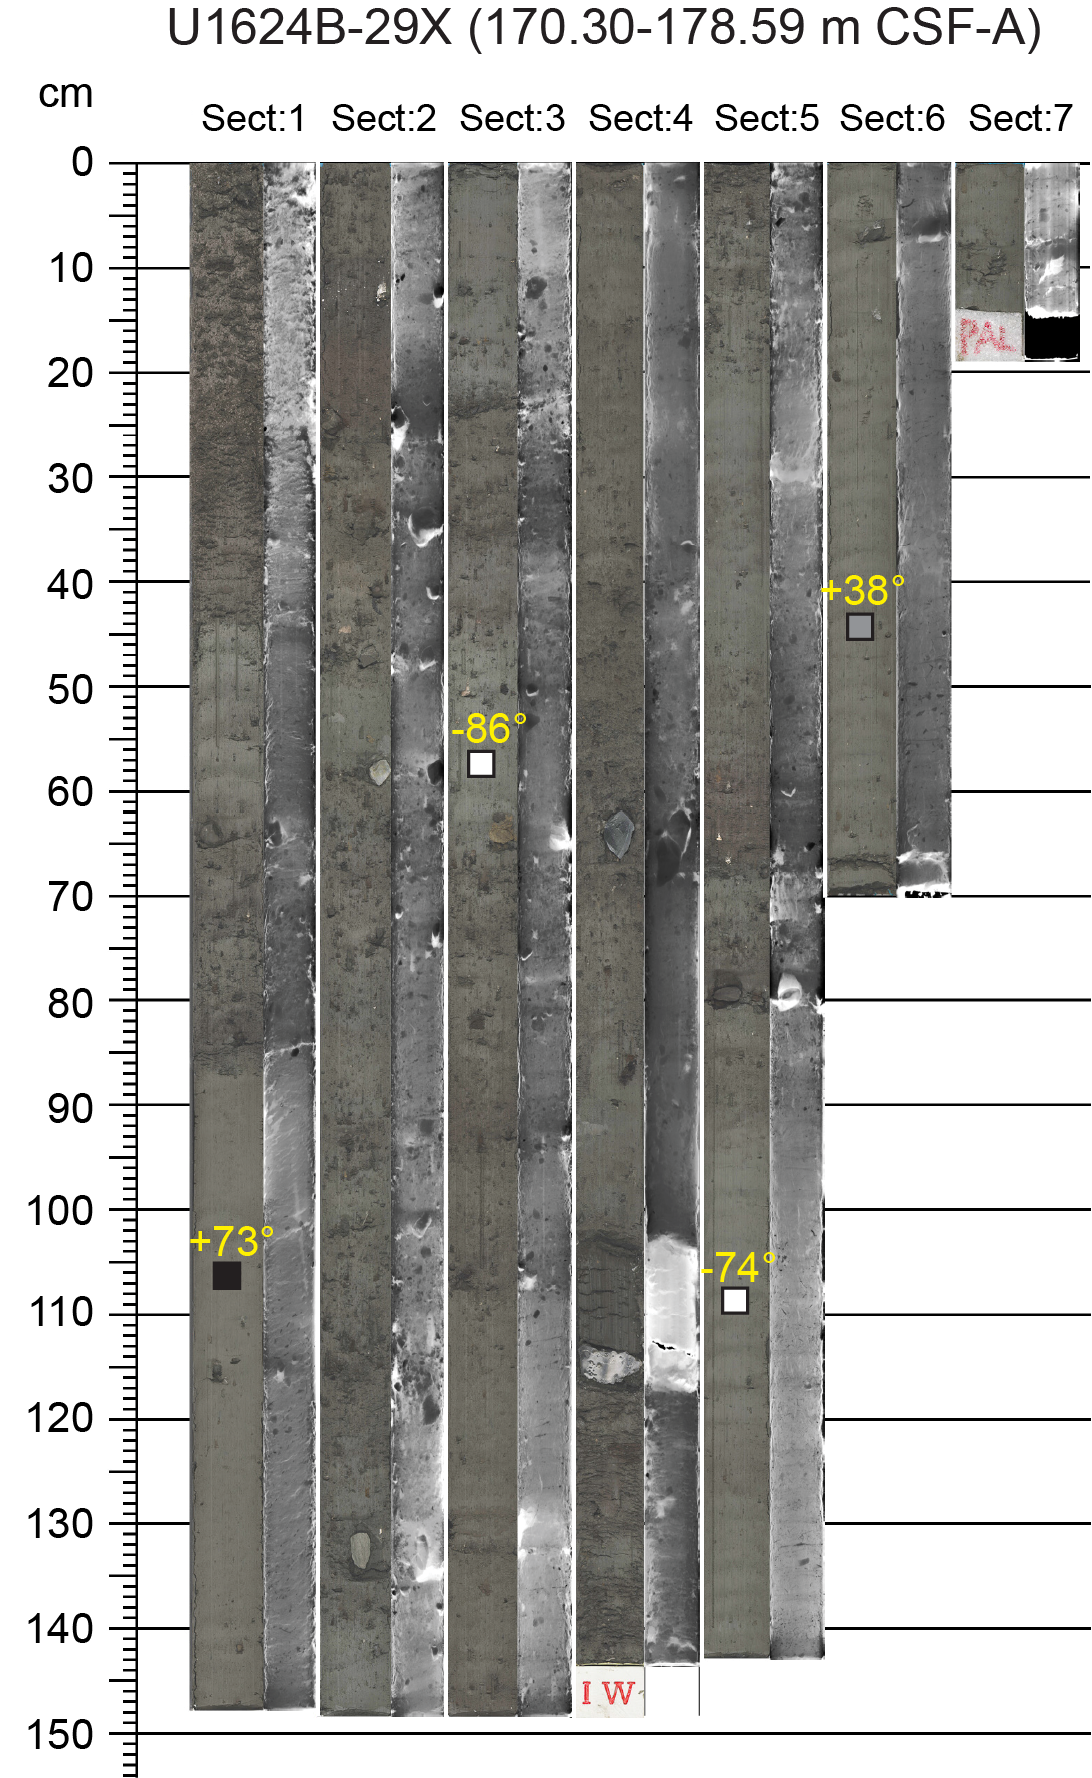
Figure F18. Paleomagnetic sample locations and ChRM inclinations.
Previous work from the Isfjorden drift using Calypso Core GS191-02PC has demonstrated the potential for these sediments to record high-resolution paleosecular variation of the geomagnetic field (Caricchi et al., 2019). The well-resolved magnetizations and magnetic mineral assemblages indicate potential for generating a high-resolution paleomagnetic reconstruction through some APC-cored intervals at Site U1624. These data may offer additional constraints on chronology within Chron C1n (Brunhes) in future work.
6. Physical properties
The physical properties measured shipboard for Site U1624 included nondestructive whole-round measurements using the Special Task Multisensor Logger (STMSL), Whole-Round Multisensor Logger (WRMSL), and Natural Gamma Radiation Logger (NGRL), as well as thermal conductivity and discrete P-wave velocity measurements on working-half sections after cores were split. GRA bulk density and MS were measured on the STMSL immediately after core recovery and then on the WRMSL after thermally equilibrating for a minimum of 4 h. Physical property data from the STMSL were used for initial hole-to-hole stratigraphic correlation (see Stratigraphic correlation) to aid in near-real-time drilling decisions but are not further evaluated and reported here. Further use of STMSL data is discouraged because WRMSL and Section Half Multisensor Logger (SHMSL) data, collected after allowing for thermal equilibration, are available in the Laboratory Information Management System (LIMS) database. P-wave velocity was also measured on the WRMSL for all core sections. Results from whole-round scans are compiled in Figure F19. Whole-round physical property data were used for hole-to-hole stratigraphic correlation (see Stratigraphic correlation).
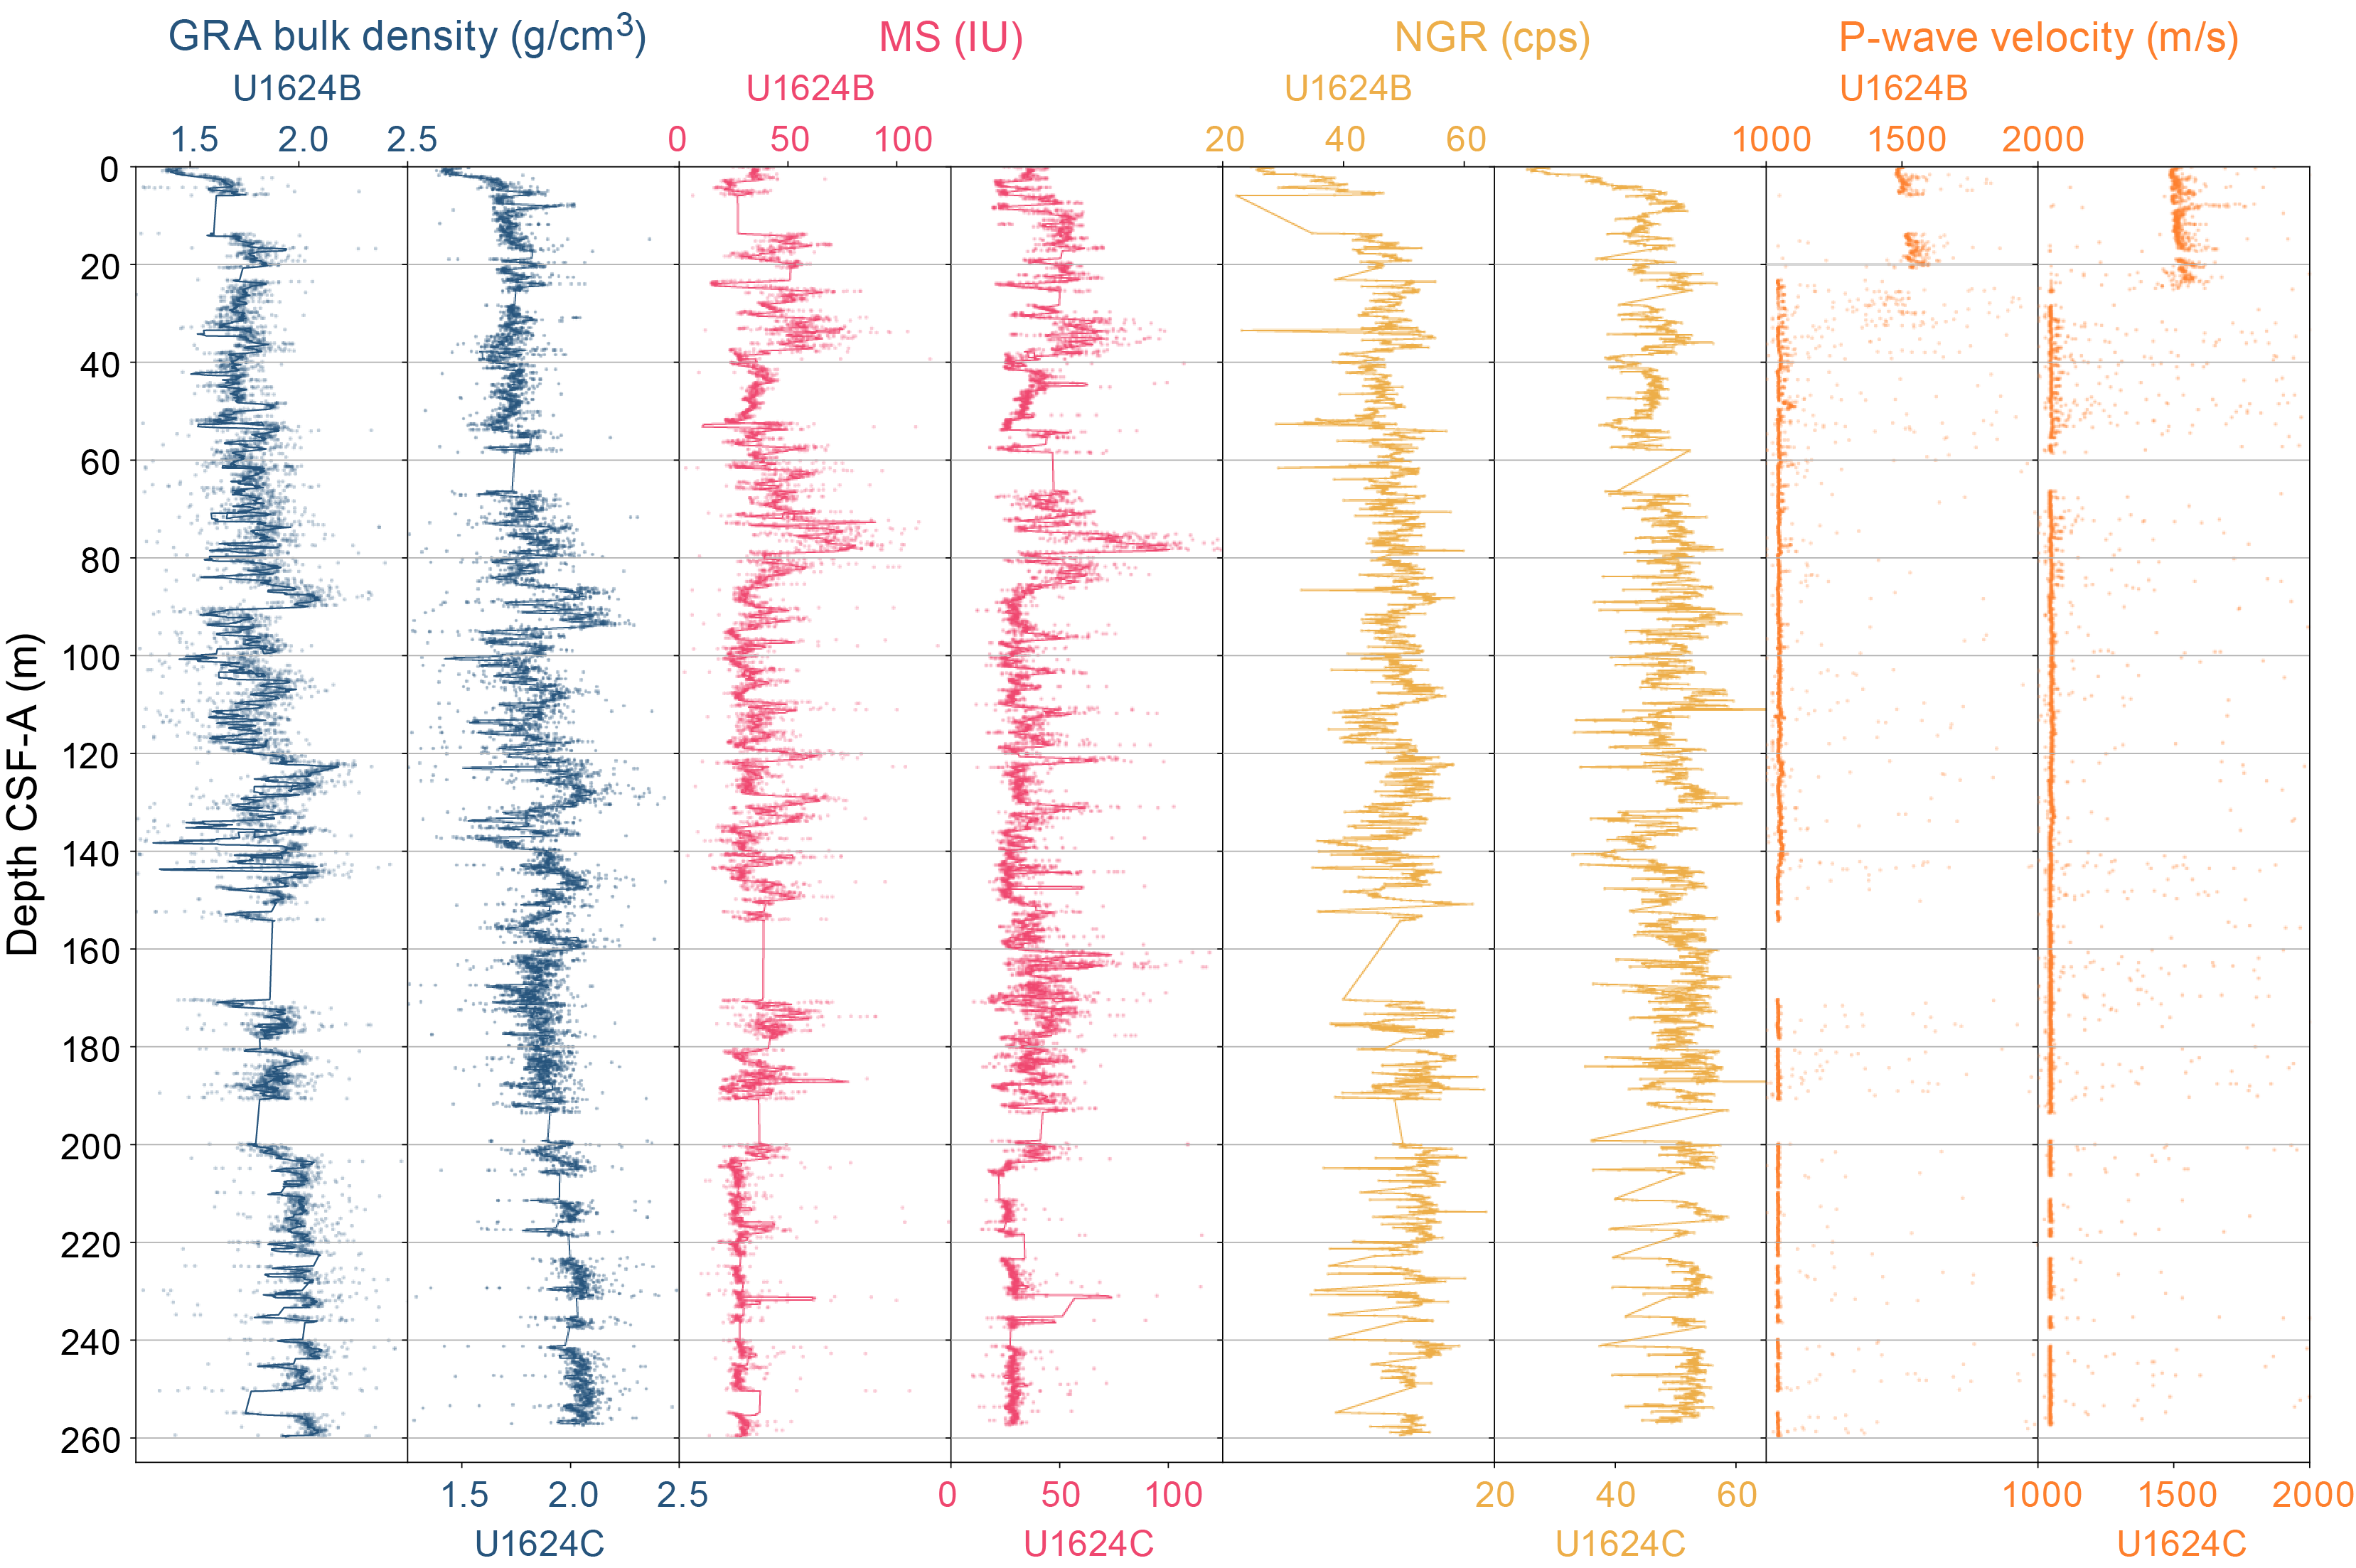
Figure F19. Physical properties, Holes U1624B and U1624C.
Discrete P-wave measurements were made with the Section Half Measurement Gantry (SHMG) on one section from Cores 403-U1624B-1H and 3H. Below ~20 mbsf, SHMG measurements ceased due to poor data quality, likely related to coarser sediment. Downcore thermal conductivity measurements were made at ~10 m step using a puck probe on the split face of working-half sections from Cores 403-U1624B-1H through 34X. Below Core 34X, thermal conductivity measurements were not made due to the unsuitability of sediments (i.e., very coarse, clast-rich material). Working-half sections of cores from Hole U1624B were sampled for moisture and density (MAD) analyses. Intervals with minimal coring disturbances were targeted for sampling. All archive halves were measured with the SHMSL for point-source MS (MSP) and color reflectance and X-ray scanned using the X-Ray Linescan Logger (XSCAN) (see Lithostratigraphy). Hole U1624A recovery was limited to one 1.33 m section. Data from Core 403-U1624A-1H are available in the LIMS database, but they are excluded from further discussion here.
6.1. Magnetic susceptibility
MS was measured both on whole-round sections using a pass-through loop sensor on the WRMSL track and on split archive-half sections using a point-source sensor on the SHMSL track. WRMSL measurements were made at 2.5 cm increments, and SHMSL resolution was 5 cm. MS measurements from both the WRMSL and SHMSL yielded similar values and downhole variability (Figure F20).
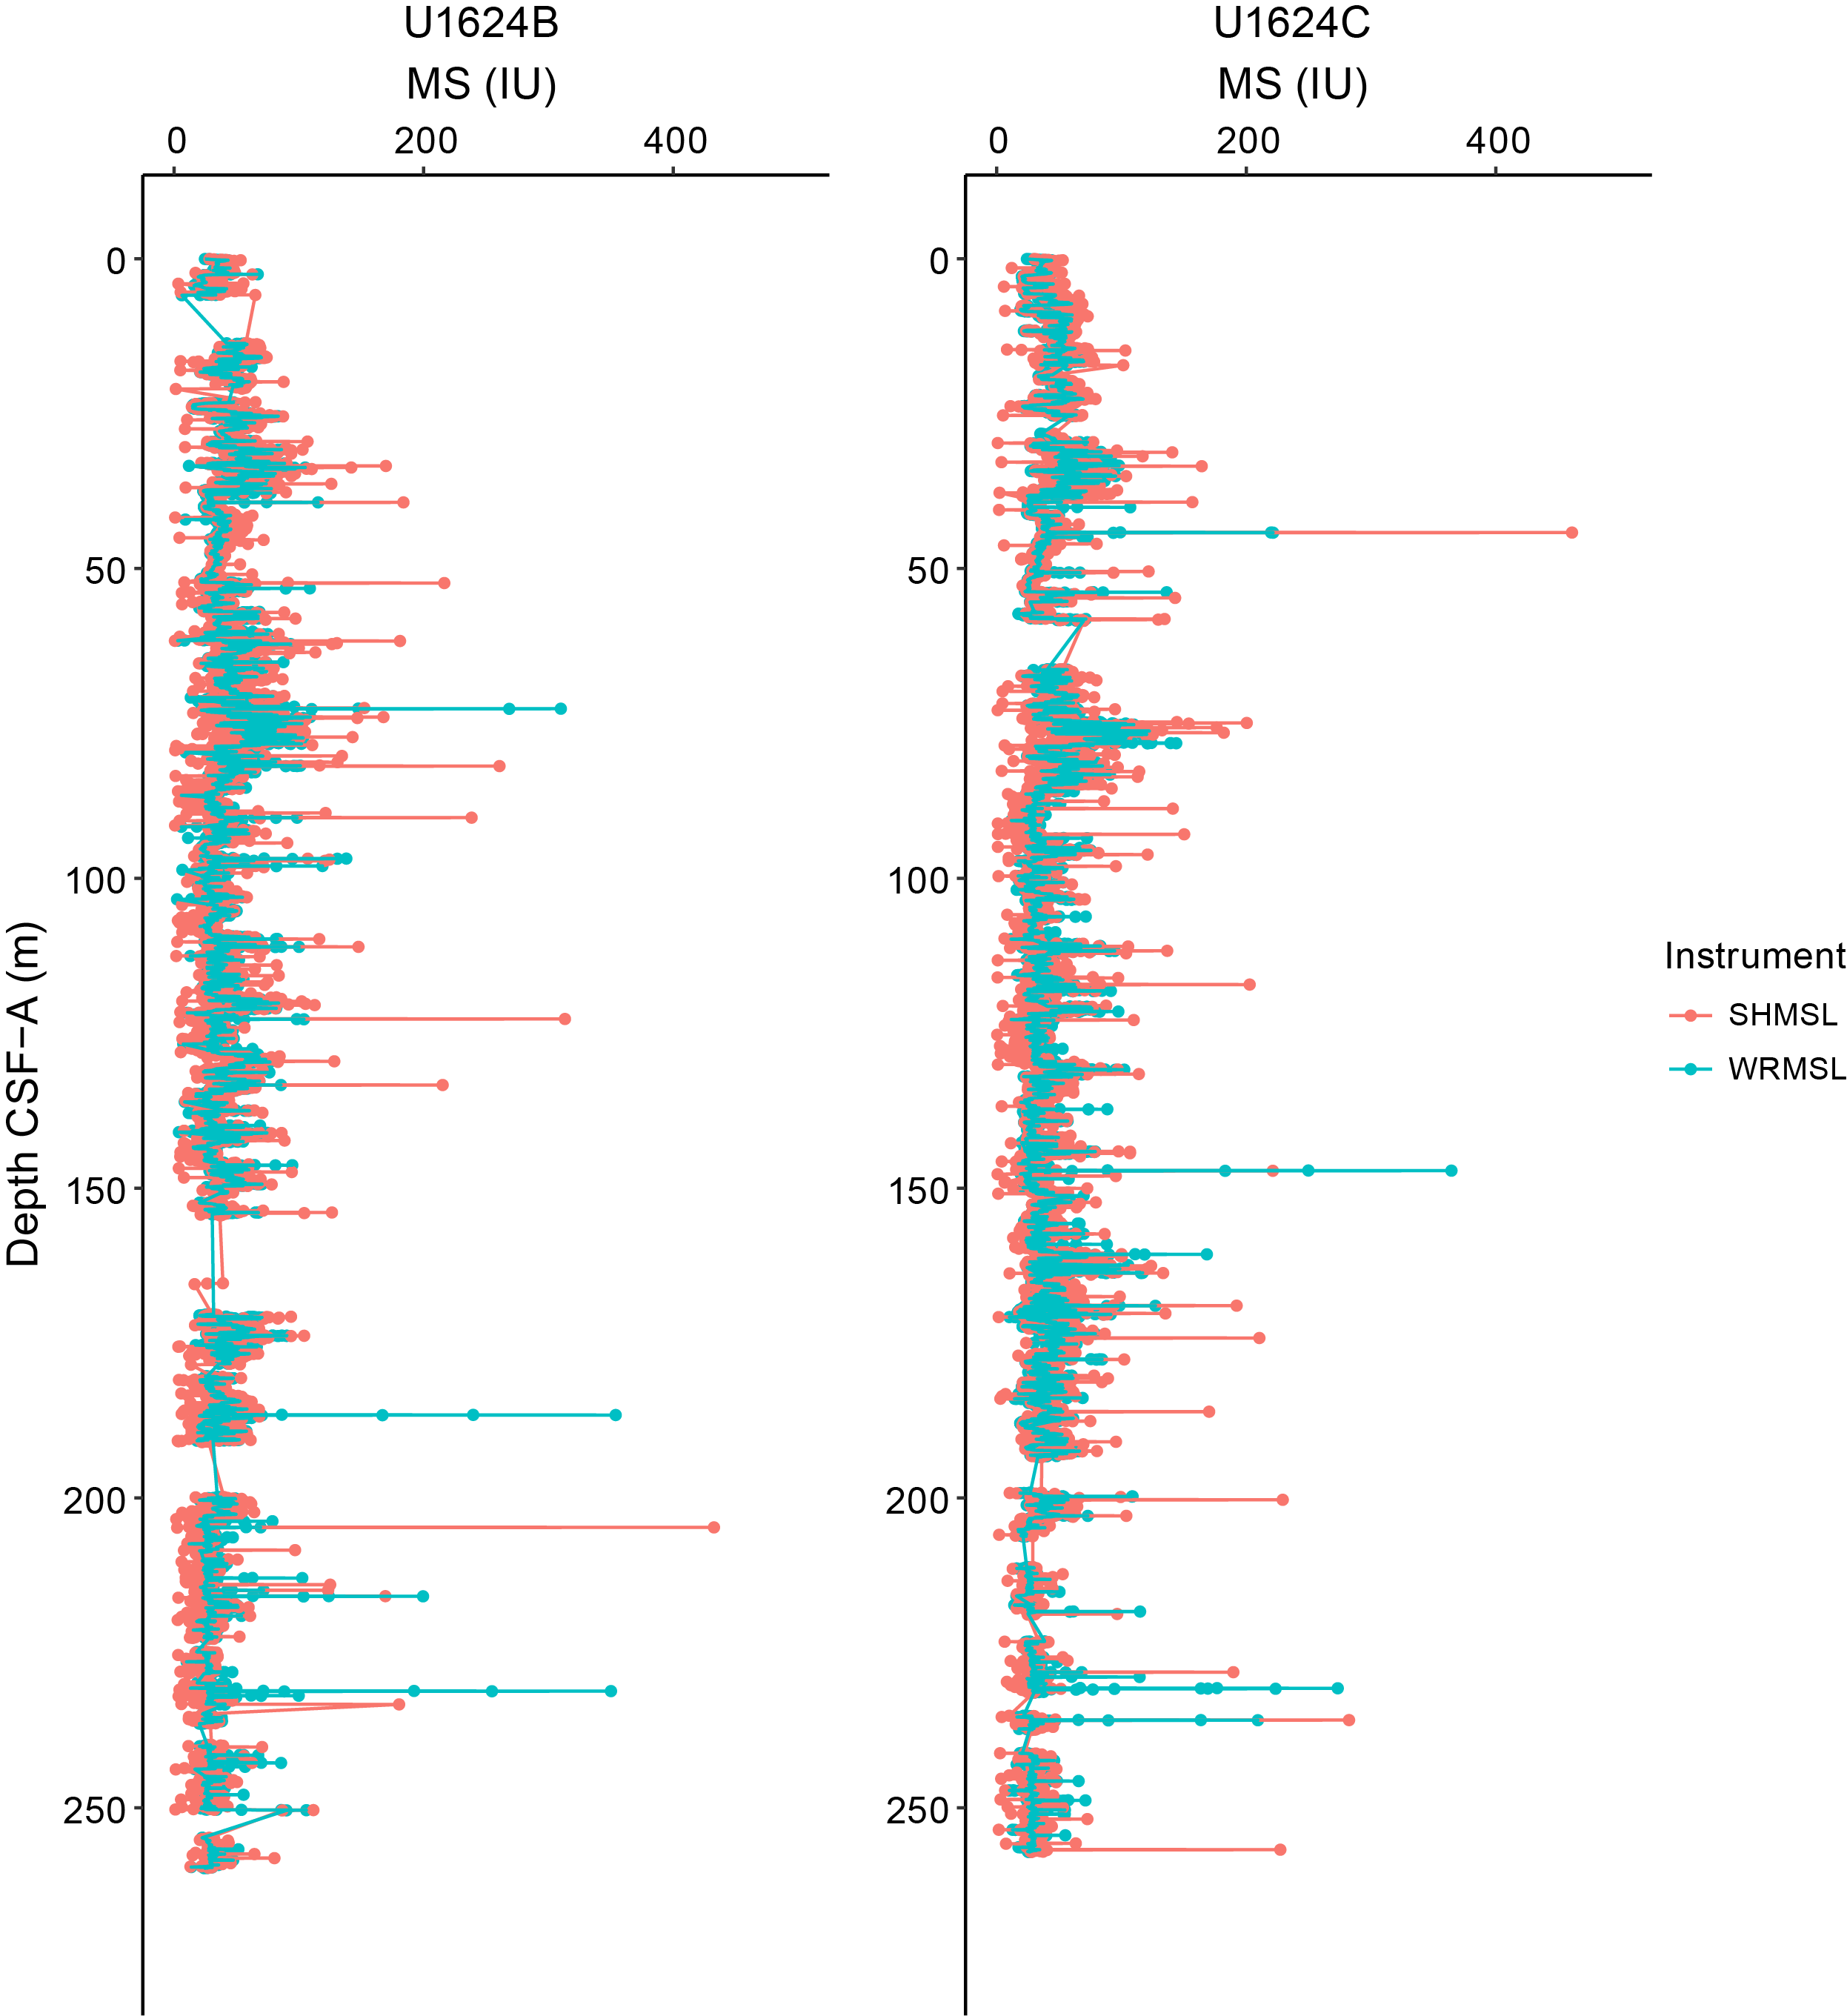
Figure F20. MS.
WRMSL-derived MS values for whole-round sections range 0.1 to ~360 IU (average = ~38 IU), and SHMSL-derived MS values for archive-half sections range 0.68 to ~2000 IU (average = ~39 IU) (see Physical properties in the Expedition 403 methods chapter [Lucchi et al., 2026a] for details on instrument units). High MS values associated with greigite nodules observed in the Fram Strait north of Isfjorden (see Physical properties in the Site U1618 chapter [Lucchi et al., 2026b], Physical properties in the Site U1619 chapter [St. John et al., 2026a], and Physical properties in the Site U1620 chapter [St. John et al., 2026b]) do not appear to drive the MS signal at Site U1624. A relationship between MS and other physical properties is not always apparent. In crossplots, the MS relationship with NGR shows two trends (Figure F21). One is a positive linear correlation, and another is not. Overall, the uppermost ~90 m (Lithostratigraphic Subunit IA; see Lithostratigraphy) of the MS record shows greater amplitude variability compared to the interval of ~90 mbsf to the base. Below ~200 mbsf, MS values are lower with an average of ~30 IU, corresponding to Subunit IIB. Low MS values in association with high GRA bulk density at this depth are consistent with layers of diamicts (see Lithostratigraphy).
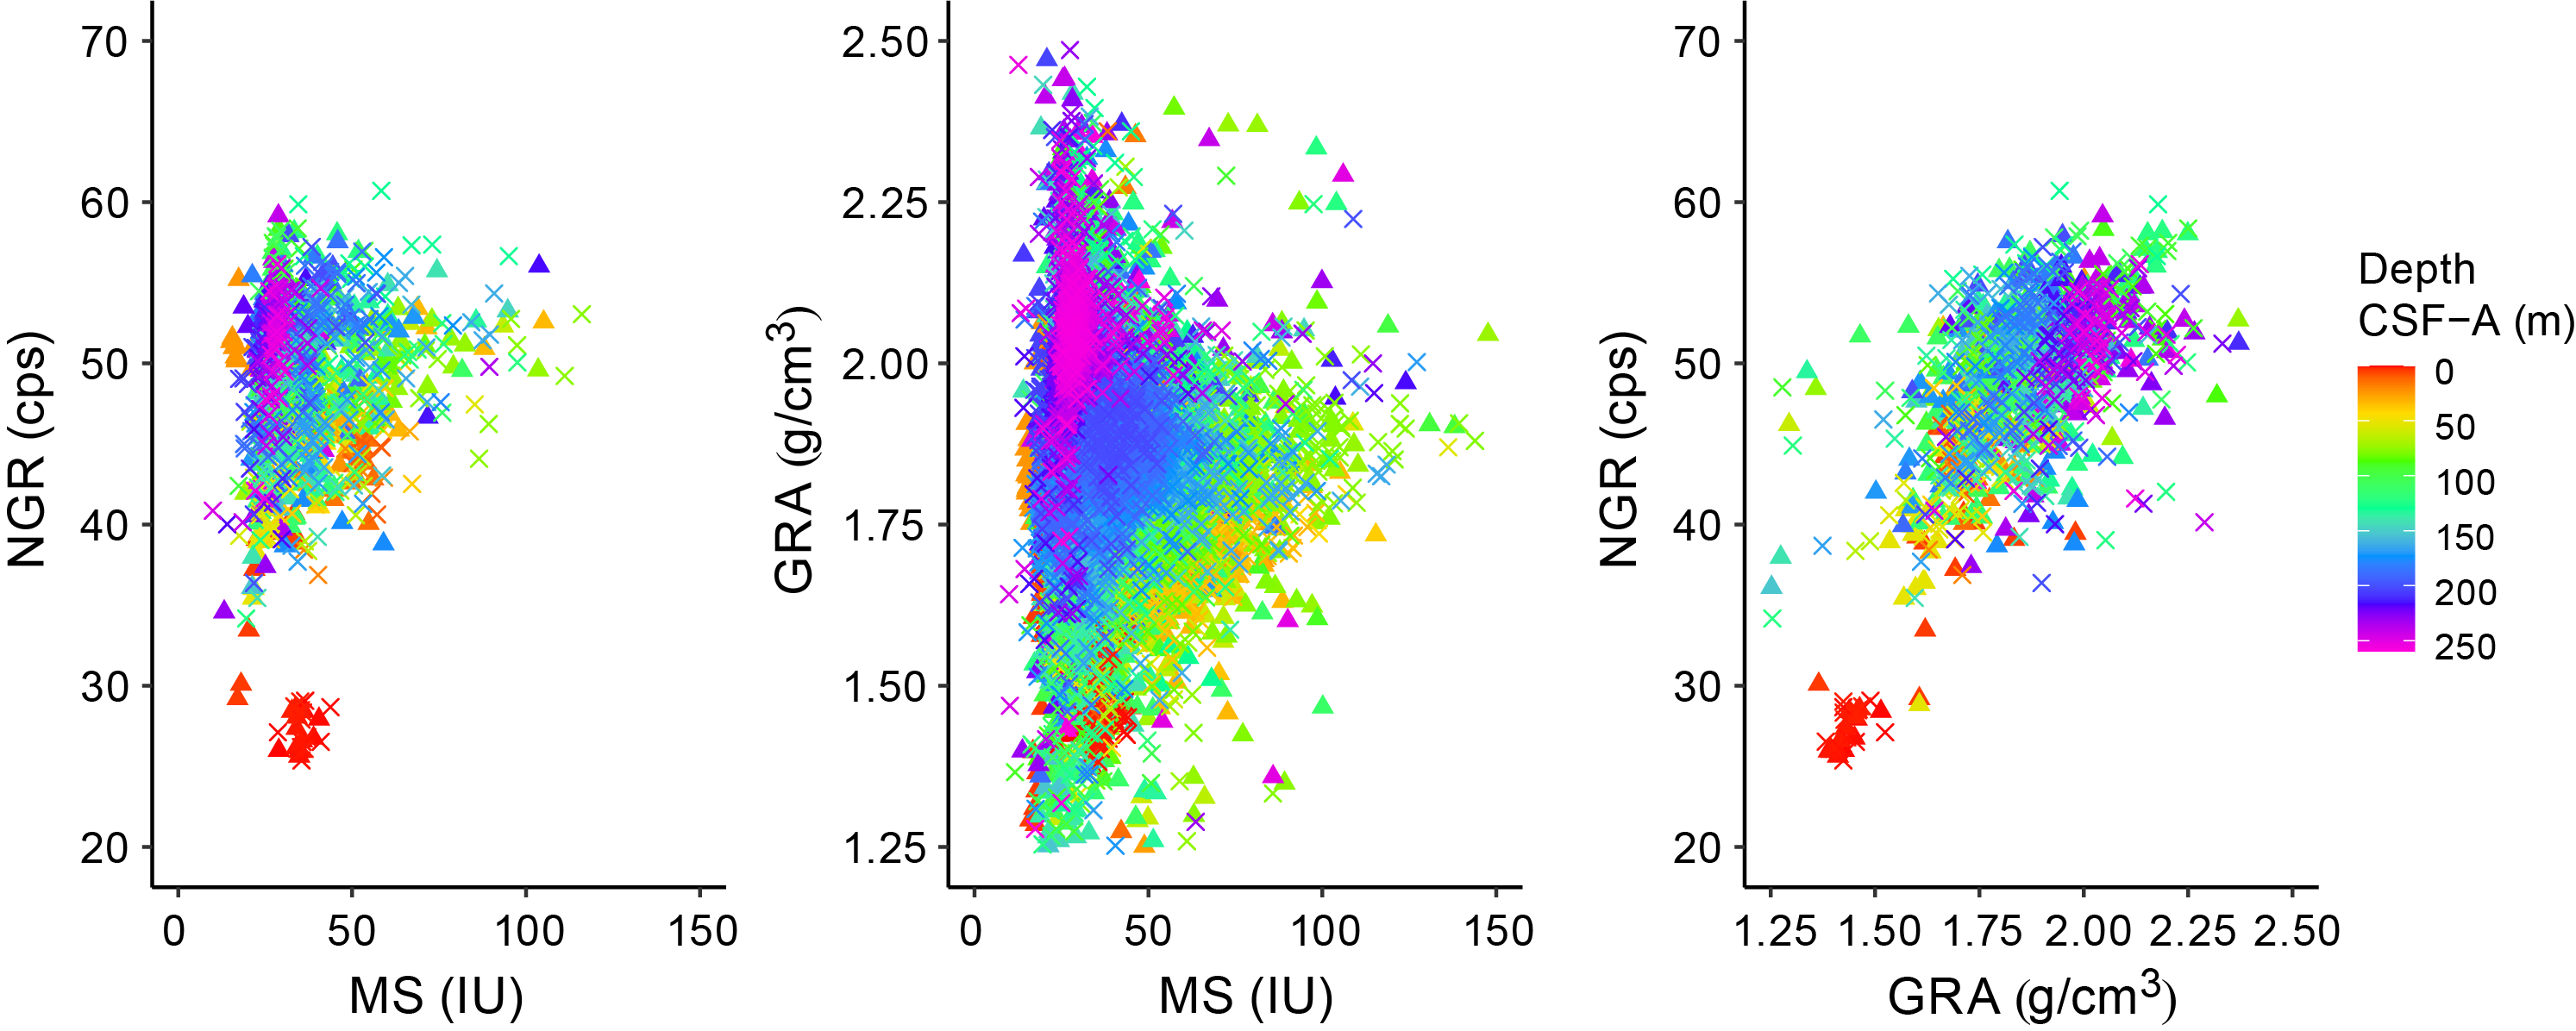
Figure F21. NGR, GRA bulk density, and MS.
6.2. Gamma ray attenuation bulk density
Every whole-round section at Site U1624 was measured at 2.5 cm intervals using the GRA densitometer on the WRMSL. Excluding outliers related to voids or coring disturbances, GRA bulk density values at Site U1624 range ~1.1 to ~2.8 g/cm3 (average = ~1.8 g/cm3). A rapid GRA bulk density increase from ~1.2 to ~1.7 g/cm3 occurs from the seafloor to ~5–7 mbsf, reflecting typical sediment compaction at depth. Downcore, GRA bulk density shows a gradual increase to higher values, reaching ~2.0–2.1 g/cm3 at the base of Site U1624. There is variability of greater amplitude from ~80 to 150 mbsf, roughly corresponding to Lithostratigraphic Subunit IB (see Lithostratigraphy), where GRA bulk density oscillates between ~1.5–1.6 and 2.0 g/cm3. Variability of smaller amplitude is observed above and below this interval. GRA bulk density co-varies with NGR but not always with MS (Figure F21).
6.3. Natural gamma radiation
NGR was measured on all whole-round core sections at 10 cm intervals. Site U1624 NGR values range ~19 to ~87 counts/s (average = ~49 counts/s). There is a rapid increase from ~20 counts/s at the seafloor to ~45–50 counts/s at ~5–7 mbsf, which is likely the result of decreasing water content due to compaction. NGR variability is generally of low amplitude throughout the record, centered around a mode of ~47 counts/s. The interval at ~110–155 mbsf stands out, with two broader lows around ~115 and ~140 mbsf and higher NGR values between. These NGR lows occur in parallel with GRA bulk density lows. Generally, NGR follows GRA bulk density trends downcore, as evident in downcore and crossplot comparisons. Populations that lack obvious correlation in crossplots may be driven by coarse-grained diamictons (high GRA bulk density) with low clay content (low NGR) (Figure F21).
6.4. P-wave velocity
Whole-round sections were measured for compressional P-wave velocity on the WRMSL at a resolution of 2.5 cm for all core sections at Site U1624. There is an initial increase in P-wave velocities from ~1480 m/s at the seafloor to ~1500–1650 m/s below ~5 mbsf. Below ~20 mbsf, the signal becomes dominated by noise with values outside of the typical range expected for marine sediments, with a mode of ~1,000 m/s and reaching outlier values greater than 10,000 m/s. P-wave velocity data below ~20 mbsf should not be used.
Discrete P-wave velocity measurements were made using the SHMG for Sections 403-U1624B-1H-2 and 3H-5. We selected intervals that excluded excessive coring disturbances, voids, cracks, or large clasts (see Physical properties in the Expedition 403 methods chapter [Lucchi et al., 2026a]). Because of noise in the signal, P-wave velocity waveforms were manually selected. For these two cores, P-wave velocity values are ~1480 m/s at 2.62 mbsf and ~1509 m/s at ~20 mbsf. Below ~20 mbsf, P-wave measurements on the SHMG were abandoned due to increasing noise and eventual lack of a detectable signal. We suspect the increasing presence of coarser material (e.g., clasts and sands) and decreasing water content with depth, making sediments more brittle and subject to cracking, contribute to the signal depletion.
6.5. Moisture and density
MAD analyses were conducted using discrete samples from the working section halves of split cores from Hole U1624B (see Physical properties in the Expedition 403 methods chapter [Lucchi et al., 2026a]). Bulk density, porosity, water content, and void ratio were calculated for 46 samples. MAD bulk density gradually increases downcore from ~1.5–1.6 g/cm3 at the sediment surface to ~2.1 g/cm3 at the base of Hole U1624B, corresponding to gradually decreasing porosity (64% to 30%), water content (40% to 14%), and void ratio (1.8 to 0.4) (Figure F22). The average MAD bulk density is 1.9 g/cm3. Water content, void ratio, and porosity co-vary downcore and are anticorrelated with MAD bulk density. At ~215 mbsf, MAD bulk densities shift from ~1.8–1.9 to 2.0–2.1 g/cm3, whereas water content, void ratio, and porosity exhibit a change to lower values. This transition is also reflected in GRA bulk density (Figure F23). GRA and MAD bulk density trends are similar, although below ~75 mbsf bulk density from MAD analyses is higher than from GRA measurements. Lower volume of sediment in XCB core liners may have contributed to depressed GRA bulk density values.
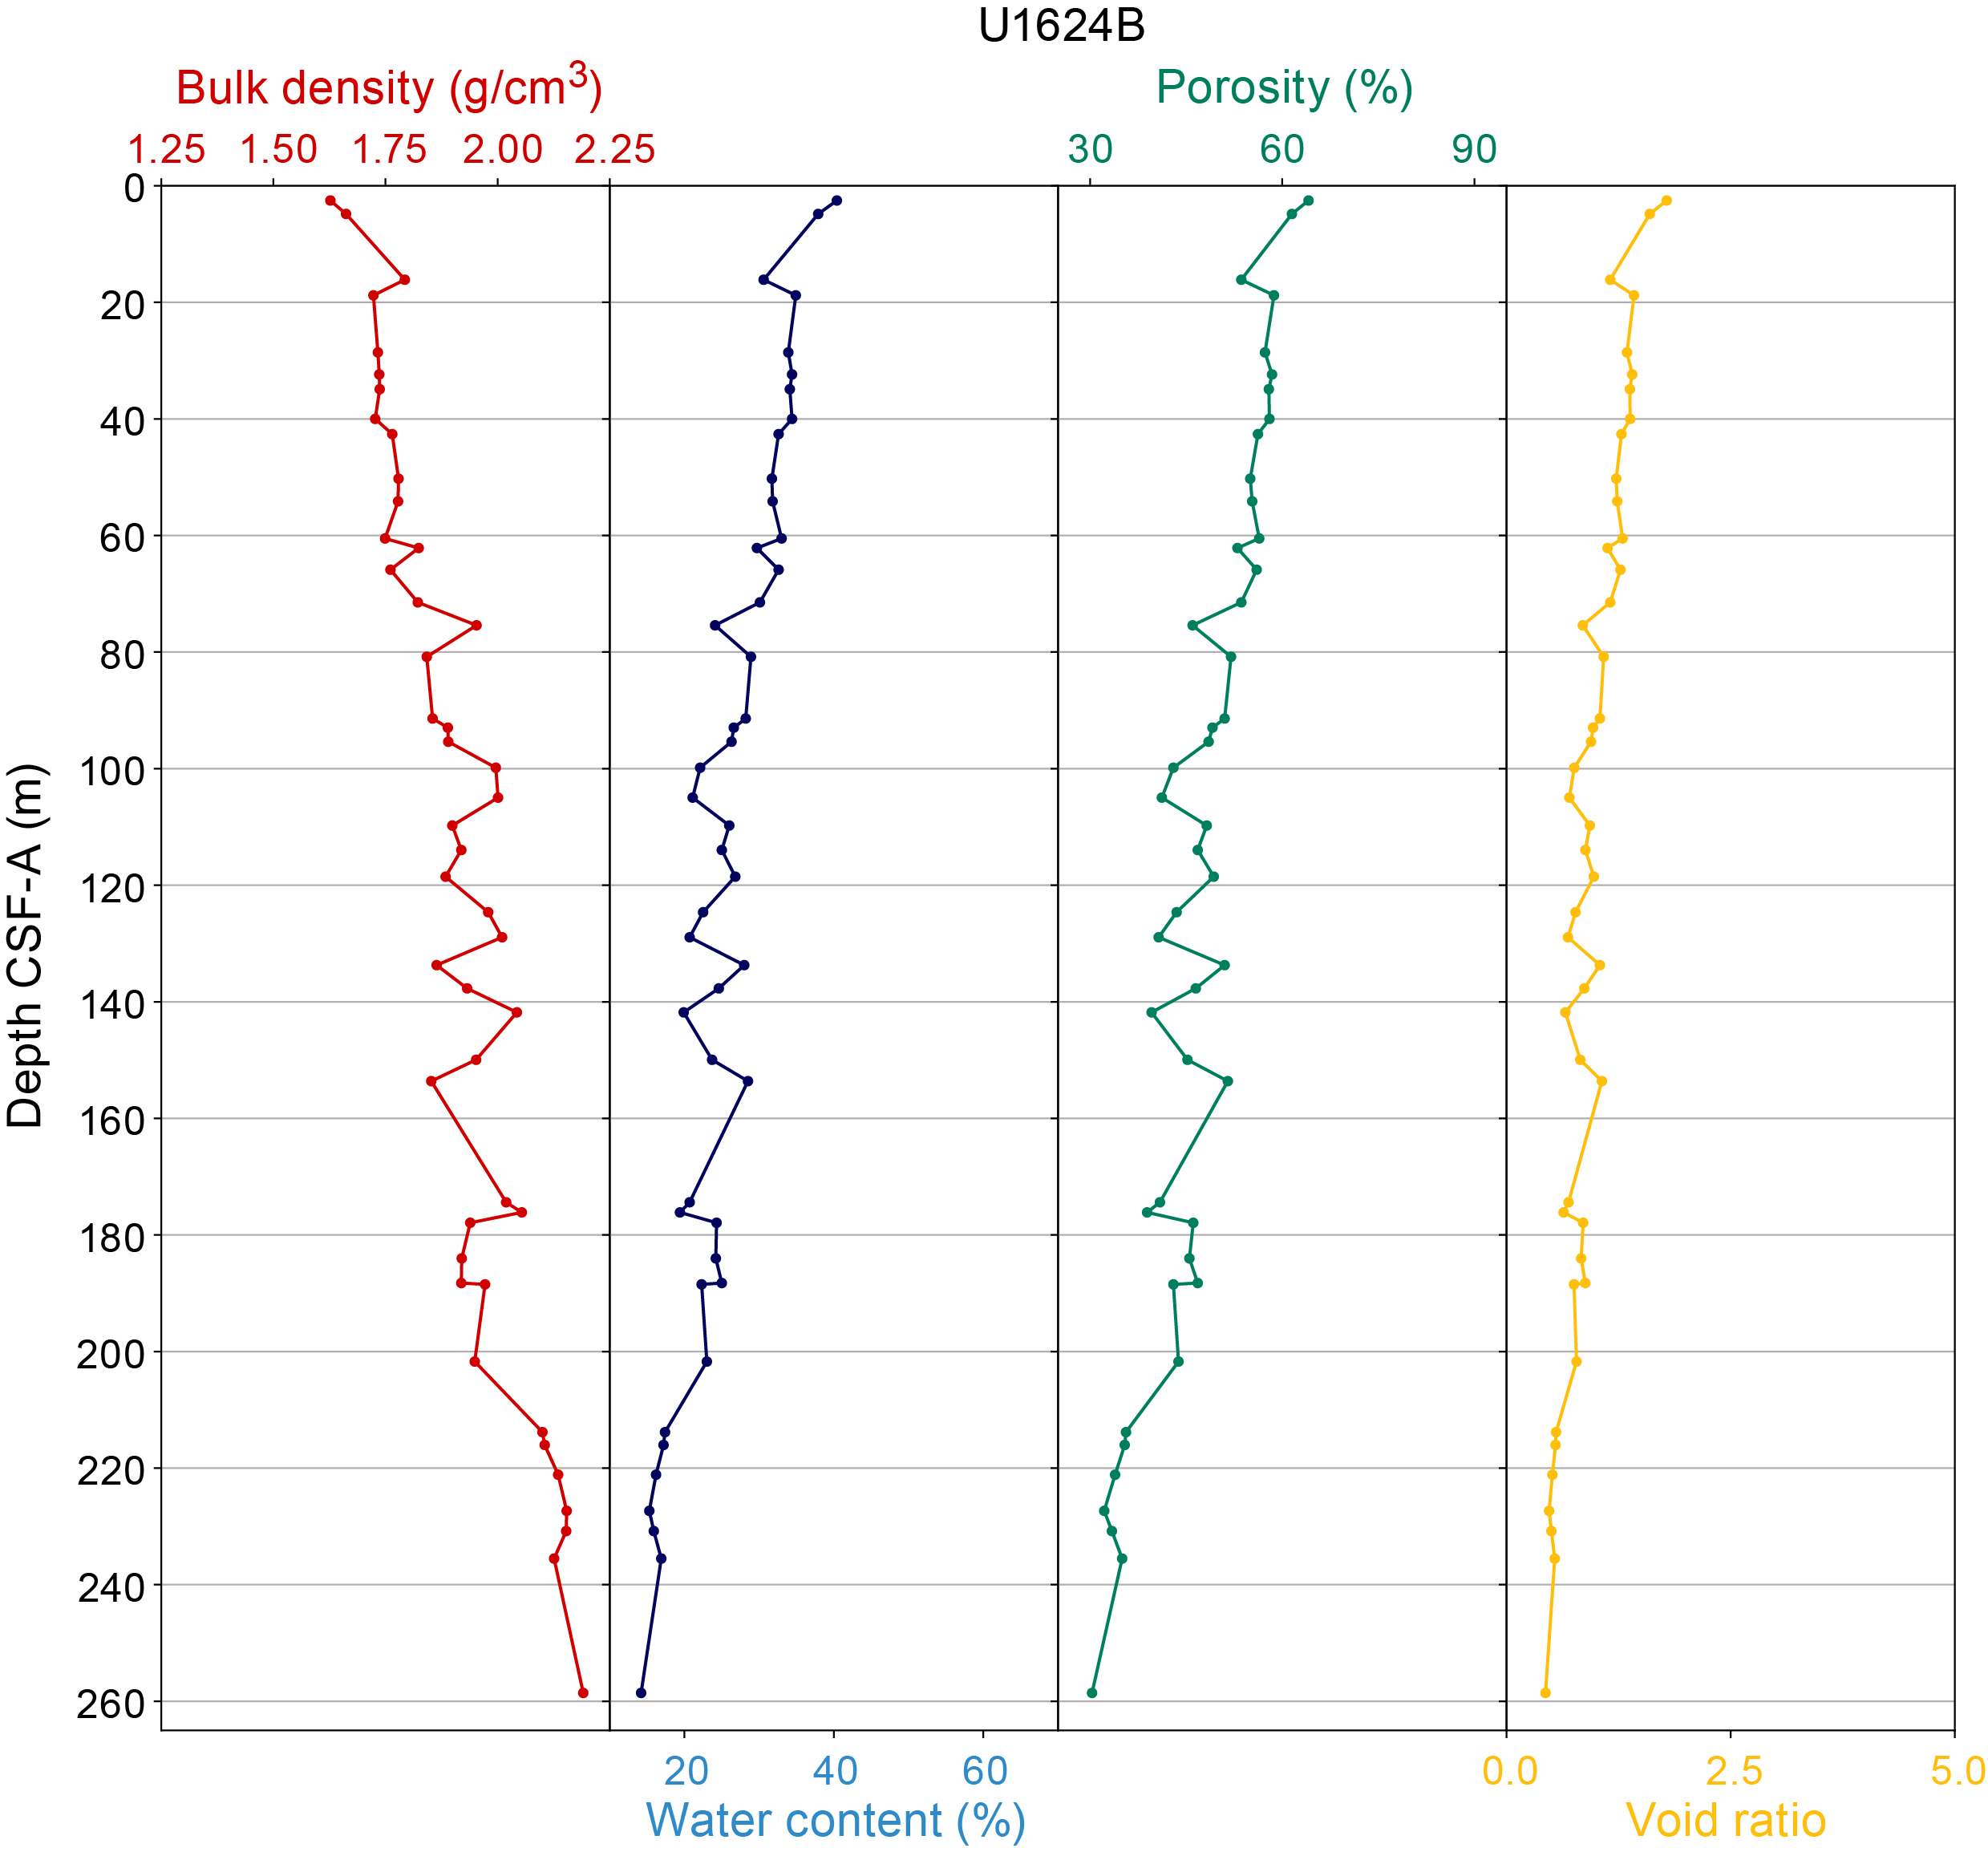
Figure F22. MAD parameters.
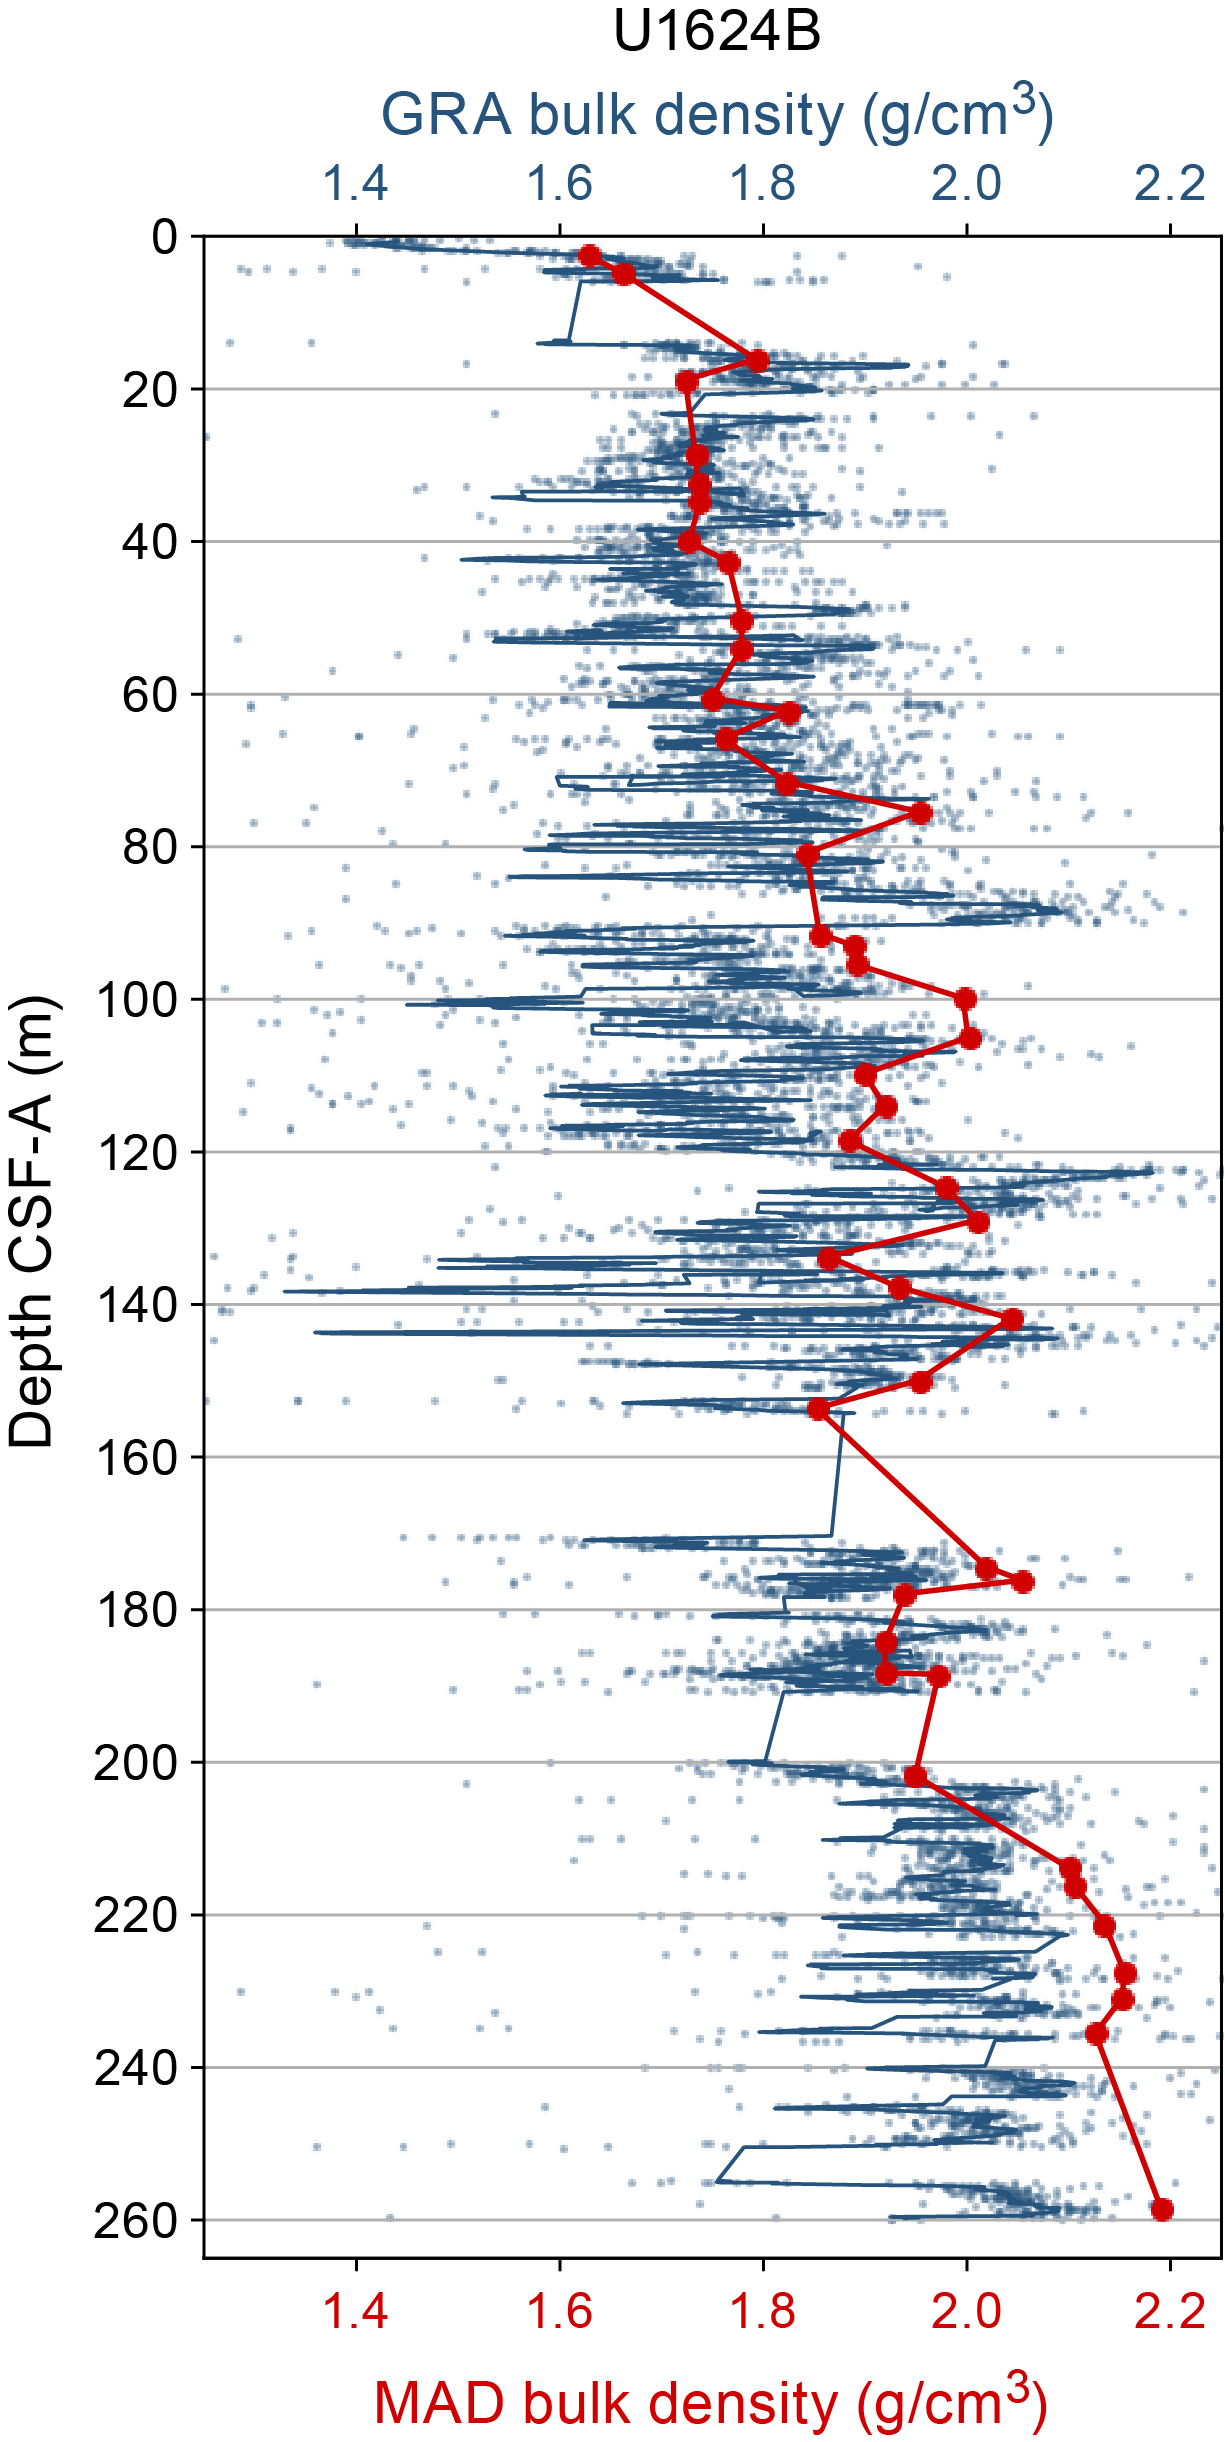
Figure F23. GRA bulk density and MAD.
6.6. Thermal conductivity
To calculate heat flow and interpolate temperature data, thermal conductivity measurements were made using the TK04 system for Hole U1624B. For one working section half every 10 mbsf, a puck contact probe was placed on the split face of working section halves. Homogeneous intervals lacking large clasts, voids, cracks, and sediment disturbances were targeted (see Physical properties in the Expedition 403 methods chapter [Lucchi et al., 2026a]). Three measurements were made on the same interval. Results are shown for Cores 1H–34X (Figure F24). Thermal conductivity values range ~1.06 to ~1.58 W/(m·K) and generally increase with depth. A few oscillations between low and high values are observed (e.g., from ~1.1 W/[m·K] at ~60 mbsf to ~1.5 W/[m·K] at ~115 mbsf), potentially capturing intervals with compositional differences that will be explored postcruise. Cores below ~200 mbsf were clast-rich, and a flat, even surface in an undisturbed interval was difficult to identify. Measurements were abandoned for cores below ~200 mbsf. Downhole logging was not conducted at Site U1624, and thus data are not available for comparison (see Operations).
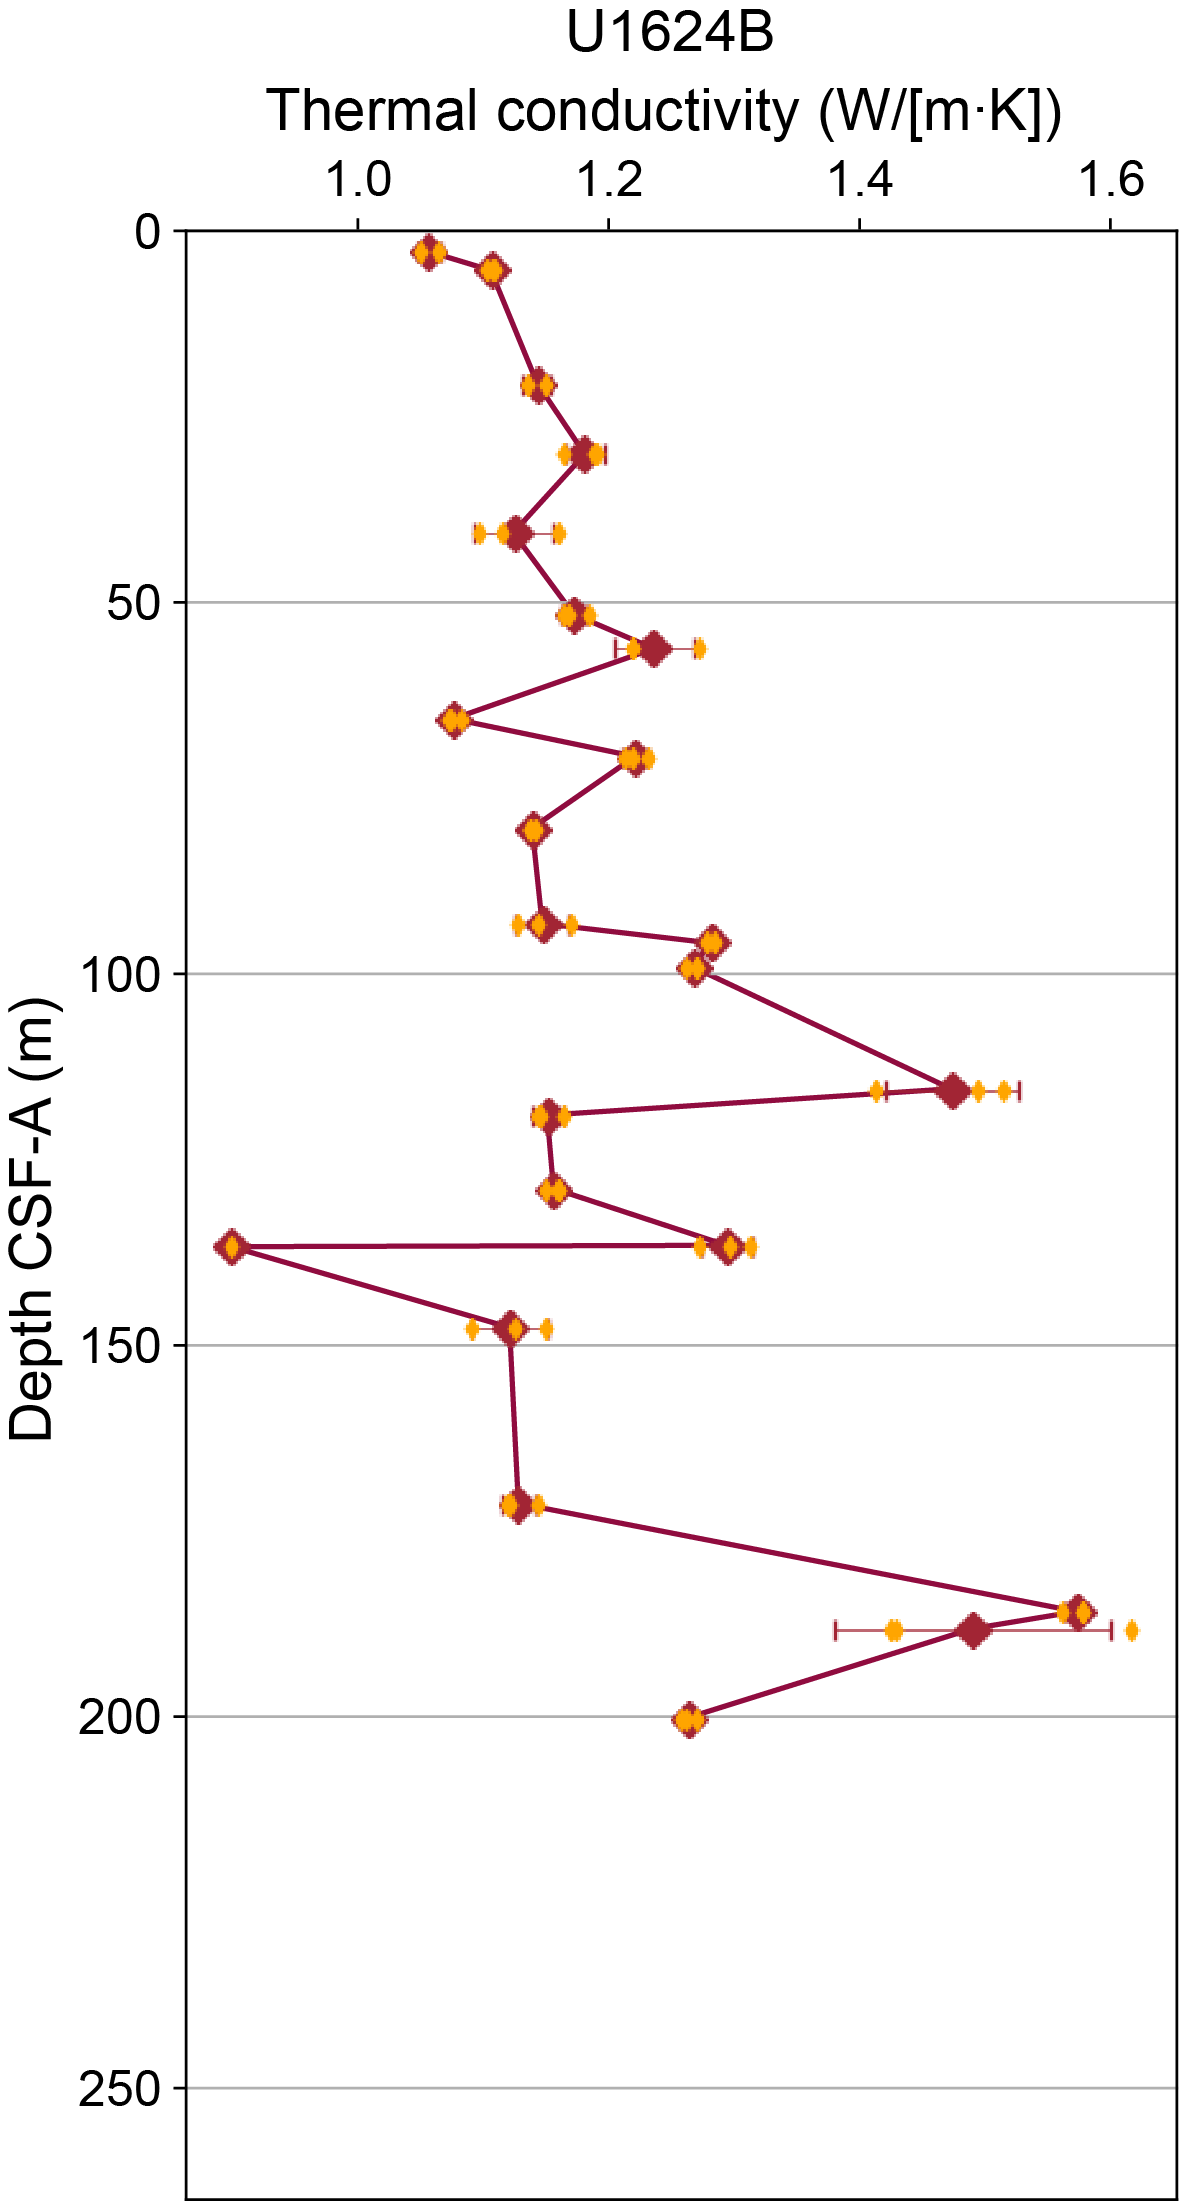
Figure F24. Thermal conductivity.
6.7. Summary
There is generally good correspondence between data collected at high resolution on the MS loop sensor and data collected at low resolution on the MSP sensor, with the MSP measurements picking up additional peaks in MS that were missed during the averaging in WRMSL measurements. Though some intervals of GRA bulk density are slightly lower than MAD sample density, there is good correspondence between data from high- and low-resolution measurements. Because of the issues discussed above, P-wave velocity data are not considered reliable, and there is no detectable signal in either discrete or logger data below ~20 mbsf. Thermal conductivity generally increases with depth and displays oscillations that may be related to compositional differences.
Physical property (MS, NGR, and GRA bulk density) relationships with lithostratigraphic units are synthesized in violin plots (Figure F25). Subunit IA is characterized by higher MS and lower NGR and GRA bulk density, with two modes in NGR indicating oscillations between different NGR amplitudes. Subunit IB is characterized by a dip in average MS values, two modes in NGR, and greater amplitude variability in GRA bulk density. Subunit IIA has greater MS and GRA bulk density variability with higher modes than Subunit IB. Subunit IIB has the highest GRA and NGR bulk density with the lowest MS. Overall, Hole U1624C average MS values have progressively lower magnitudes with depth, in contrast to Expedition 403 northern sites (see Physical properties in the Site U1618 chapter [Lucchi et al., 2026b], Physical properties in the Site U1619 chapter [St. John et al., 2026a], and Physical properties in the Site U1620 chapter [St. John et al., 2026b]). MS at Site U1624 is less influenced by secondary alteration, and there are more apparent relationships between MS and other physical properties (e.g., NGR). Two trends are present in the crossplots: (1) MS co-varies with NGR and GRA bulk density and (2) a low MS component is associated with high NGR and GRA bulk density. The presence of several trends may be related to different modes of deposition due to changes in ocean–ice sheet interactions. The first trend may represent glacial–interglacial variability in clay-rich sediments mostly delivered by bottom currents. The second trend may indicate an influx of Svalbard-sourced glacial debris consistent with recurring diamicton in Subunit IIB (see Lithostratigraphy).
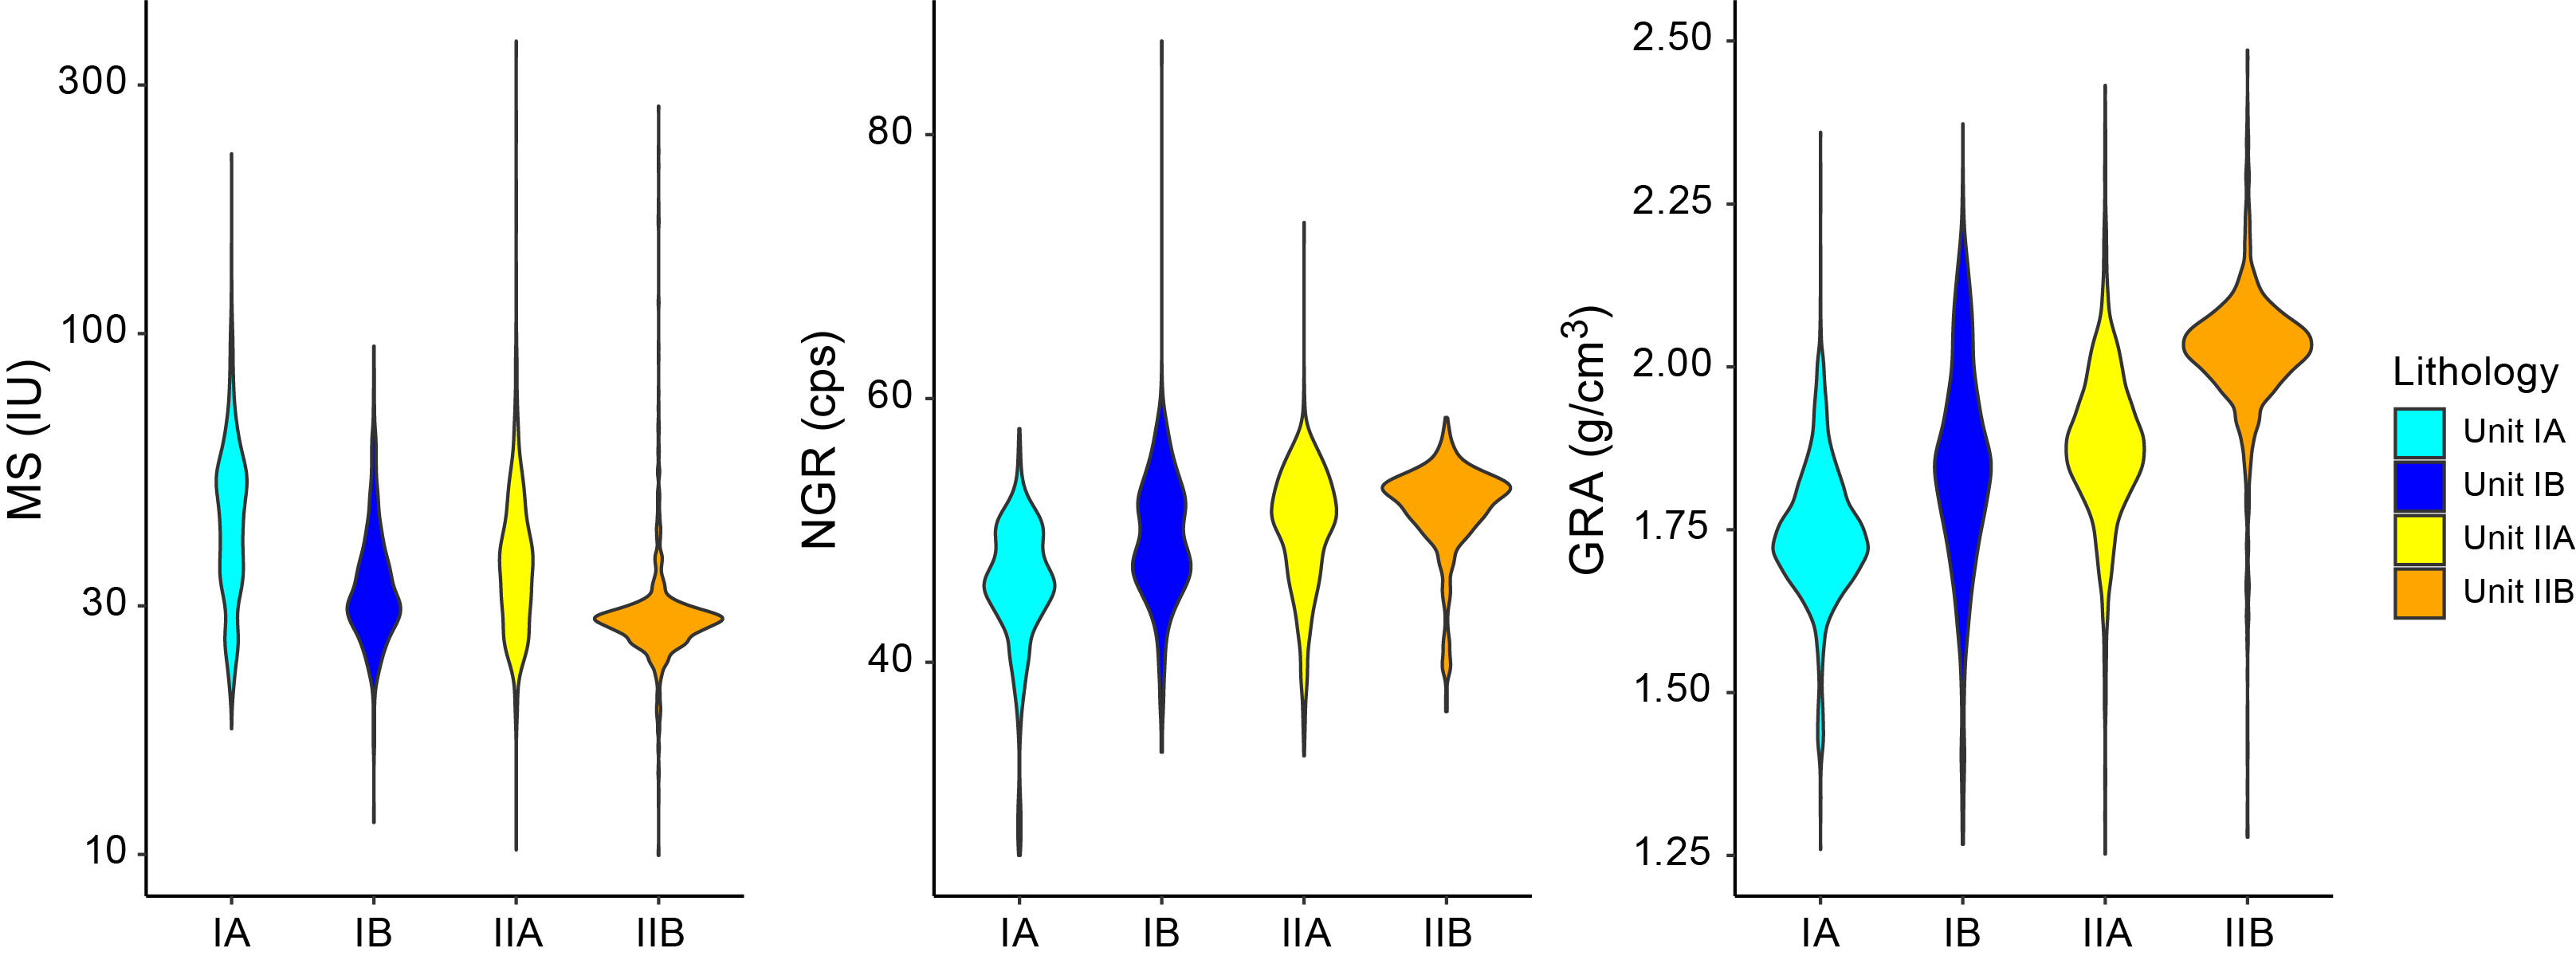
Figure F25. Physical property associations with lithostratigraphic units/subunits.
Overall, physical properties at Site U1624 appear to be influenced by oceanographic changes and glaciogenic deposition of dense, coarse, clast-rich deposits. Further studies are necessary to interpret the relationship between physical properties measured on board and depositional lithofacies associated with changing climate states.
7. Stratigraphic correlation
Correlations between holes at Site U1624 were accomplished using the Correlator software (version 4.5.4). For the splice, tie points were established based on STMSL MS measurements. Below ~150 mbsf, expansion of the sediments resulted in relatively high and variable growth factors with multiple gaps, which likely affected the physical properties (e.g., density) and led to some stratigraphic inconsistencies among holes.
We constructed a single spliced interval from 0 to 270.167 m core composite depth below seafloor (CCSF) (top of Core 403-U1624B-45X) based on correlations between the two holes (U1624B and U1624C). The splice is generally secured down to ~210 m CCSF. However, below that depth, there are a few relatively large gaps due to poor core recovery in both holes (Figure F26; Table T4). These gaps generally occur at horizons identified by distinct reflectors with abundant coarse material and dropstones (see Lithostratigraphy). Wherever gaps occur, we appended the cores according to their growth factor of ~1.065 and the recovery of the previous cores (Table T5). Although we relied on MS data in building this splice, we note that the NGR data are less noisy than other data sets and may be more useful in comparison with climate records (Figure F27).
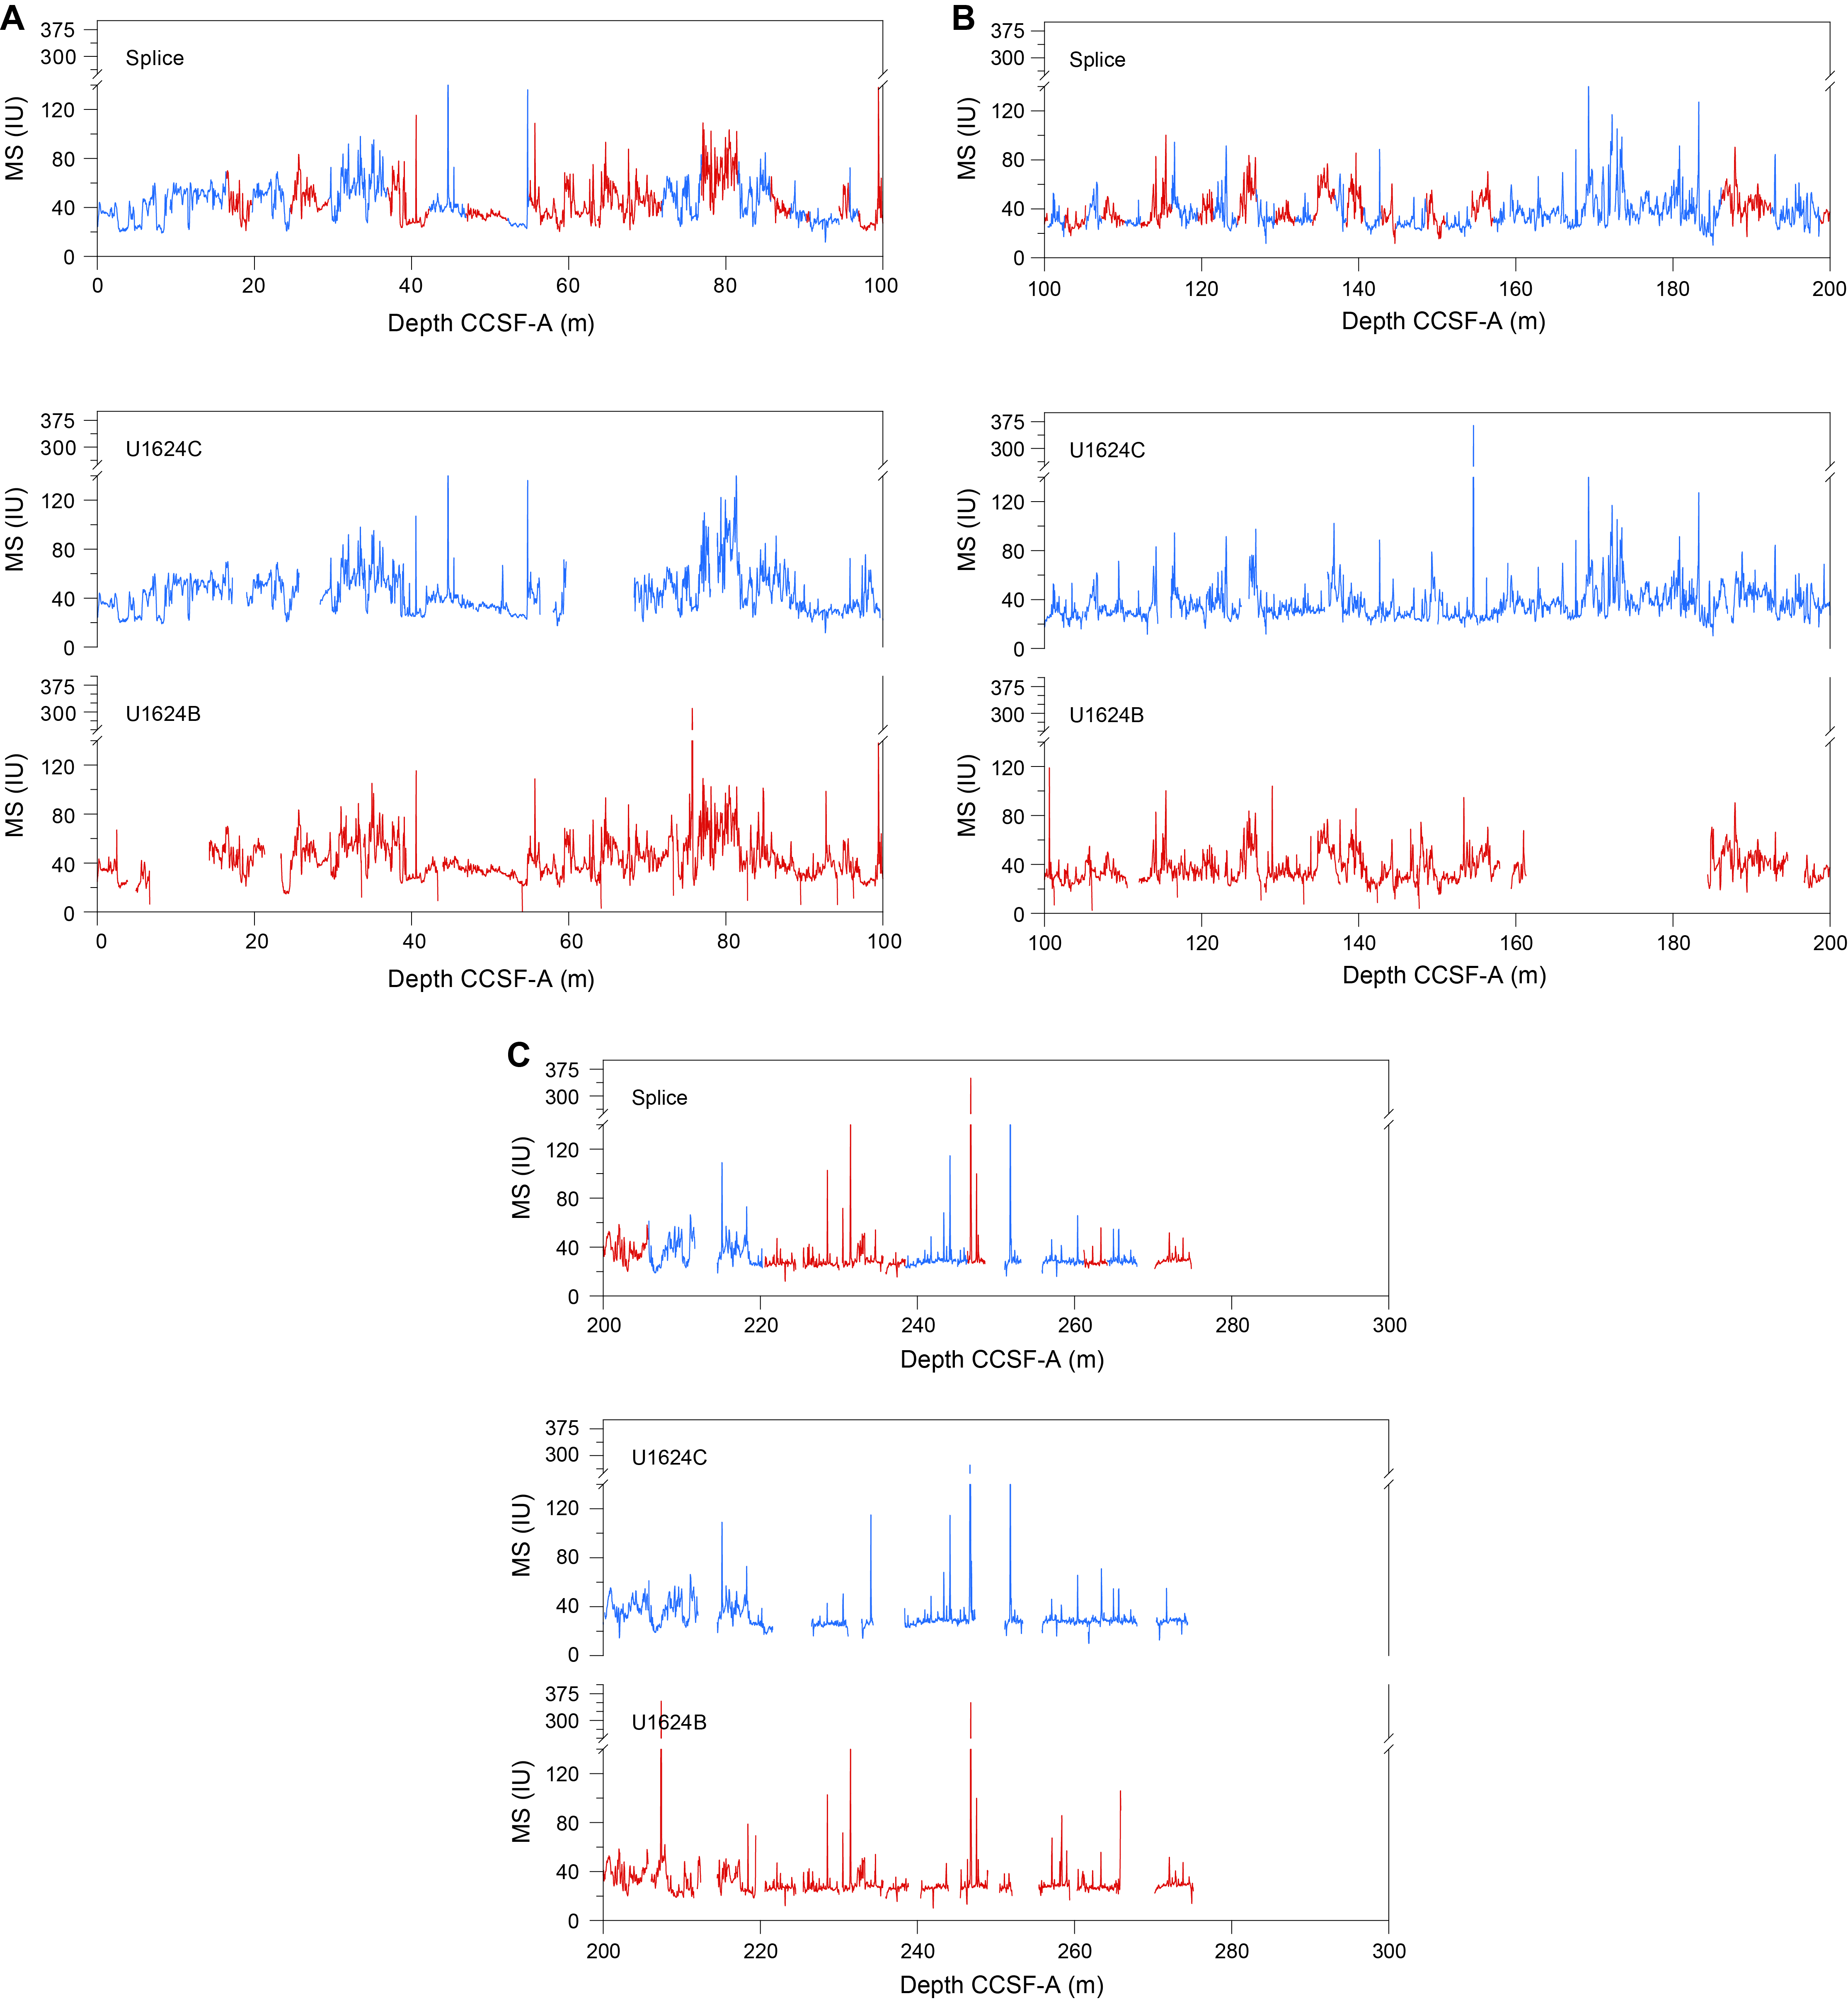
Figure F26. MS data.
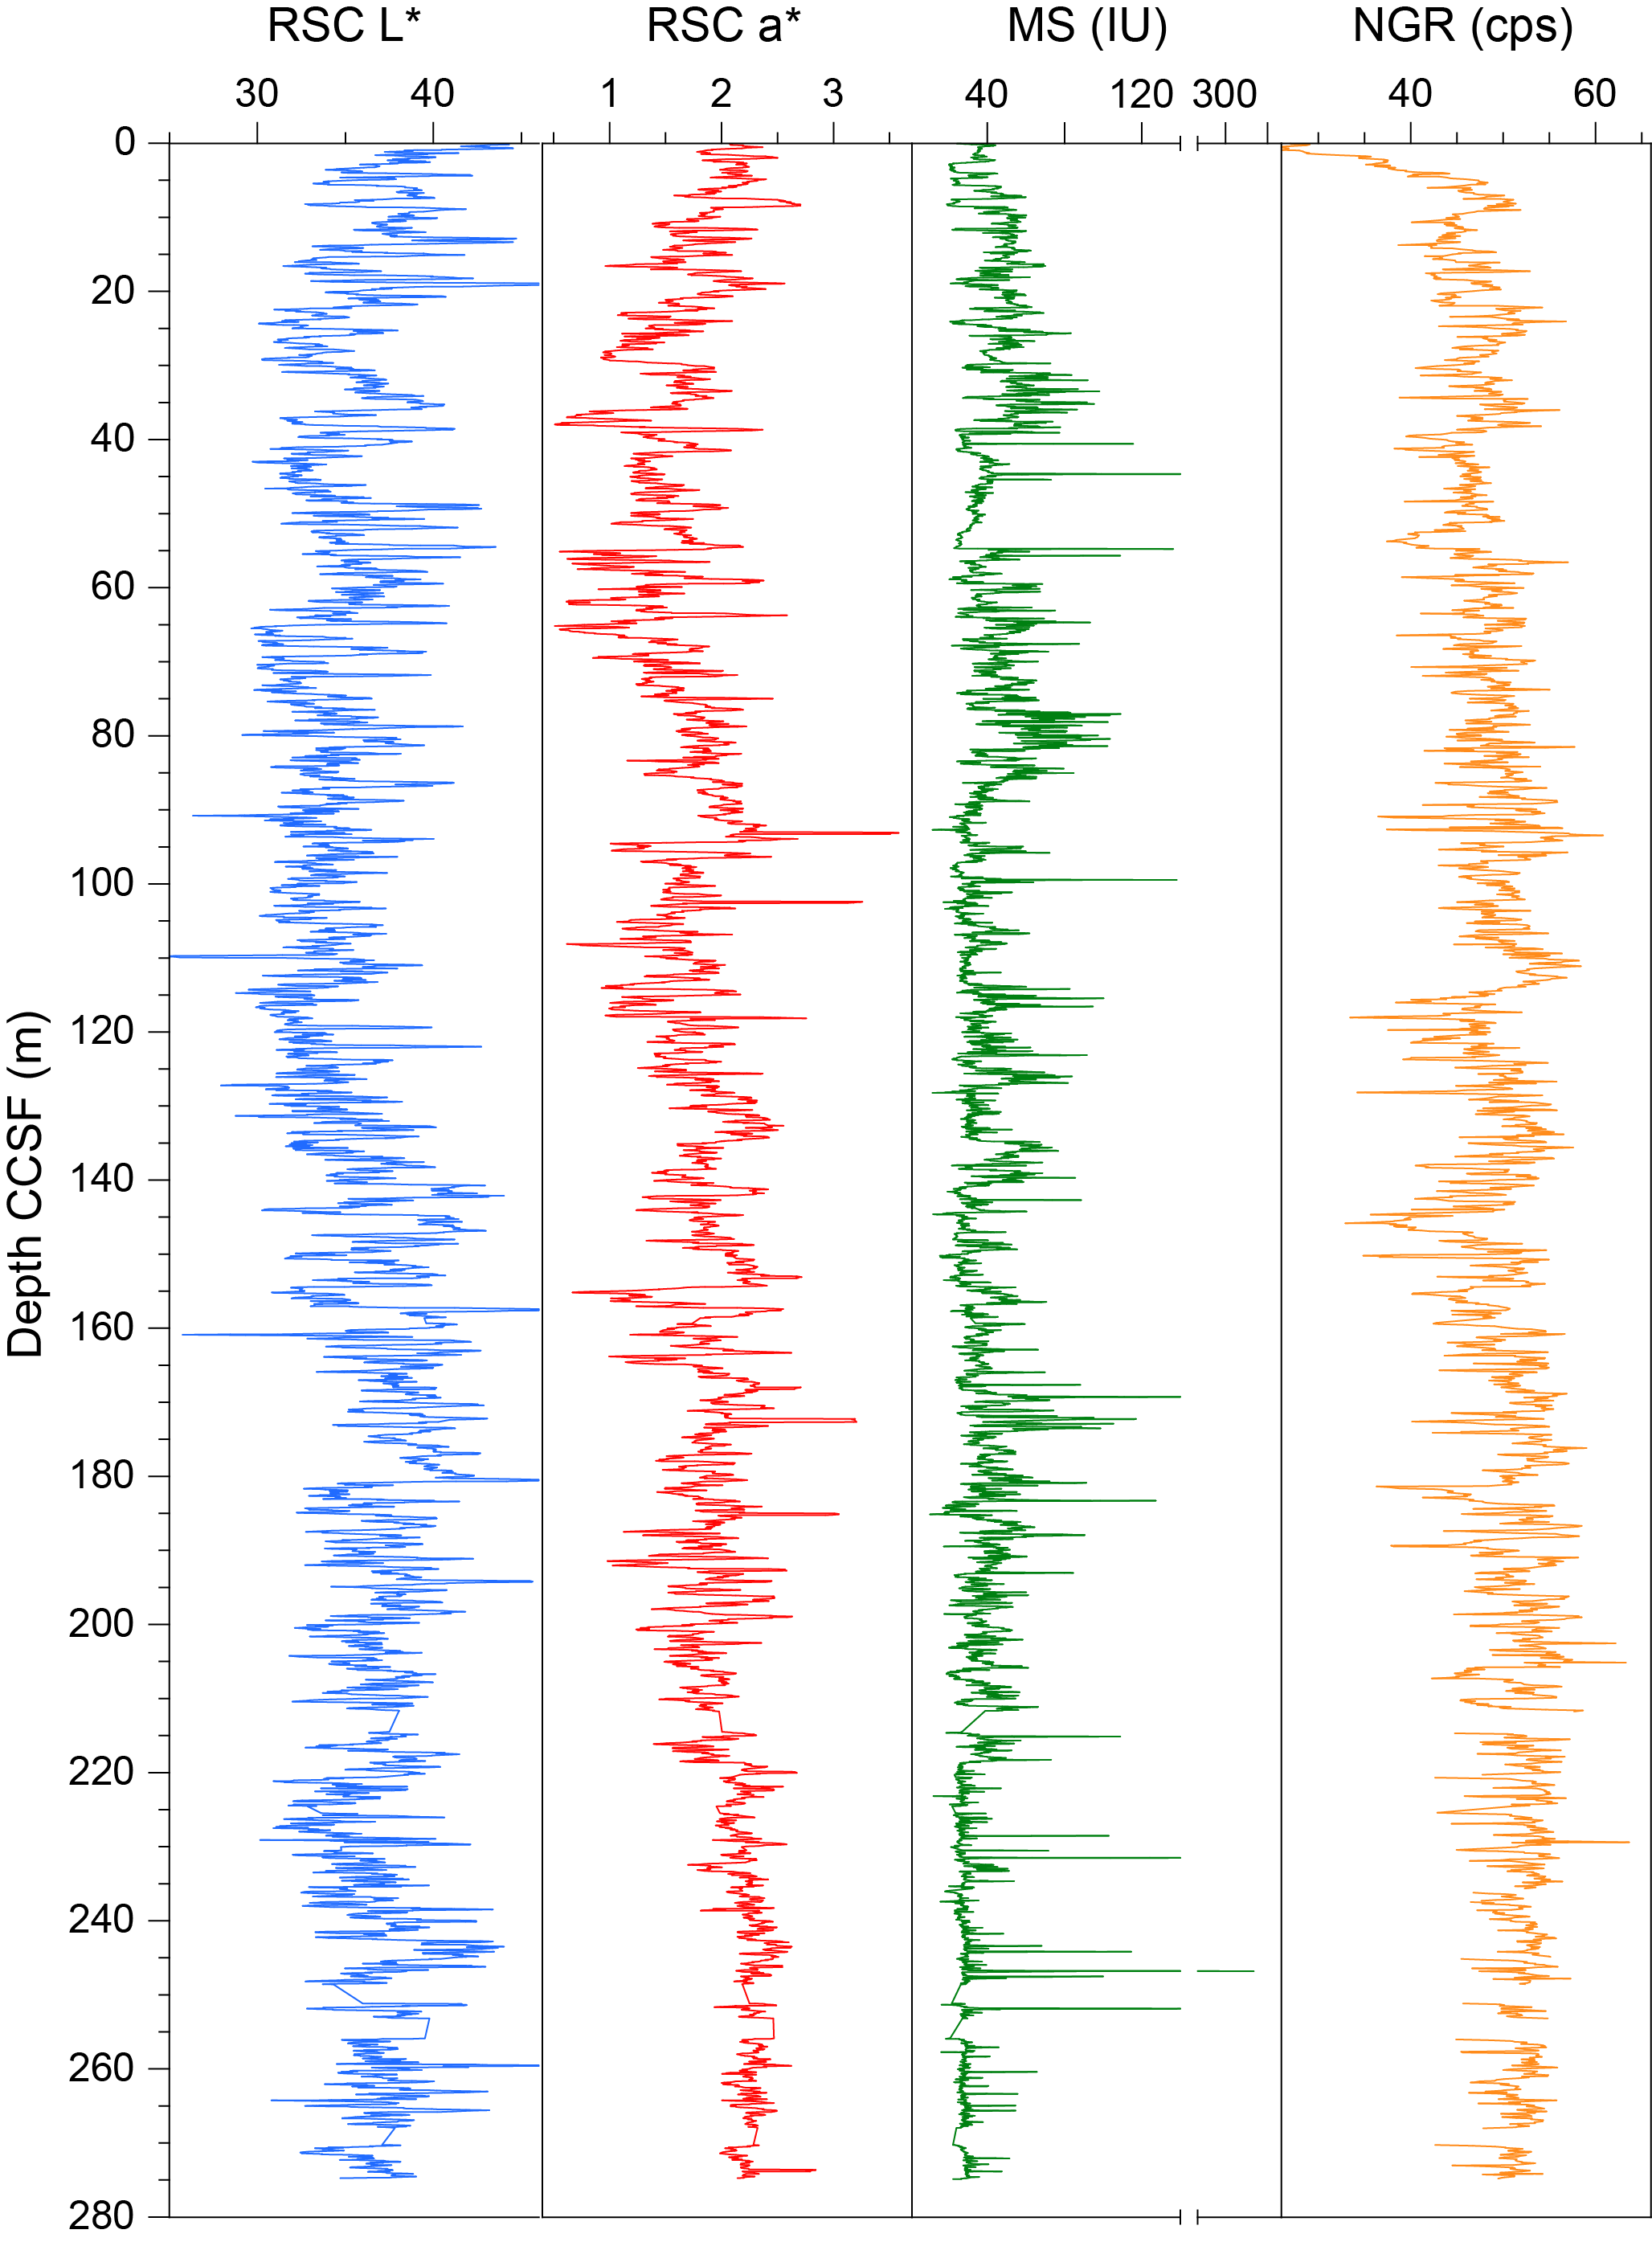
Figure F27. Reflectance spectroscopy and colorimetry L* and a*, MS, and NGR.
The CCSF scale is anchored to the mudline of Core 403-U1624C-1H, which is assigned the depth of 0 m CCSF. From this anchor, we worked downhole using Correlator to establish a composite stratigraphy on a core-by-core basis. The match between holes is relatively well constrained within the spliced intervals, although there are gaps throughout the splice. Between 0 and ~200 CCSF, the splice is secured, except to a few tentative tie points (Figure F26).
We approached the construction of the splice by mainly using the best recovered stratigraphy of Hole U1624C as the backbone, where possible, and using Hole U1624B to fill the core gaps down to 198.756 m CCSF. In this interval, we have one gap between Cores 403-U1624B-7H and 8H. Below that depth, the gaps in the two holes are aligned and we were unable to correct this due to coring disturbances, so the cores were appended based on a growth factor of 1.065 (Table T4).
The offset between core depth below seafloor (CSF) and CCSF is nearly linear (Figure F28A). However, a close inspection of the cumulative offset as a function of depth (mbsf) (Figure F28B) shows that the offset varies with depth, with relatively low growth rate in the upper section (0 to ~150 mbsf) because of low expansion. The growth factor increases substantially between 150 mbsf and below ~190 mbsf due to strong gas expansion in both holes. Below ~200 mbsf, we appended subsequent cores by their expansion assuming minimal coring gaps (CSF) between cores, except for several cores with <100% recovery.
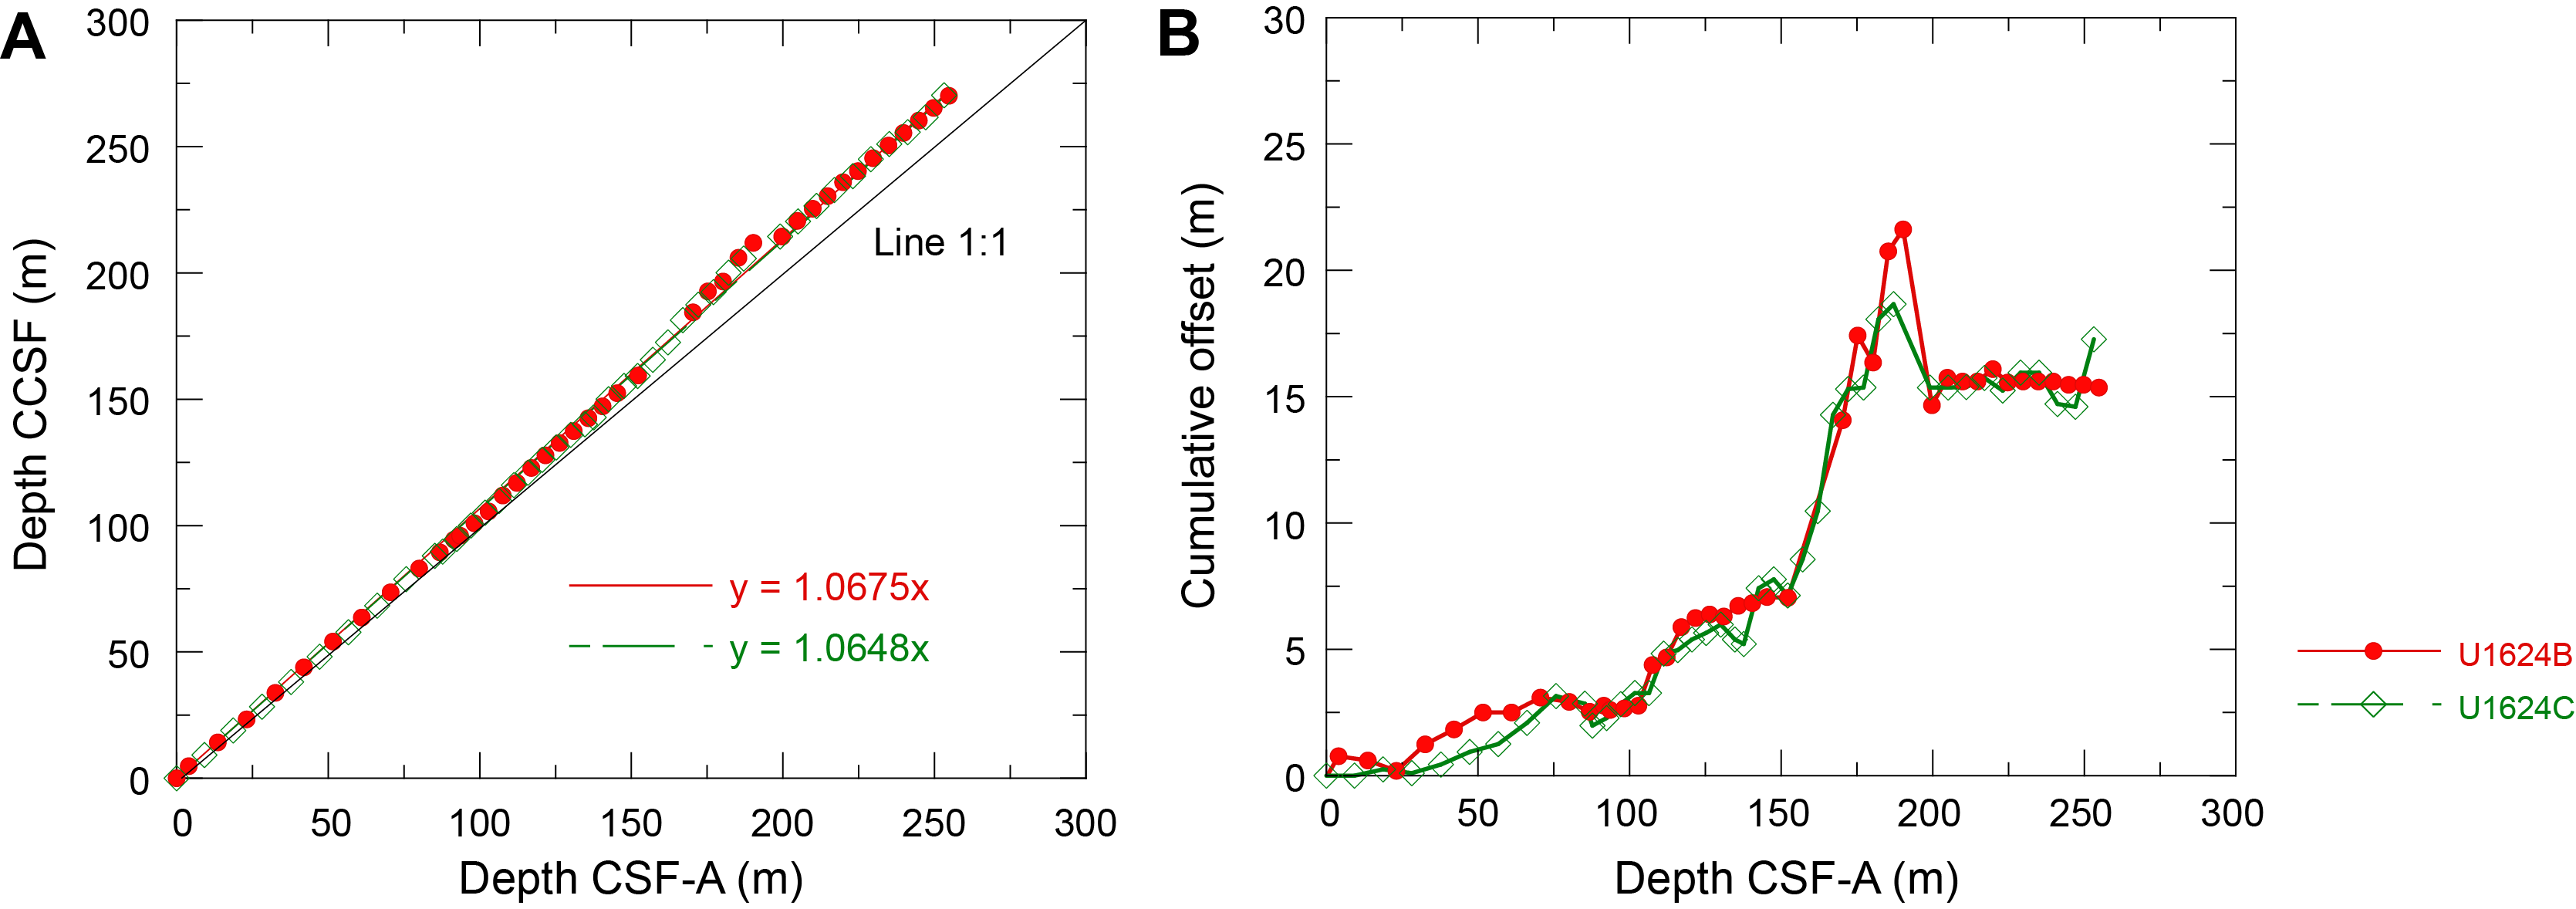
Figure F28. Depth scale offset.
In summary, we are confident about the splice for the interval from 0 to 198.756 m CCSF. We note that calculation of mass accumulation rates based on the CCSF scale should account for the expansion by dividing apparent depth intervals by the appropriate growth factor.
8. Geochemistry
Samples for interstitial water (IW) chemistry, bulk sediment geochemistry, and headspace gas were analyzed at Site U1624. The main findings from IW analysis show diagenetic reactions resulting in the consumption and release of major and trace elements, in addition to the cycling of analytes related to authigenic mineral formation and dissolution. The bulk sediment geochemistry showed variation within lithostratigraphic units, and the total organic carbon (TOC)/total nitrogen (TN) (C/N) ratio suggests there is a mix of marine and terrestrial input of organic matter. Headspace geochemistry was determined to be within safe operational limits, and heavier hydrocarbons tend to increase within Lithostratigraphic Unit II. The IW geochemistry is reflective of diagenetic alterations within the sediment column, and the bulk sediment geochemistry is reflective of changes in source material, likely related to the dynamics of the paleo-SBSIS.
8.1. Interstitial water chemistry
A total of 24 IW samples were squeezed from 5 or 10 cm whole-round samples, of which the samples yielded ~10 cm3 of water for subsequent analysis. Analyses of the different IW parameters (Table T6) were undertaken following established International Ocean Discovery Program (IODP) methods (see Geochemistry in the Expedition 403 methods chapter [Lucchi et al., 2026a]). The geochemistry profiles of the IWs indicate sample analyses began below the sulfate–methane transition zone (SMTZ) and show evidence of IW freshening and diagenetic reactions within the sediment column.
8.1.1. pH, chloride, sodium, and salinity
The pH of the IWs ranges between 7.7 and 8.0. The geochemistry profiles of chloride (Cl), sodium (Na), and salinity suggest there is freshening of the IWs with depth. Chloride linearly decreases from ~561 mM at 18 mbsf to ~518 mM at 176.21 mbsf. Below 176.21 mbsf, Cl concentrations remain fairly constant, ranging from ~529 to ~526 mM at 257.68 mbsf. Sodium concentrations measured by ion chromatography (IC) are relatively higher compared to the inductively coupled plasma (ICP) spectroscopy measurements, with the average of IC measurements being ~20 mM higher; however, the downcore trends are similar for both measurements. Therefore, we describe the general trends of Na rather than specific changes in concentration. Although Na concentrations fluctuate with depth, the overall trend slightly decreases with depth to 111.58 mbsf followed by another slight decrease with depth from 130.04 to 257.68 mbsf. Between 111.58 and 130.04 mbsf, Na concentrations slightly increase. The salinity profile gradually decreases with depth from 33 at 18 mbsf to 30 at 257.68 mbsf. There is a slight increase of salinity to 32 at 100.99 mbsf; however, the value is still below average seawater (34). The linear decrease of Cl combined with the general trend of Na and salinity indicate freshening of the IWs with depth. The geochemistry profiles of Cl, Na, and salinity are shown in Figure F29.
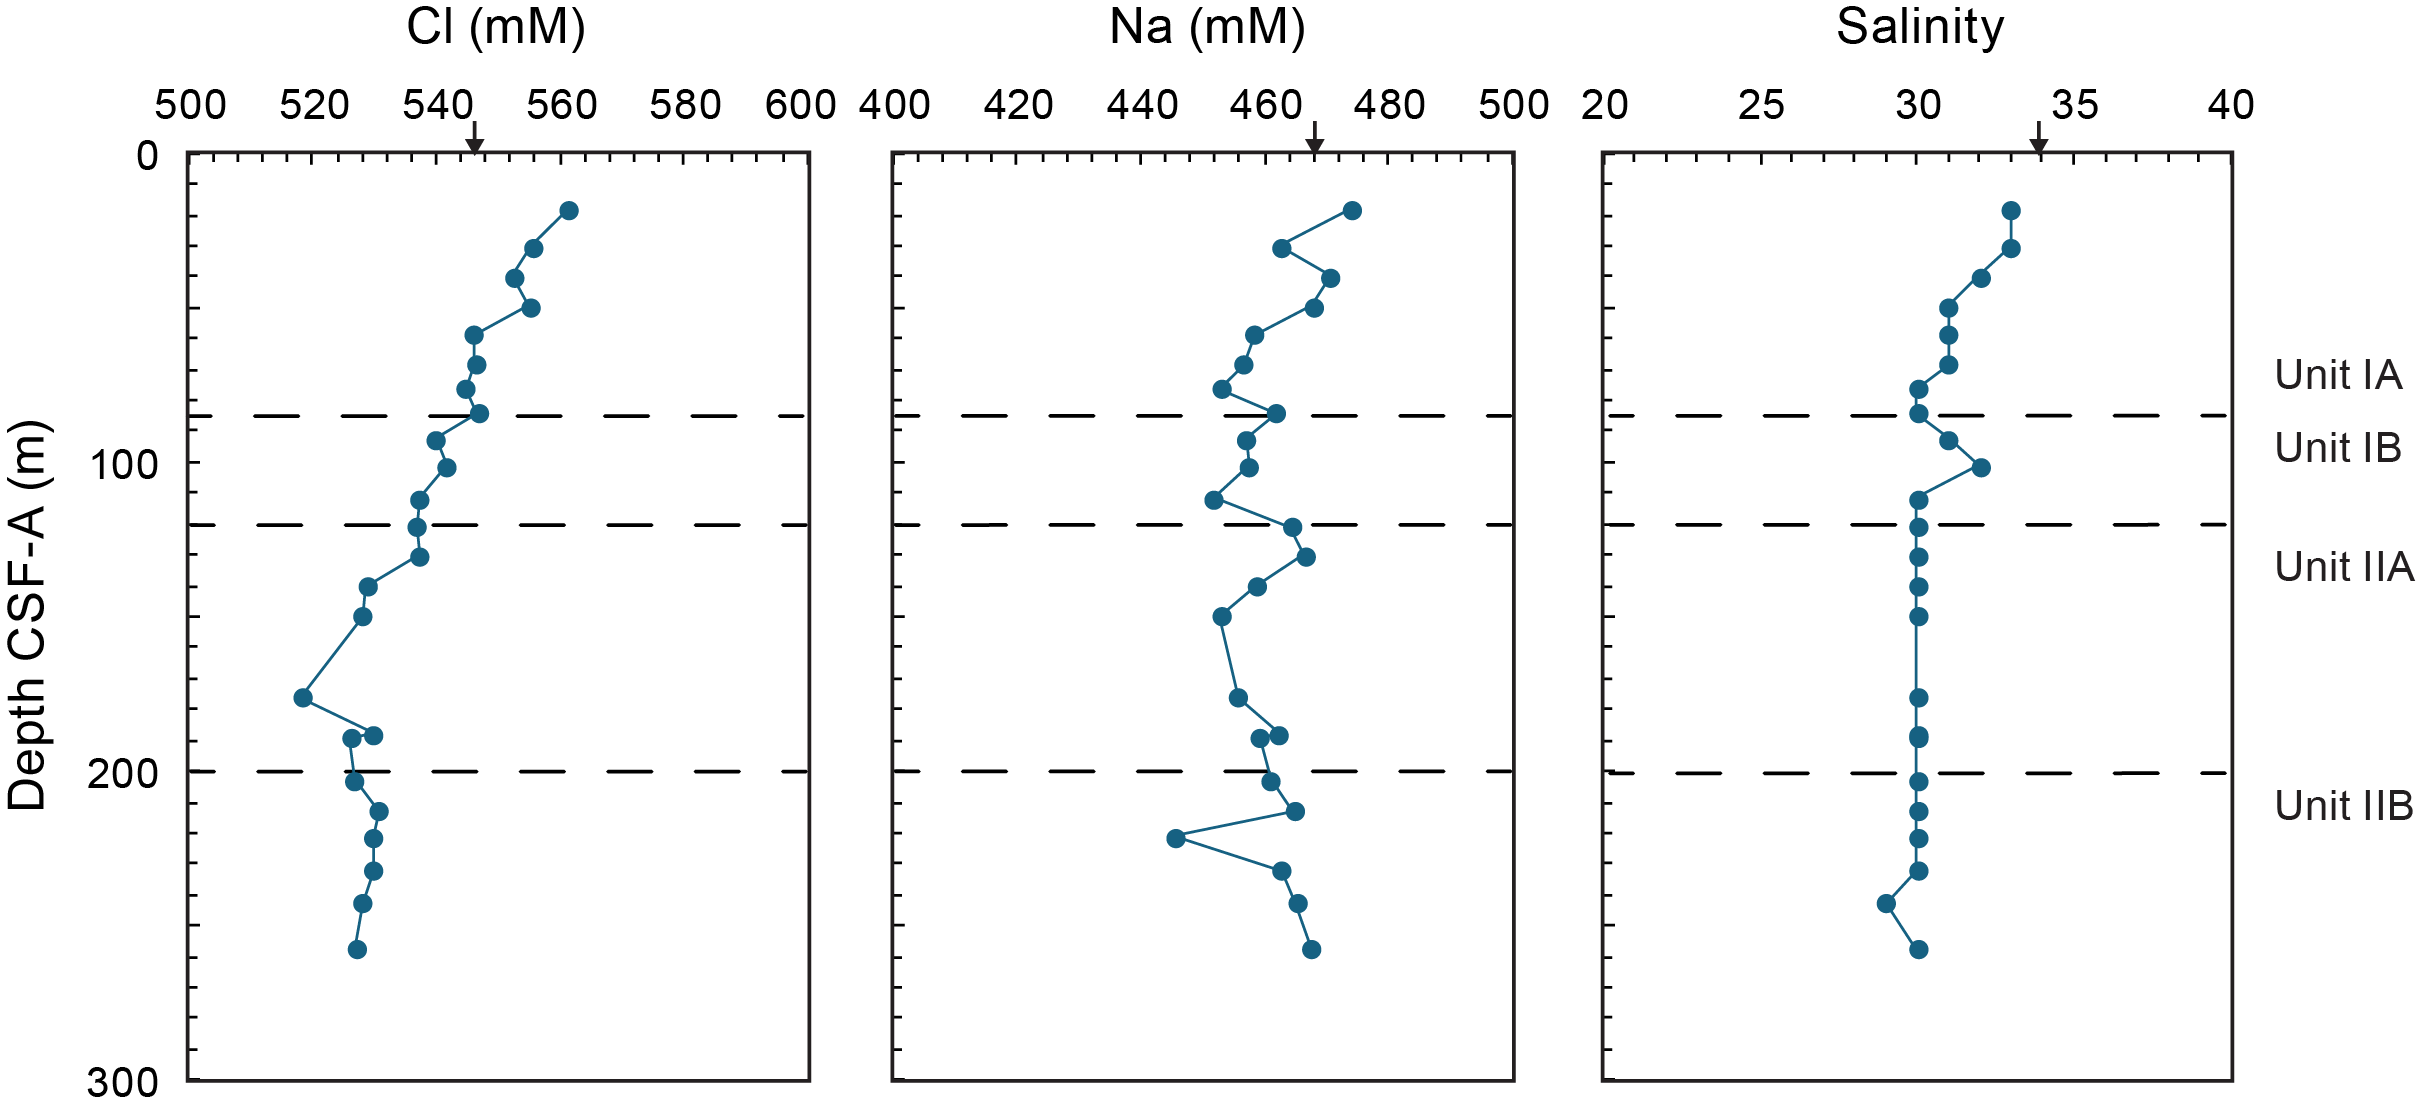
Figure F29. IW chloride, sodium, and salinity.
8.1.2. Sulfate, alkalinity, iron, and manganese
The SMTZ is characterized as sulfate depletion in the pore waters and methane increase in headspace samples, where bicarbonate is additionally produced in the pore waters due to the anaerobic oxidation of methane (AOM). At Site U1624, the first and consecutive samples measured for sulfate concentrations in the IWs show sulfate depletion throughout the sediment column from ~18 mbsf downhole. Additionally, methane rapidly increased between the headspace samples at ~4 and ~18 mbsf (see Headspace gas geochemistry). Therefore, it is very likely the SMTZ is located at 4–18 mbsf and is shallow. The location of the SMTZ within the uppermost 18 m is additionally supported by the measured alkalinity in the IWs. Alkalinity is at a maximum value of ~22 mM at 18 mbsf and subsequently decreases with depth to ~2 mM at 257.68 mbsf. The ~22 mM alkalinity is likely part of the bicarbonate produced during AOM within the SMTZ. The continued decrease in alkalinity with depth is likely attributed to ongoing microbial methanogenesis.
Iron (Fe) concentrations decrease from ~15 µM at 18 mbsf to ~1 µM at 30.42 mbsf. Interestingly, the Fe concentrations fluctuate between ~1 and 5 µM with depth to 76.06 mbsf, where Fe concentrations then remain ~≤1 µM to 130.04 mbsf. Additionally, Fe is completely consumed at 92.54 mbsf, suggesting Fe is completely incorporated in the solid phase. The measured Fe concentrations at depths below 130.04 mbsf are below detection limit. The manganese (Mn) concentrations decrease from ~2.4 µM at 18 mbsf to ~1 µM at 39.9 mbsf and vary between values approximately ≤1 µM; they eventually remain at concentrations of ≤1 µM with depth to 257.68 mbsf. The geochemistry profiles of sulfate, alkalinity, Fe, and Mn are shown in Figure F30.
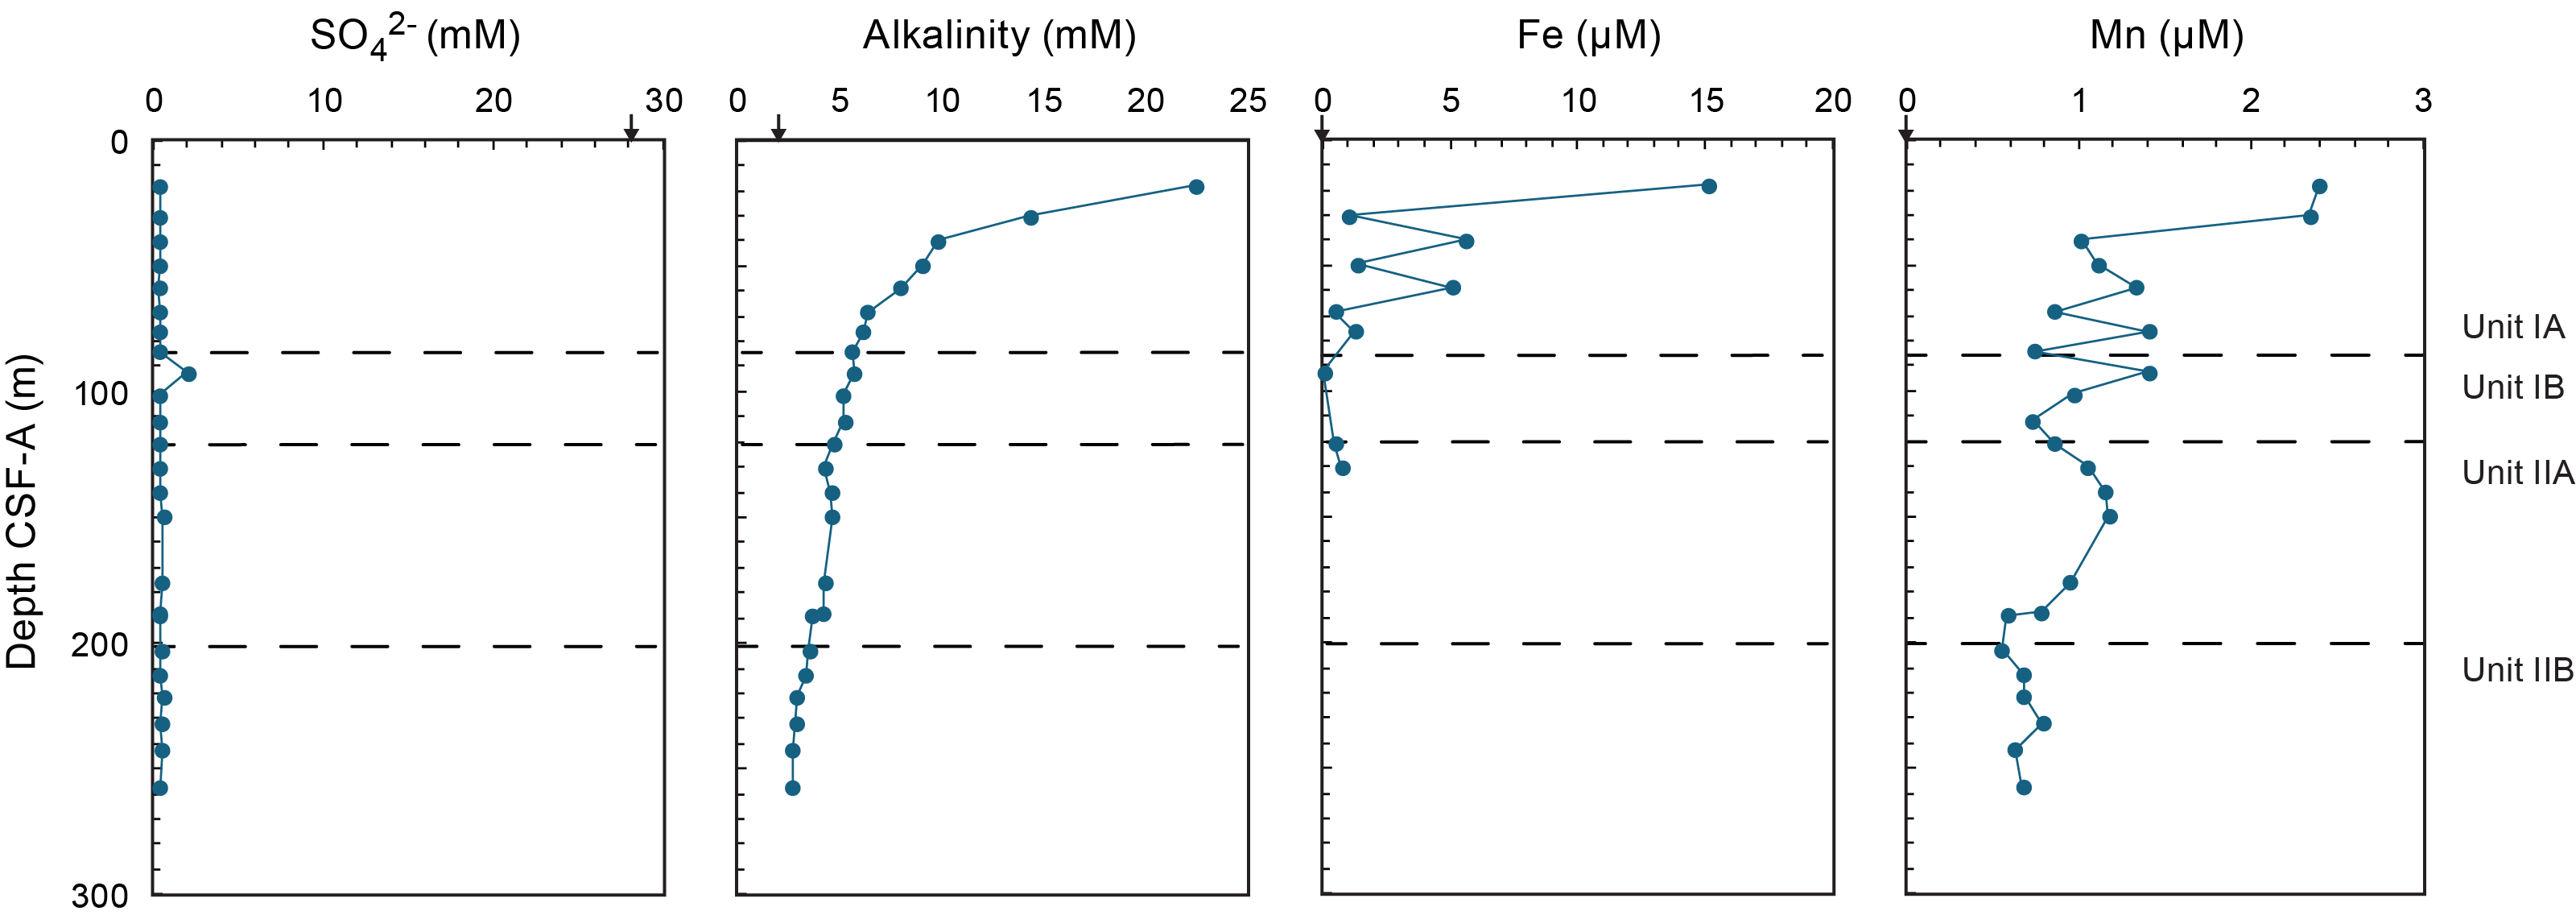
Figure F30. Sulfate, alkalinity, iron, and manganese.
8.1.3. Calcium, magnesium, strontium, silicon, barium, lithium, boron, bromide, and potassium
The geochemistry profiles of calcium (Ca) and strontium (Sr) show release with depth into the IWs. Calcium concentrations increase from ~4 mM at 18 mbsf to ~8 mM at 257.68 mbsf. Strontium concentrations increase from ~83 µM at 18 mbsf to ~177 µM at 257.68 mbsf. Given that Ca and Sr geochemistry profiles are similar, this likely suggests dissolution of calcite with depth (see also Biostratigraphy and paleoenvironment). Notably, Ca starts increasing again after a period of relative stability from 187.71 mbsf, which coincides with the disappearance of the calcareous microfossils from the record, thus suggesting that the absence of microfossils below this depth is related to dissolution rather than paleoenvironmental constraints on taxa. This implies the elevated levels of calcium carbonate (CaCO3) in Lithostratigraphic Subunit IIB are inorganic authigenic carbonates, especially as inorganic carbon content increases (see Sedimentary organic geochemistry) in Subunit IIB coinciding with dissolution of biogenic calcite. The geochemistry profile of magnesium (Mg), in contrast, shows consumption of Mg with depth, where Mg concentrations decrease from ~41 mM at 18 mbsf to ~18 mM at 257.68 mbsf. The consumption of Mg with depth is likely due to consumption in authigenic minerals, which have been observed (see Lithostratigraphy). Additionally, authigenic carbonates that may be Mg rich are observed at ~234 mbsf in Core 403-U1624B-41X (see Lithostratigraphy). Although silicon (Si) fluctuates with depth, Si concentration and fluctuation change starting near 80 mbsf, as well as at about 200 mbsf. The change in fluctuation of Si appears to be related to changes in the lithostratigraphic units (see Lithostratigraphy). The barium (Ba) concentrations in the IWs are indicative of barite dissolution with depth in response to sulfate-depleted pore waters. The variability in Ba release with depth in the pore waters is likely due to the cycling of Ba related to marine barite and authigenic barite formation above the SMTZ. The lithium (Li) geochemistry profile in the IWs is inverse to Cl, where Li increases from ~18 µM at 18 mbsf to ~62 µM at 257.68 mbsf, possibly due to clay and silicate alteration within methanogenic sediments. Both boron (B) and potassium (K) decrease with depth, with B decreasing from above average seawater values (Bruland and Lohan, 2006) to 300.26 µM at 257.68 mbsf and K decreasing from 10 mM (18 mbsf) to 4.6 mM (257.68 mbsf), which support the interpretation of the Li variability. Bromide (Br) linearly increases from 0.9 mM (18 mbsf) to 1.6 mM (257.68 mbsf). The geochemistry profiles of Ca, Mg, Sr, Si, Ba, and Li are shown in Figure F31. The geochemistry profiles of K and B are shown in Figure F32.
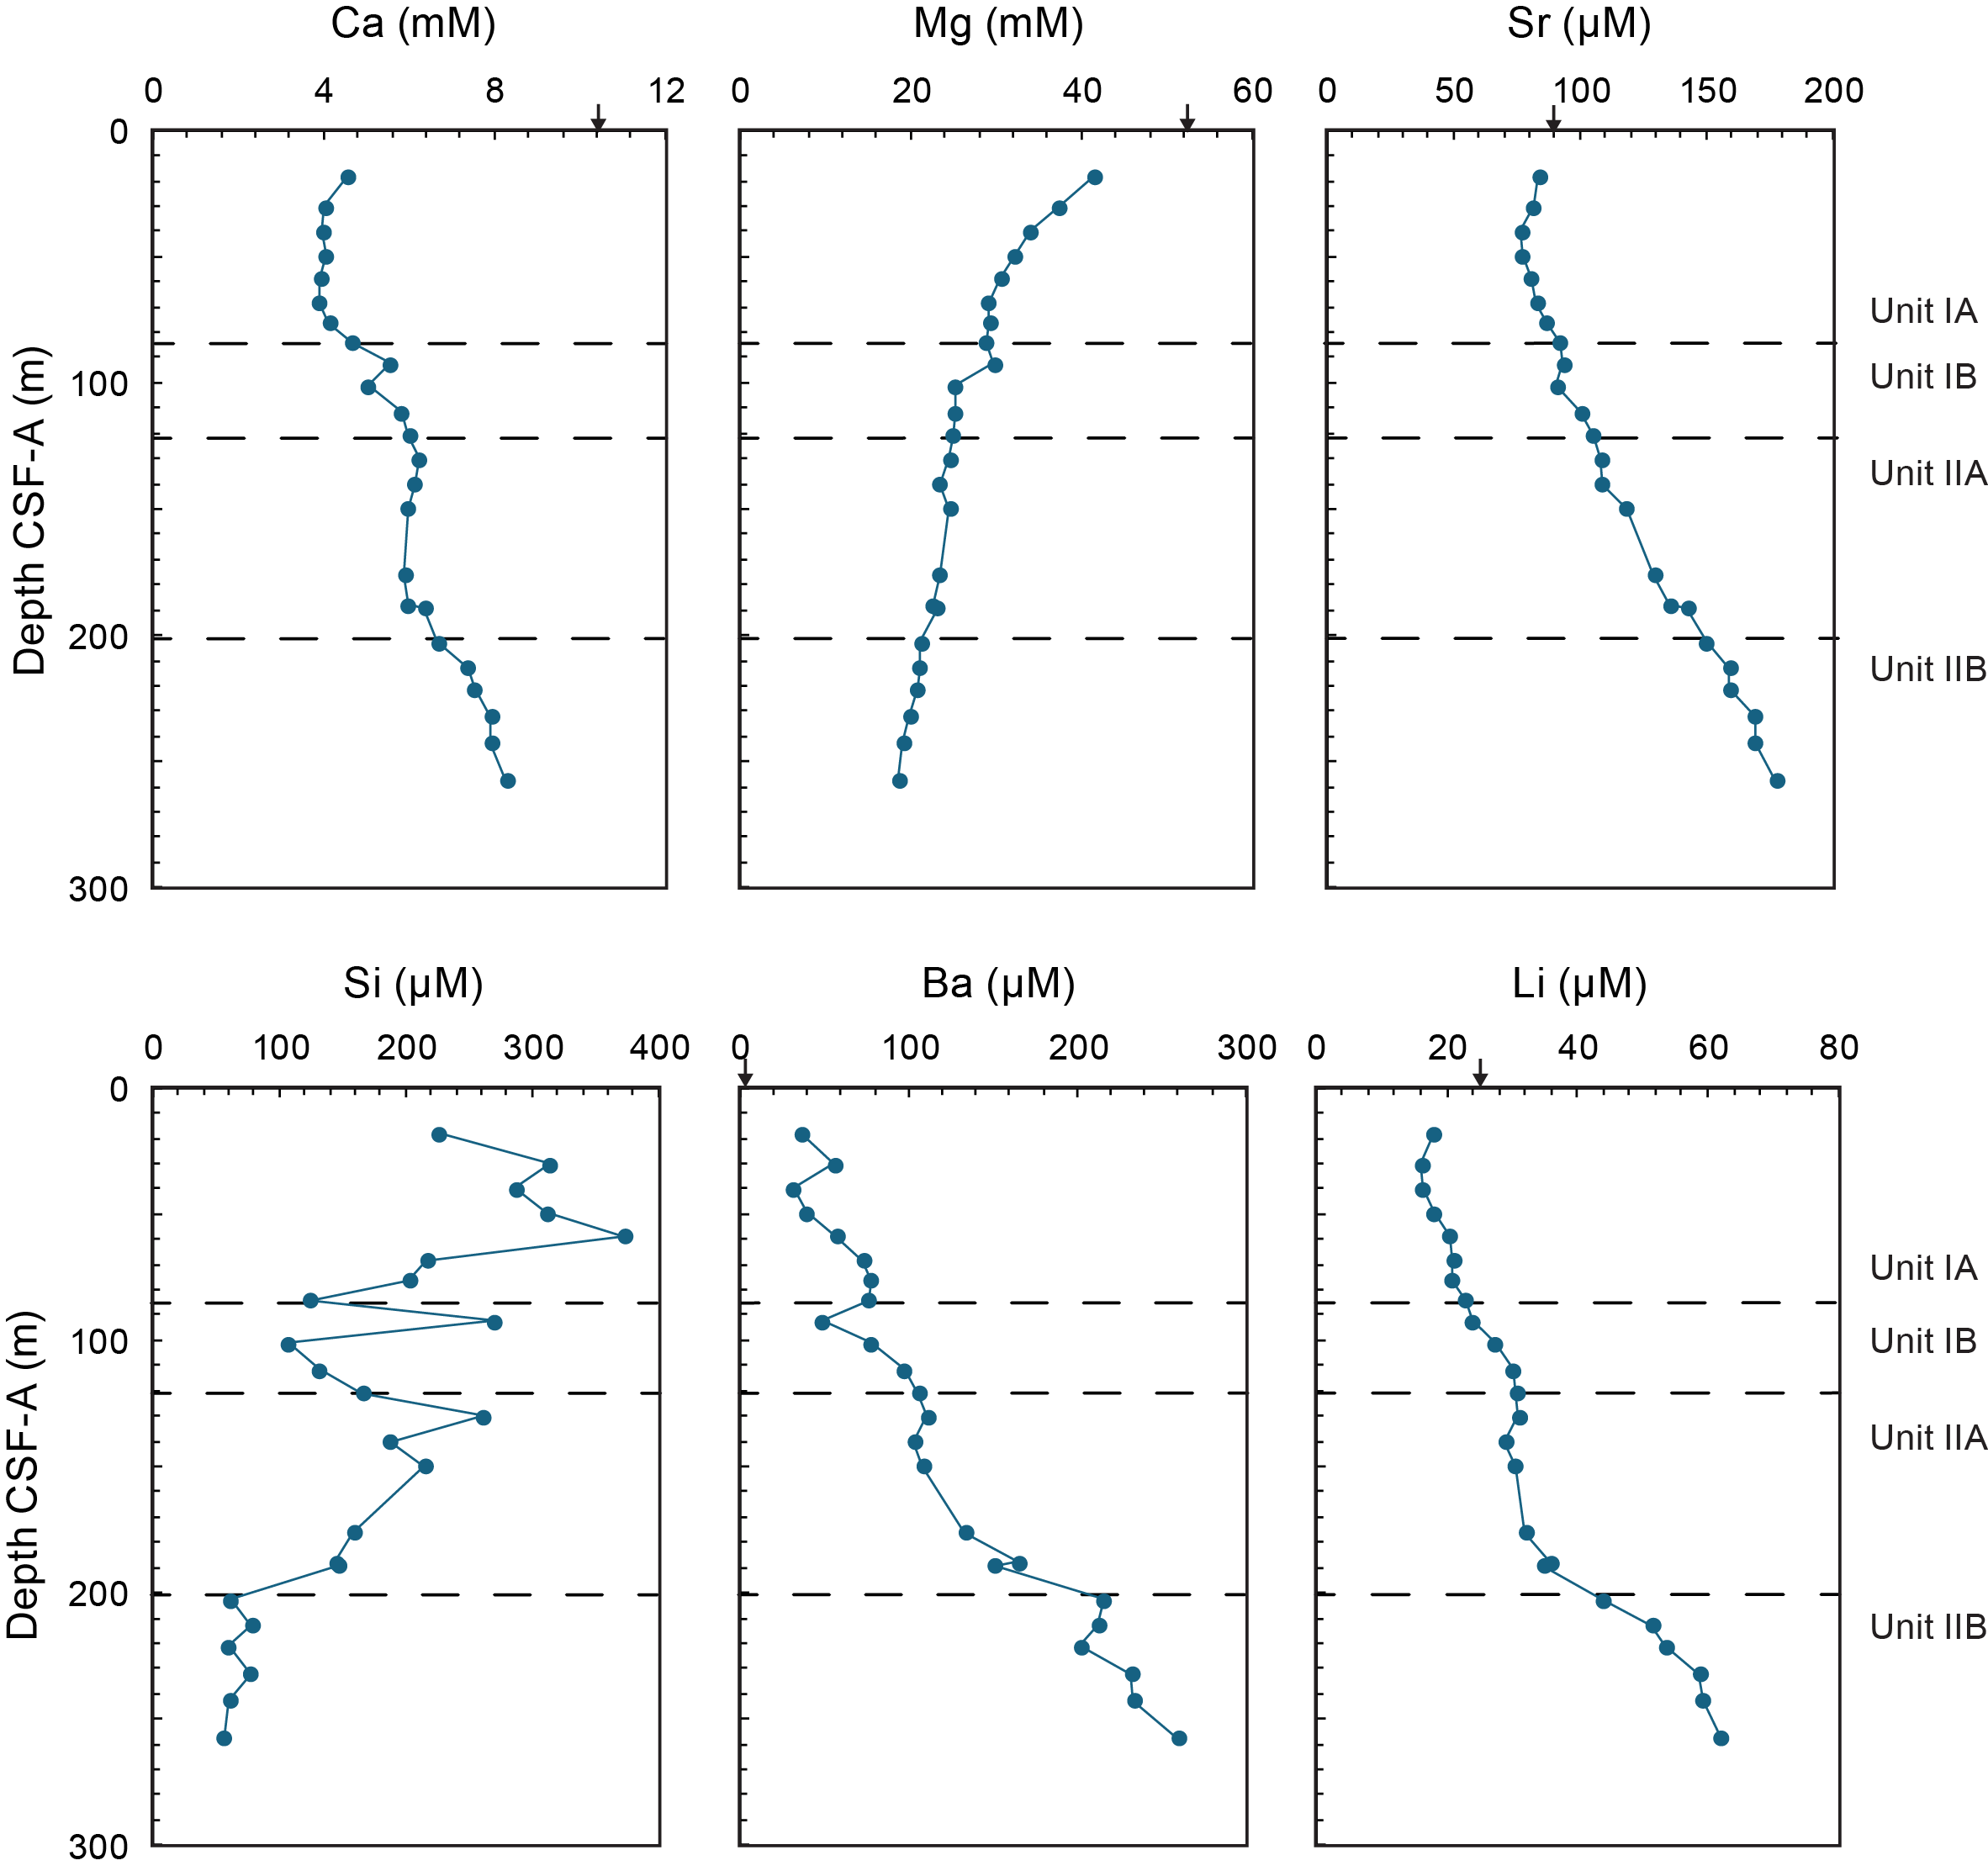
Figure F31. IW calcium, magnesium, strontium, silicon, barium, and lithium.
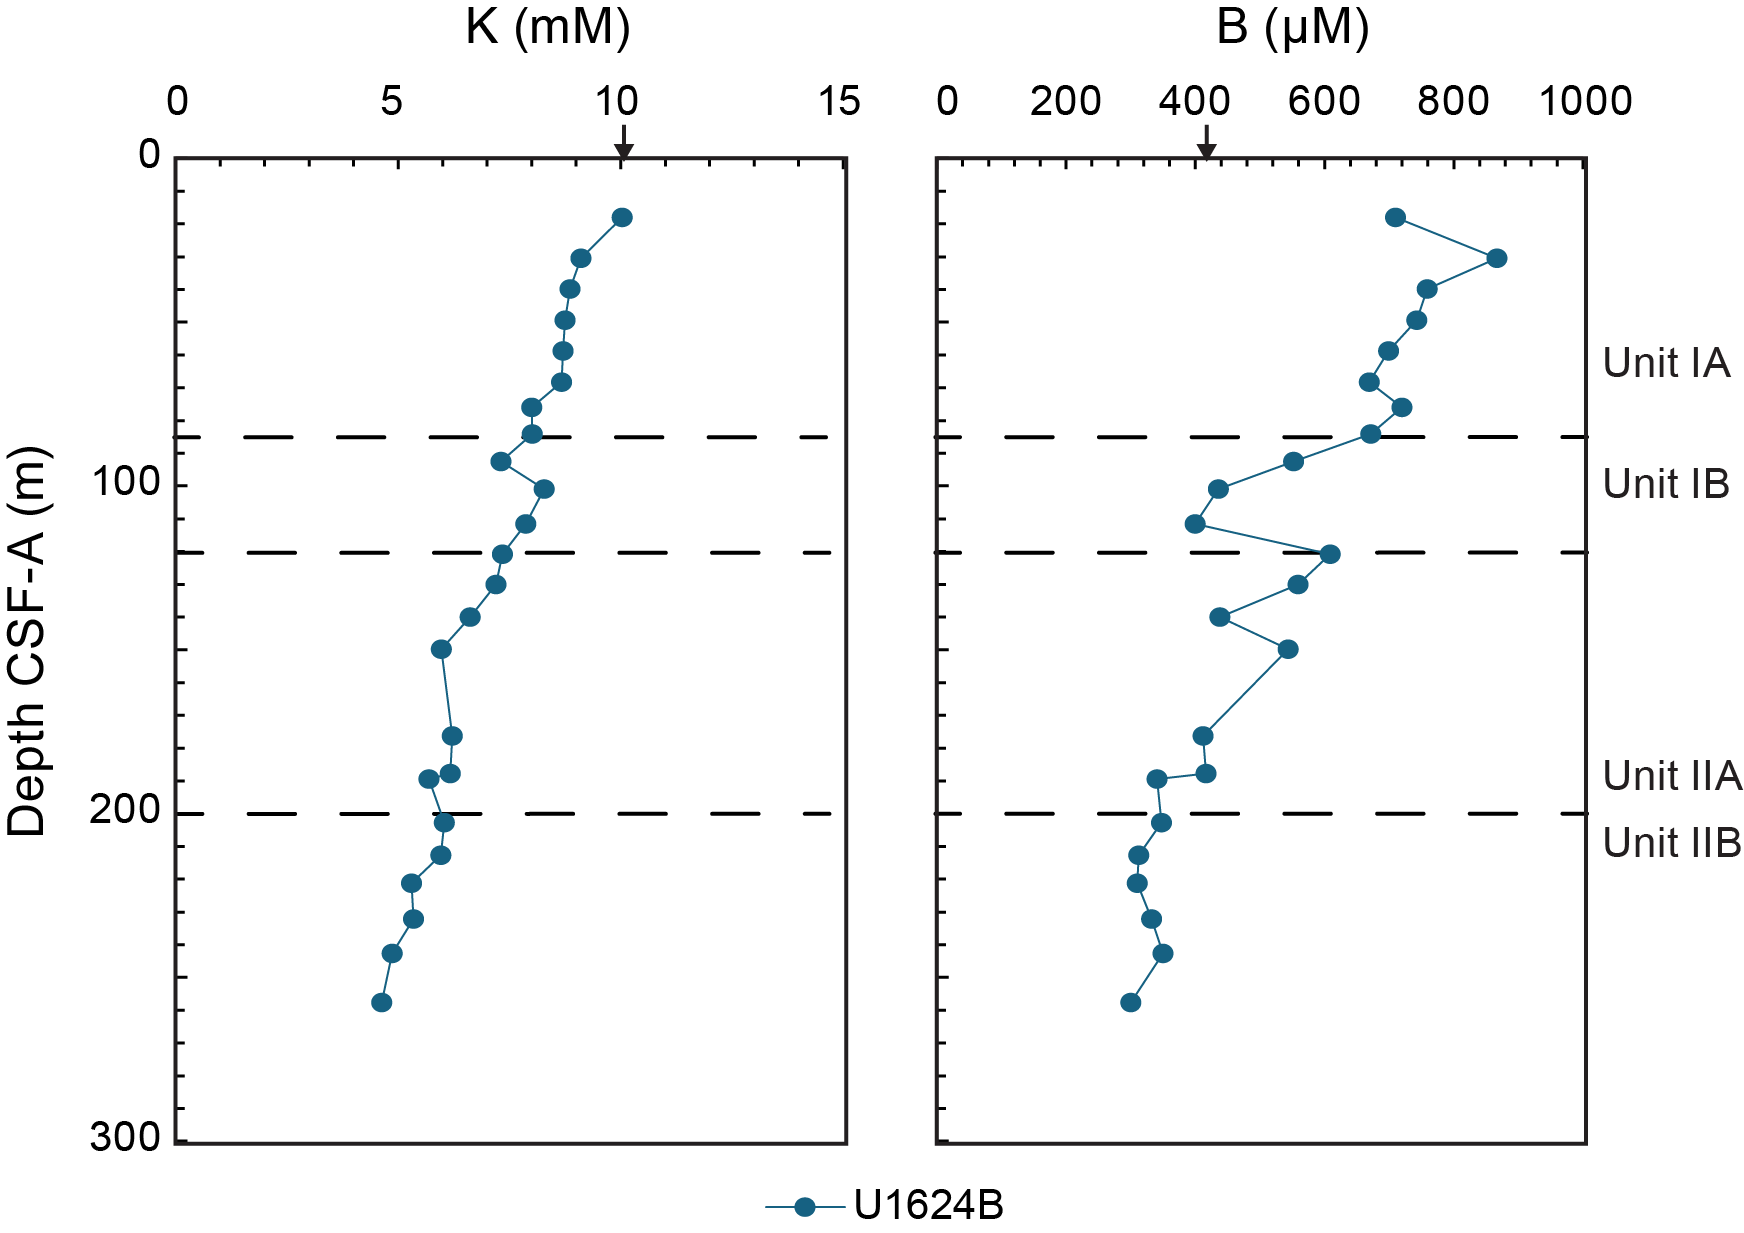
Figure F32. IW potassium and boron.
8.1.4. Phosphate and ammonium
The phosphate concentration of ~52 µM measured at 18 mbsf suggests organic matter remineralization is occurring at shallower depths, consistent with the measured Fe and Mn interpretations. There is, additionally, an increase of phosphate to ~35 µM between 30.42 and 58.72 mbsf, likely due to enhanced organic matter degradation. Below 58.72 mbsf, phosphate concentrations remain fairly constant, ranging between ~7 and 10 µM. Ammonium concentrations increase with depth from ~2 mM at 18 mbsf to ~4 mM at 257.68 mbsf, which is consistent with organic matter diagenesis and supports the interpretation of the measured phosphate data. The geochemistry profiles of ammonium and phosphate are shown in Figure F33.
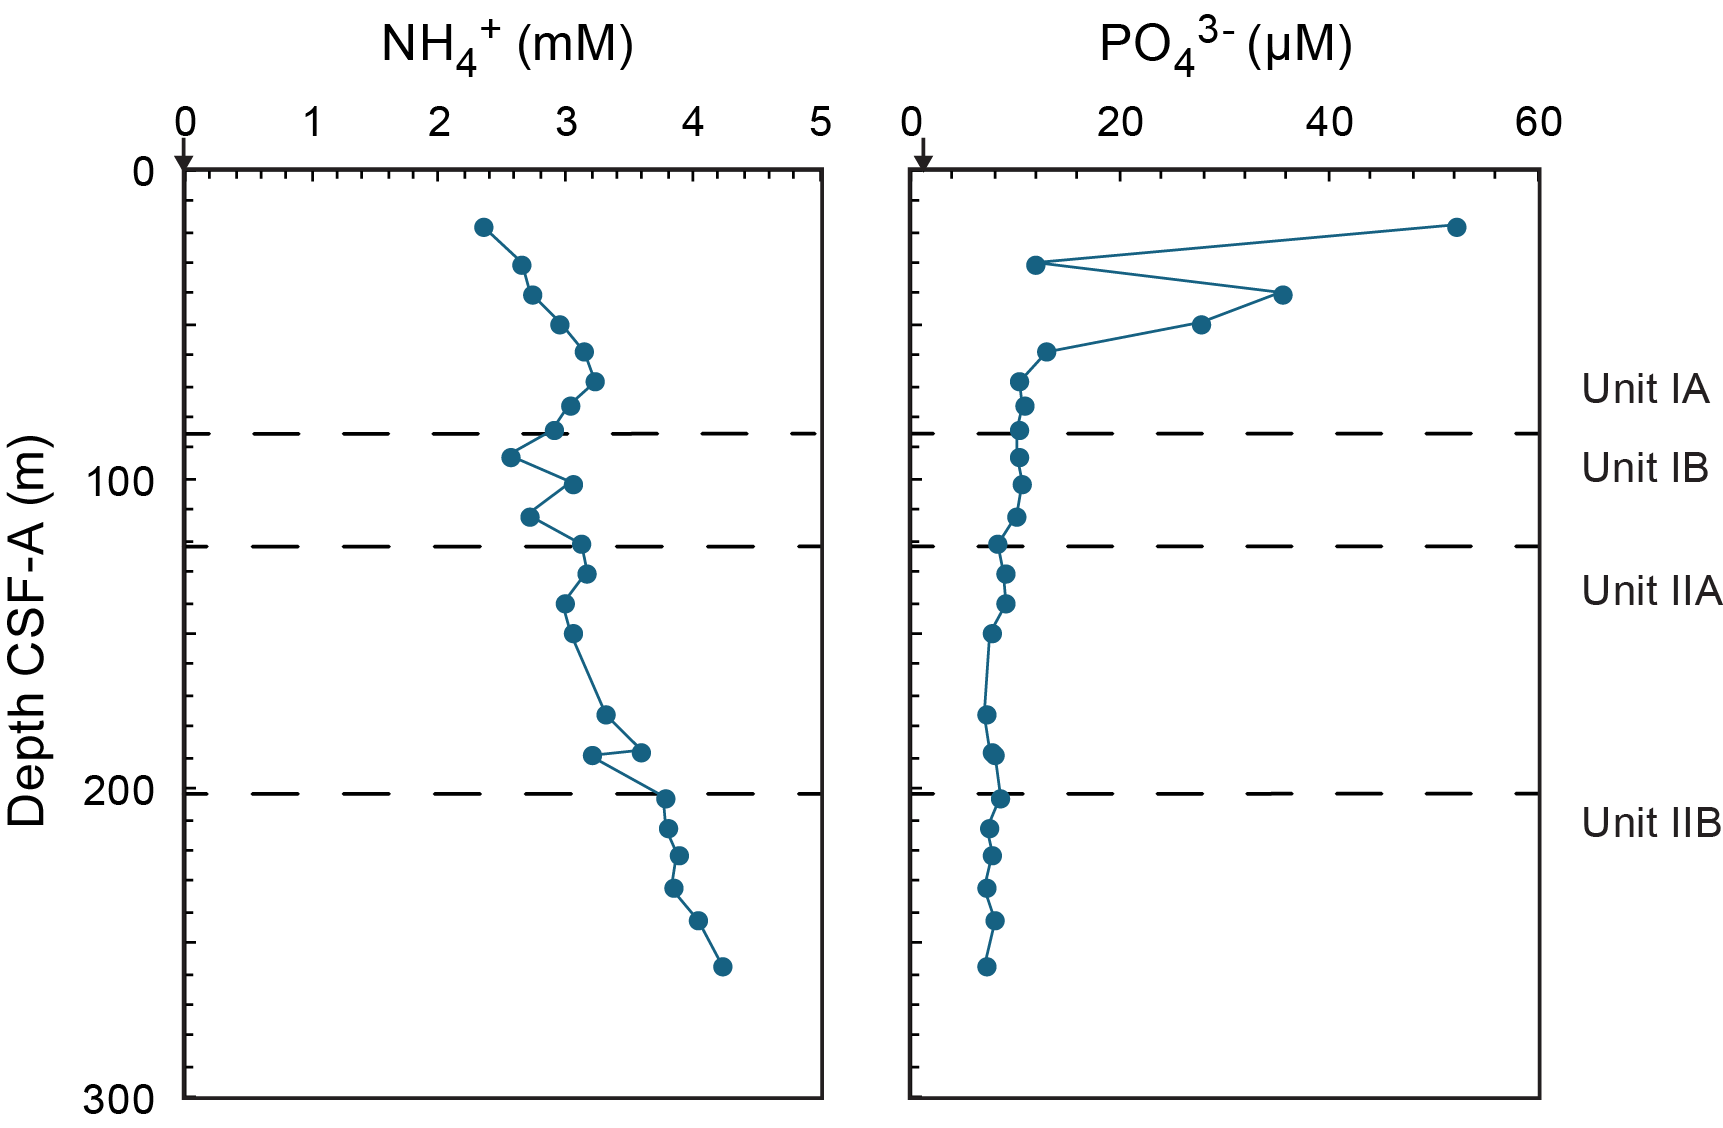
Figure F33. IW ammonium and phosphate.
8.2. Sedimentary organic geochemistry
The shipboard solid phase analysis at Site U1624 involved measurements of total inorganic carbon (TIC; i.e., CaCO3), TN, total carbon (TC), TOC (calculated as TC − TIC), and total sulfur (TS) (Table T7) using shipboard plastic cylinder sampling (sample type CARB). The sedimentology team identified intervals for CARB samples in Hole U1624B, resulting in a total of 29 samples taken. These samples are not systematically spaced, and they include representations of both major and minor lithologies.
The TC, TOC, and CaCO3 contents exhibit a similar trend in the sedimentary sequences of Hole U1624B, increasing in content with depth in Lithostratigraphic Subunit IIB. The relatively higher TC and CaCO3 contents in deeper lithostratigraphic units are possibly derived from inorganic authigenic carbonate because authigenic minerals were observed at Site U1624 (see Lithostratigraphy), and this interpretation fits well with the IW chemistry Ca trends.
The TOC content shows a decreasing trend (from 1.5 to 0.5 wt%) in Lithostratigraphic Subunit IA and exhibits an increase to ~1.2 wt% in Subunit IB. The TOC is highly variable in Subunits IIA and IIB but maintains an average of 1 wt%. The TN content ranges 0.05–0.1 wt% and has a similar trend to the TOC content. The TS content is variable, ranging between 0 and 0.4 wt%.
The ratio of C/N is commonly used to identify the origin of sedimentary organic matter (Meyers, 1997). A C/N ratio between 4 and 10 generally indicates marine origin, primarily from marine algae; values ≥ 20 suggest the input of terrestrial organic matter (e.g., Meyers, 1994, 1997). At Site U1624, the C/N ratio fluctuates, ranging between ~9 and 15, which suggests a mix of marine algae and terrestrial organic matter in most intervals. Increases in this record possibly indicate times of increased glaciogenic input from the nearby Svalbard, related to the dynamics of the paleo-SBSIS. Figure F34 illustrates the downcore profiles of TC, CaCO3, TOC, TN, and C/N at Site U1624, and Figure F35 illustrates the downcore profile of TS at Site U1624.
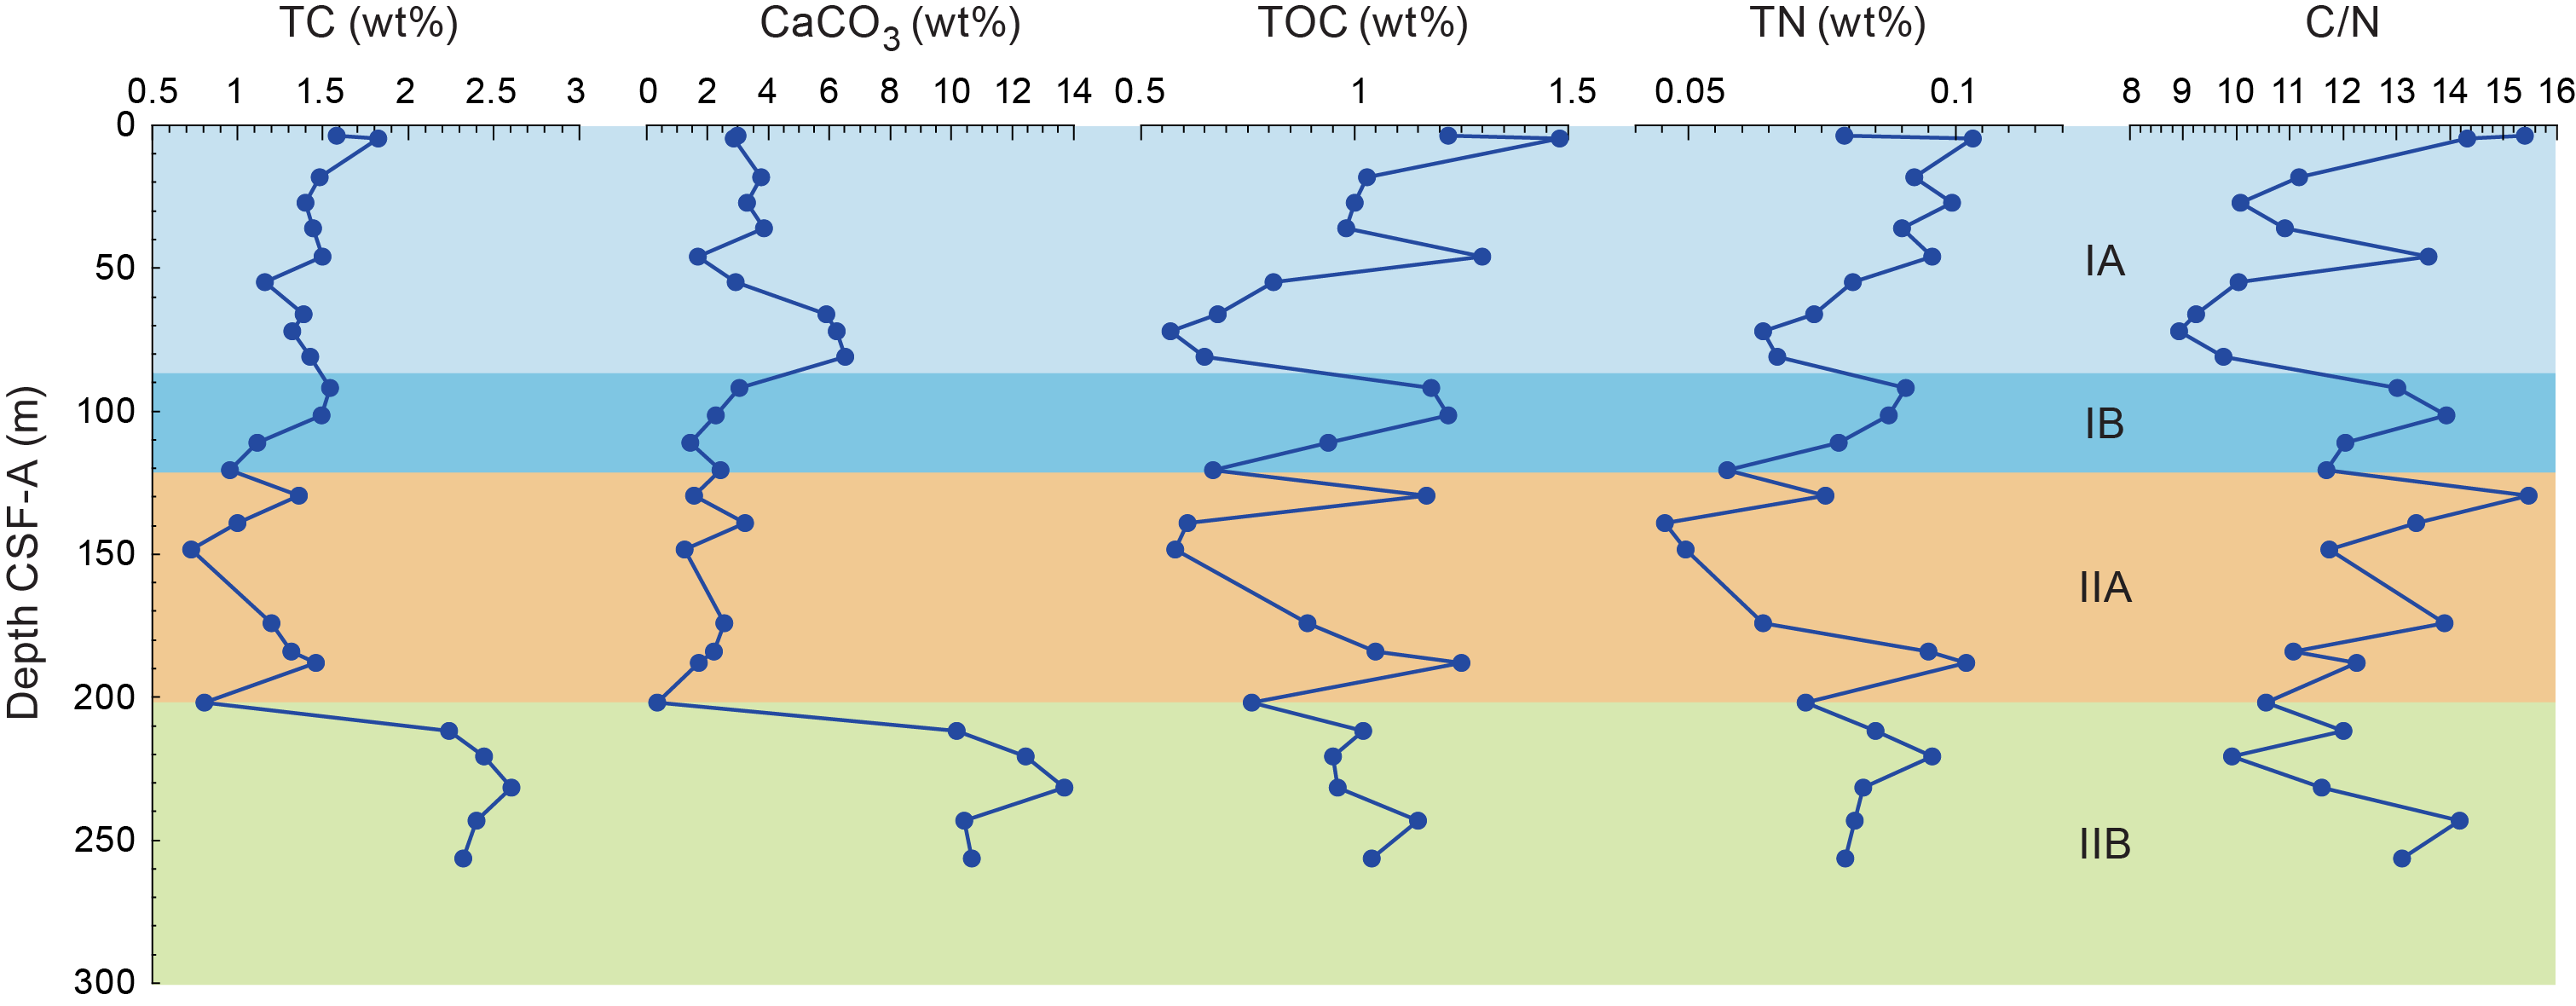
Figure F34. Bulk sediment contents of TC, CaCO3, TOC, TN, and C/N ratio.
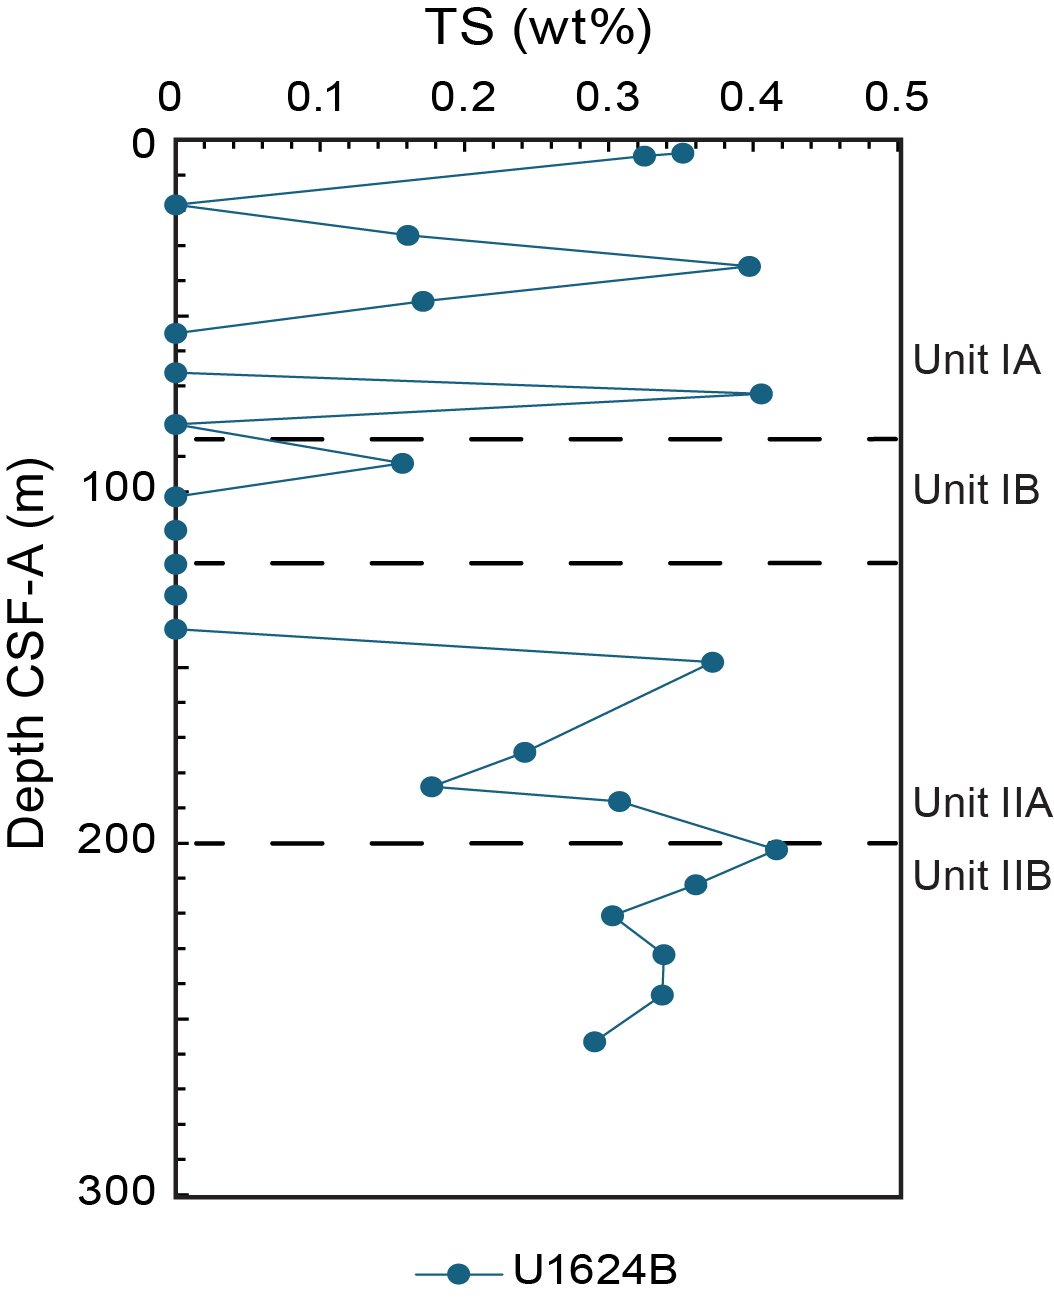
Figure F35. Bulk sediment contents of TS.
8.3. Headspace gas geochemistry
Headspace gas geochemistry (Table T8) was measured routinely at Site U1624. One sample was taken from the very shallow Hole U1624A, and 32 samples were taken from Hole U1624B. Methane increased sharply from <2 ppmv in the uppermost ~4 m to ~25,000 ppmv at ~18 mbsf (Figure F36). Methane concentrations are particularly useful to constrain the position of the SMTZ at this site because measurements of sulfate in the pore water were only possible deeper than 18 mbsf due to poor core recovery. Sulfate is already depleted by 18 mbsf (see Interstitial water chemistry). However, the low methane concentrations from 0 to 4 mbsf suggest high concentrations of sulfate that inhibit methanogenesis in this interval. Thus, we expect the SMTZ to sit between 4 and 18 mbsf at Site U1624. Methane concentrations peaked at ~43,000 ppmv at ~40 mbsf before stabilizing after ~93 mbsf around 10,000 ppmv for the remainder of the record. The sharp decrease in methane concentrations deeper than ~93 mbsf also marks a lithologic boundary between Lithostratigraphic Subunits IA and IB. The methane peak coincides with a very high C1/C2 ratio of 240,000, suggesting that microbial methanogenesis is the main component of the methane peak. C1/C2 ratios were generally high throughout the record and showed a general decreasing trend with depth, consistent with an increasing contribution of thermogenic breakdown of organic matter to the sediment hydrocarbon gases. The presence of heavier hydrocarbons deeper in the record also supports this conclusion. Ethane was present in the headspace samples below ~50 mbsf. Propane was also detected in trace amounts, predominantly below ~145 mbsf. Both ethane and propane showed notable increases at 190 mbsf until the bottom of the core. This corresponds roughly to the boundary of Subunits IIA and IIB, which marks a transition to a higher presence of diamicton in the sediments. Similar connections between lithology and hydrocarbon geochemistry are observed at other sites, and postcruise research is expected to be carried out to investigate this in more detail.
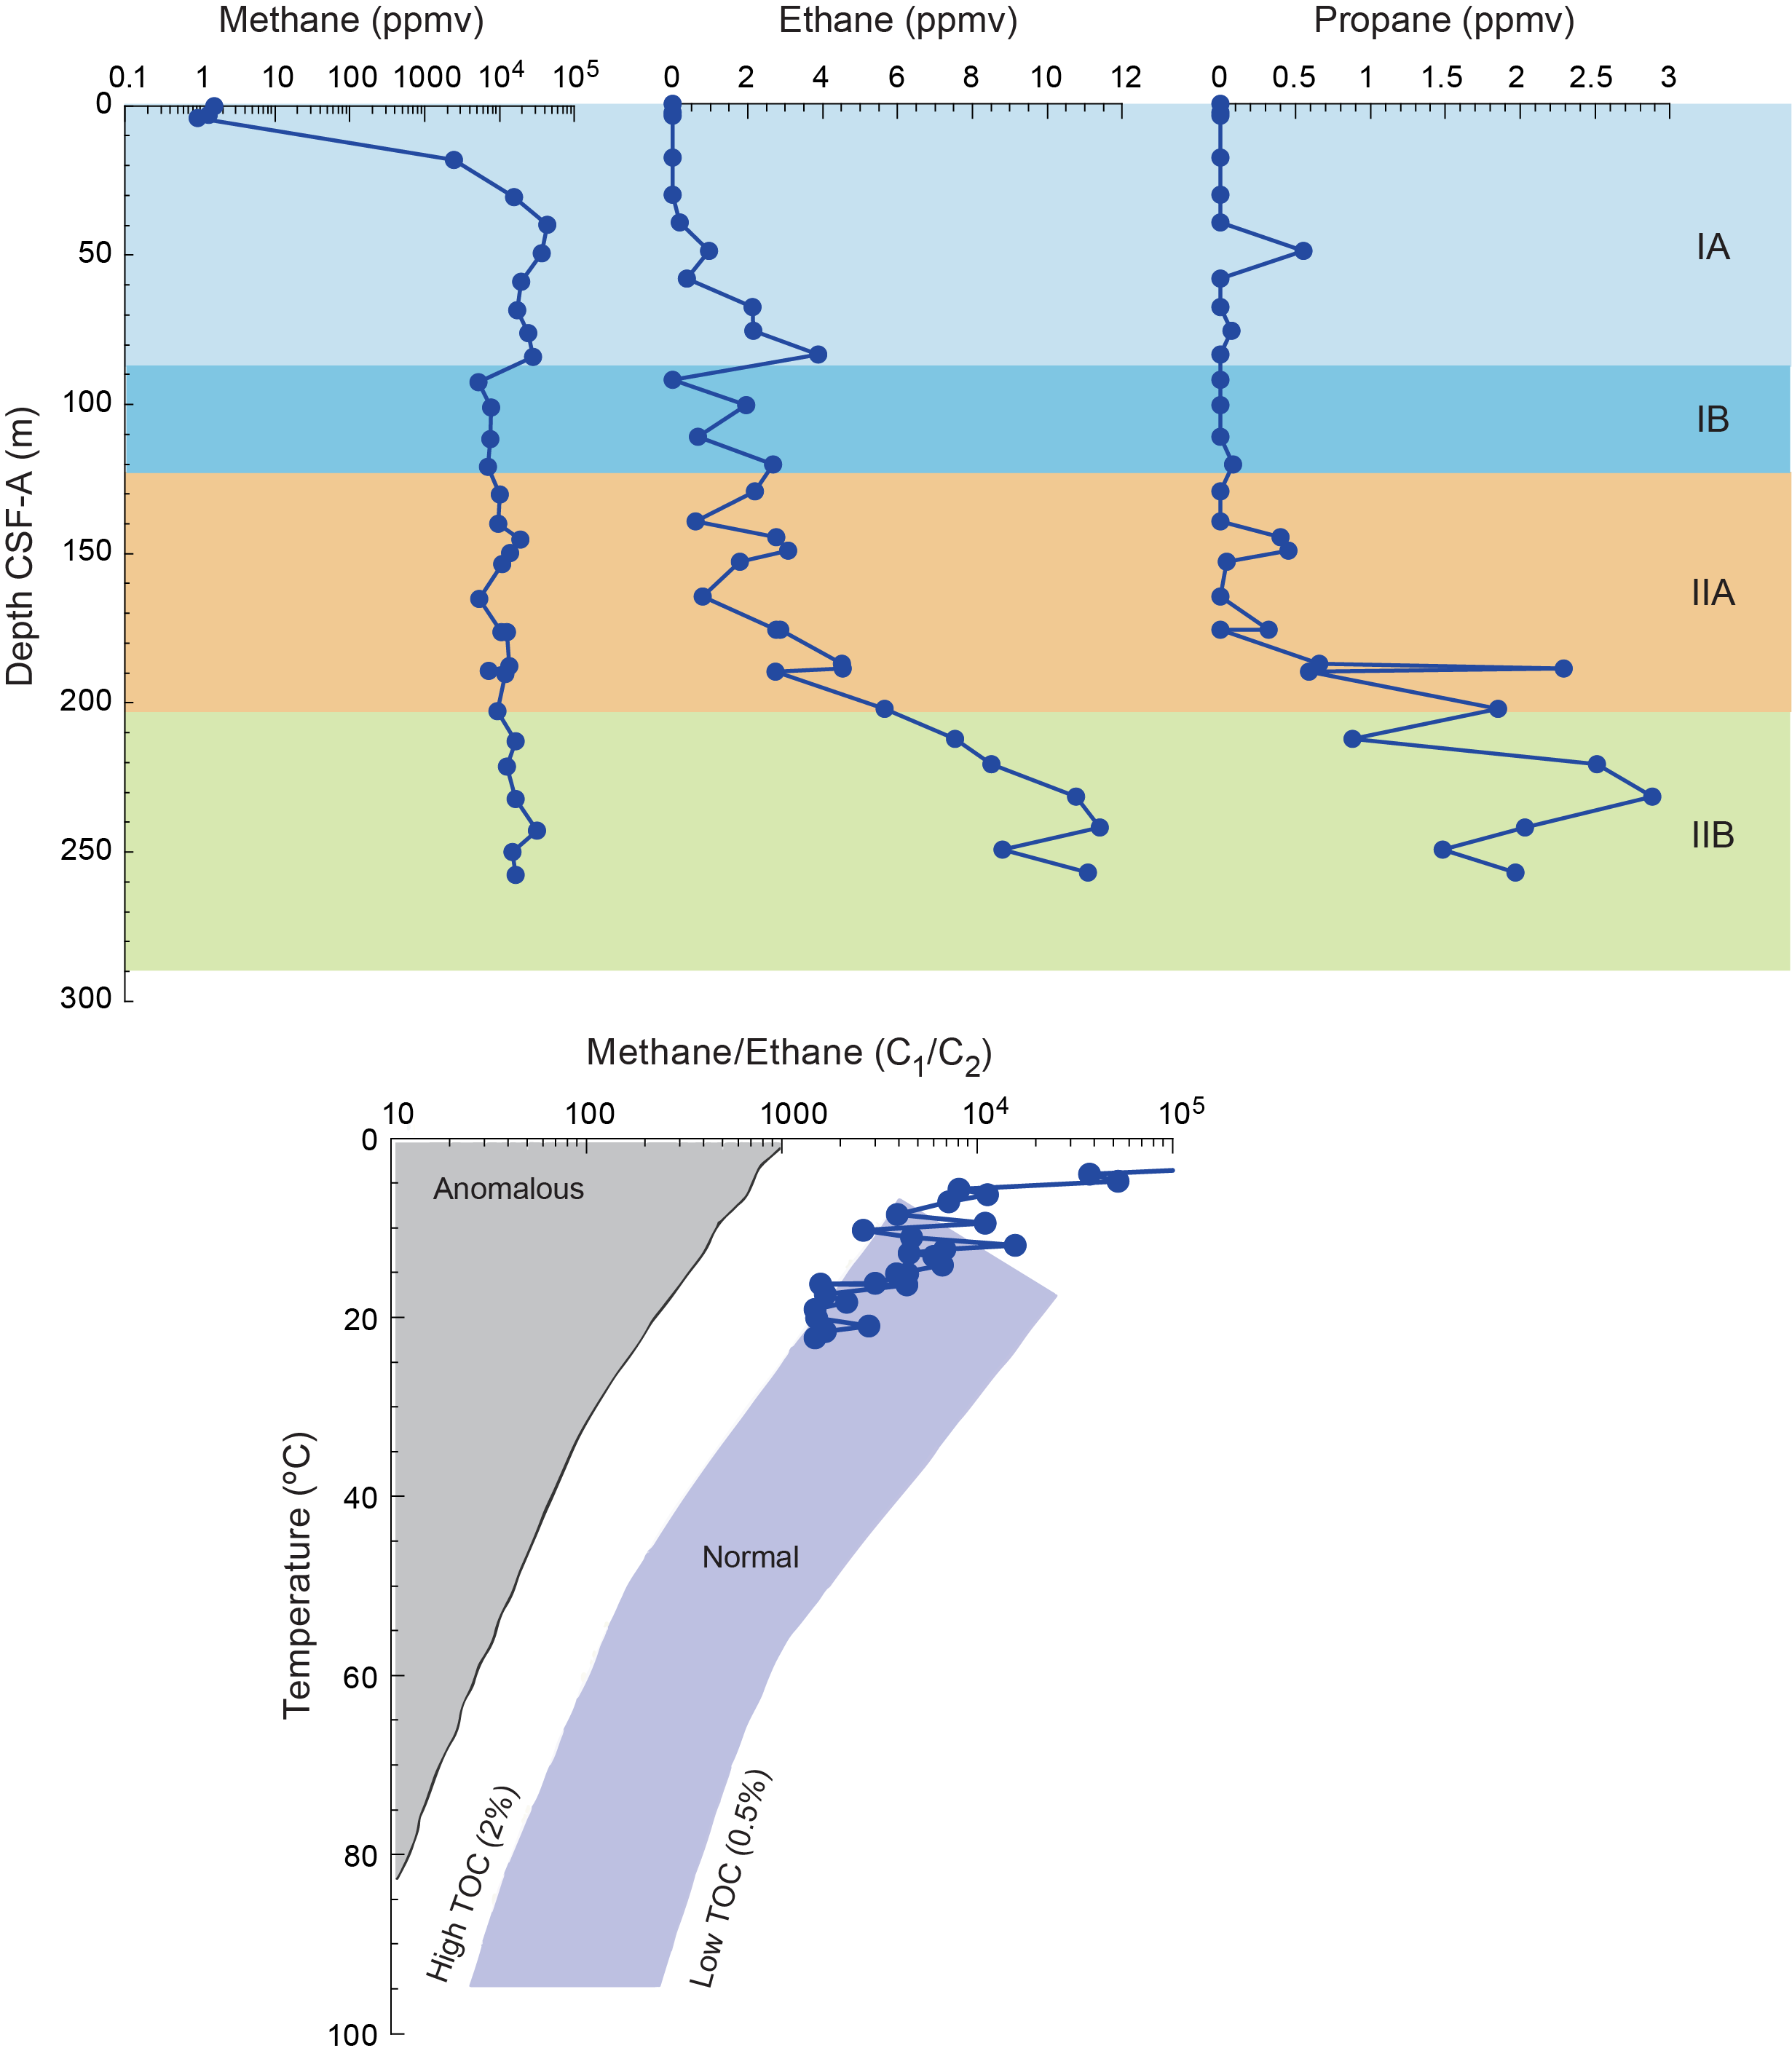
Figure F36. Methane, ethane, propane, and methane/ethane ratios.
9. Downhole measurements
9.1. Formation temperature
During APC coring in Hole U1624B, in situ formation temperature was measured with the APCT-3 tool in Cores 4H, 7H, 10H, and 14F. Temperature increased almost linearly with depth, and the slope of linear regression provides a typical geothermal gradient (88.3°C/km) for oceanic sediments compared with the statistical data set (Kolawole and Evenick, 2023) (Figure F37). For Hole U1624B, the heat flow in the sediments and the temperature at the seafloor were calculated using the measured thermal conductivity in Cores 1H–34X (see Physical properties) and the formation temperature measurements. Assuming a linear relationship between thermal conductivity and depth, the heat flow in the sediments and the temperature at the seafloor are approximately 102.8 mW/m2 and −0.506°C, respectively.
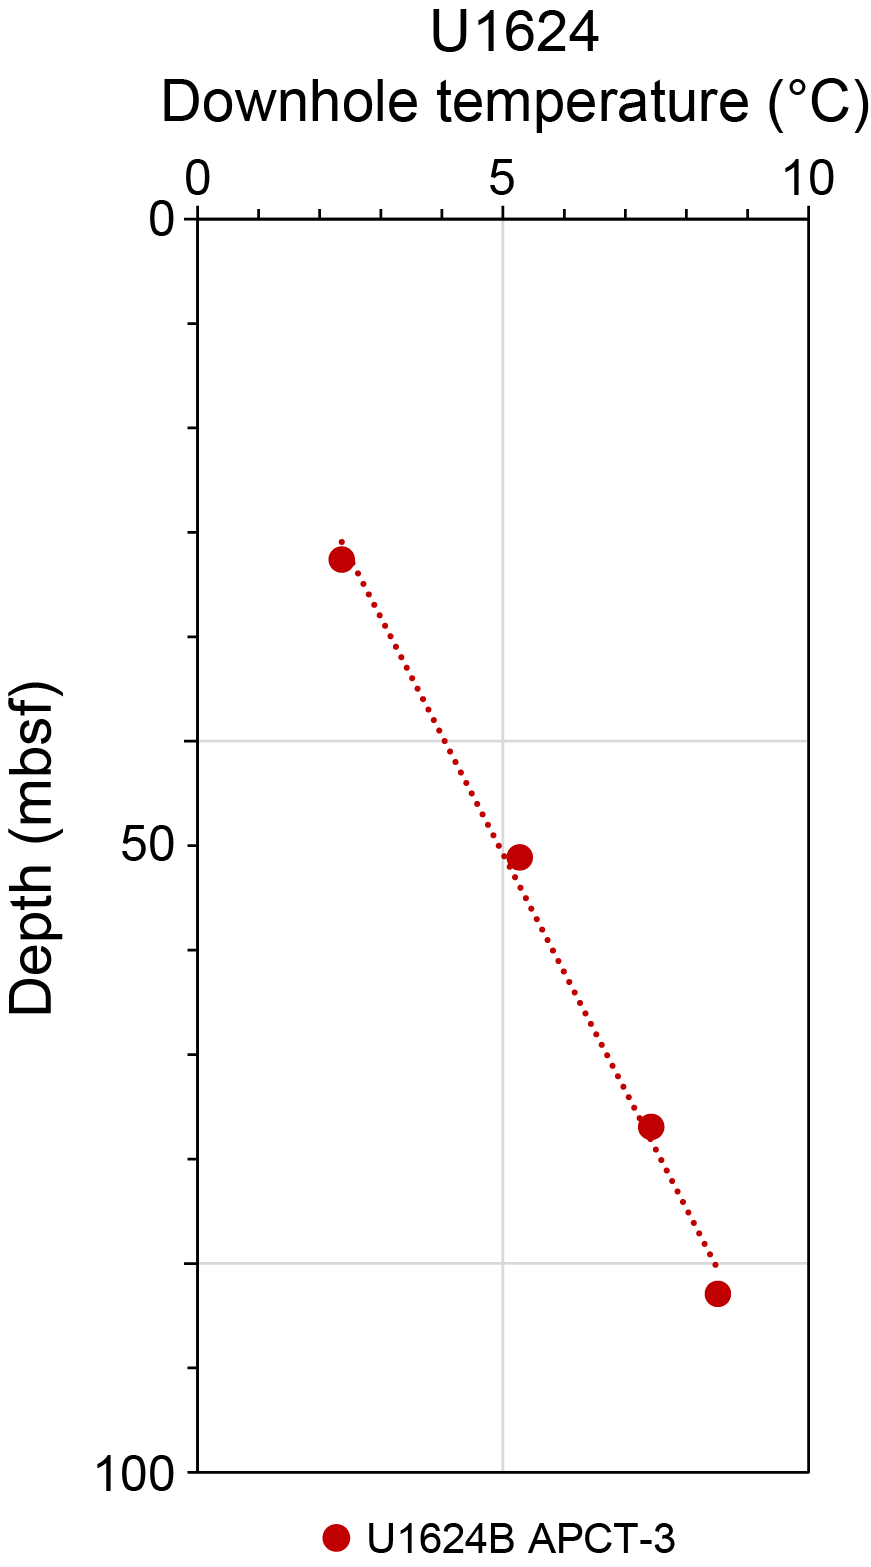
Figure F37. Formation temperature.
References
Bruland, K.W., and Lohan, M.C., 2006. Controls of trace metals in seawater. In Elderfield, H., Treatise on Geochemistry (Volume 6): the Oceans and Marine Geochemistry. Amsterdam (Elsevier), 23–47. https://doi.org/10.1016/B0-08-043751-6/06105-3
Caricchi, C., Lucchi, R.G., Sagnotti, L., Macrì, P., Di Roberto, A., Del Carlo, P., Husum, K., Laberg, J.S., and Morigi, C., 2019. A high-resolution geomagnetic relative paleointensity record from the Arctic Ocean deep-water gateway deposits during the last 60 kyr. Geochemistry, Geophysics, Geosystems, 20(5):2355–2377. https://doi.org/10.1029/2018GC007955
Caricchi, C., Sagnotti, L., Campuzano, S.A., Lucchi, R.G., Macrì, P., Rebesco, M., and Camerlenghi, A., 2020. A refined age calibrated paleosecular variation and relative paleointensity stack for the NW Barents Sea: implication for geomagnetic field behavior during the Holocene. Quaternary Science Reviews, 229:106133. https://doi.org/10.1016/j.quascirev.2019.106133
de Vernal, A., Radi, T., Zaragosi, S., Van Nieuwenhove, N., Rochon, A., Allan, E., De Schepper, S., Eynaud, F., Head, M.J., Limoges, A., Londeix, L., Marret, F., Matthiessen, J., Penaud, A., Pospelova, V., Price, A., and Richerol, T., 2020. Distribution of common modern dinoflagellate cyst taxa in surface sediments of the Northern Hemisphere in relation to environmental parameters: The new n=1968 database. Marine Micropaleontology, 159:101796. https://doi.org/10.1016/j.marmicro.2019.101796
Ehlers, B.-M., and Jokat, W., 2013. Paleo-bathymetry of the northern North Atlantic and consequences for the opening of the Fram Strait. Marine Geophysical Research, 34(1):25–43. https://doi.org/10.1007/s11001-013-9165-9
Eiken, O., and Hinz, K., 1993. Contourites in the Fram Strait. Sedimentary Geology, 82(1–4):15–32. https://doi.org/10.1016/0037-0738(93)90110-Q
Engen, Ø., Faleide, J.I., and Dyreng, T.K., 2008. Opening of the Fram Strait gateway: a review of plate tectonic constraints. Tectonophysics, 450(1–4):51–69. https://doi.org/10.1016/j.tecto.2008.01.002
Flores, J.A., Filippelli, G.M., Sierro, F.J., and Latimer, J.C., 2012. The "White Ocean" Hypothesis: A Late Pleistocene Southern Ocean Governed by Coccolithophores and Driven by Phosphorus. Frontiers in Microbiology, 3. https://doi.org/10.3389/fmicb.2012.00233
Gebhardt, A.C., Geissler, W.H., Matthiessen, J., and Jokat, W., 2014. Changes in current patterns in the Fram Strait at the Pliocene/Pleistocene boundary. Quaternary Science Reviews, 92:179–189. https://doi.org/10.1016/j.quascirev.2013.07.015
González-Lanchas, A., Rickaby, R.E.M., Sierro, F.J., Rigual-Hernández, A.S., Alonso-García, M., and Flores, J.A., 2023. Globally enhanced calcification across the coccolithophore Gephyrocapsa complex during the mid-Brunhes interval. Quaternary Science Reviews, 321:108375. https://doi.org/10.1016/j.quascirev.2023.108375
Gradstein, F.M., and Ogg, J.G., 2020. The Chronostratigraphic Scale. In Gradstein, F.M., Ogg, J.G., Schmitz, M.D. and Ogg, G.M., Geologic Time Scale 2020. (Elsevier), 21–32. https://doi.org/10.1016/B978-0-12-824360-2.00002-4
Husum, K., and Hald, M., 2012. Arctic planktic foraminiferal assemblages: Implications for subsurface temperature reconstructions. Marine Micropaleontology, 96-97:38–47. https://doi.org/10.1016/j.marmicro.2012.07.001
Jakobsson, M., Backman, J., Rudels, B., Nycander, J., Frank, M., Mayer, L., Jokat, W., Sangiorgi, F., O'Regan, M., Brinkhuis, H., King, J., and Moran, K., 2007. The Early Miocene onset of ventilated circulation regime in the Arctic Ocean. Nature, 447(7147):986–990. https://doi.org/10.1038/nature05924
Kirschvink, J.L., 1980. The least-squares line and plane and the analysis of palaeomagnetic data. Geophysical Journal International, 62(3):699–718. https://doi.org/10.1111/j.1365-246X.1980.tb02601.x
Kolawole, F., and Evenick, J.C., 2023. Global distribution of geothermal gradients in sedimentary basins. Geoscience Frontiers, 14(6):101685. https://doi.org/10.1016/j.gsf.2023.101685
Laberg, J.S., Stoker, M.S., Dahlgren, K.I.T., Haas, H.d., Haflidason, H., Hjelstuen, B.O., Nielsen, T., Shannon, P.M., Vorren, T.O., van Weering, T.C.E., and Ceramicola, S., 2005. Cenozoic alongslope processes and sedimentation on the NW European Atlantic margin. Marine and Petroleum Geology, 22(9–10):1069–1088. https://doi.org/10.1016/j.marpetgeo.2005.01.008
Lucchi, R.G., Camerlenghi, A., Rebesco, M., Colmenero-Hidalgo, E., Sierro, F.J., Sagnotti, L., Urgeles, R., Melis, R., Morigi, C., Bárcena, M.A., Giorgetti, G., Villa, G., Persico, D., Flores, J.A., Rigual-Hernández, A.S., Pedrosa, M.T., Macri, P., and Caburlotto, A., 2013. Postglacial sedimentary processes on the Storfjorden and Kveithola trough mouth fans: significance of extreme glacimarine sedimentation. Global and Planetary Change, 111:309–326.
https://doi.org/10.1016/j.gloplacha.2013.10.008
Lucchi, R., Kovacevic, V., Aliani, S., Caburlotto, A., Celussi, M., Corgnati, L., Cosoli, S., Ersdal, E.A., Fredriksson, S., Goszczko, I., Husum, K., G, I., Laberg, J., Łącka, M., Langone, L., P, M., K, M., Morigi, C., Realdon, G., and Tirelli, V., 2014. Present and past flow regime. On contourite drifts west of Spitsbergen. EUROFLEETS-2 Cruise Summary Report R/V G.O. Sars, Cruise No. 191. https://doi.org/10.13140/2.1.1975.3769
Lucchi, R.G., St. John, K.E.K., Ronge, T.A., Barcena, M.A., De Schepper, S., Duxbury, L.C., Gebhardt, A.C., Gonzalez-Lanchas, A., Goss, G., Greco, N.M., Gruetzner, J., Haygood, L., Husum, K., Iizuka, M., Kapuge, A.K.I.U., Lam, A.R., Libman-Roshal, O., Liu, Y., Monito, L.R., Reilly, B.T., Rosenthal, Y., Sakai, Y., Sijinkumar, A.V., Suganuma, Y., and Zhong, Y., 2026a. Expedition 403 methods. In Lucchi, R.G., St. John, K.E.K., Ronge, T.A., and the Expedition 403 Scientists, Eastern Fram Strait Paleo-Archive. Proceedings of the International Ocean Discovery Program, 403: College Station, TX (International Ocean Discovery Program). https://doi.org/10.14379/iodp.proc.403.102.2026
Lucchi, R.G., St. John, K.E.K., Ronge, T.A., Barcena, M.A., De Schepper, S., Duxbury, L.C., Gebhardt, A.C., Gonzalez-Lanchas, A., Goss, G., Greco, N.M., Gruetzner, J., Haygood, L., Husum, K., Iizuka, M., Kapuge, A.K.I.U., Lam, A.R., Libman-Roshal, O., Liu, Y., Monito, L.R., Reilly, B.T., Rosenthal, Y., Sakai, Y., Sijinkumar, A.V., Suganuma, Y., and Zhong, Y., 2026b. Site U1618. In Lucchi, R.G., St. John, K.E.K., Ronge, T.A., and the Expedition 403 Scientists, Eastern Fram Strait Paleo-Archive. Proceedings of the International Ocean Discovery Program, 403: College Station, TX (International Ocean Discovery Program). https://doi.org/10.14379/iodp.proc.403.103.2026
Lucchi, R.G., St. John, K.E.K., Ronge, T.A., Barcena, M.A., De Schepper, S., Duxbury, L.C., Gebhardt, A.C., Gonzalez-Lanchas, A., Goss, G., Greco, N.M., Gruetzner, J., Haygood, L., Husum, K., Iizuka, M., Kapuge, A.K.I.U., Lam, A.R., Libman-Roshal, O., Liu, Y., Monito, L.R., Reilly, B.T., Rosenthal, Y., Sakai, Y., Sijinkumar, A.V., Suganuma, Y., and Zhong, Y., 2026c. Sites U1621–U1623. In Lucchi, R.G., St. John, K.E.K., Ronge, T.A., and the Expedition 403 Scientists, Eastern Fram Strait Paleo-Archive. Proceedings of the International Ocean Discovery Program, 403: College Station, TX (International Ocean Discovery Program). https://doi.org/10.14379/iodp.proc.403.106.2026
Martini, E., 1971. Standard Tertiary and Quaternary calcareous nannoplankton zonation. Proceedings of the Second Planktonic Conference, Roma, 1970:739–785.
Matthiessen, J., and Knies, J., 2001. Dinoflagellate cyst evidence for warm interglacial conditions at the northern Barents Sea margin during marine oxygen isotope stage 5. Journal of Quaternary Science, 16(7):727–737. https://doi.org/10.1002/jqs.656
Matthiessen, J., Schreck, M., De Schepper, S., Zorzi, C., and de Vernal, A., 2018. Quaternary dinoflagellate cysts in the Arctic Ocean: potential and limitations for stratigraphy and paleoenvironmental reconstructions. Quaternary Science Reviews, 192:1–26. https://doi.org/10.1016/j.quascirev.2017.12.020
Meyers, P.A., 1994. Preservation of elemental and isotopic source identification of sedimentary organic matter. Chemical Geology, 114(3–4):289–302. https://doi.org/10.1016/0009-2541(94)90059-0
Meyers, P.A., 1997. Organic geochemical proxies of paleoceanographic, paleolimnologic, and paleoclimatic processes. Organic Geochemistry, 27(5–6):213–250. https://doi.org/10.1016/S0146-6380(97)00049-1
Oksman, M., Juggins, S., Miettinen, A., Witkowski, A., and Weckström, K., 2019. The biogeography and ecology of common diatom species in the northern North Atlantic, and their implications for paleoceanographic reconstructions. Marine Micropaleontology, 148:1–28. https://doi.org/10.1016/j.marmicro.2019.02.002
Raffi, I., 2002. Revision of the Early-Middle Pleistocene calcareous nannofossil biochronology (1.75–0.85 Ma). Marine Micropaleontology, 45(1):25–55. https://doi.org/10.1016/S0377-8398(01)00044-5
Raymo, M.E., Jansen, E., Blum, P., and Herbert, T.D. (Eds.), 1999. Proceedings of the Ocean Drilling Program, Scientific Results, 162: College Station, TX (Ocean Drilling Program). https://doi.org/10.2973/odp.proc.sr.162.1999
Razmjooei, M.J., Henderiks, J., Coxall, H.K., Baumann, K.-H., Vermassen, F., Jakobsson, M., Niessen, F., and O'Regan, M., 2023. Revision of the Quaternary calcareous nannofossil biochronology of Arctic Ocean sediments. Quaternary Science Reviews, 321:108382. https://doi.org/10.1016/j.quascirev.2023.108382
Rebesco, M., Hernández-Molina, F.J., Van Rooij, D., and Wåhlin, A., 2014a. Contourites and associated sediments controlled by deep-water circulation processes: state-of-the-art and future considerations. Marine Geology, 352:111–154. https://doi.org/10.1016/j.margeo.2014.03.011
Rebesco, M., Laberg, J.S., Pedrosa, M.T., Camerlenghi, A., Lucchi, R.G., Zgur, F., and Wardell, N., 2014b. Onset and growth of Trough-Mouth Fans on the North-Western Barents Sea margin – implications for the evolution of the Barents Sea/Svalbard Ice Sheet. Quaternary Science Reviews, 92:227–234. https://doi.org/10.1016/j.quascirev.2013.08.015
Rebesco, M., Wåhlin, A., Laberg, J.S., Schauer, U., Beszczynska-Möller, A., Lucchi, R.G., Noormets, R., Accettella, D., Zarayskaya, Y., and Diviacco, P., 2013. Quaternary contourite drifts of the Western Spitsbergen margin. Deep Sea Research, Part I: Oceanographic Research Papers, 79:156–168. https://doi.org/10.1016/j.dsr.2013.05.013
Richter, C., Acton, G., Endris, C., and Radsted, M., 2007. Technical Note 34: Handbook for shipboard paleomagnetists. Ocean Drilling Program. https://doi.org/10.2973/odp.tn.34.2007
Schiebel, R., and Hemleben, C., 2017. Planktic Foraminifers in the Modern Ocean: Berlin (Springer). https://doi.org/10.1007/978-3-662-50297-6
Shipboard Scientific Party, 1996. Site 986. In Jansen, E., Raymo, M.E., Blum, P., et al., Proceedings of the Ocean Drilling Program, Initial Reports, 162: College Station, TX (Ocean Drilling Program), 287–343. https://doi.org/10.2973/odp.proc.ir.162.109.1996
Spiegler, D., and Jansen, E., 1989. Planktonic foraminifer biostratigraphy of Norwegian Sea sediments: ODP Leg 104. In Eldholm, O., Thiede, J., Taylor, E., et al., Proceedings of the Ocean Drilling Program, Scientific Results, 104: College Station, TX (Ocean Drilling Program), 681–696. https://doi.org/10.2973/odp.proc.sr.104.157.1989
St. John, K.E.K., Lucchi, R.G., Ronge, T.A., Barcena, M.A., De Schepper, S., Duxbury, L.C., Gebhardt, A.C., Gonzalez-Lanchas, A., Goss, G., Greco, N.M., Gruetzner, J., Haygood, L., Husum, K., Iizuka, M., Kapuge, A.K.I.U., Lam, A.R., Libman-Roshal, O., Liu, Y., Monito, L.R., Reilly, B.T., Rosenthal, Y., Sakai, Y., Sijinkumar, A.V., Suganuma, Y., and Zhong, Y., 2026a. Site U1619. In Lucchi, R.G., St. John, K.E.K., Ronge, T.A., and the Expedition 403 Scientists, Eastern Fram Strait Paleo-Archive. Proceedings of the International Ocean Discovery Program, 403: College Station, TX (International Ocean Discovery Program). https://doi.org/10.14379/iodp.proc.403.104.2026
St. John, K.E.K., Lucchi, R.G., Ronge, T.A., Barcena, M.A., De Schepper, S., Duxbury, L.C., Gebhardt, A.C., Gonzalez-Lanchas, A., Goss, G., Greco, N.M., Gruetzner, J., Haygood, L., Husum, K., Iizuka, M., Kapuge, A.K.I.U., Lam, A.R., Libman-Roshal, O., Liu, Y., Monito, L.R., Reilly, B.T., Rosenthal, Y., Sakai, Y., Sijinkumar, A.V., Suganuma, Y., and Zhong, Y., 2026b. Site U1620. In Lucchi, R.G., St. John, K.E.K., Ronge, T.A., and the Expedition 403 Scientists, Eastern Fram Strait Paleo-Archive. Proceedings of the International Ocean Discovery Program, 403: College Station, TX (International Ocean Discovery Program). https://doi.org/10.14379/iodp.proc.403.105.2026
Stow, D.A.V., Kahler, G., and Reeder, M., 2002. Fossil contourites: type example from an Oligocene palaeoslope system, Cyprus. In Stow, D.A.V., Pudsey, C.J., Howe, J.A., Faugères, J.-C., and Viana, A.R. (Eds.), Deep-Water Contourite Systems: Modern Drifts and Ancient Series, Seismic and Sedimentary Characteristics. Geological Society, London, Memoirs, 22: 443–455. https://doi.org/10.1144/GSL.MEM.2002.022.01.31
Thierstein, H.R., Geitzenauer, K.R., Molfino, B., and Shackleton, N.J., 1977. Global synchroneity of late Quaternary coccolith datum levels validation by oxygen isotopes. Geology, 5(7):400–404. https://doi.org/10.1130/0091-7613(1977)5<400:GSOLQC>2.0.CO;2
Thomas, R.G., Guyodo, Y., and Channell, J.E.T., 2003. U channel track for susceptibility measurements. Geochemistry, Geophysics, Geosystems, 4(6):1050. https://doi.org/10.1029/2002GC000454
Weaver, P.P.E., and Clement, B.M., 1986. Synchroneity of Pliocene planktonic foraminiferal datums in the North Atlantic. Marine Micropaleontology, 10(4):295–307. https://doi.org/10.1016/0377-8398(86)90033-2
Wei, W., 1993. Calibration of Upper Pliocene-Lower Pleistocene nannofossil events with oxygen isotope stratigraphy. Paleoceanography and Paleoclimatology, 8(1):85–99. https://doi.org/10.1029/92PA02504