Wallace, L.M., Saffer, D.M., Barnes, P.M., Pecher, I.A., Petronotis, K.E., LeVay, L.J., and the
Expedition 372/375 Scientists
Proceedings of the International Ocean Discovery Program Volume 372B/375
publications.iodp.org

https://doi.org/10.14379/iodp.proc.372B375.207.2021
Data report: clay mineral assemblages within biocalcareous and volcaniclastic inputs to the Hikurangi subduction zone, IODP Expedition 372B/375 Sites U1520 and U1526, offshore New Zealand1
Michael B. Underwood2
Keywords: International Ocean Discovery Program; IODP; JOIDES Resolution; Expedition 372B/375; Hikurangi Subduction Margin Coring, Logging, and Observatories; Site U1520; Site U1526; clay mineral assemblages; Hikurangi Plateau; X-ray diffraction; pelagic carbonate sediments; volcaniclastic sediments
MS 372B375-207: Received 25 September 2020 · Accepted 10 June 2021 · Published 15 October 2021
Abstract
Inputs to the Hikurangi subduction zone, offshore North Island, New Zealand, include volcaniclastic conglomerates that were deposited during the Late Cretaceous on the flanks of the subducting basement of Hikurangi Plateau. The overlying succession of pelagic carbonates is early Paleocene to early Pleistocene in age and ranges in composition from calcareous mudstone to muddy chalk and chalk. A thick wedge of Quaternary trench sediments occupies the top of the stratigraphic succession. International Ocean Discovery Program Expedition 375 cored those subduction inputs at two sites. Site U1520 is located on the distal edge of the trench, and Site U1526 is located near the crest of Tūranganui Knoll, where a highly condensed section of pelagic-hemipelagic sediment covers the basalt basement. This report provides the results of 128 X-ray diffraction analyses of the clay-sized fraction (<2 µm spherical settling equivalent), where smectite + illite + undifferentiated (chlorite + kaolinite) + quartz = 100%. Clay minerals in the altered volcaniclastic conglomerates and basalt consist almost exclusively of smectite. At Site U1520, the normalized abundance of smectite in overlying biocalcareous sediments ranges from 28.3 to 72.9 wt% (mean = 54.2 wt%), whereas the abundance of illite ranges from 16.1 to 49.0 wt% (mean = 32.0 wt%). The range for undifferentiated chlorite + kaolinite is 0.3–17.8 wt% (mean = 7.4 wt%), and the range for clay-sized quartz is 2.7–20.5 wt% (mean = 6.4 wt%). Upsection depletion of smectite in those sediments is balanced by upsection enrichment of illite. That same age-dependent trend is evident in coeval biocalcareous drift sediments from Ocean Drilling Program Sites 1123 (North Chatham drift) and 1124 (Rekohu drift). Moving downsection at Site U1520, indicators of clay diagenesis are inconsistent. Values of illite crystallinity index increase (i.e., peak broadening), whereas the proportion of illite within illite/smectite mixed-layer clays increases with depth.
Introduction
International Ocean Discovery Program (IODP) Expeditions 372 and 375 were designed to study the dynamics of slow-slip events along the Hikurangi subduction interface (Saffer et al., 2019). The Hikurangi margin formed as a result of subduction of the Pacific plate beneath the overriding Australian plate. The IODP transect is located offshore Poverty Bay, North Island (New Zealand) (Figure F1A). The downgoing lithosphere in that area is part of a large igneous province known as the Hikurangi Plateau (Wood and Davy, 1994; Davy et al., 2008; Timm et al., 2014). The coring programs at IODP Sites U1520 and U1526 (Figure F1B, F1C) were designed to groundtruth seismic reflection interpretations of the subduction inputs (Davy et al., 2008; Saffer et al., 2017; Saffer et al., 2019). The primary goal for sampling at Site U1520 (Figure F2A) was to characterize the lithologies, structure, stratification, and initial frictional, geotechnical, and hydrogeological conditions in materials that are subsequently transported downdip along the subduction interface into the source area for slow-slip events (Saffer et al., 2017). The main goal for coring through the highly condensed section at Site U1526 (Figure F2B) was to recover igneous basement from the upper flanks of Tūranganui Knoll (Saffer et al., 2017), one of several seamounts scattered across the Hikurangi Plateau (Davy et al., 2008).
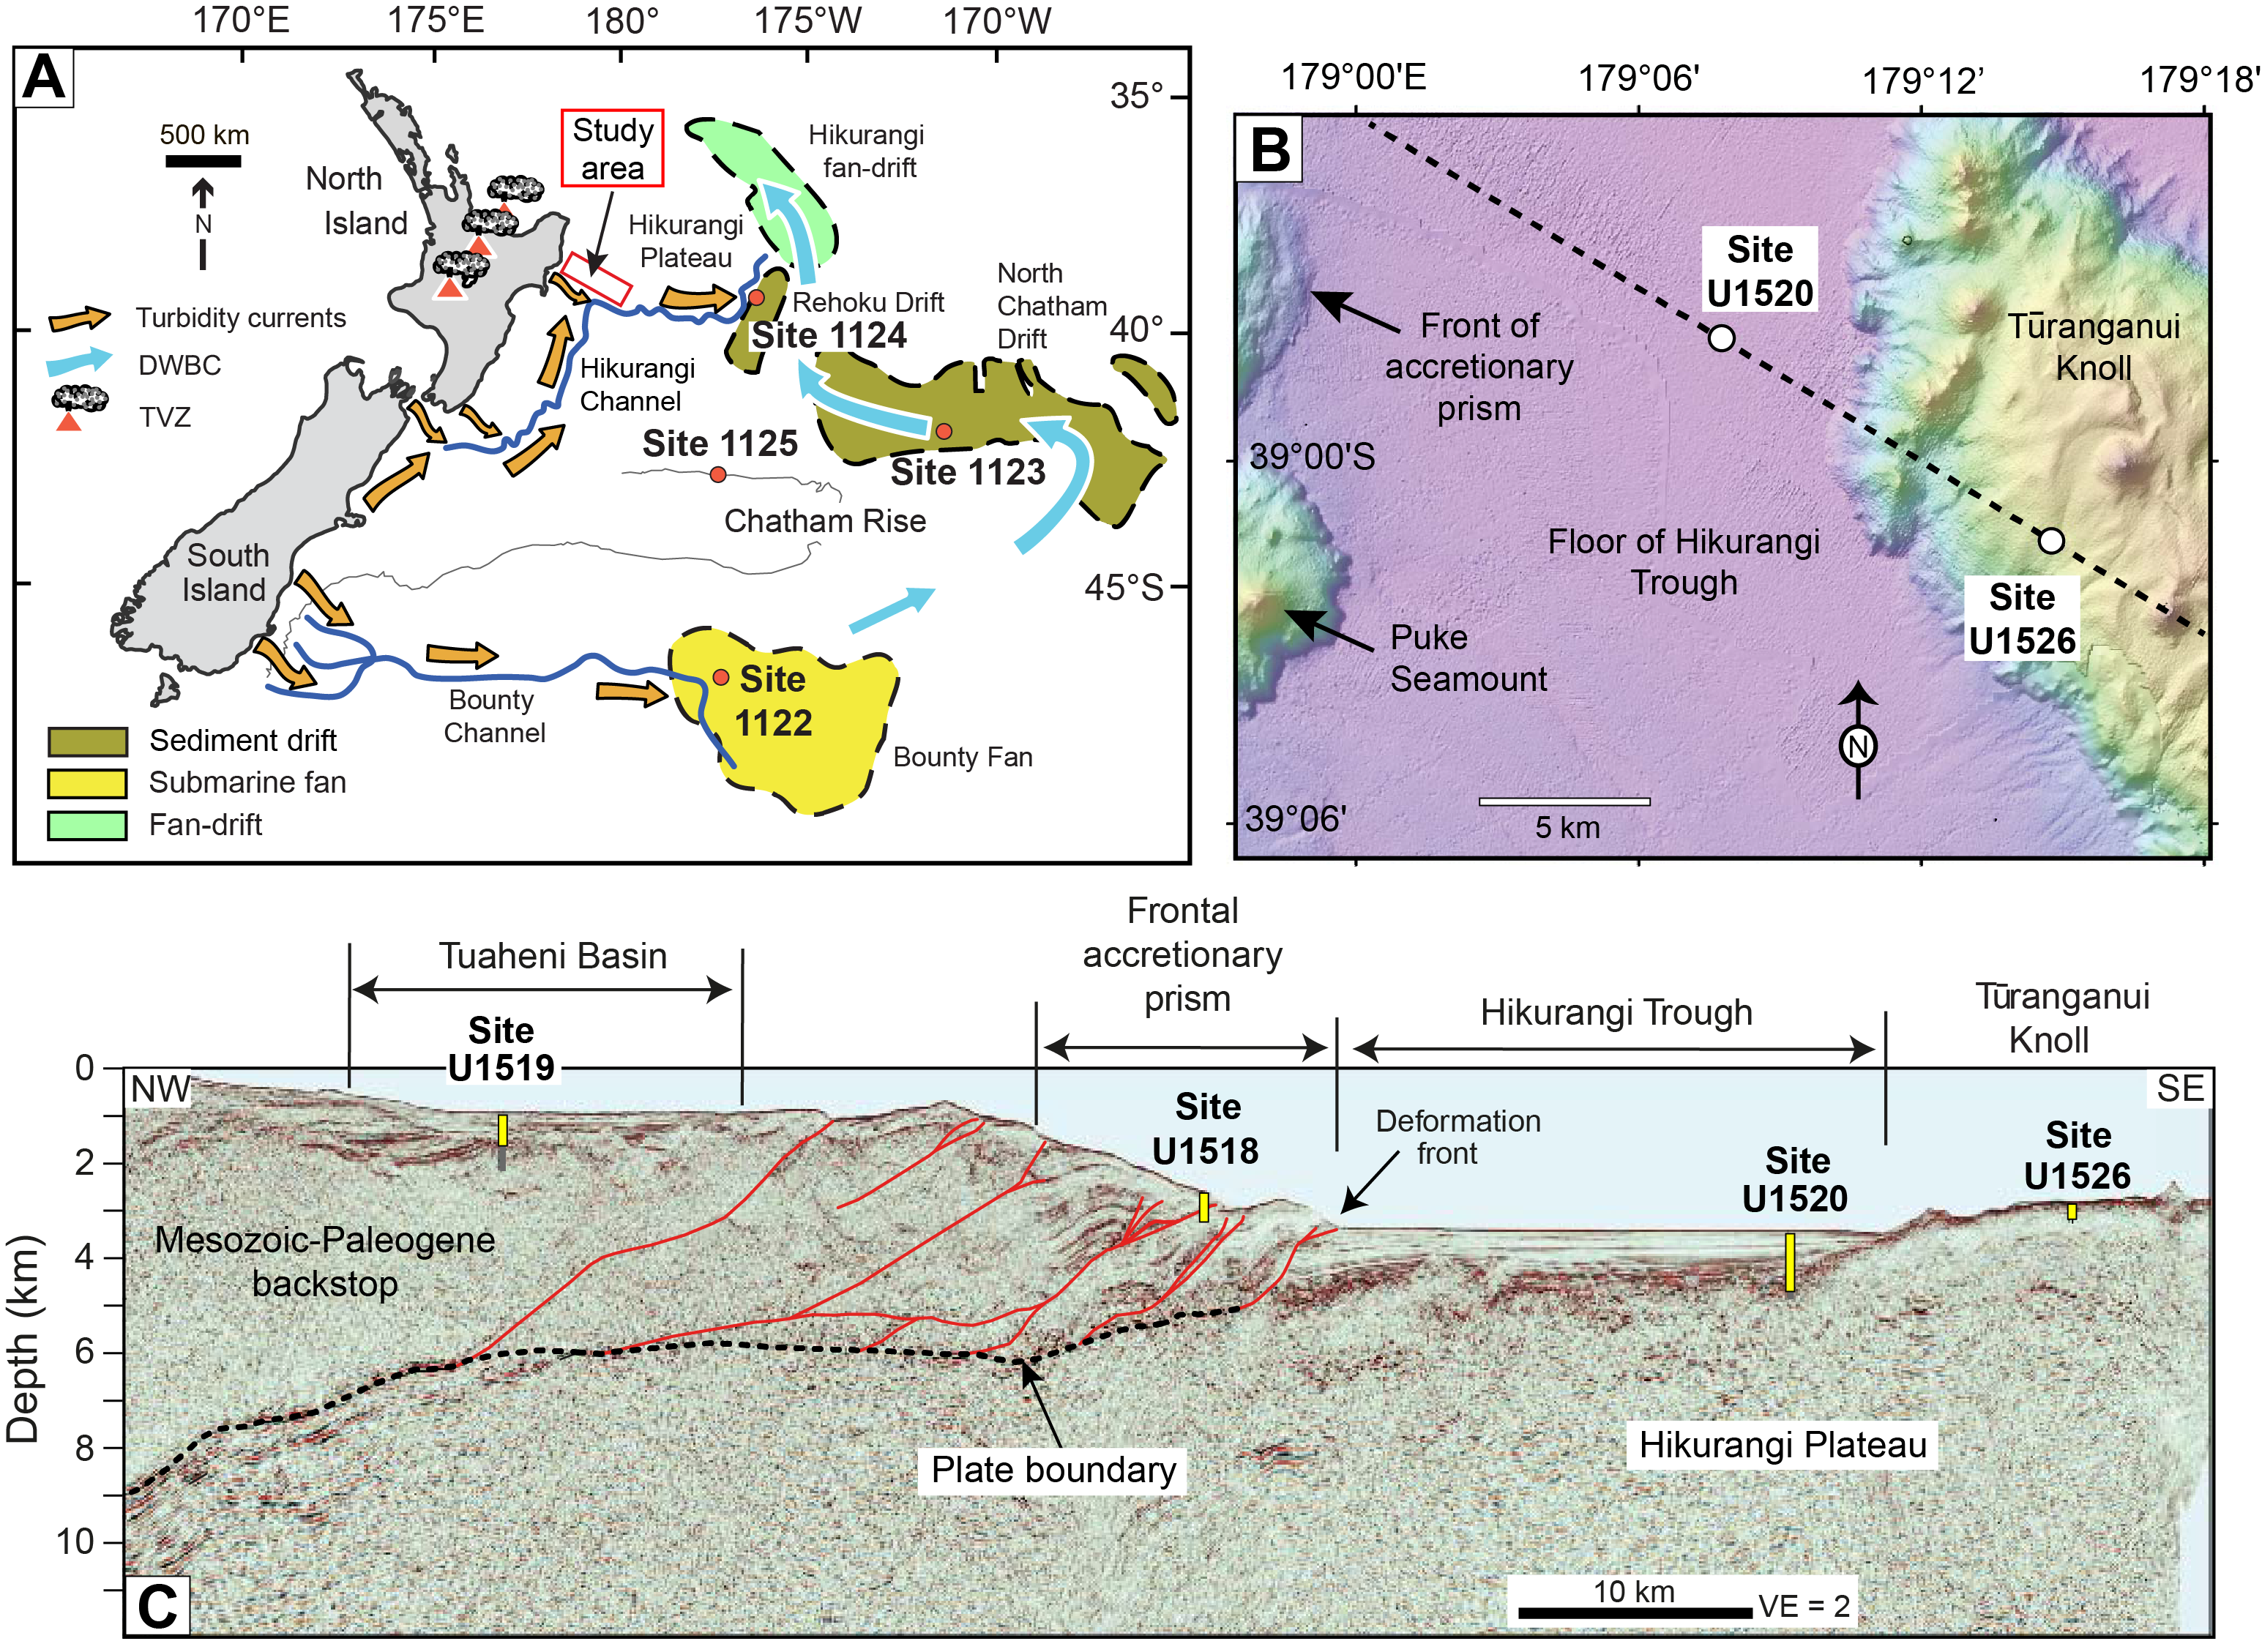
Figure F1. Site locations.
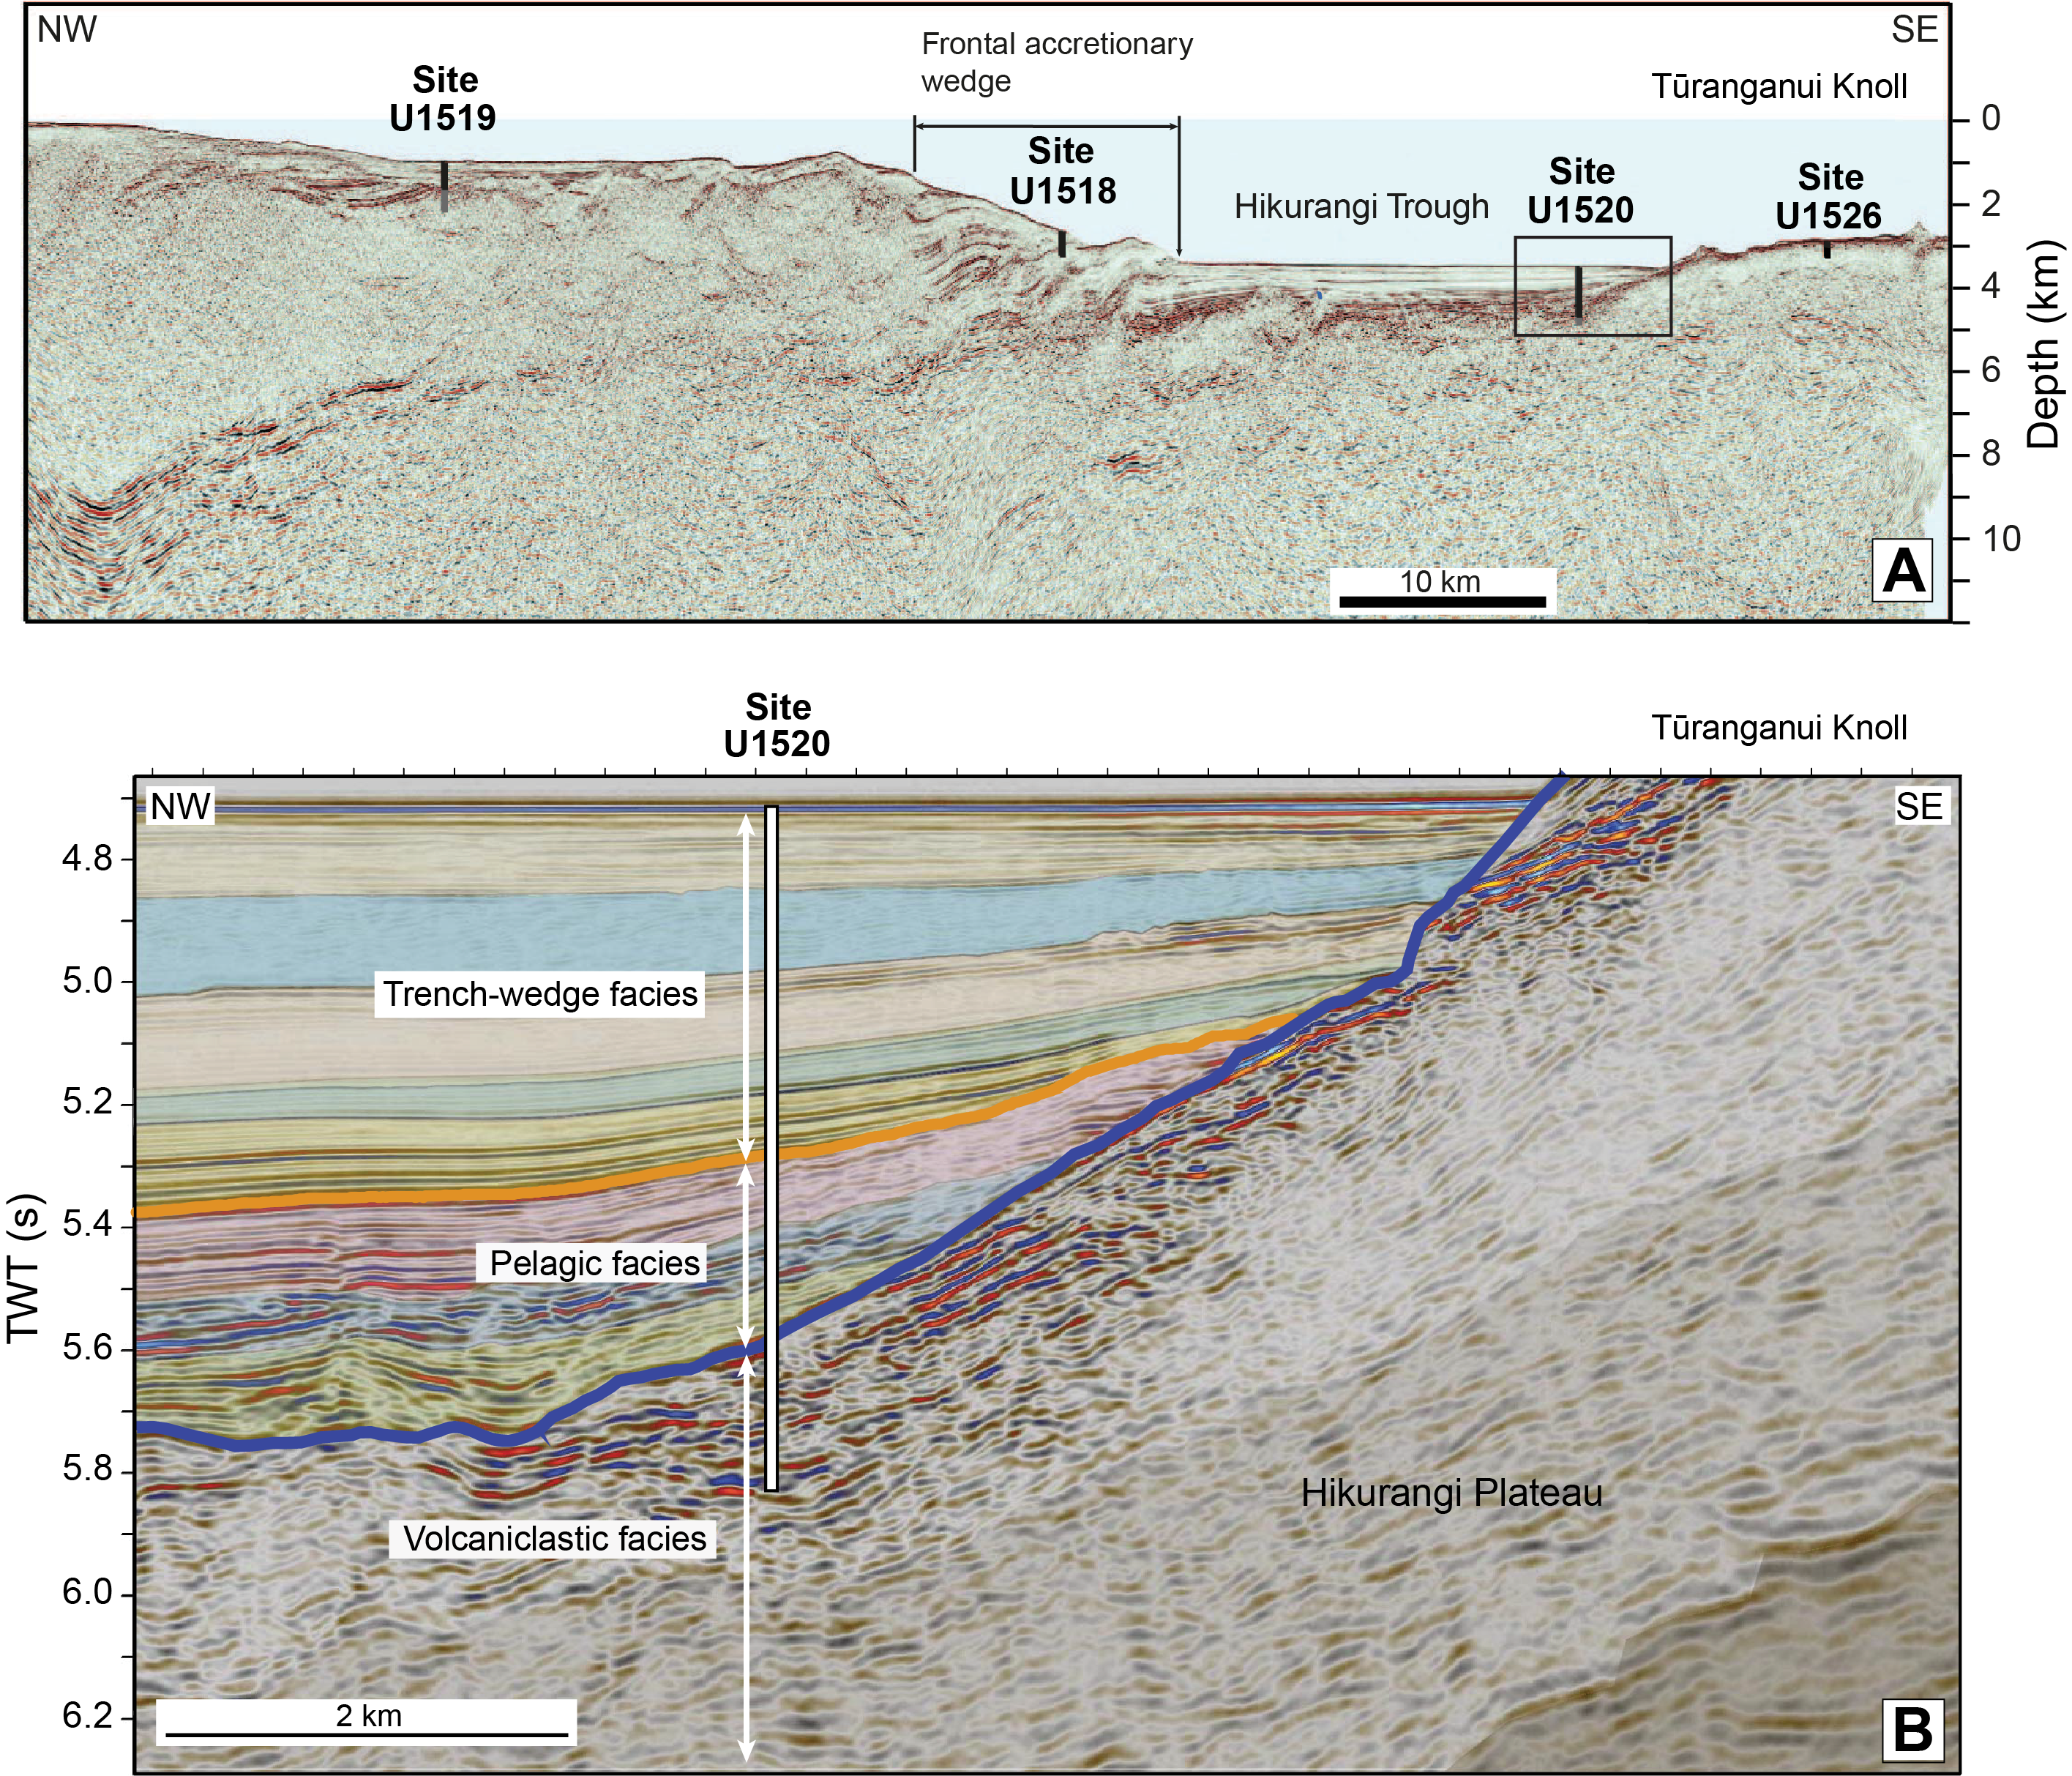
Figure F2. Seismic profiles.
This data report summarizes the results of 128 X-ray diffraction (XRD) analyses of clay mineral assemblages in pelagic carbonate (biocalcareous) and volcaniclastic specimens from Sites U1520 and U1526. The principal objective is to demonstrate whether or not stratigraphic variations in sediment composition, especially clay mineral assemblages, might influence rock properties that modulate the dynamics of fault slip along the deeper plate interface (e.g., Rabinowitz et al., 2018; Boulton et al., 2019; Barnes et al., 2020). A secondary objective is to provide constraints on interpretations of detrital provenance and sediment dispersal, especially from the Late Cretaceous through early Pleistocene when the Hikurangi Plateau was slowly subsiding and moving into the subduction zone. Such compositional data often serve as proxies for regional-scale reconstructions of paleoclimate, paleoceanography, and paleogeography (e.g., Petschick et al., 1996; Thiry, 2000; Gingele et al., 2001; Phillips et al., 2014). To facilitate assessments of age-dependent trends across the offshore New Zealand region, XRD results from Site U1520 can be combined with those from nearby Ocean Drilling Program (ODP) Sites 1123 and 1124. Those comparisons can be used to test for synchroneity of temporal trends. Collectively, the XRD data reported here also augment provisional, regional-scale documentation of clay composition, including other sites along the IODP transect (Underwood, 2020; Underwood, 2021; Underwood and Dugan, 2021).
Summary of lithostratigraphy
Site U1520
During Expedition 375, shipboard sedimentologists defined six lithostratigraphic units at Site U1520 by combining visual descriptions of the split cores, smear slide analyses, digital color, magnetic susceptibility logs, and logging-while-drilling results (Barnes et al., 2019). Units I–III comprise the Quaternary trench wedge (Figure F2), where common lithologies include fine sand to silt beds (inferred turbidites), volcanic ash, and hemipelagic mud (i.e., silty clay to clayey silt with modest amounts of biogenic carbonate). Fossils in Units I–III range in age from early Pleistocene (1.62 Ma) at ~503 meters below seafloor (mbsf) to Holocene at the seafloor (Barnes et al., 2019). The XRD results for the clay-sized fraction of sediments in those units are included in a separate data report (Underwood, 2021).
Lithostratigraphic Unit IV (509.82–848.45 mbsf) is composed mostly of lithified pelagic carbonate sediments. Microfossils range in age from early Paleocene (64.81 Ma) to middle to early Pleistocene (1.62 Ma) (Barnes et al., 2019). Contents of calcium carbonate vary considerably within this interval and show no clear depth-dependent trend (Figure F3). The specific lithologies, based on carbonate content, range from calcareous mudstone to muddy chalk and chalk (i.e., lithified nannofossil ooze). The term “marl” is used here to cover the compositional span from 25 to 75 wt% carbonate. Recrystallization of calcareous nannofossils to microcrystalline calcite (micrite) is more pronounced below ~600 mbsf (Barnes et al., 2019). Scattered layers of matrix-supported conglomerate, containing both intraformational (carbonate) and extraformational (basaltic) clasts, were interpreted to be debris-flow deposits (Barnes et al., 2019). Layers of tuff (lithified volcanic ash) also appear locally. Two paraconformities were identified within the marl, one near the base of the Oligocene and the other in the Eocene; both hiatuses were relatively brief (Figure F3). The contact between Units III and IV was not recovered, but a pronounced unconformity separates Units IV and V (Barnes et al., 2019).
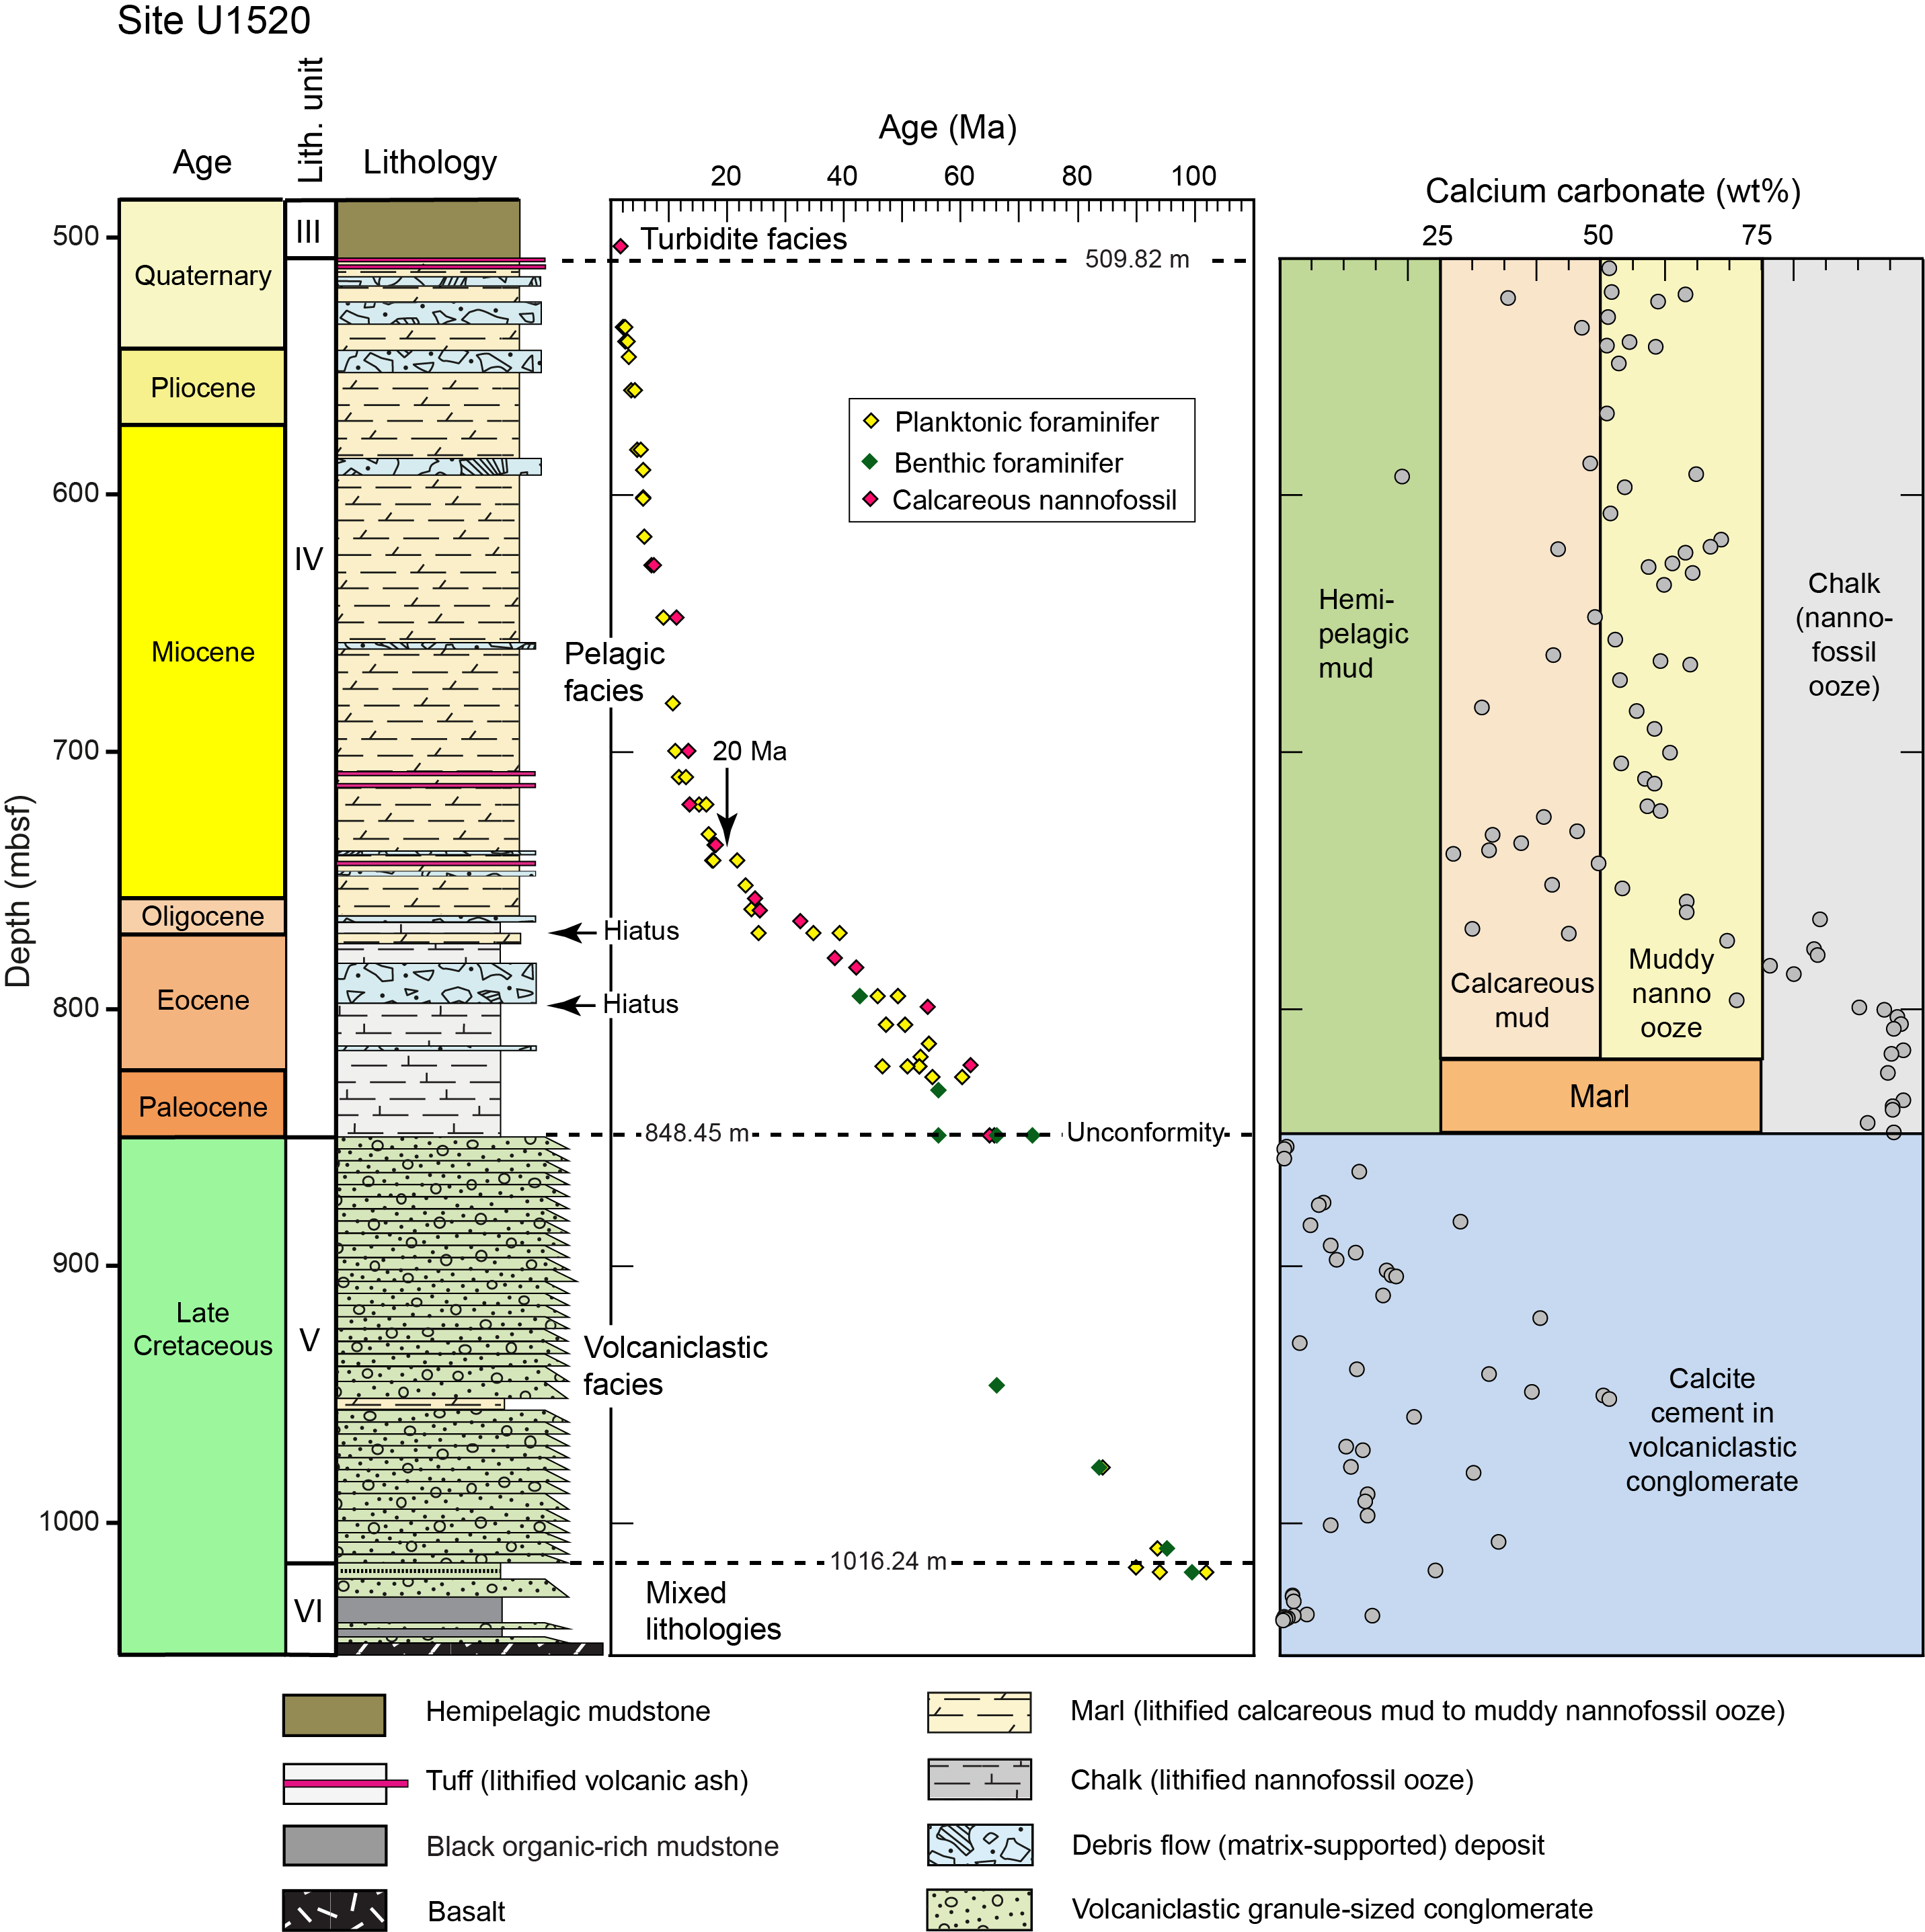
Figure F3. Stratigraphic column, Site U1520.
The lithology most characteristic of Unit V (848.45–1016.24 mbsf) is granule-sized volcaniclastic conglomerate with well-rounded to subrounded clasts of basalt (Figure F3); both clast-supported and matrix-supported varieties of conglomerate are common. Except near the unit’s base, these coarse-grained deposits are barren of fossils. The only distinctive change in lithology in Unit V occurs between 949.76 and 953.65 mbsf (Figure F3), where an interval of marl with red laminae contains scattered basalt clasts. Microfossils from the marl range in age from 84 to 66 Ma, and foraminifers near the base of Unit V yield early Late Cretaceous ages (Barnes et al., 2019). The inferred transport mechanisms for the conglomerate are grain flow and debris flow (Barnes et al., 2019). The uniformity of both clast size and shape is unusual, but similar gravity-flow transport mechanisms have been inferred for deposits on the flanks of many other seamounts and volcanic islands around the world (e.g., Wright, 1996; Saint-Ange et al., 2013; Quartau et al., 2018). Extensive abrasion of the basalt and efficient sorting of clasts are signs of vigorous mechanical weathering and staging of the sediment in relatively shallow water prior to resedimentation as part of a debris fan (Barnes et al., 2019). Most intervals of the conglomerate display pervasive alteration of the basaltic protolith to clay, whereas others are cemented by zeolite and/or calcite (Figure F3). Wood and Davy (1994) described samples from dredge-haul recoveries on the Hikurangi Plateau with comparable levels of basalt alteration to smectite.
Unit VI at Site U1520 (1016.24–1045.75 mbsf) remains enigmatic, and the unit boundary is indistinct. This unit contains an unusual assortment of lithologies: granule-sized volcaniclastic conglomerate, gray siltstone, white limestone, black (organic-rich) mudstone, and vesicular basalt (Figure F3). Microfossils from the sedimentary rocks are early Late Cretaceous in age (~90–102 Ma) (Barnes et al., 2019). Primary stratigraphic relations are unrecognizable because of poor recovery and pervasive coring disturbance. Interpretations of depositional environment are speculative, but the high contents of organic carbon in black mudstone (up to 14.6 wt%) are indicative of localized anoxia. In addition, C/N ratios and data from source rock analyses reflect mixtures of marine and terrestrial (Types II and III) kerogen (Barnes et al., 2019). Studies of comparable petroleum source rocks show that terrestrial organic matter can be transported to the outer shelf and upper slope (e.g., Naeher et al., 2019), so kerogen type should be regarded as an inconclusive indicator of paleowater depth.
Site U1526
Shipboard sedimentologists defined two lithostratigraphic units at Site U1526, which is positioned near the crest of Tūranganui Knoll (Figure F2A). The units were defined by incorporating visual descriptions of the split cores, smear slide observations, digital color, and magnetic susceptibility logs (Wallace et al., 2019b).
Lithostratigraphic Unit I (0–30.23 mbsf) comprises a highly condensed section of hemipelagic to pelagic carbonate sediment. Contents of calcite decrease progressively upsection, from corresponding lithologies of chalk at the unit’s base to clay-rich hemipelagic mud at the top (Figure F4). Microfossil age ranges from Late Cretaceous to Quaternary (Wallace et al., 2019b). An unconformity at 28.7 mbsf coincides with an unusually long hiatus, and the unit’s base at 30.23 mbsf is marked by another unconformity with manganese concretions (Wallace et al., 2019b). The highly condensed section and occurrence of two unconformities are probably consequences of strong perturbations of seawater circulation around the crest of Tūranganui Knoll. Erosive physical processes, including tide-generated currents, seamount-trapped waves, sustained bottom currents, and mesoscale eddies, have been documented above many other seamounts around the world (e.g., Turnewitsch et al., 2013; Chen et al., 2015; Read and Pollard, 2017; Pollard and Read, 2017).

Figure F4. Stratigraphic column, Site U1526.
Unit II at Site U1526 (30.23–81.39 mbsf) contains two primary lithologies. The first consists of well-rounded, coarse-grained volcaniclastic sand with abundant bivalve shells (Figure F4). The second is volcaniclastic conglomerate with well-rounded to subangular clasts of vesicular basalt. The unconsolidated sand was probably deposited in relatively shallow water when the crest of Tūranganui Knoll was close to or above sea level (Wallace et al., 2019b). Compared to those at Site U1520, the basaltic conglomerate at U1526 is noticeably less altered and the clasts are far more heterogeneous in size and shape. Dimensions of the largest clasts appear to be in the range of boulders (1–2 m), and the variety of clast-matrix organization is exclusively clast supported (Wallace et al., 2019b). Specimens of coraline algae recovered from sandy matrix between basalt clasts are Late Cretaceous in age and characteristic of water depths in the photic zone (Wallace et al., 2019b). Thus, Unit II at Site U1526 appears to represent the proximal (near-shore to subaerial) equivalents to the finer grained volcaniclastic conglomerates at Site U1520 (Unit V).
Site 1124
ODP Site 1124 is located ~600 km east of North Island, New Zealand, on a northeast–southwest trending ridge known as the Rekohu drift (Figure F1A). Water depth at the drill site is 3978 meters below sea level (mbsl). Multiple sources and transport pathways are likely for this accumulation of sediment (R.M. Carter et al., 2004). The most obvious route for prolonged sediment delivery is via a strong bottom current, known as the Deep Western Boundary Current (DWBC), which flows north after circumventing the Chatham Rise (Figure F1A). The DWBC is thought to be the main physical agent responsible for molding the Rekohu contourite drift and sustaining suspensions of sediment in the nepheloid layer (Carter et al., 1996; Carter and Wilkin, 1999). Bounty Channel, which is located far to the south of Site 1124 in the Bounty Trough (Figure F1A), has been responsible for injecting terrigenous clays into the upstream reaches of the DWBC (Hall et al., 2002; L. Carter et al., 2004); that route for resupplying the DWBC can be tracked farther upstream to terrigenous sources on South Island, New Zealand (Carter and Mitchell, 1987; Carter et al., 1996; Horn and Uenzelmann-Neben, 2016). At times, a vigorous Antarctic Circumpolar Current also may have supplemented supplies of suspended sediment entering upstream parts of the circulation system (Hall et al., 2002). The contourite drifts formed by DWBC activity in the Bounty Trough are as old as 16.7–20 Ma (Horn and Uenzelmann-Neben, 2015), and the oldest dated turbidites associated with Bounty Fan are 11–16 Ma in age (Shapiro et al., 2007; Marsaglia et al., 2011). Thus, from the early Miocene to Holocene, terrigenous sediment seems to have routed through the Bounty Trough by gravity flows, with persistent bottom-current transport in the downstream direction around the Chatham Rise and toward the Rekohu drift.
A second likely source for sediment moving into the vicinity of Site 1124 is the Hikurangi Channel (Lewis, 1994; Lewis et al., 1998), which escapes the confines of the trench near Hawke’s Bay (Figure F1A) and meanders toward the north-northeast past the Rekohu drift (Carter et al., 1996; McCave and Carter, 1997; Carter and McCave, 2002). Seismic reflection profiles show eastward onlap of the channel’s right-hand levee onto the drift sediments (Carter and McCave, 1994, 2002; Shipboard Scientific Party, 1999b; Davy et al., 2008). Mass accumulation rates at Site 1124 increased modestly at ~1.6 Ma in response to enhanced terrigenous influx (Hall et al., 2002; Joseph et al., 2004); funneling of turbidity currents through proximal stretches of the Hikurangi Channel probably intensified around the same time (Lewis, 1994; Lewis et al., 1998; Lewis and Pantin, 2002; R.M. Carter et al., 2004). Those interpretations regarding accelerated turbidite channel activity are consistent with the early Pleistocene ages reported at Site U1520 for the base of the present-day trench wedge (Barnes et al., 2019).
During ODP Leg 181, coring at Site 1124 penetrated ~473 m into the thick drift sediments, revealing a diverse stratigraphic succession that shipboard scientists divided into six lithologic units (Figure F5). The age span of the sediments is Late Cretaceous to Quaternary, and the integrated age-depth model is based largely on nannofossil datums and paleomagnetic interpretations (Shipboard Scientific Party, 1999b). The names of carbonate-rich lithologies have been adjusted on Figure F5 to conform to the classification scheme that was used during Expedition 375 (Wallace et al., 2019a). Reconnaissance of these deposits by XRD analysis was designed to test for potential synchroneity in detrital provenance and dispersal paths relative to Site U1520 (Figure F3).
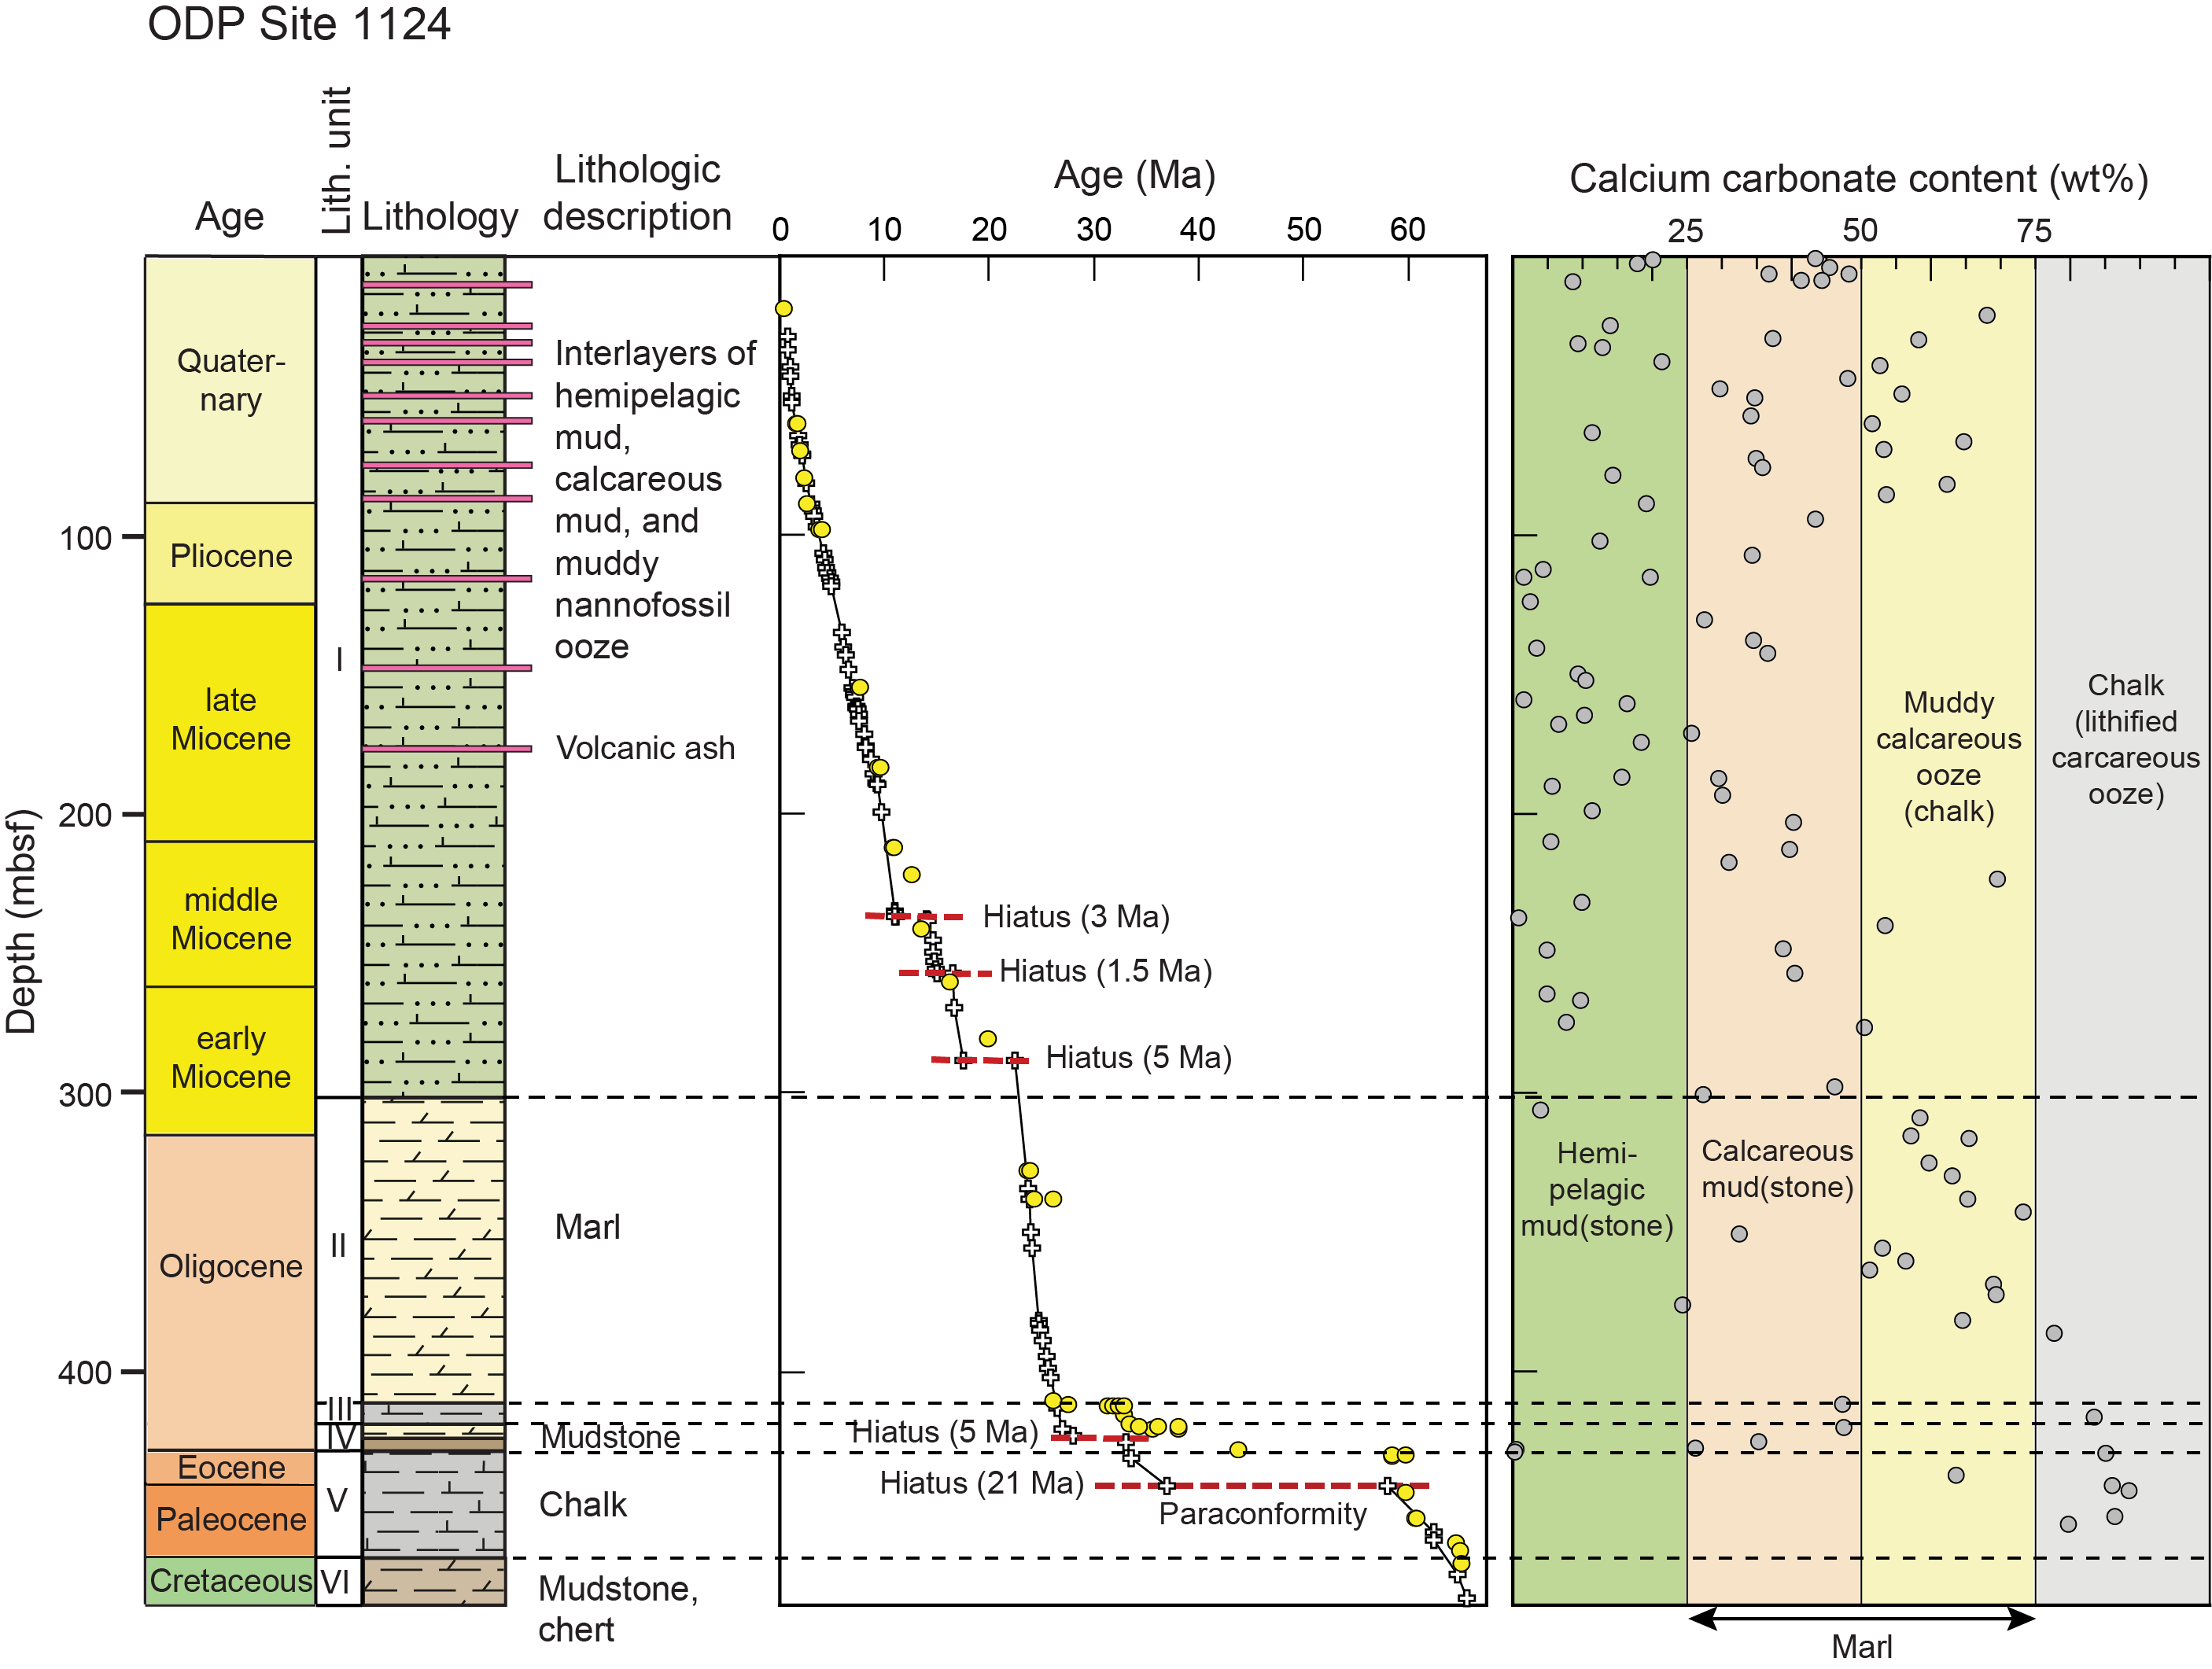
Figure F5. Stratigraphic column, ODP Site 1124.
Unit I at Site 1124 (0–302.5 mbsf) consists of alternating layers of fine-grained carbonate ooze (calcareous mud to muddy nannofossil ooze) and hemipelagic mud (silty clay to clayey silt) together with scattered layers of volcanic ash (Figure F5). In spite of the site’s proximity to the right-hand levee of Hikurangi Channel, turbidites are seemingly absent. The base of Unit I extends into the lower Miocene (Shipboard Scientific Party, 1999b) and has an extrapolated age of ~21 Ma (Figure F5). Shipboard Scientific Party (1999b) interpreted carbonate-rich intervals in Unit I as interglacial deposits (i.e., highstands of sea level with enhanced biologic productivity), whereas the clay-rich hemipelagic intervals were regarded as glacial-period deposits (lowstands of sea level with enhanced terrigenous influx). Three paraconformities with hiatuses of 1.5 to 5 My were recognized within the unit (Shipboard Scientific Party, 1999b; Joseph et al., 2004). Those periods of erosion or nondeposition were attributed to cycles of more intense bottom water formation around Antarctica, thereby strengthening the erosive capacity of the DWBC (Joseph et al., 2004).
Unit II (302.5–411.5 mbsf) is more homogeneous in composition (biocalcareous-rich) than Unit I. The top of Unit II does not match with any noticeable changes in the rate of mass accumulation (Joseph et al., 2004). Instead, the Unit I/II boundary is represented by an indistinct shift from the mixed pelagic/hemipelagic facies above to marl (calcareous mudstone to muddy chalk) below (Shipboard Scientific Party, 1999b). The base of Unit II has a maximum age of ~26 Ma (late Oligocene) and is marked by an unconformity (Shipboard Scientific Party, 1999b).
Stratigraphic relations below Unit II are messier than those above because of incomplete recovery, multiple unconformities, and discrepancies between fossil ages and paleomagnetic interpretations. These older units are also comparatively thin and more diverse in composition (Figure F5). Unit III (411.5–419.3 mbsf) consists of white chalk and has nannofossil ages of 31–33 Ma (Shipboard Scientific Party, 1999b; Boulton et al., 2019). Unit IV (419.3–429.0 mbsf) includes calcareous mudstone and a distinctive interval of brownish, clay-rich mudstone and has fossil ages of middle to late Eocene (35–38 Ma). Paleomagnetic data (Figure F5) reveal an unusually long hiatus (58–37 Ma) across the base of Unit IV; that unit boundary is correlative with a regional feature known as the Marshall Paraconformity (Carter, 1985; Fulthorpe et al., 1996). The hiatus at Site 1124 was attributed to initiation of erosive DWBC inflow into the southwest Pacific (Carter and McCave, 1994; R.M. Carter et al., 2004). Unit V (429.0–467.4 mbsf), which is situated immediately below the paraconformity, is early Paleocene in age (58–64 Ma) and composed of muddy chalk and chalk (Shipboard Scientific Party, 1999b; Boulton et al., 2019). Unit VI (467.4–473.1 mbsf) contains variegated mudstone and scattered chert lenses of Late Cretaceous age (Shipboard Scientific Party, 1999b). Drilling was terminated before reaching seismic-reflection intervals that were interpreted to be volcaniclastic deposits and/or basement rocks of the Hikurangi Plateau (Davy et al., 2008).
Site 1123
ODP Site 1123 is located on the northeastern slope of the Chatham Rise within the North Chatham drift at a water depth of 3290 mbsl (Figure F1A). The primary objective of drilling there was to document the onset and subsequent effects of DWBC circulation on drift sedimentation at an intermediate position along the transport route between the Bounty Trough and the Rekohu drift (Shipboard Scientific Party, 1999a). The North Chatham drift is a “plastered” type, forming an apron of contourites that extends from water depths of ~2000 to >4500 mbsl (Carter and McCave, 2002). The drift accumulation reaches a total thickness of ~600 m at Site 1123, with ages spanning from the late Eocene to Quaternary (Figure F6). The present-day direction of DWBC transport along the north flank of Chatham Rise is west (Figure F1A), and the current speed there is slower than along the south flank of the rise (Carter and McCave, 1997; Carter and Wilkin, 1999). In addition to nepheloid-layer redistribution by the DWBC (Carter and McCave, 2002), sediment suspensions in the surface water and biological productivity above the North Chatham drift are modulated largely by the east-directed East Cape Current and the position of the Subtropical Convergence Zone (Carter et al., 2000; Nelson et al., 2000). Synchroneity in pulses of terrigenous influx to Sites 1123 and 1124 can be recognized prior to ~1.6 Ma, but the North Chatham drift was evidently immune to the frequent turbidity currents that passed through the Hikurangi Channel toward the Rekohu drift (Hall et al., 2002). Clay mineral assemblages from these two sets of deposits can be used to verify or refute interpretations of temporal changes in detrital provenance and dispersal pathways.
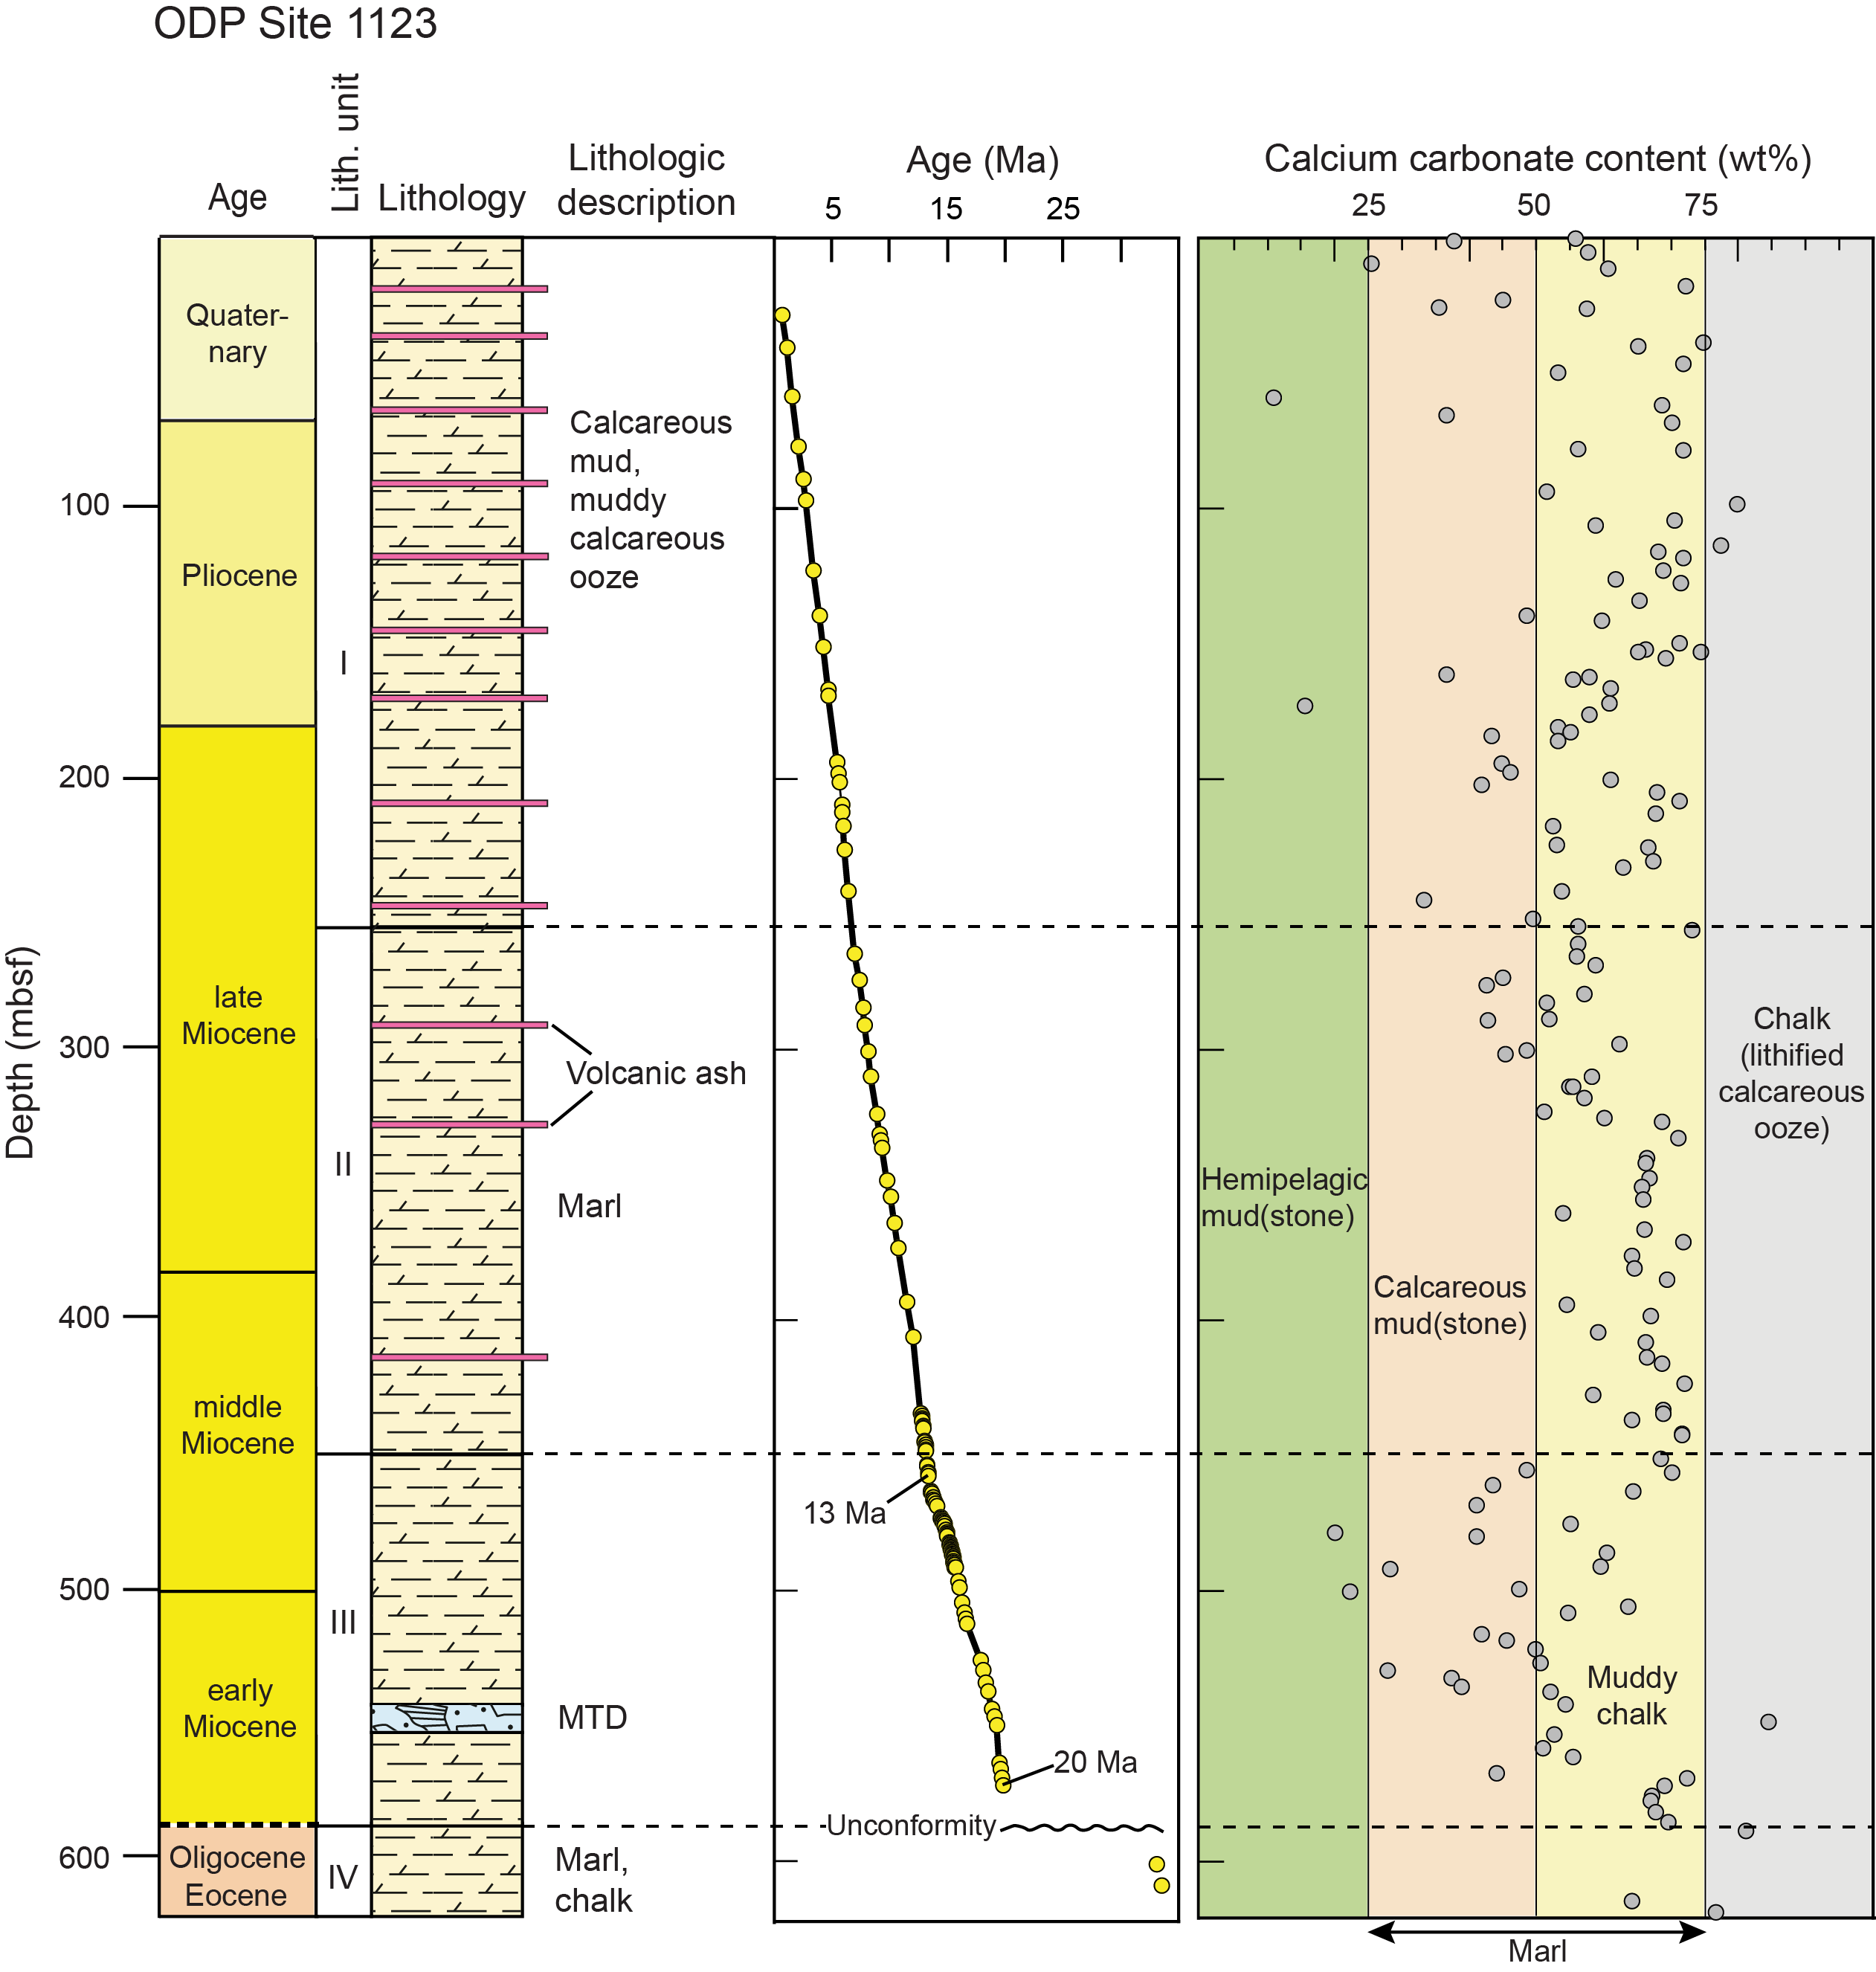
Figure F6. Stratigraphic column, ODP Site 1123.
Four lithologic units were identified during Leg 181 in the cored interval at Site 1123 (Shipboard Scientific Party, 1999a). The names of carbonate-rich lithologies have been adjusted on Figure F6 to conform to the classification scheme that was used during IODP Expedition 375 (Wallace et al., 2019a). The age-depth model for this succession (Figure F6) is based largely on magnetostratigraphy (Shipboard Scientific Party, 1999a; Winkler and Dullo, 2002).
Most of the deposits assigned to Lithologic Unit I (0–256.6 mbsf) fall within the bounds of classification for calcareous mud to muddy nannofossil ooze (Figure F6). Tephra (volcanic ash) layers are also scattered throughout Unit I. Fossil ages range from the late Miocene to Quaternary (Shipboard Scientific Party, 1999a). Variations in color and carbonate content in Unit I were attributed to cyclic glacial–interglacial oscillations and temporal variations in biopelagic productivity (Shipboard Scientific Party, 1999a; Hall et al., 2002; L. Carter et al., 2004). This unit, however, is consistently more enriched in biogenic carbonate than the coeval glacial/interglacial deposits at Site 1124 (Figure F5).
The age range for Unit II (256.6–450.8 mbsf) is middle to late Miocene (Shipboard Scientific Party, 1999a). Lithologies assigned to this unit are also characterized by relatively high calcium carbonate content but show more uniformity, falling mostly within the classification span for muddy chalk (Figure F6). This interval of cores, like those in Unit I, contains scattered layers of volcanic ash. In harmony with their lithologic similarities, sedimentation rates did not change appreciably across the Unit I/II boundary (Figure F6).
Unit III (450.8–587.2 mbsf) is early to middle Miocene in age. This interval contains a fairly diverse mixture of calcareous mudstone and muddy chalk (Figure F6), but the upper boundary of the unit is indistinct. The interval from 453 to 550 mbsf (Figure F6) contains a chaotic assemblage of lithified chalk clasts in a matrix of contorted marl, interpreted to be a debris-flow deposit that originated from a more elevated position on the north slope of the Chatham Rise (Shipboard Scientific Party, 1999a). The base of Unit III is a pronounced unconformity that correlates in time with the regional Marshall Paraconformity (Carter, 1985; Fulthorpe et al., 1996). The hiatus at Site 1123 (~12 My) was considerably shorter than the equivalent hiatus (~21 My) at Site 1124 (Shipboard Scientific Party, 1999b). Immediately beneath the paraconformity, strata assigned to Unit IV (587.2–632.8 mbsf) are late Eocene to early Oligocene in age. Those predrift lithologies consist of marl and chalk (Figure F6).
Methods
Samples
The working halves of split cores from Sites U1520 and U1526 were used to obtain 112 specimens for XRD analyses. Most such samples were colocated in “clusters” immediately adjacent to whole-round specimens. Some of those whole-round specimens were analyzed shipboard for interstitial water geochemistry (Barnes et al., 2019), whereas others were collected for shore-based tests of hydrogeological, frictional, and geotechnical properties (e.g., Jeppson and Kitajima, 2019). The “clusters” also included specimens for shipboard measurements of moisture and density, carbon-carbonate, and bulk-powder XRD (Wallace et al., 2019a). Descriptions of the 16 samples analyzed from Site 1124 are included in a separate data report (Underwood, 2020). The XRD sampling strategy for Site 1123 was outlined by Winkler and Dullo (2002).
Sample preparation
Several steps are required to isolate the clay-sized fraction (<2 µm) in sediments and sedimentary rocks for XRD analyses. The first step with lithified siliciclastic and volcaniclastic sediments is to gently crush air-dried fragments with a mortar and pestle. Splits of the coarse powder are then transferred to a 600 mL beaker with 2% hydrogen peroxide to initiate disaggregation and remove organic matter. Next, the disaggregated sediment is suspended in ~250 mL of Na hexametaphosphate solution (concentration of 4 g/1000 mL distilled H 2O). Beakers with suspended sediment are inserted into an ultrasonic bath for several minutes to promote dispersion and retard flocculation of the clays. Next, suspensions are washed of solutes by two passes through a centrifuge (8000 revolutions per minute [rpm] for 20 min; ~6000 × g) with resuspension in distilled deionized water after each pass. After that step, the suspensions are transferred to 125 mL plastic bottles and dispersed by vigorous shaking plus insertion of an ultrasonic cell probe for ~2.5 min. Clay-sized splits (<2 μm equivalent spherical settling diameter) are separated from the silt and sand by centrifugation (1000 rpm for 3.6 min; ~320 × g).
Most of the biocalcareous deposits from Site U1520 (Lithostratigraphic Unit IV) and Site 1124 contain significant concentrations of calcium carbonate that are high enough to impede quantitative XRD analyses of the clay minerals. Removal of the calcite was accomplished by boiling crushed samples in a buffered solution of sodium acetate and acetic acid at a pH of ~5.0. The procedure summarized by Moore and Reynolds (1989b) was followed for the specimens of calcareous mudstone and muddy chalk (i.e., carbonate contents between 25 and 75 wt%). Specimens of nearly pure chalk (carbonate contents >75 wt%) were excluded from the XRD study. The acid-treated specimens were washed of residual chemicals and dissolved solutes before starting the sequence of steps outlined in the paragraph above. A similar approach was followed by Winkler and Dullo (2002) for the carbonate-rich deposits at Site 1123.
Most of the Site U1526 specimens analyzed consist of volcanic rock (basalt) with modest amounts of clay, calcite, and zeolite alteration. Powdering those specimens was accomplished onboard JOIDES Resolution using a puck mill for 1 min on freeze-dried splits, similar to the procedures for bulk-powder XRD (Wallace et al., 2019a). In some cases, milling introduced calcite cement, amorphous volcanic glass, and/or primary igneous minerals (e.g., plagioclase) into the clay-sized fraction, thereby compromising the accuracy of mineral abundance computations. Accordingly, the XRD results for Site U1526 should be regarded as no better than semiquantitative.
Oriented clay aggregates for all varieties of specimens were prepared following the filter-peel method (Moore and Reynolds, 1989b) using 0.45 μm filter membranes and glass discs. This approach improves preferred orientation, which enhances the intensity of basal reflections for the clays. To saturate the clay aggregates with ethylene glycol, clay-covered discs were placed in a closed vapor chamber at room temperature for ~48 h. This last step expands the interlayer of smectite to ~17Å, which minimizes overlap between the peaks associated with smectite (001) and chlorite (001) reflections (Figure F7).
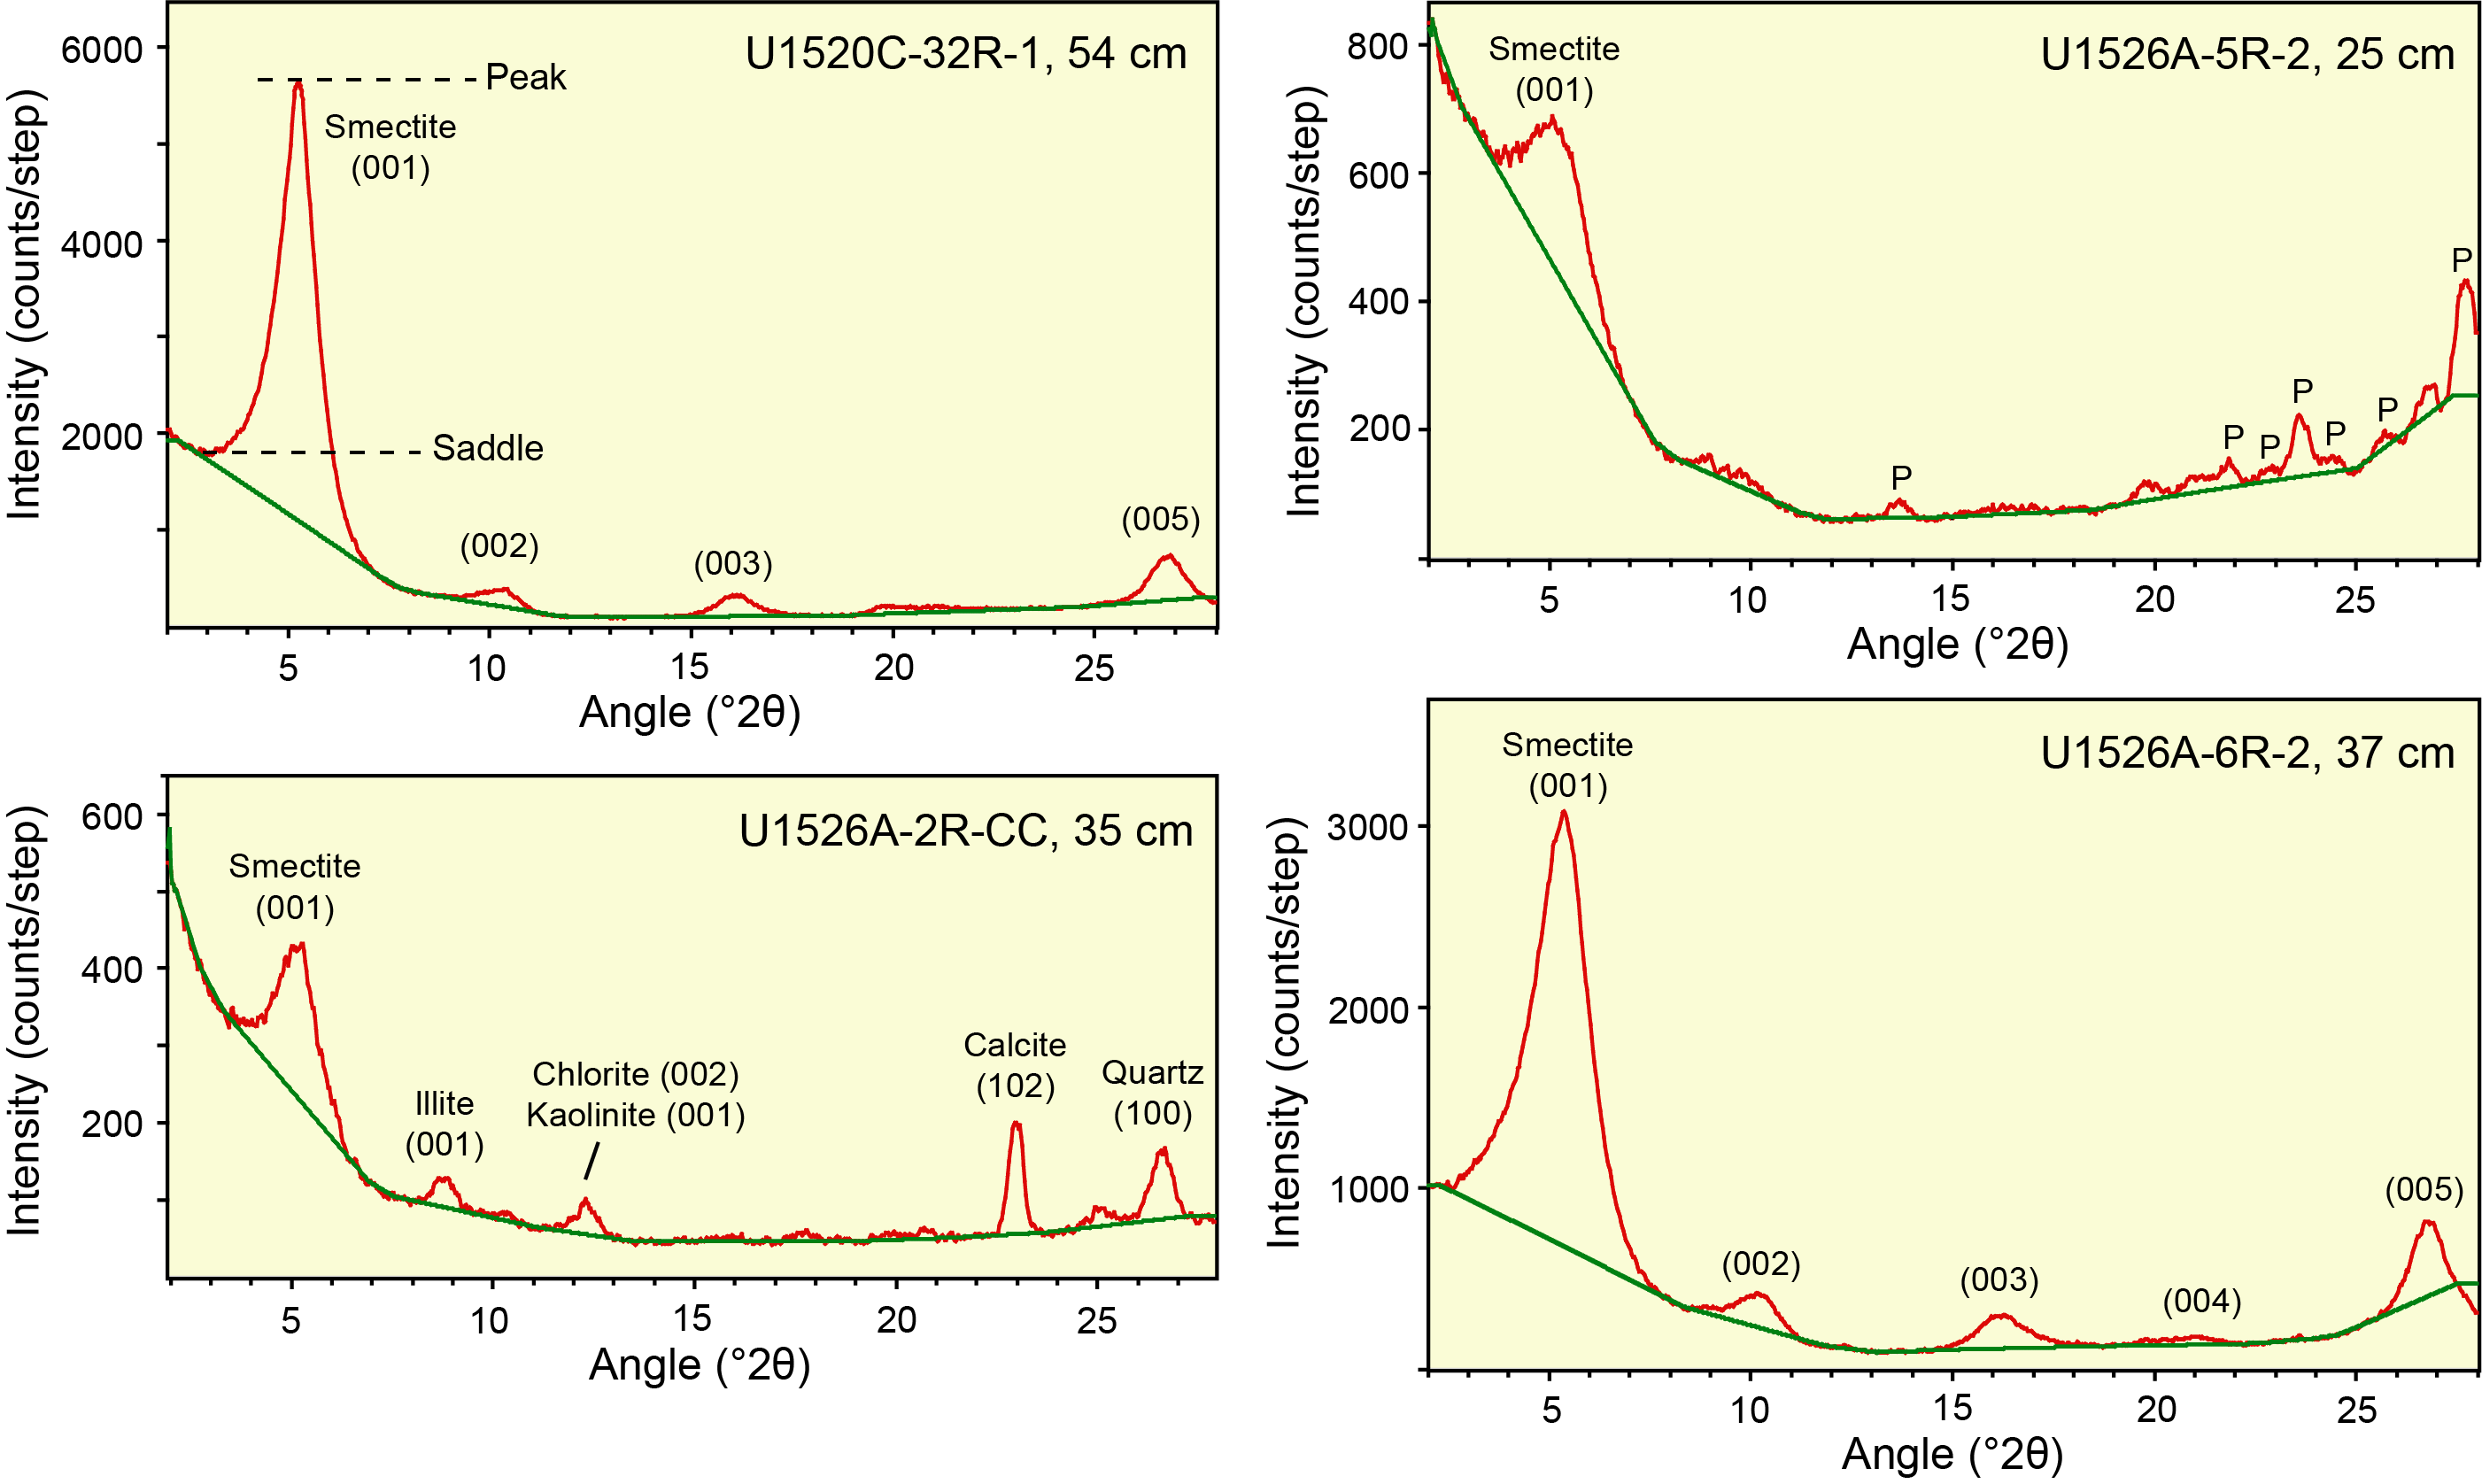
Figure F7. X-ray diffractograms.
X-ray diffractometer settings
The oriented clay aggregates were analyzed at the New Mexico Bureau of Geology and Mineral Resources using a Panalytical X’Pert Pro diffractometer under the following parameters: generator settings of 45 kV and 40 mA; angular range = 2°–28.0°2θ; scan step time = 1.6 s; step size = 0.01°2θ; sample holder = stationary; slits fixed at 0.5 mm (divergence) and 0.1 mm (receiving); specimen length = 10 mm. Raw data files were processed using MacDiff software (version 4.2.5) to establish a baseline of intensity, smooth counts, correct peak positions offset by slight misalignments of the detector and sample holder (using the quartz 100 peak at 20.95°2θ), record peak intensities (counts/step), and compute integrated peak areas (total counts). Four representative diffractograms are shown in Figure F7 with identification of the diagnostic peaks for smectite, illite, undifferentiated (chlorite + kaolinite), and quartz. Subsidiary peaks associated with calcite and plagioclase are also identified.
Computations of mineral abundance
Computations of relative abundance for each of the common clay-sized minerals are based on values of integrated peak area using the smectite (001), illite (001), chlorite (002) + kaolinite (001), and quartz (100) reflections (Figure F7). As scrutinized in more detail by Underwood et al. (2020), three computational approaches were utilized:
- Biscaye (1965) peak-area weighting factors, which are equal to 1× smectite, 4× illite, and 2× undifferentiated (chlorite + kaolinite);
- A set of regression equations that relate peak area to weight percent, where smectite + illite + undifferentiated (chlorite + kaolinite) + quartz = 100%; and
- A matrix of singular value decomposition (SVD) normalization factors (see Fisher and Underwood [1995] and Underwood et al. [2003] for a full description of the SVD approach), also where smectite + illite + undifferentiated (chlorite + kaolinite) + quartz = 100% (Table T1).
The method of Guo and Underwood (2011) was used to compute proportions of chlorite to kaolinite within that two-component mixture. One limitation of the Biscaye (1965) approach is that it does not account for clay-sized quartz, a component that can influence geotechnical and frictional properties. To permit reliable comparisons among the three sets of computational results, the weight percent values from SVD and regression were renormalized to a three-component, clay-only assemblage, where smectite + illite + undifferentiated (chlorite + kaolinite) = 100%. Comparisons among the clay minerals are probably most relevant for studies of detrital provenance and sediment dispersal.
When using either SVD factors or regression equations, the sum of the four main relative abundance values is sometimes less than 100%, and that outcome (i.e., suppression of peak intensity) is often caused by filter-peel transfers that are too thin (i.e., less than “infinite” thickness). Another contributing factor, however, might be inclusion of additional minerals or amorphous solids within the clay-sized fraction (e.g., feldspar, volcanic glass shards, biogenic silica, biogenic calcite, and calcite cement). In this study, weak peak intensities for the clay minerals can be blamed on incomplete acid digestion of carbonate-rich specimens (Site U1520) and on milling the relatively fresh basaltic specimens (Site U1526). Under both sets of circumstances, the mineral assemblage used in standard mineral mixtures (Underwood et al., 2020) provides a poor match with those in natural clay-sized specimens. The four relative abundance values were normalized to 100%, but absolute accuracy remains compromised for such specimens.
As documented thoroughly by Underwood et al. (2020), errors of accuracy, as determined by XRD data from standard mineral mixtures, are largest (as high as ±18.6%) when the Biscaye (1965) weighting factors are used in computations. The average absolute errors of accuracy are smallest when regression equations are used for computations: illite = 3.0 wt%, undifferentiated (chlorite + kaolinite) = 5.1 wt%, and smectite = 3.9 wt%. Errors using SVD factors are slightly larger than those using regression equations (Underwood et al., 2020). Accordingly, all of the graphical plots in this report and statistical comparisons among sites and lithostratigraphic units use data computed from the regression equations. Compositional differences are not considered to be geologically significant unless those differences are greater than the errors of accuracy shown above.
In addition to their dubious accuracy, Biscaye-based computations systematically overestimate the proportion of undifferentiated (chlorite + kaolinite) and systematically underestimate the proportion of illite in standard mineral mixtures (Underwood et al., 2020). These systematic shifts are obvious in the computed results for trench-floor facies at Sites U1518 and U1520 (Figure F8). Furthermore, Biscaye-computed estimates for %smectite tend to be systematically lower than regression-computed values at lower concentrations (<25 wt%) and systematically higher than regression-computed values at higher concentrations (>35 wt%). In spite of these drawbacks, Biscaye-computed values are tabulated in this report to permit direct comparisons with legacy data from previous XRD studies of Site 1123 (Winkler and Dullo, 2002). To improve statistical comparisons among sites, the Biscaye-computed estimates of Winkler and Dullo (2002) were converted to regression-equation equivalents using the equations shown in Figure F8.
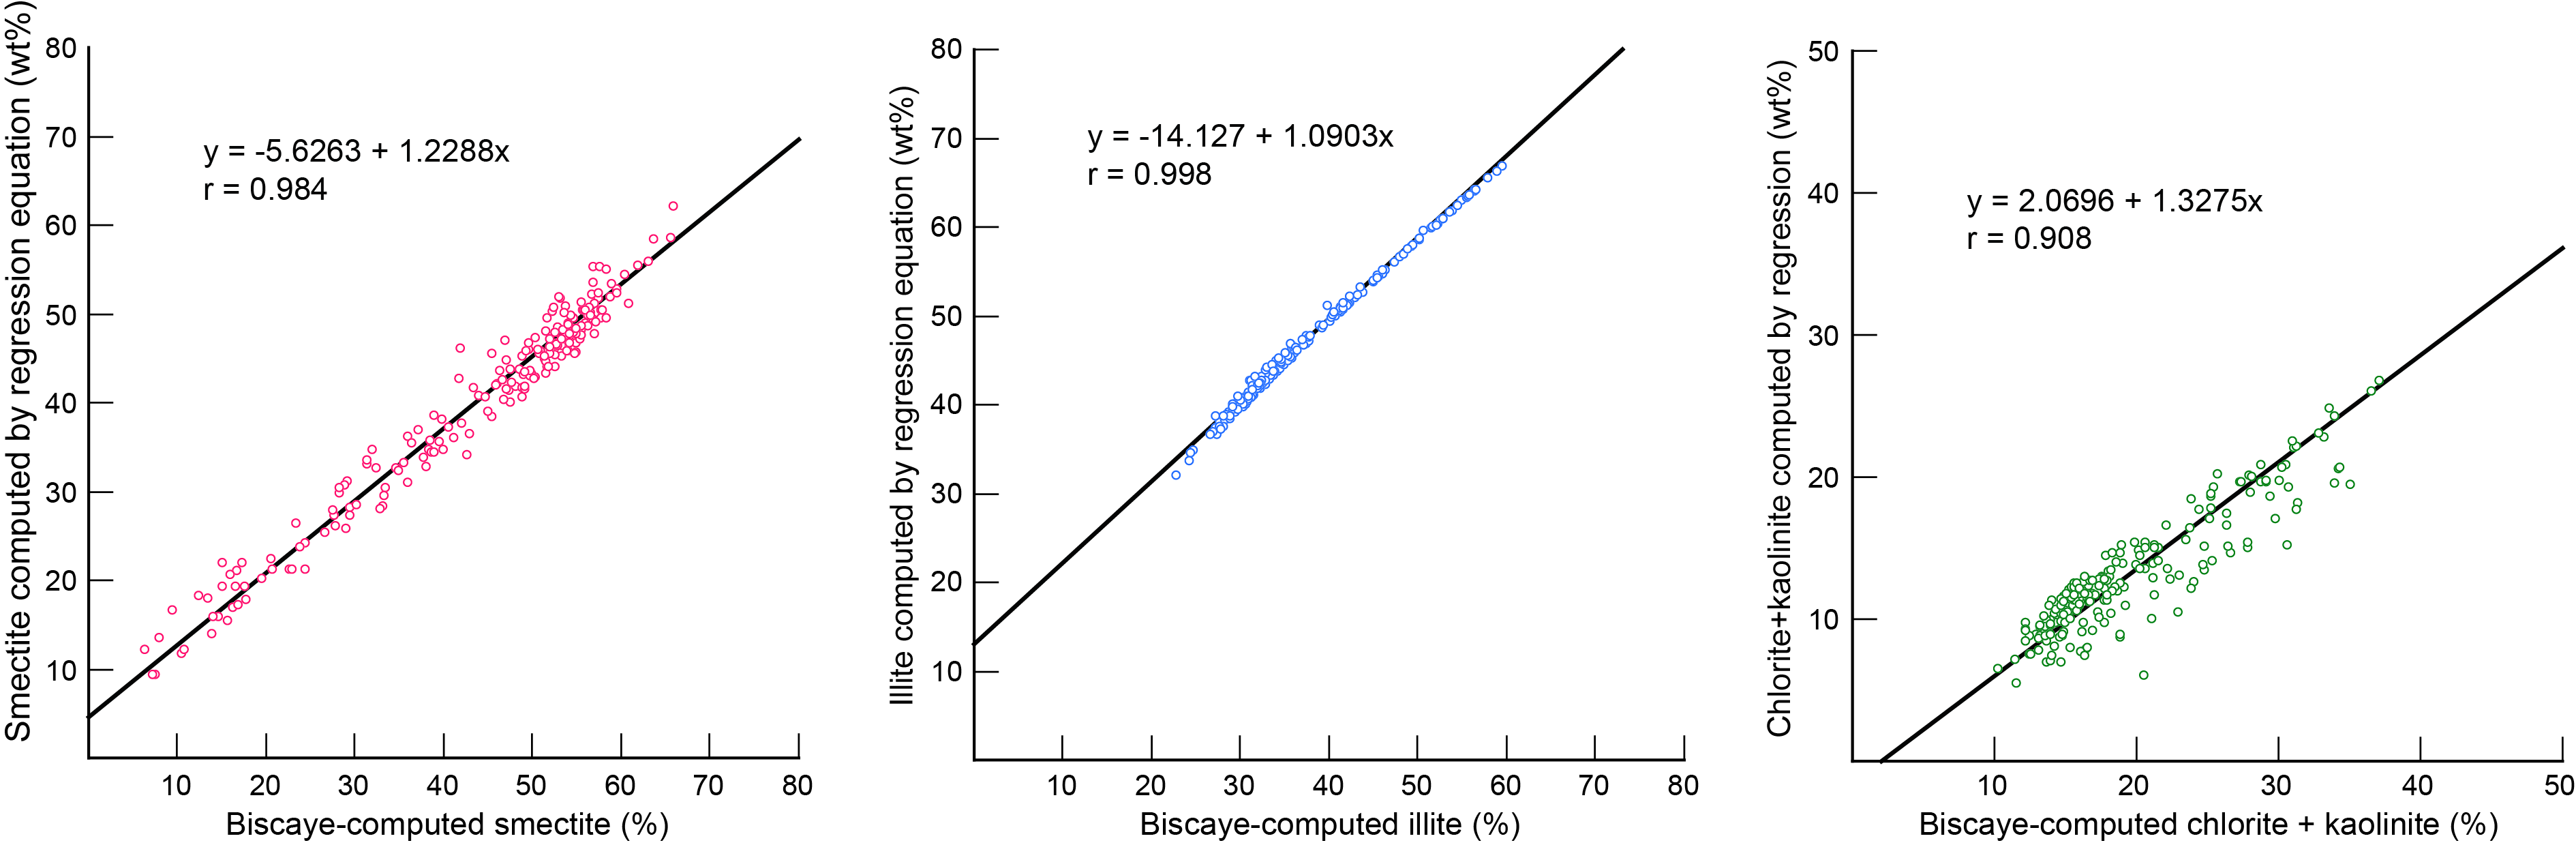
Figure F8. Computed weight percent values for common clay minerals.
For some XRD applications (e.g., interpretation of frictional behavior or geotechnical tests), it is useful to know the normalized weight percent for each variety of clay mineral (e.g., smectite) in the bulk sediment. To accomplish that, the normalized relative abundance of total clay minerals, as obtained from shipboard bulk-powder XRD (Barnes et al., 2019; Wallace et al., 2019b), was multiplied by the computed weight percent value for each specific clay mineral (e.g., smectite) in the clay-only assemblage. As an example, if the proportion of total clay minerals equals 43 wt% and the proportion of smectite among the clay minerals equals 52 wt%, then the estimated amount of smectite in the bulk sediment equals 21.8 wt%. A key assumption here is that all of the clay minerals reside in the clay-sized fraction, as defined by spherical equivalent (Stokes’) setting behavior.
Indicators of clay diagenesis
Given the burial depths of samples analyzed from Lithostratigraphic Units IV–VI at Site U1520 (510–1045 mbsf), together with the projected in situ temperature of ~40°C at the bottom of the cored interval (Barnes et al., 2019), diagenetic reactions involving common clay minerals are a remote possibility. The onset of smectite-to-illite diagenesis, for example, is known to begin at ~58°C along the US Gulf Coast (e.g., Freed and Peacor, 1989). This comparison of thermal conditions assumes, of course, that the geothermal gradient at Site U1520 has not changed significantly over time. To test for signs of reaction progress, the saddle:peak intensity ratio (Figure F7) was used to compute the “expandability” of smectite plus whatever illite/smectite (I/S) mixed-layer clay might be included in the assemblage (Rettke, 1981). This method is sensitive to the proportions of discrete illite versus I/S mixed-layer clay, so the curve for a 1:1 mixture of illite and (smectite + I/S) was chosen.
The second way to quantify smectite-to-illite reaction progress is by measuring the proportion of illite in the I/S mixed-layer clay. Under normal circumstances, computation of that proportion requires an accurate visual pick of the angular position (°2θ) of the composite I(002)/S(003) peak after correcting the diffractogram for misalignment using the quartz (101) or quartz (100) peak (Figure F7). With progressive illitization, the (002)/(003) peak shifts systematically to higher angles (Moore and Reynolds, 1989a). Determination of %illite is reliable, however, only when the intensity of the I/S peak is high enough to resolve a clear apex above background noise. For smectite-rich samples without detectable concentrations of quartz, correction of peak positions was not possible, so the computation of %illite was based on angular separation (Δ°2θ) between the stronger I(002)/S(003) peak at ~15.9°2θ and the weaker I(001)/S(002) peak at ~10.2°2θ (Figure F7). With progressive illitization, separation between the two I/S peaks increases (Moore and Reynolds, 1989a).
Illite crystallinity is another common XRD measure of diagenesis and incipient metamorphism in siliciclastic rocks (e.g., Kisch, 1991; Ferreiro Mählmann and Frey, 2012; Warr and Ferreiro Mählmann, 2015). The crystallinity index, otherwise known as the Kübler Index, is equal to peak width at half maximum (units = Δ°2θ) for the illite (001) peak (Figure F7). Those peaks narrow as the assemblage of illite plus illitic white mica becomes more crystalline with advanced burial diagenesis.
Results
Clay mineral assemblages at Site U1520
XRD measurements were completed on 92 specimens from the pelagic carbonate, volcaniclastic, and mixed-sediment units at Site U1520 (Table T2). The computed values of normalized weight percent, using the three computational approaches (Biscaye, regression, and SVD), are listed in Table T3.
Smectite is generally the most abundant clay-sized mineral within Lithostratigraphic Unit IV, with proportions ranging from 28.3 to 72.9 wt%; the mean value (µ) for smectite is 54.2 wt%, and the standard deviation (σ) is 11.4. Contents of illite range from 16.1 to 49.0 wt% (µ = 32.0 wt%; σ = 9.0), and percentages of undifferentiated chlorite + kaolinite range from 0.3 to 17.8 wt% (µ = 7.4 wt%; σ = 4.0). Close examination of the overlapping chlorite (004) and kaolinite (002) peaks shows that kaolinite is subordinate to chlorite and has an average abundance of only 1.2 wt%. The abundance of clay-sized quartz ranges from 2.7 to 20.5 wt% (µ = 6.4 wt%; σ = 2.8). Figure F9 shows the trends as a function of depth. Proportions of smectite decrease significantly upsection, balanced by large upsection increases in illite and smaller upsection increases in undifferentiated chlorite + kaolinite. Quartz content remains consistently low throughout the unit. The abundance of total clay minerals (i.e., relative to quartz, feldspar, and calcite in the bulk sediment) changes considerably within the carbonates (Figure F10). Trends among the individual clay minerals also reveal upsection decreases in smectite that are balanced by upsection increases in illite (Figure F10). Mean values for the clays are 58.0 wt% for smectite, 34.1 wt% for illite, and 7.9 wt% for chlorite + kaolinite (Table T3).

Figure F9. Normalized relative abundance values of minerals in the clay-sized fraction.
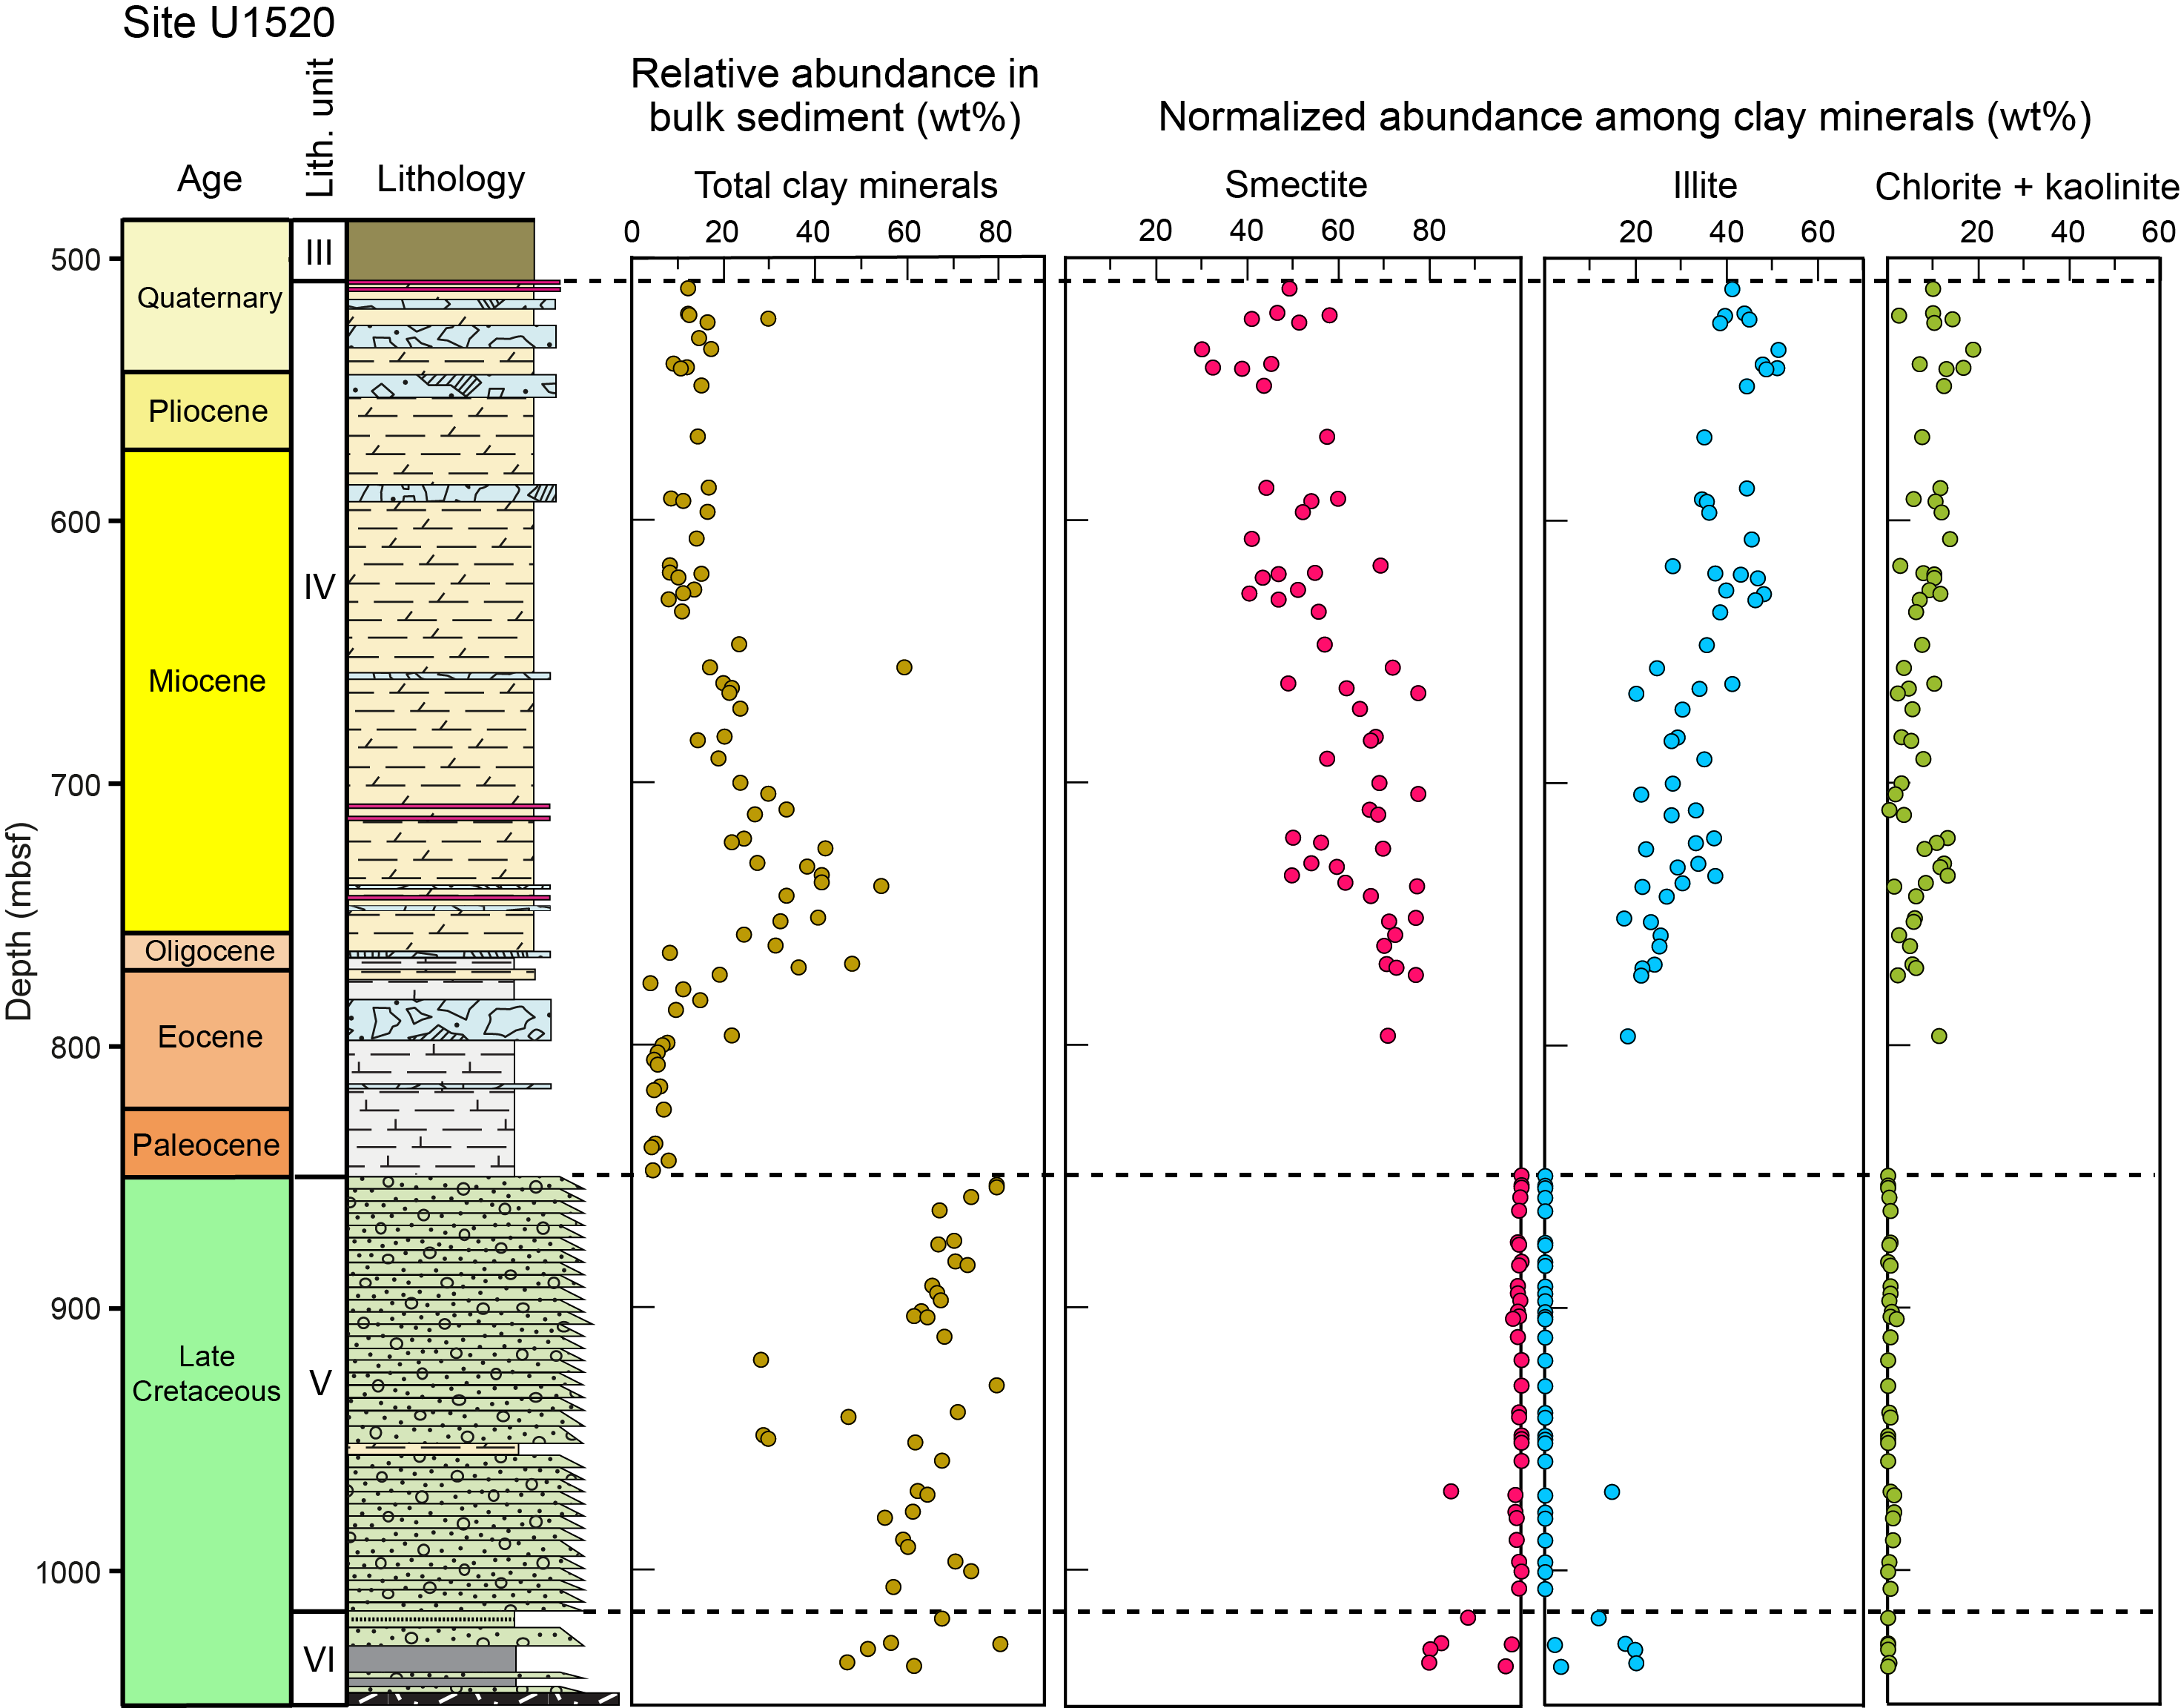
Figure F10. Normalized relative abundance values among the clay minerals, Site U1520.
Smectite is the overwhelmingly dominant variety of clay in Unit V and has an average proportion of 99.1 wt% and a standard deviation of 2.7 (Table T3). Only one specimen of the heavily altered volcaniclastic conglomerate contains enough illite to rise above the XRD detection limits (Figure F9). Bulk-powder XRD data (Barnes et al., 2019) provide the best measure of the extent of basalt-to-clay alteration. Using the values of relative abundance (Figure F10) rather than weight percent normalized to 100% takes into account how peak intensities for the clays are modulated by incomplete replacement of volcanic glass, cementation by zeolites, and preservation of pyroxene as a primary igneous phase. The substantial scatter of such values in Unit V (Figure F10) is consistent with visual core descriptions and examination of thin sections (Barnes et al., 2019).
Clays in the mixed lithologies of Unit VI are also dominated by smectite, with a range of 79.7 to 97.9 wt% (Figure F9). The average content of smectite within Unit VI is 87.5 wt%, and the standard deviation is 8.2 (Table T3). Illite content ranges from 2.1 to 20.1 wt% (µ = 12.5 wt%; σ = 8.1). With one exception, contents of chlorite + kaolinite and quartz are below the XRD detection limits. The large scatter of XRD values within Unit VI (Figure F10) is consistent with the disorganized mixture of diverse lithologies (Barnes et al., 2019).
Indicators of clay diagenesis at Site U1520
In the pelagic carbonate deposits (Lithostratigraphic Unit IV) at Site U1520, values of crystallinity index for the detrital illite assemblage fall between 0.431Δ°2θ and 0.645Δ°2θ (Figure F11), with a mean of 0.528Δ°2θ and a standard deviation of 0.040 (Table T2). Samples from the underlying units of volcaniclastic and mixed sediment do not contain enough illite to yield values of illite crystallinity. According to the criteria of Warr and Ferreiro Mählmann (2015), the range of crystallinity values for Unit IV straddles the domains of advanced diagenesis and anchimetamorphism (i.e., incipient greenschist facies). Given the projected geothermal gradient at Site U1520 (Barnes et al., 2019), these results should be viewed as indicators of geologic conditions within detrital source terranes (e.g., Warr and Cox, 2016) rather than in situ conditions of advanced diagenesis or incipient metamorphism. In further support of that contention, the depth-dependent trend at Site U1520 shows downsection increases in the crystallinity index (i.e., broadening of the illite peak) (Figure F11). Trends created by in situ burial diagenesis should display decreases in the crystallinity index (narrowing of the illite peak) as burial temperature increases.

Figure F11. Stratigraphic distribution of values of expandability.
In Unit IV, the expandability of smectite and smectite-rich I/S mixed-layer clay ranges from 58% to 98% with a mean value of 75% and a standard deviation of 10 (Table T2). For generic reference, lower values (less expandability) are consistent with higher proportions of detrital I/S mixed-layer clay in the assemblage, whereas higher values are indicative of more discrete smectite from altered volcanic sources. A crude stratigraphic trend is defined by downsection increases in expandability (Figure F11), which is the opposite of the trend expected with burial diagenesis. Specimens from Units V and VI yield similar values, ranging from 48% to 100% with a mean of 75% and a standard deviation of 11 (Table T2).
In the pelagic carbonate faces, proportions of illite within the I/S mixed-layer phase range from 1% to 26% with no obvious depth-dependent trend (Table T2). The single-peak and two-peak methods yield similar values (Figure F11). That range is comparable to what was documented in Quaternary trench-wedge deposits (Underwood, 2021). In contrast, computed values for Units V and VI are based solely on the two-peak method; they range from 11% to 50% with a mean of 31% and a standard deviation of 9 (Table T2). Overall, the clays recovered from altered volcaniclastic conglomerates contain notably higher proportions of illite in the I/S phase than the detrital I/S clays in overlying carbonates (Figure F11).
Clay mineral assemblages at Site U1526
A total of 20 clay-sized specimens from Site U1526 were analyzed by XRD. The results are tabulated in Table T4, and the computed values of normalized weight percent for the clay minerals are listed in Table T5. Subsidiary calcite is common in the clay-sized fraction in Lithostratigraphic Unit I, and plagioclase is common in Unit II; incorporation of those minerals into the clay-sized fraction can be attributed to milling of the bulk pelagic sediment and volcanic rock (see Methods). Because of the mismatches between the natural mineral assemblages and those in standard mineral mixtures (Underwood et al., 2020), the accuracy of such semiquantitative estimates remains questionable.
Data from the three specimens of sediment from Unit I are insufficient to establish a stratigraphic trend. Smectite is the most abundant clay mineral, ranging from 46.7 to 84.3 wt%, whereas values for illite range from 8 to 40.5 wt%. The abundance of undifferentiated chlorite + kaolinite ranges from 5.1 to 7.8 wt%, and quartz ranges from undetectable to 11.4 wt%. One specimen from Unit II (interval 375-U1526-5R-1, 130 cm) contains both smectite (66.6 wt%) and chlorite (33.4 wt%). Clays from all of the other volcanic specimens consist exclusively of smectite (Table T5). Values of expandability for the smectite range from 47% to 97% (Table T4). Only five specimens of basalt yielded I/S peaks with intensities high enough to resolve. For those specimens, the computed proportion of illite in the I/S ranges from 25% to 33% (Table T4).
Clay mineral assemblages at Site 1124
A total of 16 samples were selected from Site 1124 for XRD measurements of the clay-sized fraction (Table T6). The computed values of normalized weight percent, using the three computational approaches, are listed in Table T7. The normalized abundance of smectite ranges from 32.3 to 82.2 wt% (µ = 53.1 wt%; σ = 15.8). These values define a clear pattern of smectite depletion moving upsection (Figure F12). The high smectite content in clay-rich Cretaceous–Oligocene strata is consistent with the results of Boulton et al. (2019). The abundance of illite ranges from 11.5 to 48.4 wt% (µ = 32.6 wt%; σ = 12.0) with a well-defined trend of concentrations increasing upsection (Figure F12). Concentrations of undifferentiated chlorite + kaolinite also increase upsection and range from 0.1 to 17.0 wt% (µ = 7.8 wt%; σ = 4.6). Values for clay-sized quartz range from 3.9 to 9.3 wt% (µ = 6.6 wt%; σ = 1.5). When the statistics are plotted on a ternary diagram as average percentages and standard deviations among the clay minerals, the results from Site 1124 match closely with values for the coeval pelagic carbonates from Site U1520 (Figure F13). The mean values for Site 1124 are 56.9 wt% for smectite, 34.8 wt% for illite, and 8.3 wt% for chlorite + kaolinite (Table T7).
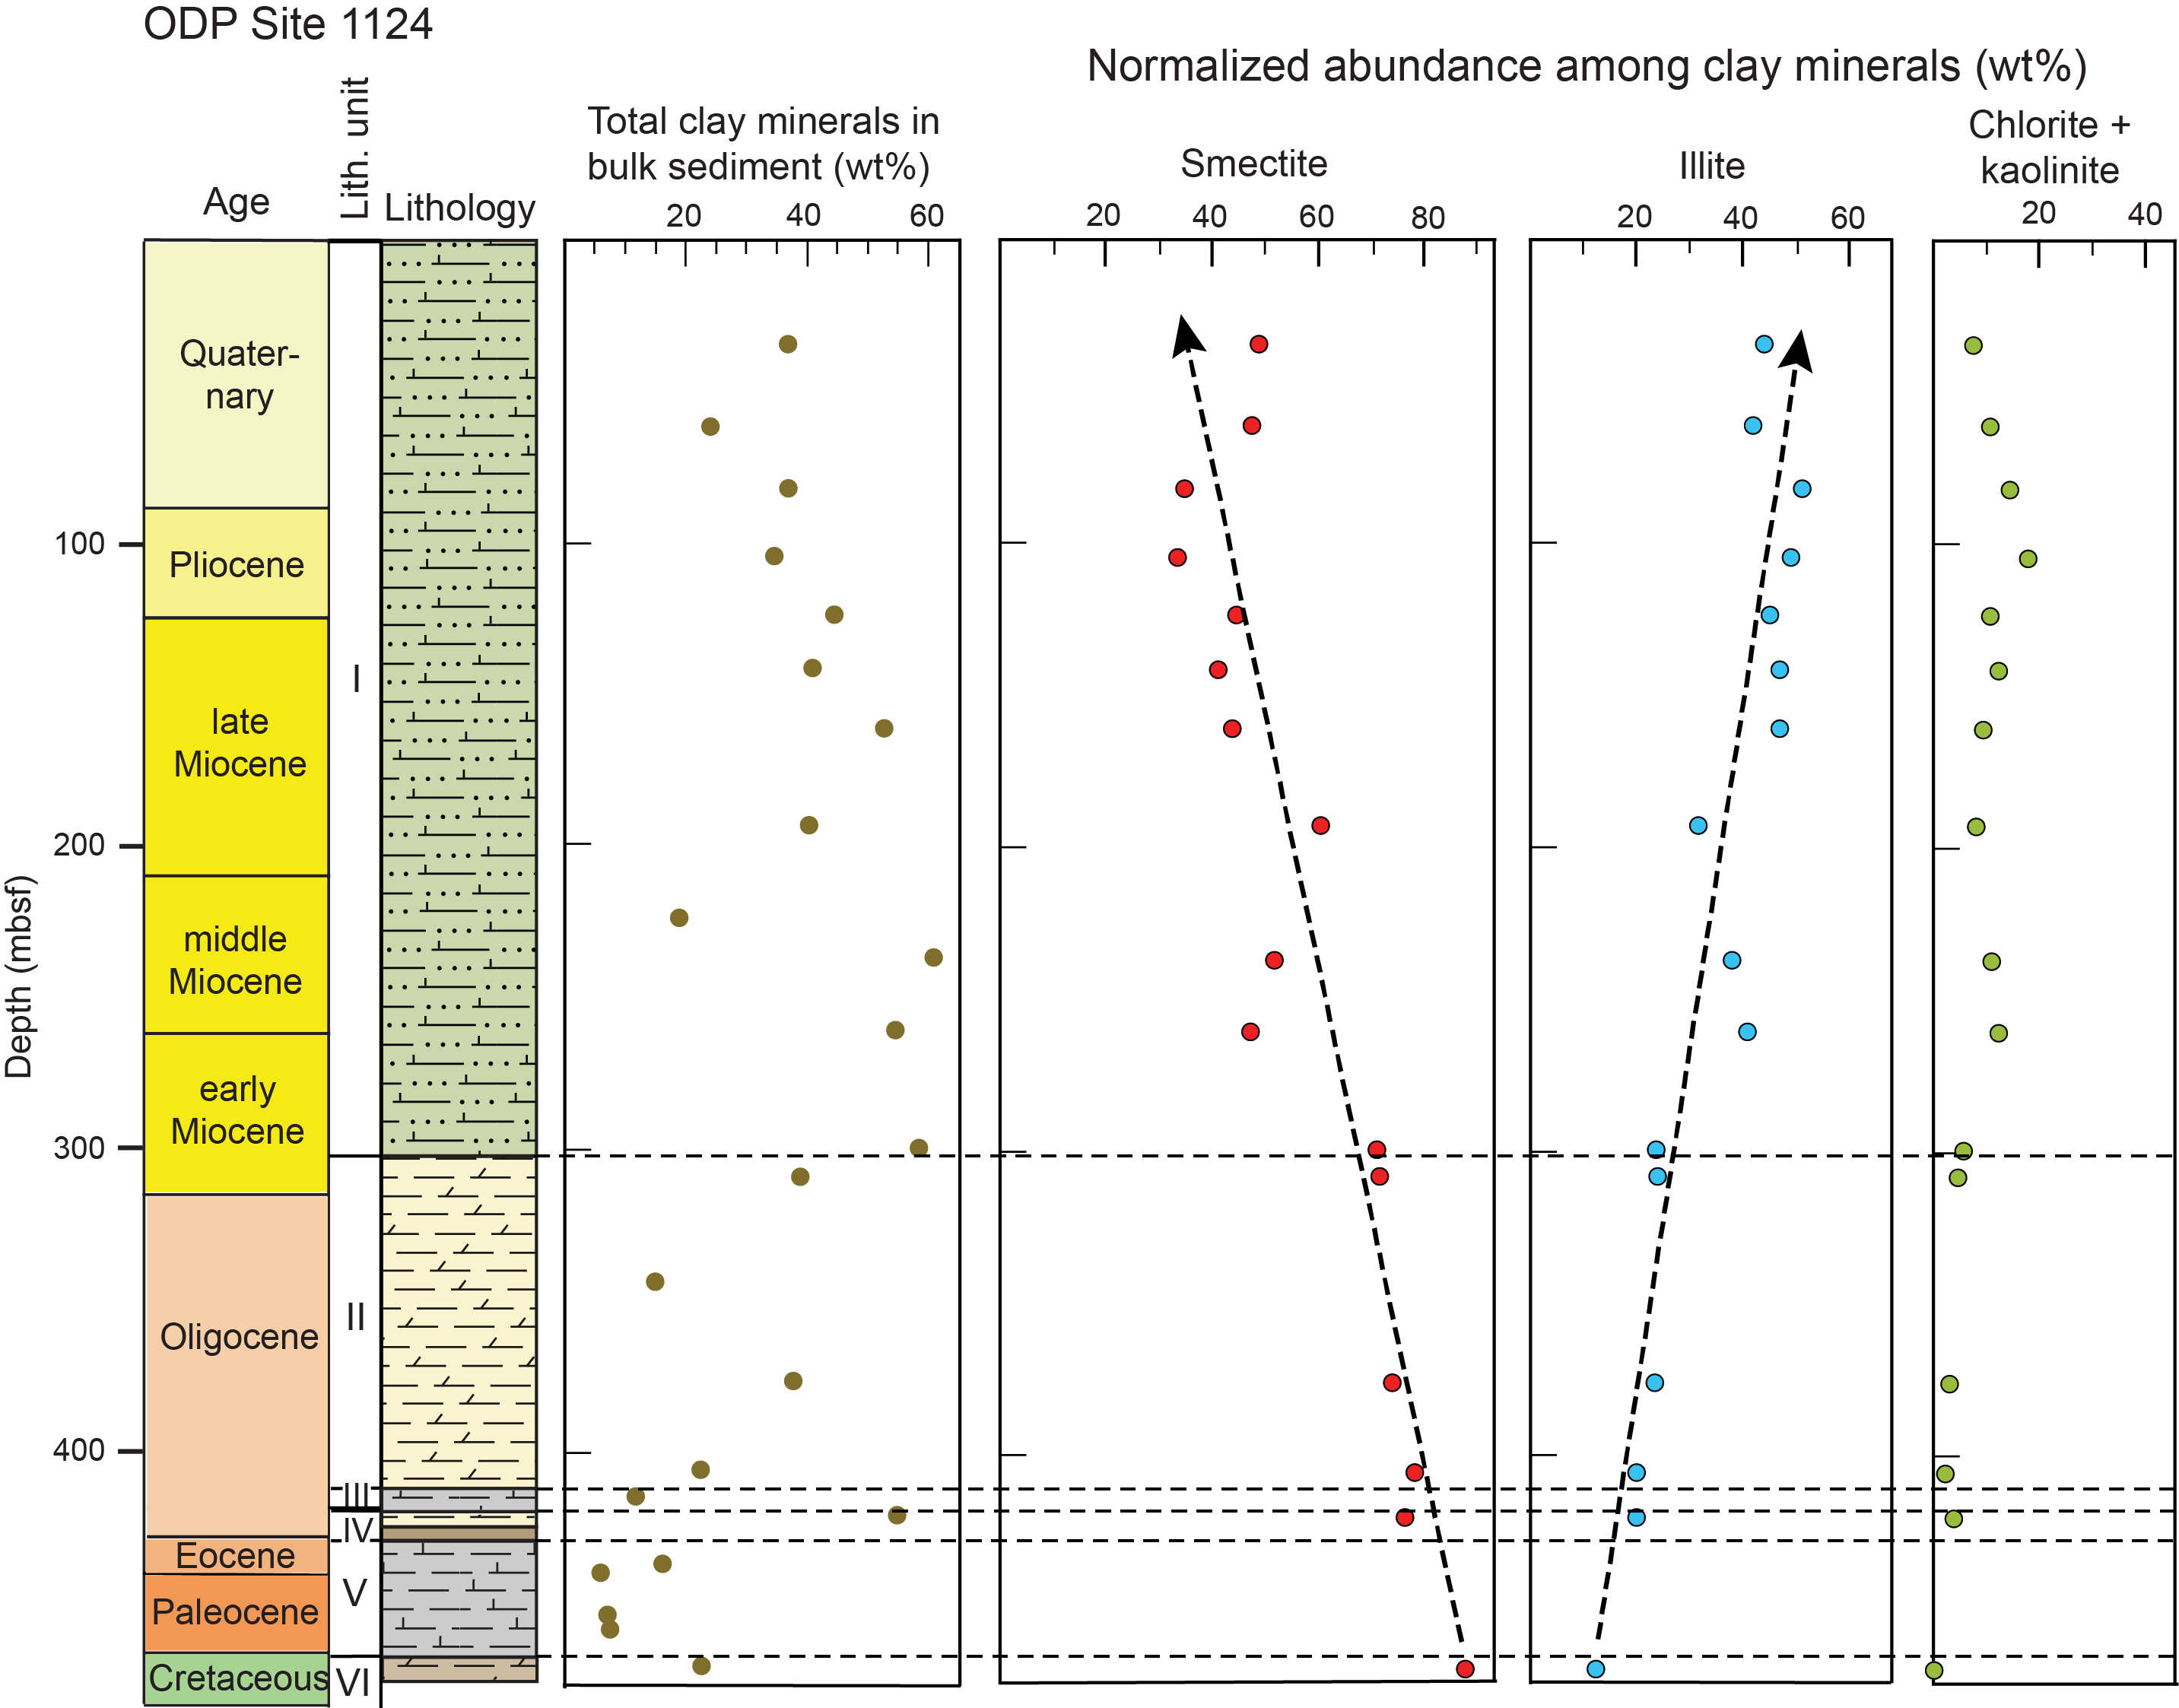
Figure F12. Normalized relative abundance values among the clay minerals, ODP Site 1124.

Figure F13. Mean weight percent values for smectite, illite, and undifferentiated (chlorite + kaolinite).
Clay mineral assemblages at Site 1123
Rigorous statistical comparisons between XRD results from Sites 1123 and 1124 are hampered by differences in sample preparation, instrument settings, and choices for weighting factors. Winkler and Dullo (2002) did not publish values of peak intensity or peak area, so their data were converted to normalized weight percent values using the equations shown in Figure F8. The recalculated values for smectite (Figure F14) range from 16.2 to 89.2 wt% (µ = 51.1 wt%; σ = 14.8). Comparable recalculated values for illite range from 0 to 46.4 wt% (µ = 24.6 wt%; σ = 9.1), and the range for undifferentiated chlorite + kaolinite is 9.7 to 38.6 wt% (µ = 24.3 wt%; σ = 6.0). Stratigraphic trends for Site 1123 (Figure F14) mimic those documented for coeval carbonates from Sites U1520 (Figure F9) and 1124 (Figure F12). A notable upsection decrease in smectite abundance is balanced by substantial increases in illite and lesser increases in chlorite + kaolinite (Figure F14). Relative to Sites U1520 and 1124, however, the mean values for Site 1123 shift toward higher percentages of undifferentiated chlorite + kaolinite (Figure F13). Part of that compositional difference, which is independent of computation method, can be attributed to higher concentrations of kaolinite at Site 1123 (Winkler and Dullo, 2002).
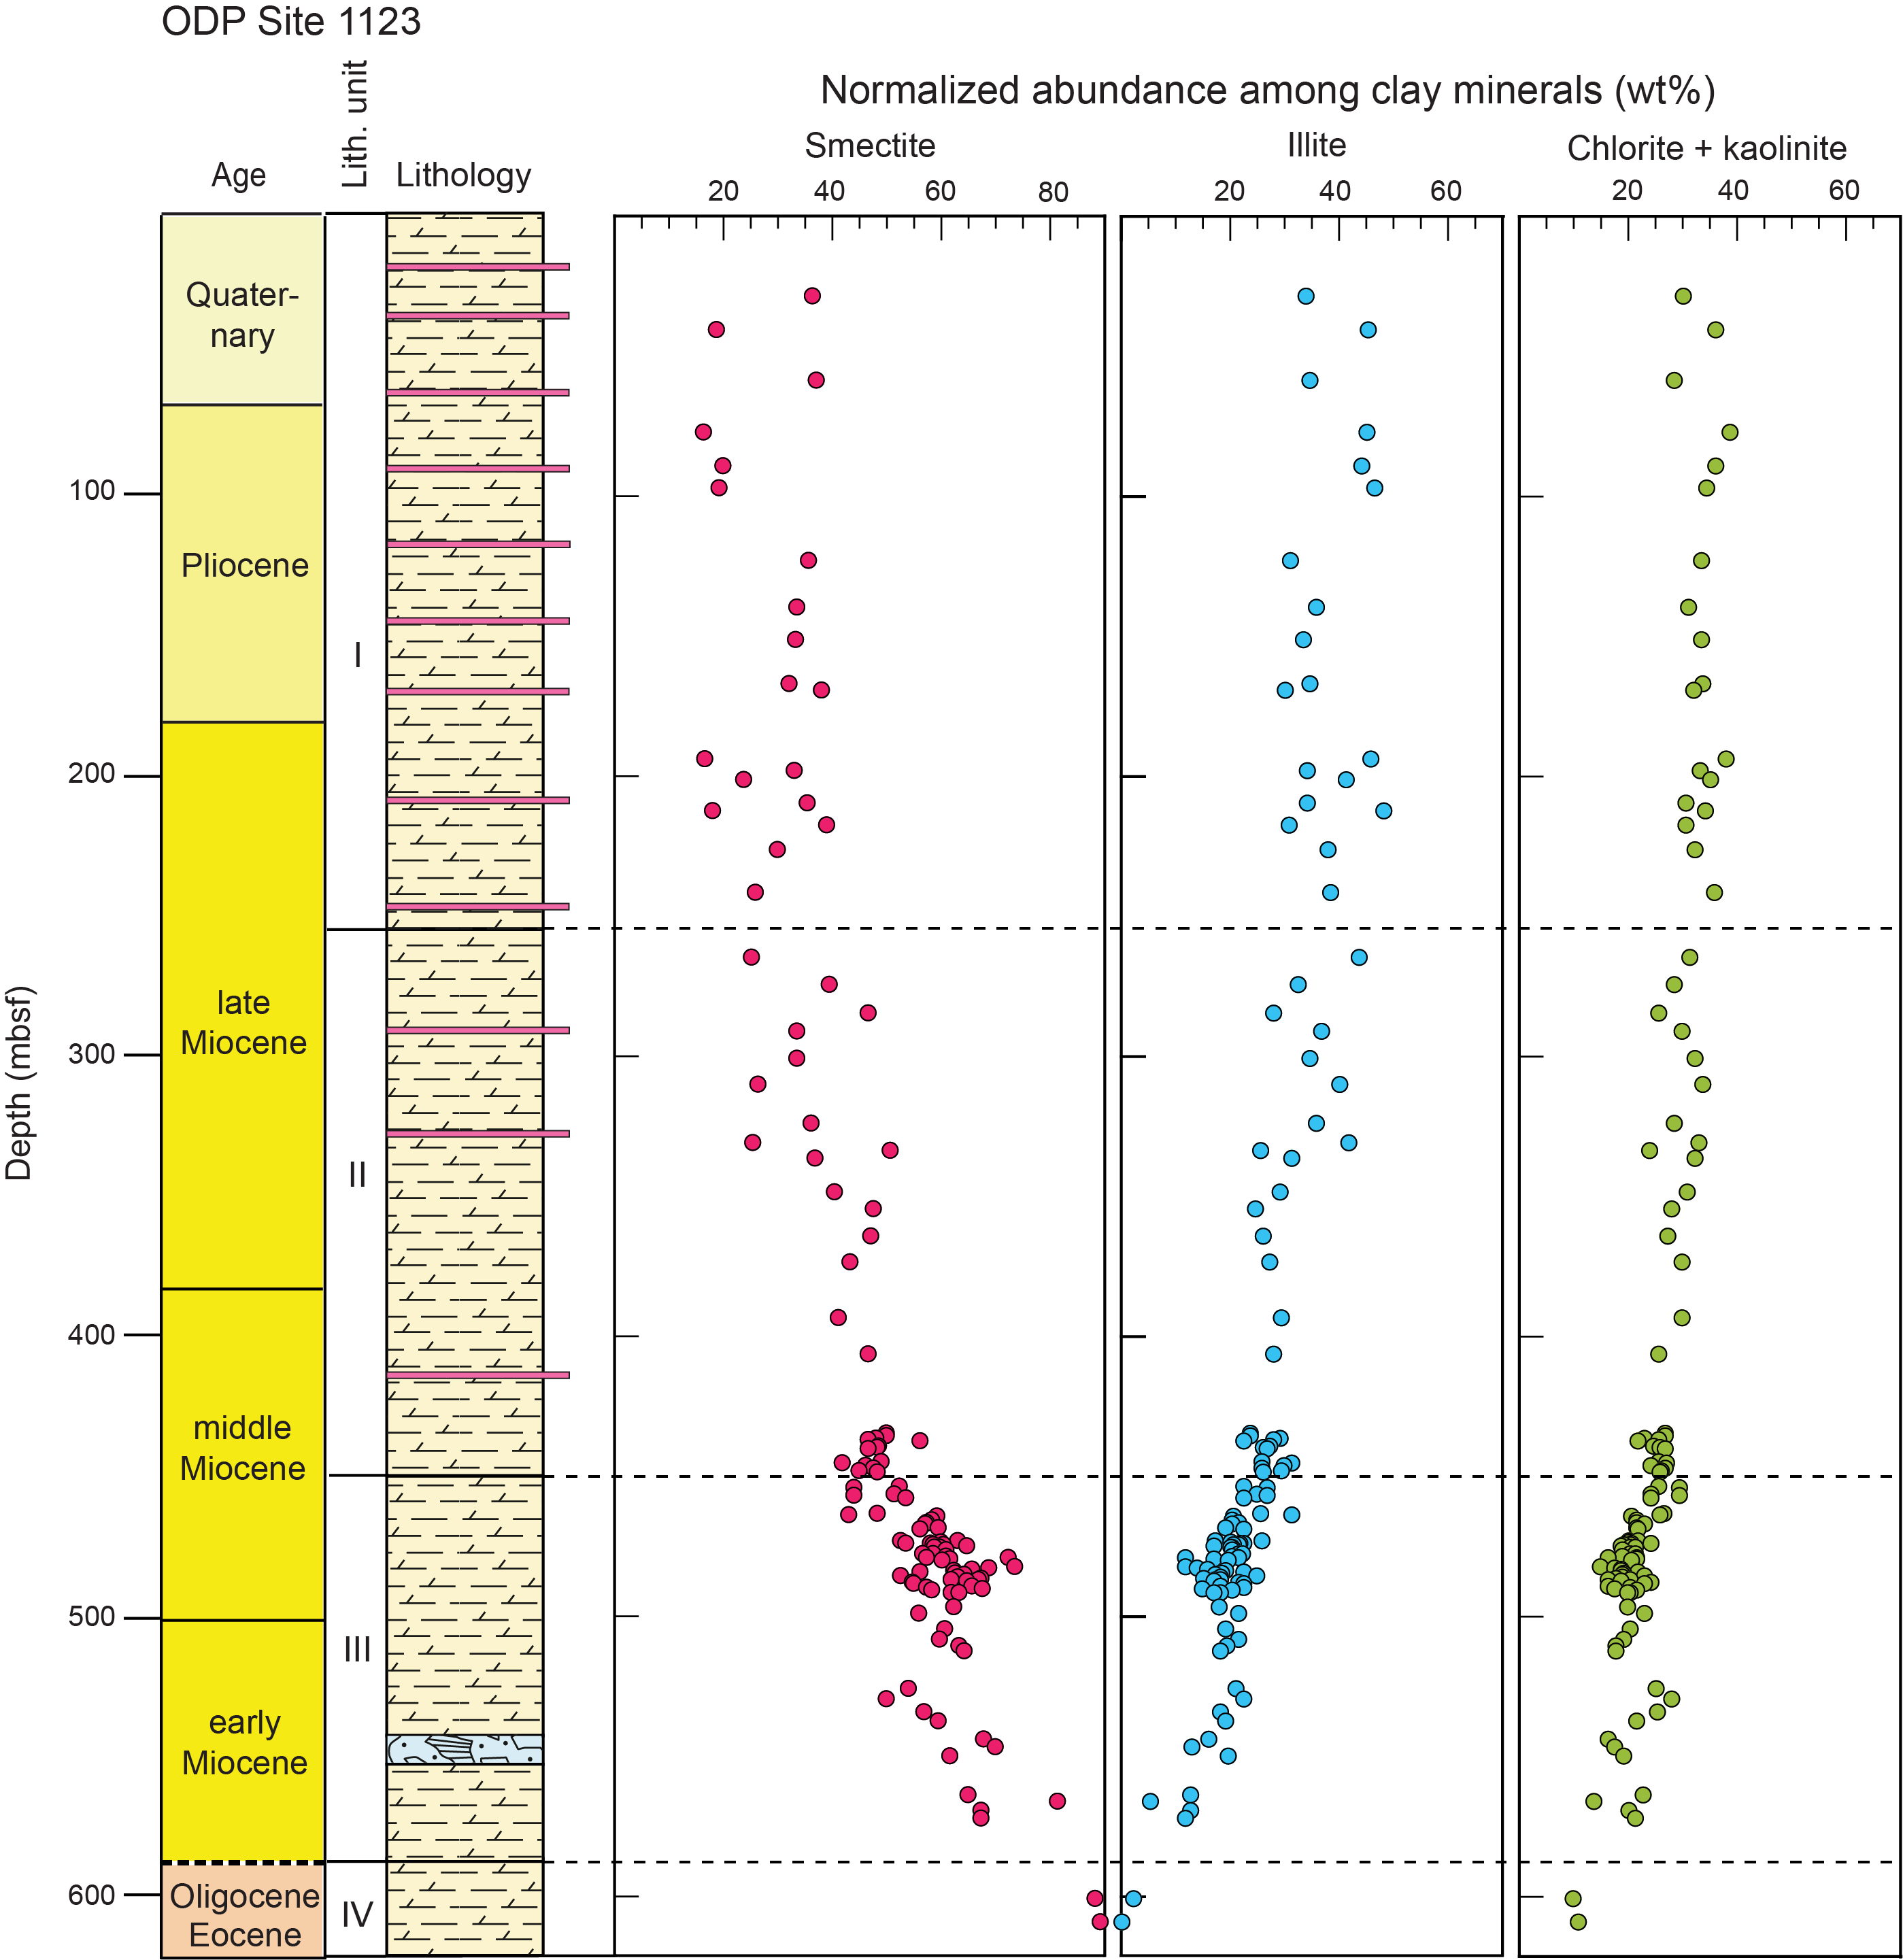
Figure F14. Normalized relative abundance values among the clay minerals, ODP Site 1123.
Conclusions
The most significant discovery from this XRD investigation of the Hikurangi subduction inputs is the existence of a regionally extensive, age-dependent gradient in clay mineral assemblages within Paleocene to early Pleistocene biocalcareous deposits. The content of smectite in Lithostratigraphic Unit IV at Site U1520 (relative to illite, chlorite, kaolinite, and quartz) ranges from 28.3 to 72.9 wt% and steadily decreases upsection. Counterbalancing those decreases, the content of illite ranges from 16.1 to 49.0 wt% and steadily increases upsection. The same temporal trends in clay mineralogy are evident in contourite deposits from ODP Sites 1123 (North Chatham drift) and 1124 (Rekoku drift). In contrast to the compositional diversity of overlying pelagic deposits, clay minerals within altered volcaniclastic conglomerates on the Hikurangi Plateau (Site U1520, Units V and VI) and Tūranganui Knoll (Site U1526, Unit II) are composed almost exclusively of smectite. Indications of clay diagenesis are inconclusive. Values of the illite crystallinity index increase downsection at Site U1520 (i.e., broadening of the peak), whereas the proportion of illite increases in I/S mixed-layer clays with greater depths of burial.
Acknowledgments
This research used samples and/or data provided by the International Ocean Discovery Program (IODP). Funding for this research was provided by the US Science Support Program. Karissa Rosenberger and Mercedes Salazar assisted with sample preparation at New Mexico Tech, and Kelsey McNamara completed XRD scans at the New Mexico Bureau of Geology and Mineral Resources. I thank the crew members, IODP technicians, and shipboard scientists for their assistance with sample acquisition during Expedition 375. An anonymous reviewer provided several helpful suggestions.
References
Barnes, P.M., Wallace, L.M., Saffer, D.M., Bell, R.E., Underwood, M.B., Fagereng, A., Meneghini, F., Savage, H.M., Rabinowitz, H.S., Morgan, J.K., Kitajima, H., Kutterolf, S., Hashimoto, Y., Engelmann de Oliveira, C.H., Noda, A., Crundwell, M.P., Shepherd, C.L., Woodhouse, A.D., Harris, R.N., Wang, M., Henrys, S., Barker, D.H.N., Petronotis, K.E., Bourlange, S.M., Clennell, M.B., Cook, A.E., Dugan, B.E., Elger, J., Fulton, P.M., Gamboa, D., Greve, A., Han, S., Hüpers, A., Ikari, M.J., Ito, Y., Kim, G.Y., Koge, H., Lee, H., Li, X., Luo, M., Malie, P.R., Moore, G.F., Mountjoy, J.J., McNamara, D.D., Paganoni, M., Screaton, E.J., Shankar, U., Shreedharan, S., Solomon, E.A., Wang, X., Wu, H.-Y., Pecher, I.A., and LeVay, L.J., 2020. Slow slip source characterized by lithological and geometric heterogeneity. Science Advances, 6(13):eaay3314. https://doi.org/
Barnes, P.M., Wallace, L.M., Saffer, D.M., Pecher, I.A., Petronotis, K.E., LeVay, L.J., Bell, R.E., Crundwell, M.P., Engelmann de Oliveira, C.H., Fagereng, A., Fulton, P.M., Greve, A., Harris, R.N., Hashimoto, Y., Hüpers, A., Ikari, M.J., Ito, Y., Kitajima, H., Kutterolf, S., Lee, H., Xuesen, L., Min, L., Malie, P.R., Meneghini, F., Morgan, J.K., Noda, A., Rabinowitz, H.S., Savage, H.M., Shepherd, C.L., Shreedharan, S., Solomon, E.A., Underwood, M.B., Maomao, W., Woodhouse, A.D., Bourlange, S.M., Brunet, M.M.Y., Cardona, S., Clennell, M.B., Cook, A.E., Dugan, B., Elger, J., Gamboa, D., Georgiopoulou, A., Han, S., Heeschen, K.U., Gaowei, H., Kim, G.Y., Koge, H., Machado, K.S., McNamara, D.D., Moore, G.F., Mountjoy, J.J., Nole, M.A., Owari, S., Paganoni, M., Rose, P.S., Screaton, E.J., Shankar, U., Torres, M.E., and Xiujuan, W., 2019. Site U1520. In Wallace, L.M., Saffer, D.M., Barnes, P.M., Pecher, I.A., Petronotis, K.E., LeVay, L.J., and the Expedition 372/375 Scientist, Hikurangi Subduction Margin Coring, Logging, and Observatories. Proceedings of the International Ocean Discovery Program, 372B/375: College Station, TX (Proceedings of the International Ocean Discovery Program), https://doi.org/
Biscaye, P.E., 1965. Mineralogy and sedimentation of recent deep-sea clay in the Atlantic Ocean and adjacent seas and oceans. Geological Society of America Bulletin, 76(7):803–832. https://doi.org/
Boulton, C., Niemeijer, A.R., Hollis, C.J., Townend, J., Raven, M.D., Kulhanek, D.K., and Shepherd, C.L., 2019. Temperature-dependent frictional properties of heterogeneous Hikurangi subduction zone input sediments, ODP Site 1124. Tectonophysics, 757:123–139. https://doi.org/
Carter, L., Carter, R.M., and McCave, I., 2004. Evolution of the sedimentary system beneath the deep Pacific inflow off eastern New Zealand. Marine Geology, 205(1–4):9–27. https://doi.org/
Carter, L., Carter, R.M., McCave, I.N., and Gamble, J., 1996. Regional sediment recycling in the abyssal Southwest Pacific Ocean. Geology, 24(8):735–738. https://doi.org/
Carter, L., and McCave, I.N., 1994. Development of sediment drifts approaching an active plate margin under the SW Pacific Deep Western Boundary Current. Paleoceanography, 9(6):1061–1085. https://doi.org/
Carter, L., and McCave, I.N., 1997. The sedimentary regime beneath the Deep Western Boundary Current inflow to the southwest Pacific Ocean. Journal of Sedimentary Research, 67(6):1005–1017. https://doi.org/
Carter, L., and McCave, I.N., 2002. Eastern New Zealand Drifts, Miocene–Recent. Memoir - Geological Society of London, 22(1):385–407. https://doi.org/
Carter, L., and Mitchell, J.S., 1987. Late Quaternary sediment pathways through the deep ocean, east of New Zealand. Paleoceanography and Paleoclimatology, 2(4):409–422. https://doi.org/
Carter, L., Neil, H.L., and McCave, I.N., 2000. Glacial to interglacial changes in non-carbonate and carbonate accumulation in the SW Pacific Ocean, New Zealand. Palaeogeography, Palaeoclimatology, Palaeoecology, 162(3–4):333–356. https://doi.org/
Carter, L., and Wilkin, J., 1999. Abyssal circulation around New Zealand—a comparison between observations and a global circulation model. Marine Geology, 159(1–4):221–239. https://doi.org/
Carter, R.M., 1985. The Mid-Oligocene Marshall Paraconformity, New Zealand: coincidence with global eustatic sea-level fall or rise? The Journal of Geology, 93(3):359–371. https://doi.org/
Carter, R.M., McCave, I.N., and Carter, L., 2004. Leg 181 synthesis: fronts, flows, drifts, volcanoes, and the evolution of the southwestern gateway to the Pacific Ocean, eastern New Zealand. In Richter, C. (Ed.), Proceedings of the Ocean Drilling Program, Scientific Results, 181: College Station, TX (Ocean Drilling Program). https://doi.org/
Chen, G., Wang, D., Dong, C., Zu, T., Xue, H., Shu, Y., Chu, X., Qi, Y., and Chen, H., 2015. Observed deep energetic eddies by seamount wake. Scientific Reports, 5(1):17416. https://doi.org/
Davy, B., Hoernle, K., and Werner, R., 2008. Hikurangi Plateau: Crustal structure, rifted formation, and Gondwana subduction history. Geochemistry, Geophysics, Geosystems, 9(7):007004. https://doi.org/
Ferreiro Mählmann, R., and Frey, M., 2012. Standardisation, calibration and correlation of the Kübler-index and the vitrinite/bituminite reflectance: an inter-laboratory and field related study. Swiss Journal of Geosciences, 105(2):153–170. https://doi.org/
Fisher, A.T., and Underwood, M.B., 1995. Calibration of an X-ray diffraction method to determine relative mineral abundances in bulk powders using matrix singular value decomposition: a test from the Barbados accretionary complex. In Shipley, T.H., Ogawa, Y., Blum, P., et al. (Ed.), Proceedings of the Ocean Drilling Program, Initial Reports. 156: College Station, TX (Ocean Drilling Program), 29–37. https://doi.org/
Freed, R., and Peacor, D., 1989. Variability in temperature of the smectite/illite reaction in Gulf Coast sediments. Clay Minerals, 24:171–180. https://doi.org/
Fulthorpe, C.S., Carter, R.M., Miller, K.G., and Wilson, J., 1996. Marshall Paraconformity: a mid-Oligocene record of inception of the Antarctic circumpolar current and coeval glacio-eustatic lowstand? Marine and Petroleum Geology, 13(1):61–77. https://doi.org/
Gingele, F.X., De Deckker, P., and Hillenbrand, C.-D., 2001. Clay mineral distribution in surface sediments between Indonesia and NW Australia—source and transport by ocean currents. Marine Geology, 179(3–4):135–146. https://doi.org/
Guo, J., and Underwood, M.B., 2011. Data report: refined method for calculating percentages of kaolinite and chlorite from X-ray diffraction data, with application to the Nankai Margin of southwest Japan. In Kinoshita, M., Tobin, H., Ashi, J., Kimura, G., Lallemant, S., Screaton, E.J., Curewitz, D., Masago, H., Moe, K.T., and the Expedition 314/315/316 Scientists (Ed.), Proceedings of the Integrated Ocean Drilling Program, Volume 314/315/316. Washington, DC (Integrated Ocean Drilling Program Management International, Inc.), https://doi.org/
Hall, I.R., Carter, L., and Harris, S.E., 2002. Major depositional events under the deep Pacific inflow. Geology, 30(6):487–490. https://doi.org/
Horn, M., and Uenzelmann-Neben, G., 2015. The Deep Western Boundary Current at the Bounty Trough, east of New Zealand: Indications for its activity already before the opening of the Tasmanian Gateway. Marine Geology, 362:60–75. https://doi.org/
Horn, M., and Uenzelmann-Neben, G., 2016. The spatial extent of the Deep Western Boundary Current into the Bounty Trough: new evidence from parasound sub-bottom profiling. Marine Geophysical Research, 37(2):145–158. https://doi.org/
Jeppson, T., and Kitajima, H., 2019. Evolution of compressional wave velocity and porosity in carbonate and siliceous subduction zone input materials. Presented at the American Geophysical Union Fall Meeting 2019, San Francisco, CA, 9–13 December 2019. https://abstractsearch.agu.org/
Joseph, L.H., Rea, D.K., and van der Pluijm, B.A., 2004. Neogene history of the Deep Western Boundary Current at Rekohu sediment drift, Southwest Pacific (ODP Site 1124). Marine Geology, 205(1):185–206. https://doi.org/
Kisch, H.J., 1991. Illite crystallinity: recommendations on sample preparation, X-ray diffraction settings, and interlaboratory samples. Journal of Metamorphic Geology, 9(6):665–670. https://doi.org/
Lewis, K.B., 1994. The 1500-km-long Hikurangi Channel: trench-axis channel that escapes its trench, crosses a plateau, and feeds a fan drift. Geo-Marine Letters, 14:19–28. https://doi.org/
Lewis, K.B., Collot, J.-Y., and Lallem, S.E., 1998. The dammed Hikurangi Trough: a channel-fed trench blocked by subducting seamounts and their wake avalanches (New Zealand–France GeodyNZ Project). Basin Research, 10(4):441–468. https://doi.org/
Lewis, K.B., and Pantin, H.M., 2002. Channel-axis, overbank and drift sediment waves in the southern Hikurangi Trough, New Zealand. Marine Geology, 192(1):123–151. https://doi.org/
Marsaglia, K.M., Martin, C.E., Kautz, C.Q., Shapiro, S.A., and Carter, L., 2011. Linking a late Miocene–Pliocene hiatus in the deep-sea Bounty Fan off South Island, New Zealand, to onshore tectonism and lacustrine sediment storage. Geosphere, 7(2):305–312. https://doi.org/
McCave, I.N., and Carter, L., 1997. Recent sedimentation beneath the Deep Western Boundary Current off northern New Zealand. Deep Sea Research, Part I: Oceanographic Research Papers, 44(7):1203–1237. https://doi.org/
McGonigal, K., and Di Stefano, A., 2002. Calcareous nannofossil biostratigraphy of the Eocene-Oligocene transition, ODP Sites 1123 and 1124. In Richter, C. (Ed.), Proceedings of the Ocean Drilling Program, Scientific Results. 181: College Station, TX (Ocean Drilling Program), 1–22. https://doi.org/
Moore, D.M., and Reynolds, R.C., Jr., 1989a. Identification of mixed-layered clay minerals. In Moore, D.M., and Reynolds, R.C., Jr. (Ed.), X-ray Diffraction and the Identification and Analysis of Clay Minerals. New York (Oxford University Press), 241–271.
Moore, D.M., and Reynolds, R.C., Jr., 1989b. Sample preparation techniques for clay minerals. In Moore, D.M., and Reynolds, R.C., Jr. (Ed.), X-ray Diffraction and the Identification and Analysis of Clay Minerals. New York (Oxford University Press), 179–201.
Naeher, S., Hollis, C.J., Clowes, C.D., Ventura, G.T., Shepherd, C.L., Crouch, E.M., Morgans, H.E.G., Bland, K.J., Strogen, D.P., and Sykes, R., 2019. Depositional and organofacies influences on the petroleum potential of an unusual marine source rock: Waipawa Formation (Paleocene) in southern East Coast Basin, New Zealand. Marine and Petroleum Geology, 104:468–488. https://doi.org/
Nelson, C.S., Hendy, I.L., Neil, H.L., Hendy, C.H., and Weaver, P.P.E., 2000. Last glacial jetting of cold waters through the Subtropical Convergence zone in the Southwest Pacific off eastern New Zealand, and some geological implications. Palaeogeography, Palaeoclimatology, Palaeoecology, 156(1–2):103–121. https://doi.org/
Petschick, R., Kuhn, G., and Gingele, F., 1996. Clay mineral distribution in surface sediments of the South Atlantic: sources, transport, and relation to oceanography. Marine Geology, 130(3–4):203–229. https://doi.org/
Phillips, S.C., Johnson, J.E., Underwood, M.B., Guo, J., Giosan, L., and Rose, K., 2014. Long-timescale variation in bulk and clay mineral composition of Indian continental margin sediments in the Bay of Bengal, Arabian Sea, and Andaman Sea. Marine and Petroleum Geology, 58(A):117–138. https://doi.org/
Pollard, R., and Read, J., 2017. Circulation, stratification and seamounts in the Southwest Indian Ocean. Deep-Sea Research, Part II: Topical Studies in Oceanography, 136:36–43. https://doi.org/
Quartau, R., Ramalho, R.S., Madeira, J., Santos, R., Rodrigues, A., Roque, C., Carrara, G., and Brum da Silveira, A., 2018. Gravitational, erosional and depositional processes on volcanic ocean islands: Insights from the submarine morphology of Madeira Archipelago. Earth and Planetary Science Letters, 482:288–299. https://doi.org/
Rabinowitz, H.S., Savage, H.M., Skarbek, R.M., Ikari, M.J., Carpenter, B.M., and Collettini, C., 2018. Frictional behavior of input sediments to the Hikurangi Trench, New Zealand. Geochemistry, Geophysics, Geosystems, 19(9):2973–2990. https://doi.org/
Read, J., and Pollard, R., 2017. An introduction to the physical oceanography of six seamounts in the southwest Indian Ocean. Deep-Sea Research, Part II: Topical Studies in Oceanography, 136:44–58. https://doi.org/
Rettke, R.C., 1981. Probable burial diagenetic and provenance effects on Dakota Group clay mineralogy, Denver Basin. Journal of Sedimentary Research, 51(2):541–551. https://doi.org/
Saffer, D.M., Wallace, L.M., Barnes, P.M., Pecher, I.A., Petronotis, K.E., LeVay, L.J., Bell, R.E., Crundwell, M.P., Engelmann de Oliveira, C.H., Fagereng, A., Fulton, P.M., Greve, A., Harris, R.N., Hashimoto, Y., Hüpers, A., Ikari, M.J., Ito, Y., Kitajima, H., Kutterolf, S., Lee, H., Xuesen, L., Min, L., Malie, P.R., Meneghini, F., Morgan, J.K., Noda, A., Rabinowitz, H.S., Savage, H.M., Shepherd, C.L., Shreedharan, S., Solomon, E.A., Underwood, M.B., Maomao, W., Woodhouse, A.D., Bourlange, S.M., Brunet, M.M.Y., Cardona, S., Clennell, M.B., Cook, A.E., Dugan, B., Elger, J., Gamboa, D., Georgiopoulou, A., Han, S., Heeschen, K.U., Gaowei, H., Kim, G.Y., Koge, H., Machado, K.S., McNamara, D.D., Moore, G.F., Mountjoy, J.J., Nole, M.A., Owari, S., Paganoni, M., Rose, P.S., Screaton, E.J., Shankar, U., Torres, M.E., Xiujuan, W., and Wu, H.-Y., 2019. Expedition 372B/375 summary. In Wallace, L.M., Saffer, D.M., Barnes, P.M., Pecher, I.A., Petronotis, K.E., LeVay, L.J., and the Expedition 372/375 Scientists (Ed.), Hikurangi Subduction Margin Coring, Logging, and Observatories. Proceedings of the International Ocean Discovery Program, 372B/375: College Station, TX (Proceedings of the International Ocean Discovery Program), https://doi.org/
Saffer, D., Wallace, L., and Petronotis, K., 2017. Expedition 375 Scientific Prospectus: Hikurangi Subduction Margin Coring and Observatories, International Ocean Discovery Program https://doi.org/
Saint-Ange, F., Bachèlery, P., Babonneau, N., Michon, L., and Jorry, S.J., 2013. Volcaniclastic sedimentation on the submarine slopes of a basaltic hotspot volcano: Piton de la Fournaise volcano (La Réunion Island, Indian Ocean). Marine Geology, 337:35–52. https://doi.org/
Shapiro, S.A., Marsaglia, K.M., Carter, L., Arribas, J., Johnsson, M.J., and Critelli, S., 2007. The petrology and provenance of sand in the Bounty submarine fan, New Zealand. In Arribas, J., Critelli, S., and Johnsson, M.J. (Ed.), Sedimentary Provenance and Petrogenesis: Perspectives from Petrography and Geochemistry. 420: Special Paper - Geological Society of America 277–296. https://doi.org/
Shipboard Scientific Party, 1999a. Site 1123: North Chatham Drift – a 20-Ma record of the Pacific Deep Western Boundary Current. In Carter, R.M., McCave, I.N., Richter, C., Carter, L., et al., (Ed.), Proceedings of the Ocean Drilling Program, Initial Reports. 181: College Station, TX (Ocean Drilling Program), 1–184. https://doi.org/
Shipboard Scientific Party, 1999b. Site 1124: Rekohu Drift—from the K/T boundary to the Deep Western Boundary Current. In Carter, R.M., McCave, I.N., Richter, C., Carter, L., et al. (Ed.), Proceedings of the Ocean Drilling Program. 181: College Station, TX (Ocean Drilling Program), 1–137. https://doi.org/
Thiry, M., 2000. Palaeoclimatic interpretation of clay minerals in marine deposits: an outlook from the continental origin. Earth-Science Reviews, 49(1–4):201–221. https://doi.org/
Timm, C., Davy, B., Haase, K., Hoernle, K.A., Graham, I.J., de Ronde, C.E.J., Woodhead, J., Bassett, D., Hauff, F., Mortimer, N., Seebeck, H.C., Wysoczanski, R.J., Caratori-Tontini, F., and Gamble, J.A., 2014. Subduction of the oceanic Hikurangi Plateau and its impact on the Kermadec arc. Nature Communications, 5(1):4923. https://doi.org/10.1038/ncomms5923
Turnewitsch, R., Falahat, S., Nycander, J., Dale, A., Scott, R.B., and Furnival, D., 2013. Deep-sea fluid and sediment dynamics—Influence of hill- to seamount-scale seafloor topography. Earth-Science Reviews, 127:203–241. https://doi.org/
Underwood, M.B., 2020. Data report: reconnaissance of bulk sediment composition and clay mineral assemblages: inputs to the Hikurangi subduction system. In Wallace, L.M., Saffer, D.M., Barnes, P.M., Pecher, I.A., Petronotis, K.E., LeVay, L.J., and the Expedition 372/375 Scientists (Ed.), Hikurangi Subduction Margin Coring, Logging, and Observatories. Proceedings of the International Ocean Discovery Program, 372B/375: College Station, TX (International Ocean Discovery Program), https://doi.org/
Underwood, M.B., 2021. Data report: clay mineral assemblages within trench-floor and accreted trench-floor deposits, IODP Sites U1518 and U1520, offshore New Zealand. In Wallace, L.M., Saffer, D.M., Barnes, P.M., Pecher, I.A., Petronotis, K.E., LeVay, L.J., and the Expedition 372/375 Scientists (Ed.), Hikurangi Subduction Margin Coring, Logging, and Observatories. Proceedings of the International Ocean Discovery Program, 372B/375: College Station, TX (Proceedings of the International Ocean Discovery Program), https://doi.org/
Underwood, M.B., Basu, N., Steurer, J., and Udas, S., 2003. Data report: normalization factors for semiquantitative X-ray diffraction analysis, with application to DSDP Site 297, Shikoku Basin. In Mikada, H., Moore, G.F., Taira, A., Becker, K., Moore, J.C., and Klaus, A. (Ed.), Proceedings of the Ocean Drilling Program, Scientific Results. 190/196: College Station, TX (Ocean Drilling Program), 1–28. https://doi.org/
Underwood, M.B., and Dugan, B., 2021. Data report: clay mineral assemblages within and beneath the Tuaheni landslide complex, IODP Site U1517, offshore New Zealand. In Pecher, I.A., Barnes, P.M., LeVay, L.J., and the Expedition 372A Scientists (Ed.), Creeping Gas Hydrate Slides. Proceedings of the International Ocean Discovery Program, 372A: College Station, TX (International Ocean Discovery Program), https://doi.org/10.14379/
Underwood, M.B., Lawler, N., and McNamara, K., 2020. Data report: standard mineral mixtures, normalization factors, and determination of error for quantitative X-ray diffraction analyses of bulk powders and clay-sized mineral assemblages. In Wallace, L.M., Saffer, D.M., Barnes, P.M., Pecher, I.A., Petronotis, K.E., LeVay, L.J., and the Expedition 372/375 Scientists (Ed.), Hikurangi Subduction Margin Coring, Logging, and Observatories. Proceedings of the International Ocean Discovery Program, 372B/375: College Station, TX (International Ocean Discovery Program), https://doi.org/10.14379/
Wallace, L.M., Saffer, D.M., Barnes, P.M., Pecher, I.A., Petronotis, K.E., LeVay, L.J., Bell, R.E., Crundwell, M.P., Engelmann de Oliveira, C.H., Fagereng, A., Fulton, P.M., Greve, A., Harris, R.N., Hashimoto, Y., Hüpers, A., Ikari, M.J., Ito, Y., Kitajima, H., Kutterolf, S., Lee, H., Xuesen, L., Min, L., Malie, P.R., Meneghini, F., Morgan, J.K., Noda, A., Rabinowitz, H.S., Savage, H.M., Shepherd, C.L., Shreedharan, S., Solomon, E.A., Underwood, M.B., Maomao, W., Woodhouse, A.D., Bourlange, S.M., Brunet, M.M.Y., Cardona, S., Clennell, M.B., Cook, A.E., Dugan, B., Elger, J., Gamboa, D., Georgiopoulou, A., Han, S., Heeschen, K.U., Gaowei, H., Kim, G.Y., Koge, H., Machado, K.S., McNamara, D.D., Moore, G.F., Mountjoy, J.J., Nole, M.A., Owari, S., Paganoni, M., Rose, P.S., Screaton, E.J., Shankar, U., Torres, M.E., Xiujuan, W., and Wu, H.-Y., 2019a. Expedition 372B/375 methods. In Wallace, L.M., Saffer, D.M., Barnes, P.M., Pecher, I.A., Petronotis, K.E., LeVay, L.J., and the Expedition 372/375 Scientist (Ed.), Hikurangi Subduction Margin Coring, Logging, and Observatories. Proceedings of the International Ocean Discovery Program, 372B/375: College Station, TX (International Ocean Discovery Program). https://doi.org/
Wallace, L.M., Saffer, D.M., Petronotis, K.E., Barnes, P.M., Bell, R.E., Crundwell, M.P., Engelmann de Oliveira, C.H., Fagereng, A., Fulton, P.M., Greve, A., Harris, R.N., Hashimoto, Y., Hüpers, A., Ikari, M.J., Ito, Y., Kitajima, H., Kutterolf, S., Lee, H., Xuesen, L., Min, L., Malie, P.R., Meneghini, F., Morgan, J.K., Noda, A., Rabinowitz, H.S., Savage, H.M., Shepherd, C.L., Shreedharan, S., Solomon, E.A., Underwood, M.B., Maomao, W., and Woodhouse, A.D., 2019b. Site U1526. In Wallace, L.M., Saffer, D.M., Barnes, P.M., Pecher, I.A., Petronotis, K.E., LeVay, L.J., and the Expedition 372/375 Scientists (Ed.), Hikurangi Subduction Margin Coring, Logging, and Observatories. Proceedings of the International Ocean Discovery Program, 372B/375: College Station, TX (International Ocean Discovery Program). https://doi.org/
Warr, L.N., and Cox, S.C., 2016. Correlating illite (Kübler) and chlorite (Árkai) “crystallinity” indices with metamorphic mineral zones of the South Island, New Zealand. Applied Clay Science, 134(3):164–174. https://doi.org/10.1016/j.clay.2016.06.024
Warr, L.N., and Ferreiro Mählmann, R., 2015. Recommendations for Kübler Index standardization. Clay Minerals, 50(3):283–286. https://doi.org/
Winkler, A., and Dullo, W.-C., 2002. Data report: Miocene to Pleistocene sedimentation pattern on the Chatham Rise, New Zealand. In Richter, C. (Ed.), Proceedings of the Ocean Drilling Program, Scientific Results. 181: College Station, TX (Ocean Drililng Program), 1–21. https://doi.org/
Wood, R., and Davy, B., 1994. The Hikurangi Plateau. Marine Geology, 118(1):153-173. http://www.sciencedirect.com/
Wright, I.C., 1996. Volcaniclastic processes on modern submarine arc stratovolcanoes: sidescan and photographic evidence from the Rumble IV and V volcanoes, southern Kermadec Arc (SW Pacific). Marine Geology, 136(1):21–39. https://doi.org/
1 Underwood, M.B., 2021. Data report: clay mineral assemblages within biocalcareous and volcaniclastic inputs to the Hikurangi subduction zone, IODP Expedition 372B/375 Sites U1520 and U1526, offshore New Zealand. In Wallace, L.M., Saffer, D.M., Barnes, P.M., Pecher, I.A., Petronotis, K.E., LeVay, L.J., and the Expedition 372/375 Scientists, Hikurangi Subduction Margin Coring, Logging, and Observatories. Proceedings of the International Ocean Discovery Program, 372B/375: College Station, TX (International Ocean Discovery Program). https://doi.org/10.14379/iodp.proc.372B375.207.2021
2 Department of Earth & Environmental Science, New Mexico Institute of Mining & Technology, USA. UnderwoodM@missouri.edu
This work is distributed under the Creative Commons Attribution 4.0 International (CC BY 4.0) license. 