Wallace, L.M., Saffer, D.M., Barnes, P.M., Pecher, I.A., Petronotis, K.E., LeVay, L.J., and the Expedition 372/375 Scientists
Proceedings of the International Ocean Discovery Program Volume 372B/375
publications.iodp.org
Data report: clay mineral assemblages within Hikurangi trench-slope deposits, IODP Expedition 375 Site U1519, offshore New Zealand1
Michael B. Underwood2
1 Underwood, M.B., 2022. Data report: clay mineral assemblages within Hikurangi trench-slope deposits, IODP Expedition 375 Site U1519, offshore New Zealand. In Wallace, L.M., Saffer, D.M., Barnes, P.M., Pecher, I.A., Petronotis, K.E., LeVay, L.J., and the Expedition 372/375 Scientists, Hikurangi Subduction Margin Coring, Logging, and Observatories. Proceedings of the International Ocean Discovery Program, 372B/375: College Station, TX (International Ocean Discovery Program). https://doi.org/10.14379/iodp.proc.372B375.209.2022
2 Department of Earth & Environmental Science, New Mexico Institute of Mining & Technology, USA. UnderwoodM@missouri.edu
Abstract
Sediments deposited on the upper slope of the Hikurangi subduction margin, offshore New Zealand, are composed mostly of hemipelagic mud with interbeds of silt to sand that were modified after deposition by strong bottom currents. Some of those deposits were spot cored at Site U1519 during International Ocean Discovery Program (IODP) Expedition 375. This report provides the results of 76 X-ray diffraction analyses of the clay-sized fraction (<2 µm spherical settling equivalent). Sampling focused on the background lithology of hemipelagic mud. Normalized weight percent values for common clay-sized minerals (where smectite + illite + undifferentiated [chlorite + kaolinite] + quartz = 100%) reveal unusually small amounts of scatter both within and between the two lithostratigraphic units. The mean and standard deviation (σ) values for Unit I are smectite = 44.1 wt% (σ = 3.7), illite = 34.0 wt% (σ = 2.8), undifferentiated (chlorite + kaolinite) = 10.7 wt% (σ = 1.3), and quartz = 11.2 wt% (σ = 2.2). The mean and standard deviation values for Unit II are smectite = 49.9 wt% (σ = 5.5), illite = 31.9 wt% (σ = 4.0), undifferentiated (chlorite + kaolinite) = 5.8 wt% (σ = 1.8), and quartz = 12.3 wt% (σ = 7.4). Large gaps between cored intervals preclude recognition of possible depth-dependent or age-dependent trends, but the values at Site U1519 closely match those at nearby Site U1517 (Tuaheni Landslide Complex). Two major unconformities were interpreted in seismic reflection profiles that cross Site U1519, and compositional differences across those features are trivial. Variations among indicators of clay diagenesis are also relatively small. The average value of the illite crystallinity index is 0.537Δ°2θ (σ = 0.019). The expandability of smectite + illite/smectite mixed-layer clay averages 79% (σ = 3%), and the average proportion of illite in illite/smectite mixed-layer clay is 13% (σ = 6%).
Introduction
The International Ocean Discovery Program (IODP) implemented Expeditions 372 and 375 to study the dynamics of slow-slip events along the Hikurangi subduction margin (Saffer et al., 2017). The IODP coring transect, with a total of five sites, was positioned offshore the Poverty Bay region of North Island, New Zealand (Figures F1, F2A). The coring program at IODP Site U1519 (Figure F2B) was discontinuous and designed mostly to groundtruth seismic reflection interpretations of trench-slope stratigraphy in the Tuaheni Basin (Figure F2C) (Saffer et al., 2017; Saffer et al., 2019). This data report summarizes the results of X-ray diffraction (XRD) analyses of clay mineral assemblages in the Tuaheni Basin (Figure F2C). The study's principal objective is to demonstrate whether or not stratigraphic variations exist in sediment composition, especially the clay mineral assemblages. A secondary objective is to provide constraints on interpretations of detrital provenance, weathering and erosion in the source areas, and patterns of sediment dispersal offshore. The results from Site U1519, with a focus on Pleistocene trench-slope sediment, expands upon regional-scale documentation of Hikurangi clay composition (e.g., Underwood, 2020; Underwood, 2021a; Underwood, 2021b), including the results from the nearby Tuaheni Landslide Complex at IODP Site U1517 (Underwood and Dugan, 2021). Such compositional data are widely used as proxies for regional-scale reconstructions of paleoclimate, paleoceanography, and paleogeography (e.g., Petschick et al., 1996; Thiry, 2000; Phillips et al., 2014). These results can also be integrated with regional-scale compilations of near-surface sediment types (e.g., Bostock et al., 2019).
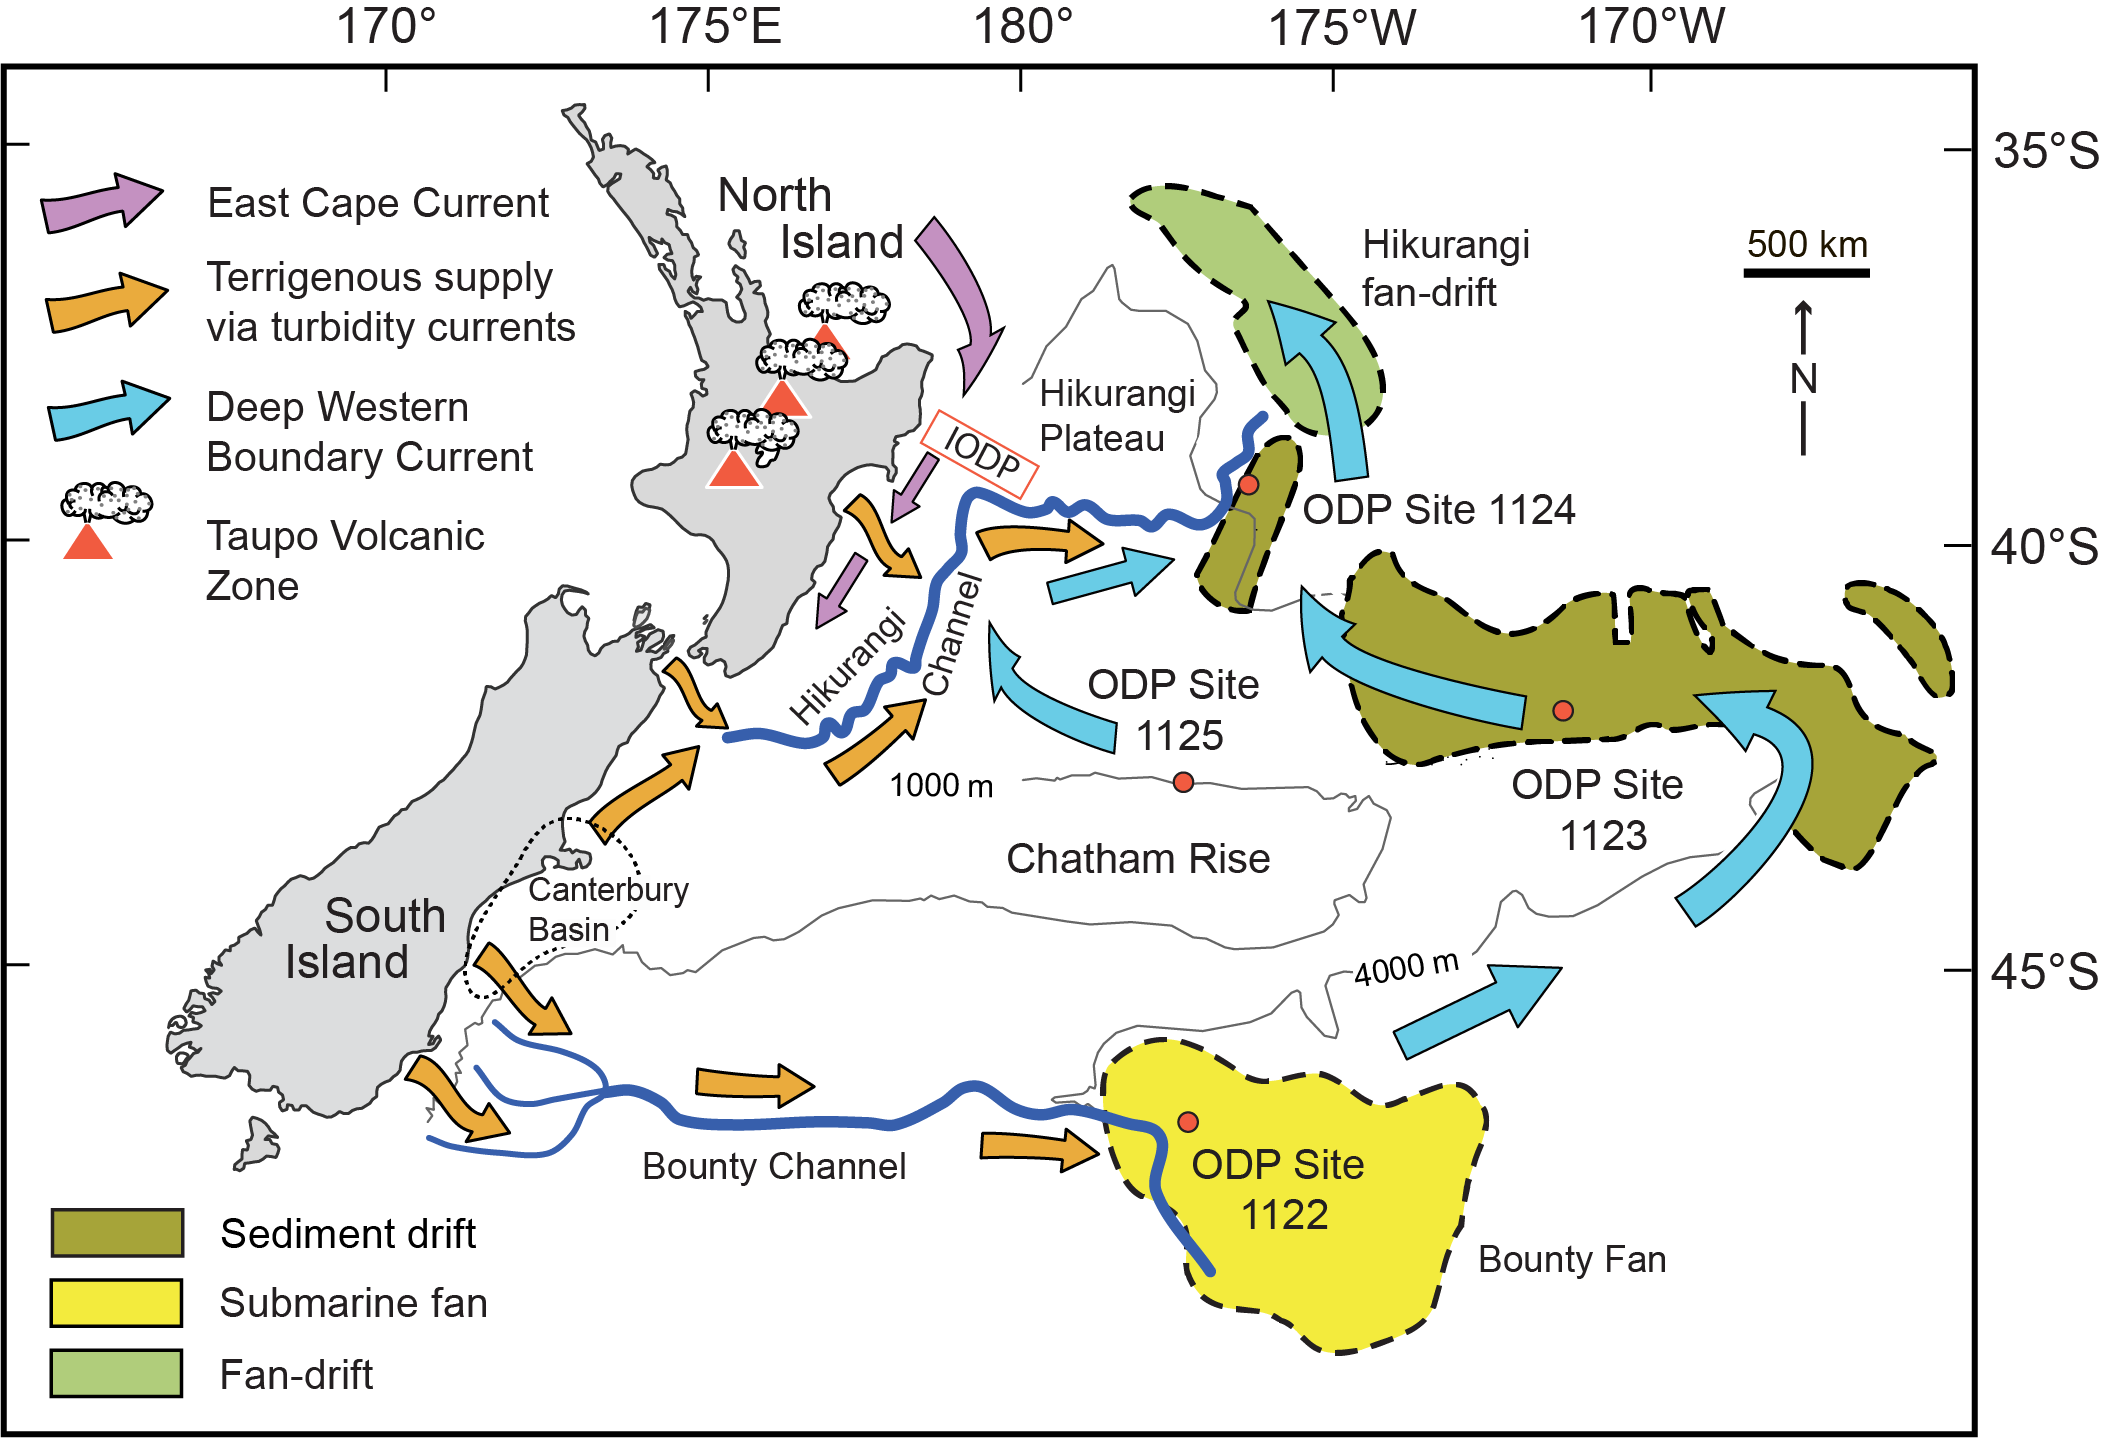
Figure F1. New Zealand and vicinity.
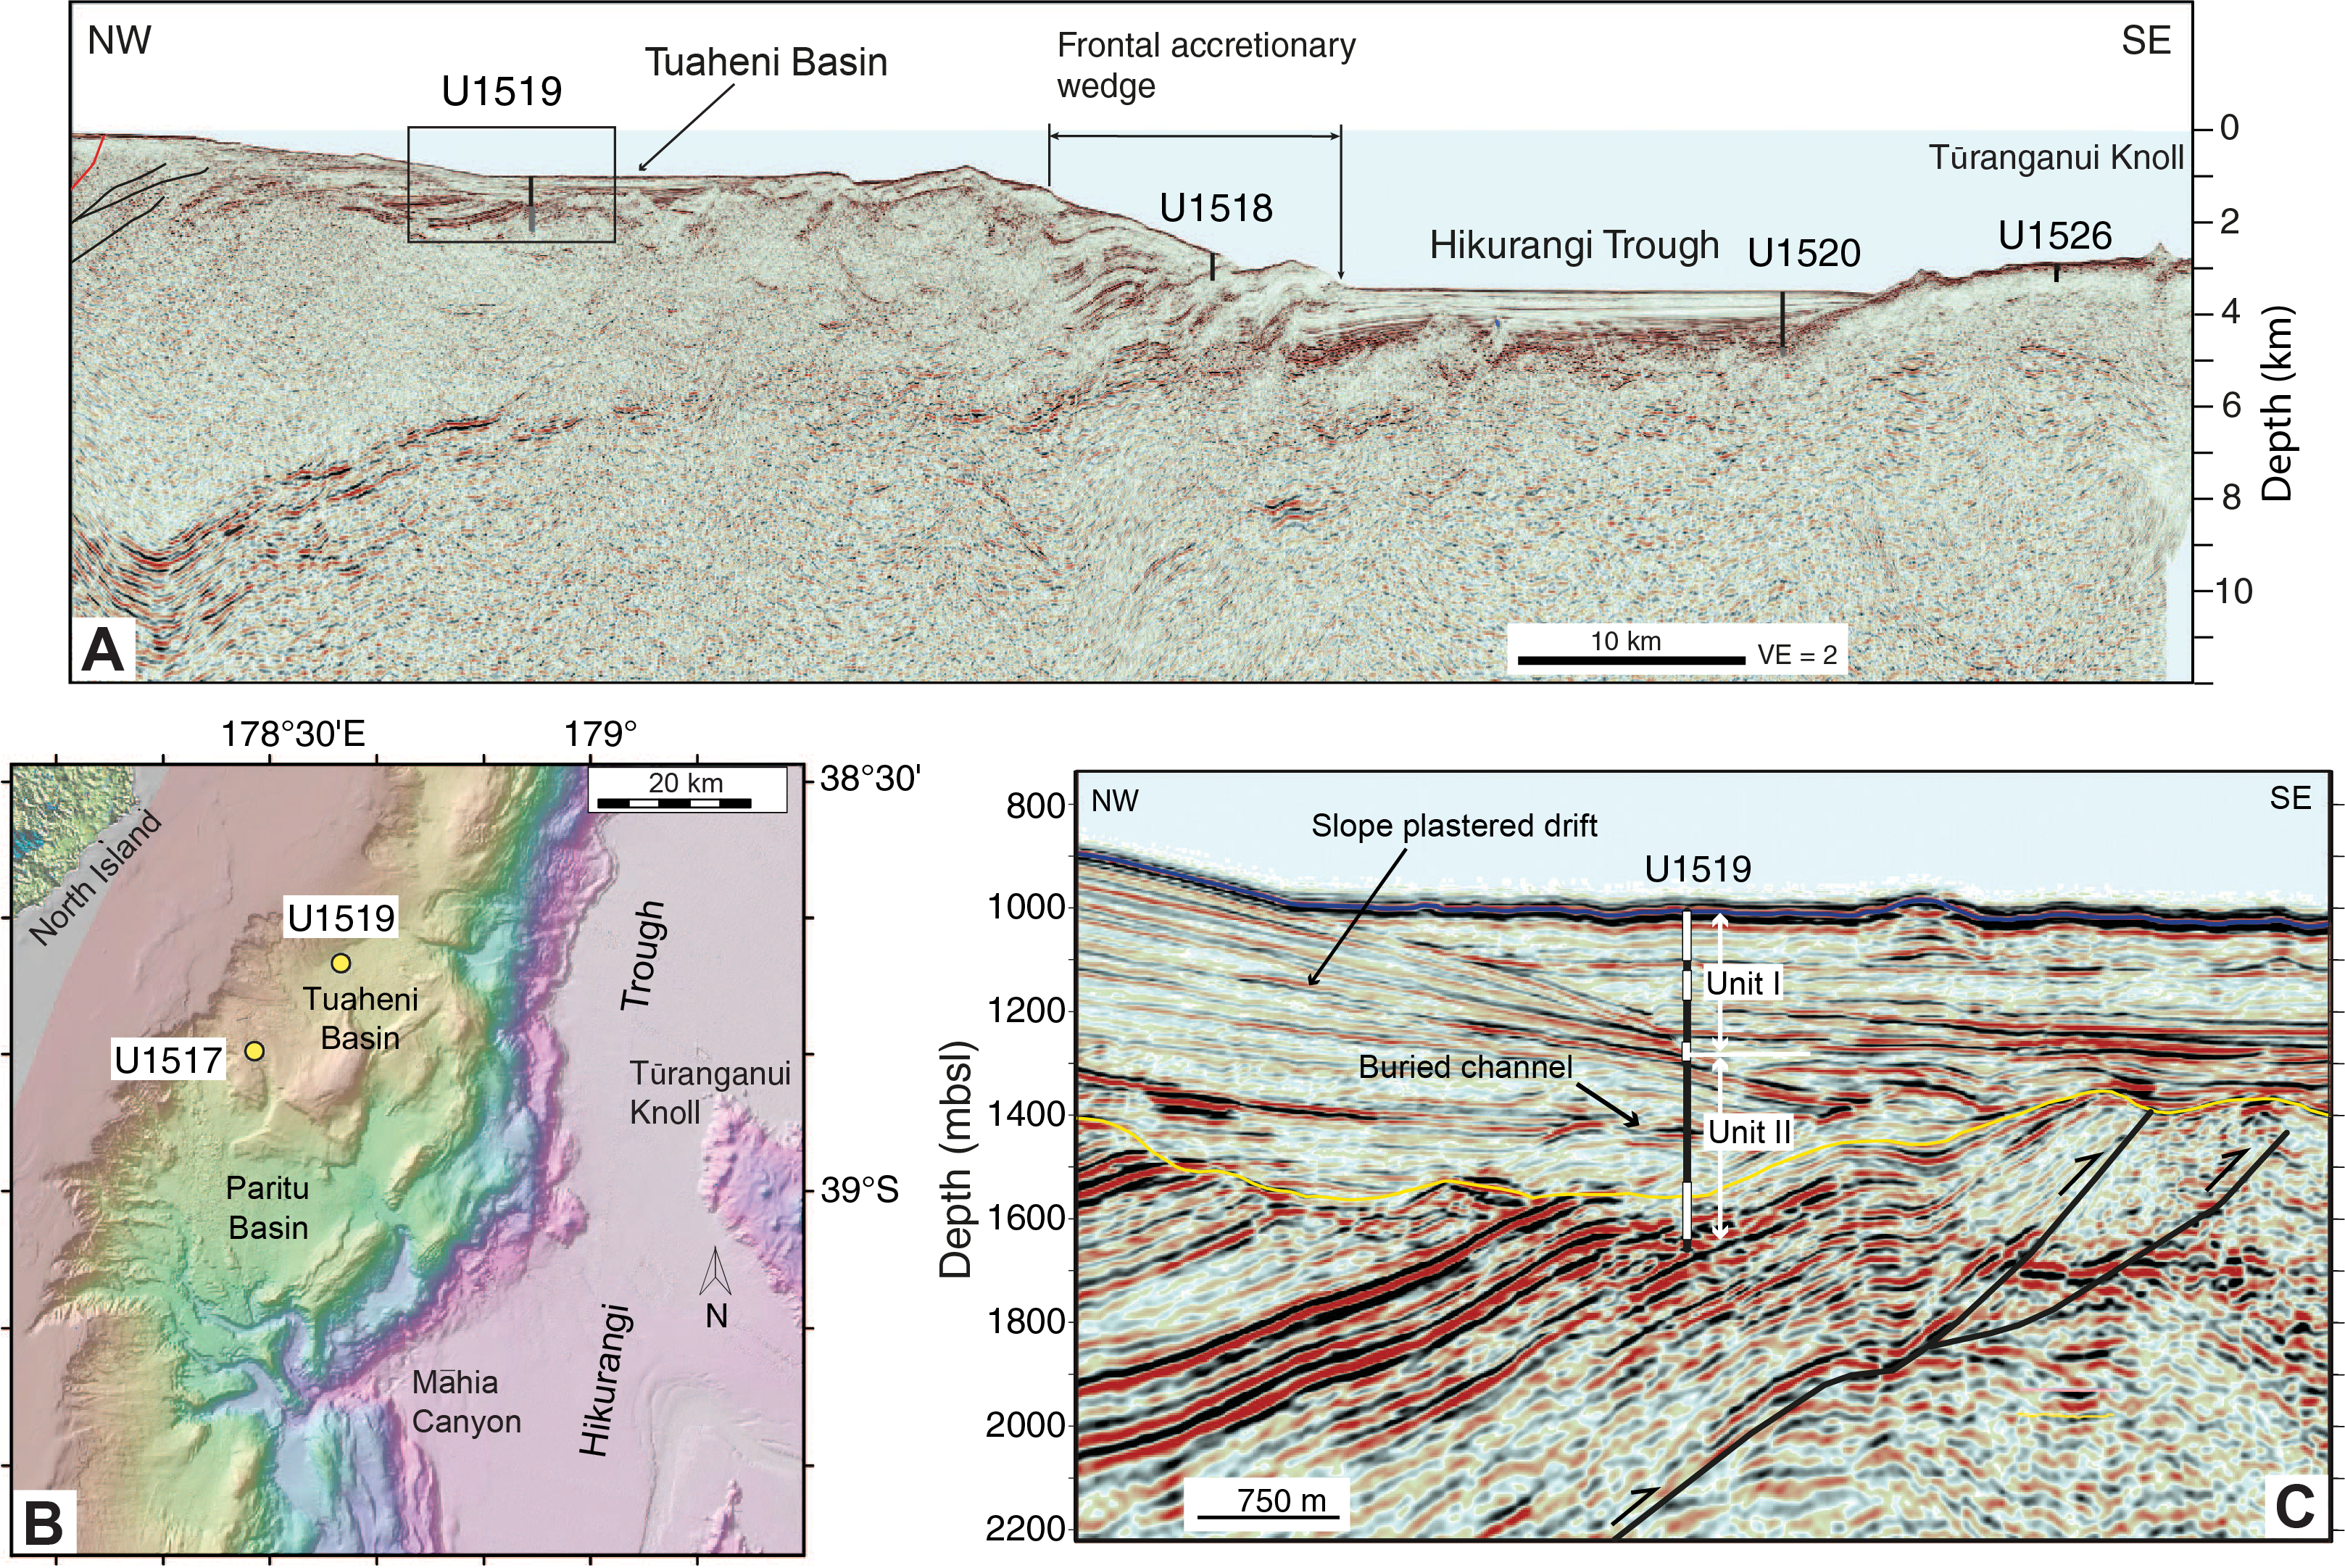
Figure F2. Seismic reflection profile and bathemetry.
Studies of detrital provenance and offshore dispersal paths are particularly challenging in the case of the Hikurangi depositional system. Prominent erosional features indicate that some sediment has been funneled across the margin via sediment gravity flows through such conduits as Māhia (Poverty) Canyon (e.g., Alexander et al., 2010; Pouderoux et al., 2012; McArthur and McCaffrey, 2019). Unlike turbidity currents, however, the pathways and physical processes responsible for transport of suspended sediment are multifaceted. In addition to mud transport by downslope gravity flows, finer grained suspended sediment is also moved by surface currents and bottom currents. In the Hikurangi system (Figure F1), the continental shelf and uppermost slope are affected by the Wairarapa Coastal Current, which is a northeast-directed surface current (Chiswell et al., 2015). A strong southwest-directed current (the East Cape Current) impacts the intermediate to lower trench slope (Chiswell et al., 2015). Transient eddies (e.g., the Wairarapa Eddy) have been documented farther offshore (Chiswell, 2005). In deeper water, a branch of the Deep Western Boundary Current circumvents Chatham Rise (Figure F1) to flow toward the northeast near the Hikurangi Trough (Carter and Wilkin, 1999; Carter et al., 2002, 2004; Chiswell et al., 2015). Bottom currents are evidently strong enough on the middle to upper trench slope to create what Bailey et al. (2021a, 2021b) classified as a slope-plastered contourite drift, whereas the uppermost slope and shelf are classified as elongate mounded drifts. If their interpretations are correct, then the likelihood exists at Site U1519 for both homogenization and interfingering of clay mineral assemblages that were derived from multiple source areas; their compositional signatures, moreover, might be expected to reflect the cumulative effects of multidirectional dispersal routes and repetitive resuspension.
Summary of lithostratigraphy
During Expedition 375, shipboard sedimentologists defined two lithostratigraphic units in the trench-slope deposits at Site U1519 (Figure F3), using a combination of information from visual description of the split cores, smear slides, digital color, magnetic susceptibility logs, logging-while-drilling results, and core measurements by structural geologists (Barnes et al., 2019). Division of the lithostratigraphic units was also strongly influenced by interpretations of seismic stratigraphy (Saffer et al., 2017) and core-log-seismic integration (Barnes et al., 2019). Facies analysis during the expedition was hampered by extensive gaps between cored intervals (Figure F3), poor recovery in Hole U1519C (55%), and widespread coring disturbance in Hole U1519C. Overall, the common lithologies at Site U1519 include fine sand to silt beds (inferred turbidites), volcanic ash, and hemipelagic mud (i.e., silty clay to clayey silt with modest amounts of biogenic carbonate). Some intervals display evidence of soft-sediment deformation (Figure F3). No attempt was made during shipboard core description to discriminate between turbidites and hybrid sand/silt beds that may have been modified after their initial deposition by bottom currents. The depositional ages, based on calcareous nannofossils, planktonic foraminifers, and benthic foraminifers, range from 0.011 Ma near the seafloor to early Pleistocene (<2.17 Ma) at ~635 meters below seafloor (mbsf) (Barnes et al., 2019).
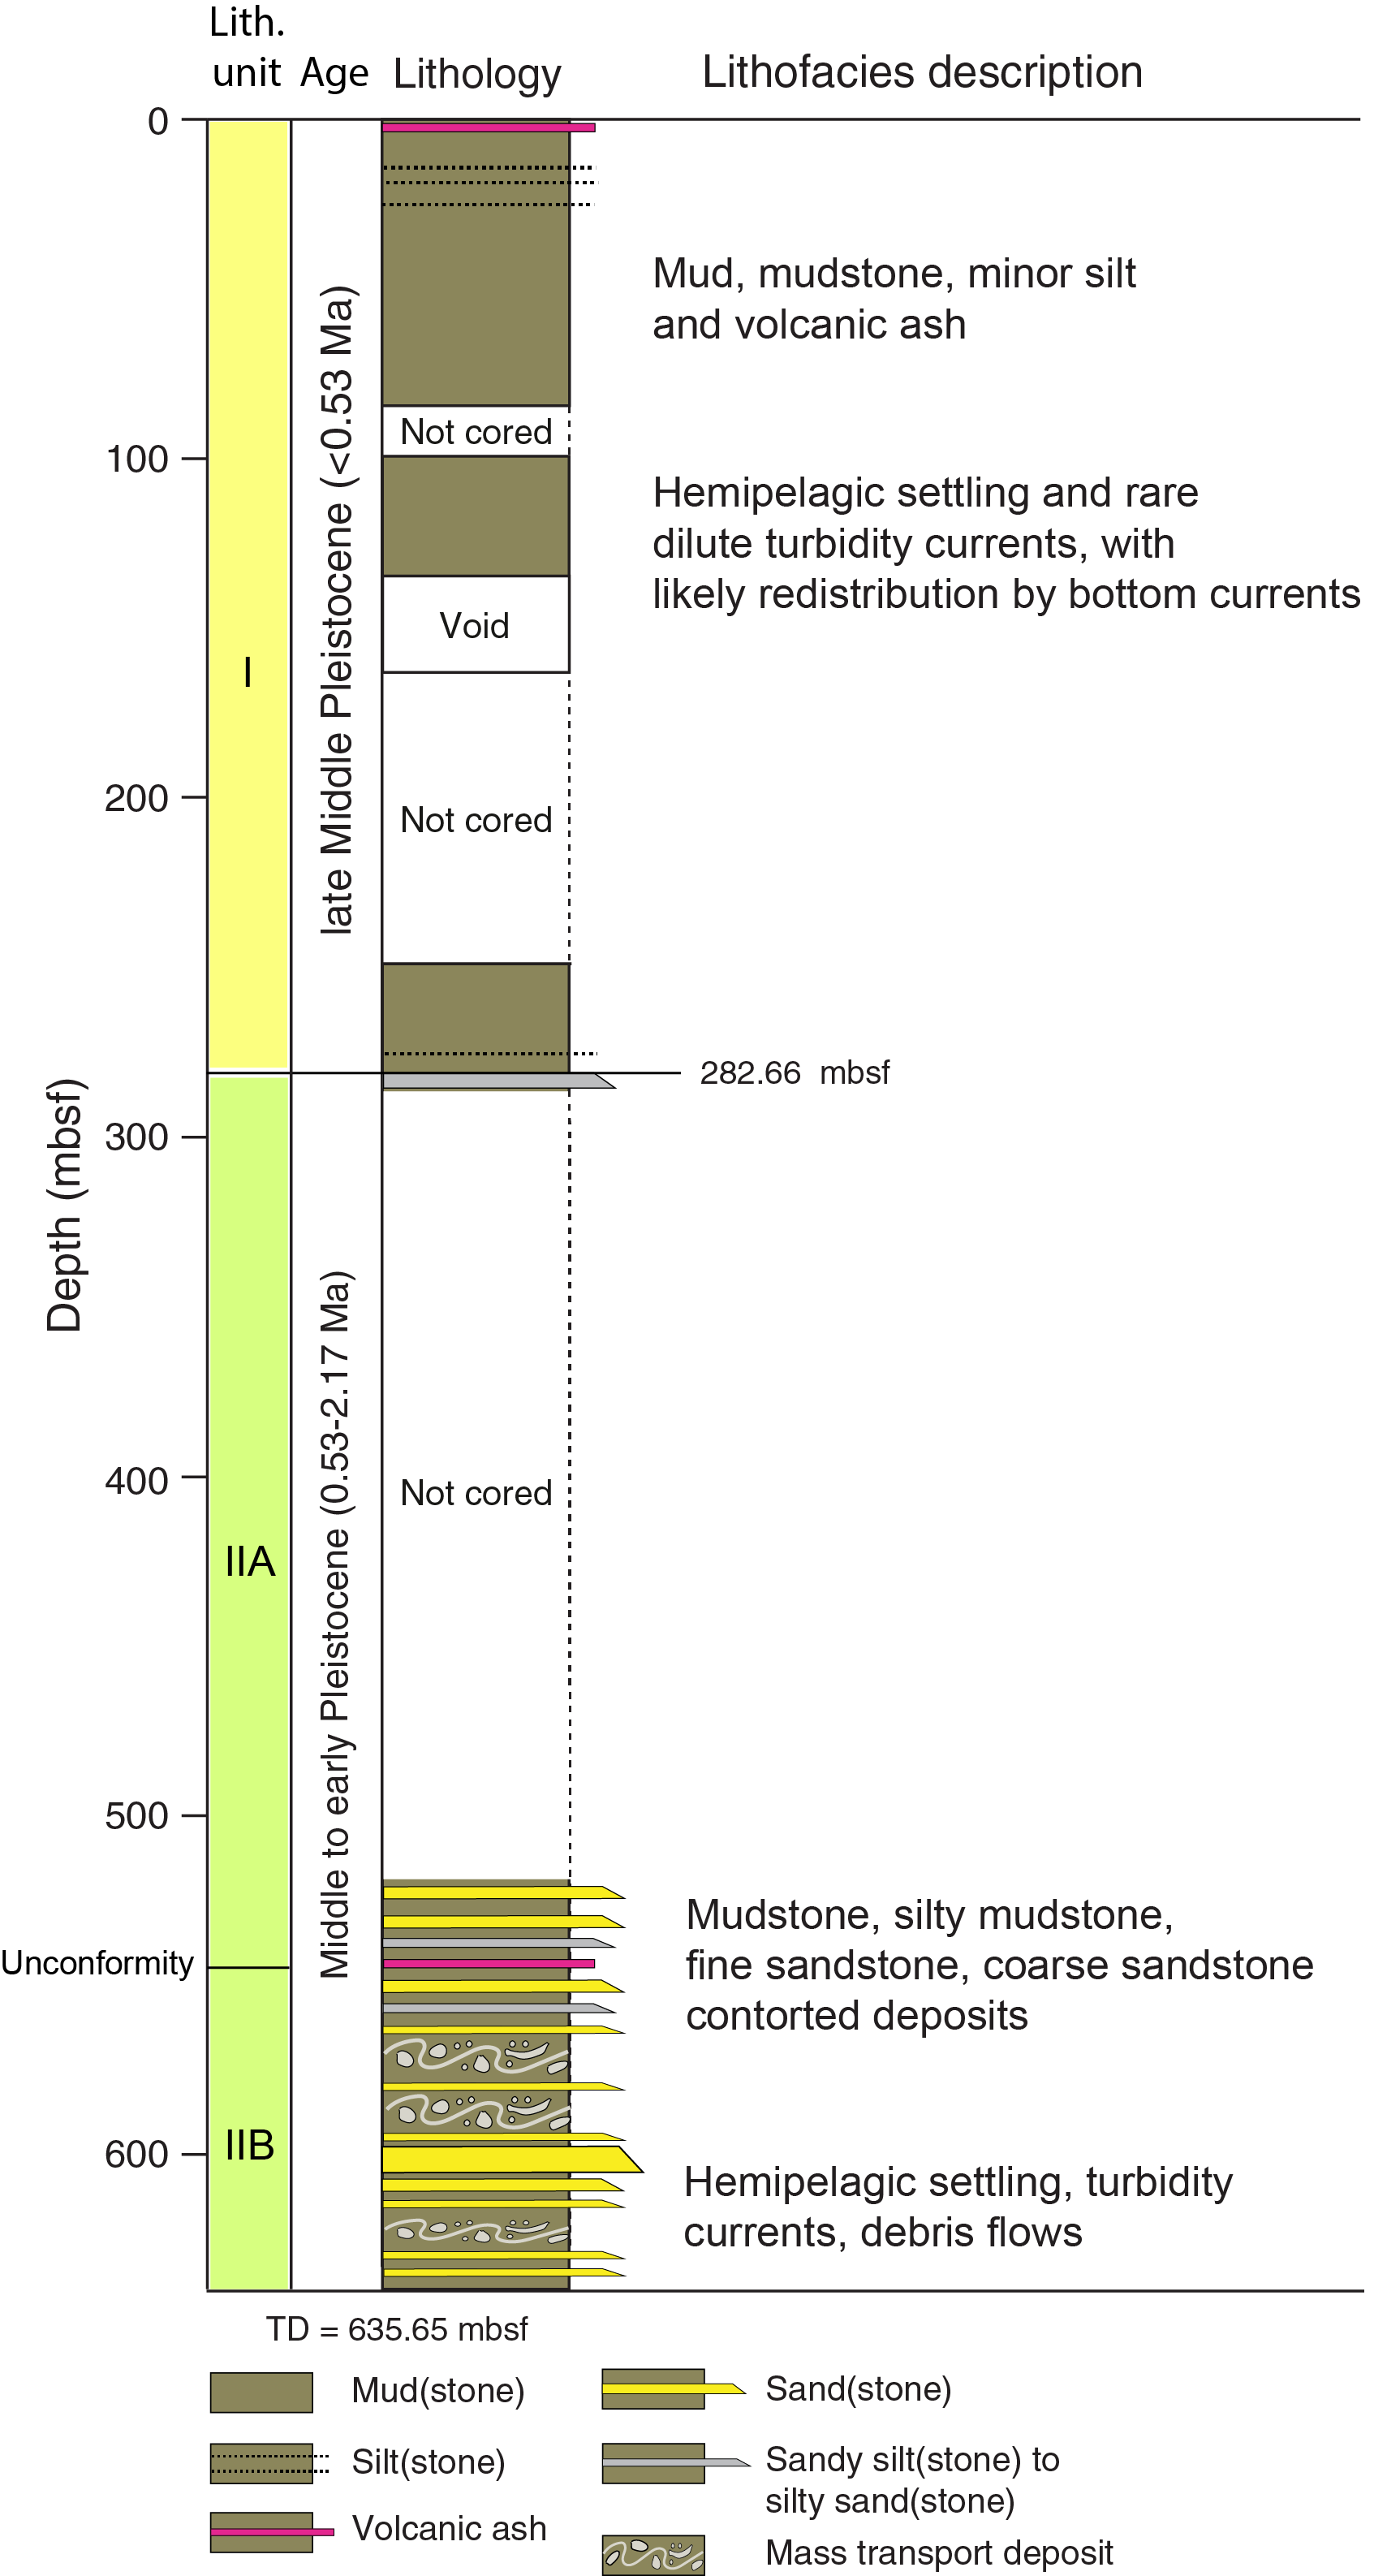
Figure F3. Stratigraphic column.
Lithostratigraphic Unit I (0–282.66 mbsf) is composed of hemipelagic mud and mudstone with sparse interbeds of silt and volcanic ash (Figure F3). The age of Unit I ranges from early Holocene to late Pleistocene (<0.53 Ma) (Barnes et al., 2019). Bailey et al. (2021a, 2021b) interpreted this stratigraphic interval to be a contourite drift based largely on its seismic reflection character. The Unit I/II boundary appears to be an unconformity based on its seismic reflection character (Figure F2C). Unit II (282.66–635.65 mbsf) consists mostly of mudstone with interbeds of siltstone, sandy siltstone, and sandstone (inferred turbidites). Bailey et al. (2021b) classified the upper parts of Unit II as a slope-plastered contourite drift based on its seismic reflection attributes. Their interpretation is impossible to groundtruth with confidence, however, because of the gap between cored intervals that extends from just below the unit boundary to ~520 mbsf (Figure F3). Some of the deeper intervals of recovered core display convolute laminae, mesoscale folds, dismembered bedding, and clasts of mudstone in a mudstone matrix; those features were interpreted to be products of intraformational mass transport (Barnes et al., 2019). Seismic reflection data also exhibit a distinctive undulating geometry at approximately 547 mbsf (Figure F2C). The apparent dips of reflectors steepen significantly below the suspected unconformity. However, shipboard scientists did not recognize any consequential changes in lithology or age over the equivalent depth range of cores (Barnes et al., 2019).
Methods
Samples
A total of 76 specimens were extracted from the working halves of split cores for XRD analysis. The primary intent was to focus consistently on the background lithology of silty clay to clayey silt (hemipelagic mud) in both lithostratigraphic units, but some of the sampling may have inadvertently captured the muddy tops of turbidites or hybrid turbidite-contourites. Most samples were collocated in “clusters” immediately adjacent to whole-round (WR) specimens. Some of those WR specimens were analyzed shipboard for interstitial water geochemistry (Barnes et al., 2019), whereas others were collected for shore-based tests of hydrogeological, frictional, and geotechnical properties. The clusters also included specimens for shipboard measurements of moisture and density, carbon-carbonate, and bulk powder XRD (see Wallace et al., 2019, for those XRD methods).
Sample preparation
Several steps are required to isolate the clay-sized fraction (<2 µm) for XRD analyses. The first is to place a split of air-dried sediment in a 600 mL beaker with 2% hydrogen peroxide to initiate disaggregation and remove organic matter. Next, the disaggregated sediment is suspended in ~250 mL of Na hexametaphosphate solution (concentration of 4 g/1000 mL distilled H2O). Beakers with suspended sediment are inserted into an ultrasonic bath for several minutes to promote dispersion and retard flocculation of the clays. Next, suspensions are washed of solutes by two passes through a centrifuge (8000 rpm for 20 min; ~6000 × g) with resuspension in distilled deionized water after each pass. After that step, the suspensions are transferred to 125 mL plastic bottles and dispersed by vigorous shaking plus insertion of an ultrasonic cell probe for ~2.5 min. Clay-sized splits (<2 µm equivalent spherical settling diameter) are separated from the silt and sand by centrifugation (1000 rpm for 3.6 min; ~320 × g). Oriented clay aggregates are prepared following the filter-peel method (Moore and Reynolds, 1989b) using 0.45 µm filter membranes and glass discs. This approach is desirable because better preferred orientation enhances the intensity of basal reflections. To saturate the clay aggregates with ethylene glycol, clay-covered discs are placed in a closed vapor chamber at room temperature for ~48 h. This last step expands the interlayer of smectite to ~17Å, which minimizes overlap between the peaks associated with smectite (001) and chlorite (001) reflections (Figure F4).

Figure F4. X-ray diffractogram.
X-ray diffractometer settings
The oriented aggregates were analyzed at the New Mexico Bureau of Geology and Mineral Resources, using a Panalytical X'Pert Pro diffractometer under the following parameters: generator settings = 45 kV and 40 mA, angular range = 2.0°–28.0°2θ, scan step time = 1.6 s, step size = 0.01°2θ, sample holder = stationary, slits fixed at 0.5 mm (divergence) and 0.1 mm (receiving), and specimen length = 10 mm. Raw data files were processed using MacDiff software (version 4.2.5) to establish a baseline of intensity, smooth counts, correct peak positions offset by slight misalignments of the detector and sample holder (using the quartz 100 peak at 20.95°2θ), record peak intensities (counts/step), and compute integrated peak areas (total counts). A representative diffractogram is shown in Figure F4, with identification of the diagnostic peaks for smectite, illite, mixed-layer illite/smectite (I/S), undifferentiated (chlorite + kaolinite), and quartz.
Computations of mineral abundance
Computations of relative abundances for each of the common clay-sized minerals were based on values of integrated peak area from the smectite (001), illite (001), chlorite (002) + kaolinite (001), and quartz (100) reflections (Figure F4). As scrutinized in more detail by Underwood et al. (2020), three computational approaches were tested during this study:
- Biscaye (1965) peak-area weighting factors, which are equal to 1× smectite, 4× illite, and 2× undifferentiated (chlorite + kaolinite);
- A set of regression equations that relate peak area to weight percent, where smectite + illite + undifferentiated (chlorite + kaolinite) + quartz = 100%; and
- A matrix of singular value decomposition (SVD) normalization factors (see Fisher and Underwood [1995] and Underwood et al. [2003] for a full description of the SVD approach), also where smectite + illite + undifferentiated (chlorite + kaolinite) + quartz = 100% (Table T1).
The method of Guo and Underwood (2011) was used to estimate proportions of chlorite to kaolinite within that two-component mixture, although the method's accuracy deteriorates with low-intensity peaks. When using either SVD factors or regression equations, the sum of the four main relative abundance values is sometimes less than 100%, and the associated suppression of peak intensity is usually caused by filter-peel transfers that are too thin (i.e., less than “infinite” thickness). Another contributing factor, however, might be inclusion of additional minerals or amorphous solids within the clay-sized fraction (e.g., feldspar, volcanic glass shards, and biogenic calcite). To overcome those technical artifacts, the four relative abundance values were normalized to 100%.
Underwood et al. (2020) determined errors of accuracy using XRD data from standard mineral mixtures. Errors are largest (as high as ±18.6%) when the Biscaye (1965) weighting factors are used in computations. The average absolute errors of accuracy are smallest when regression equations are used: illite = 3.0 wt%, smectite = 3.9 wt%, and undifferentiated (chlorite + kaolinite) = 5.1 wt%. Errors using SVD factors are slightly larger than those using regression equations (Underwood et al., 2020). Accordingly, the graphical plots and statistical comparisons in this report use data computed from the regression equations. Compositional differences among individual specimens and lithostratigraphic units are not considered to be geologically significant unless those differences are greater than the errors shown above (3–5 wt%).
Underwood et al. (2020) showed that the Biscaye-based computations systematically overestimate the proportion of undifferentiated (chlorite + kaolinite) and systematically underestimate the proportion of illite. Furthermore, Biscaye-computed estimates for %smectite tend to be systematically lower than regression-computed values at lower concentrations (<25 wt%) and systematically higher than regression-computed values at higher concentrations (>35 wt%). Regardless of those shortcomings, the Biscaye-computed values are tabulated in this report to permit direct comparisons with legacy data from previous XRD studies in the Hikurangi region (e.g., Winkler and Dullo, 2002). Another weakness of the Biscaye (1965) approach, however, is that it does not account for clay-sized quartz, a common detrital component that might influence geotechnical and frictional properties. To permit valid comparisons among all three sets of computational results, the relative weight percent values from SVD and regression equations were recalculated to a normalized three-component, clay-only assemblage, where smectite + illite + undifferentiated (chlorite + kaolinite) = 100%. That clay-only assemblage is probably the most relevant data set for studies of detrital provenance and sediment dispersal (e.g., Phillips et al., 2014).
This report includes bulk sediment weight percent values to assist with assessments of postexpedition laboratory experiments that quantify frictional and geotechnical properties (e.g., Ikari et al., 2018). To compute the normalized percentage of each individual clay mineral (e.g., smectite) in the bulk sediment, the normalized relative abundance of total clay minerals, as obtained from shipboard bulk powder XRD (Barnes et al., 2019), was multiplied by the computed weight percent value for that specific clay mineral (e.g., smectite) in the normalized clay-only assemblage. For example, if total clay minerals equals 43 wt% and the normalized proportion of smectite among the clay minerals equals 52 wt%, then the estimated amount of smectite in the bulk sediment equals 21.8 wt%. A key assumption here is that all clay minerals reside in the clay-sized fraction, as defined by spherical equivalent (Stokes) settling behavior.
Given the relatively shallow burial depths of all samples analyzed (<635 mbsf), together with the projected in situ temperatures of ~21°C at the bottom of the cored interval (Barnes et al., 2019), the common XRD criteria for evaluating clay diagenesis should be viewed as indicators of geologic conditions within detrital source areas. Three such criteria were evaluated. The first measure is based on the width of the illite (001) peak at half maximum (units = Δ°2θ) and is usually referred to as illite crystallinity or the Kübler Index (e.g., Kisch, 1991; Warr and Ferreiro Mählmann, 2015). Those peaks sharpen and narrow as detrital mixtures of illite plus illitic white mica become more crystalline. The second indicator of diagenesis uses the saddle:peak intensity ratio (Figure F4) to compute the “expandability” of smectite plus I/S mixed-layer clay in the assemblage (Rettke, 1981). This method is sensitive to the proportions of discrete illite versus I/S mixed-layer clay, so the curve for a 1:1 mixture of I and S + I/S was chosen. The third method involves computation of the percentage of illite layers in the I/S mixed-layer clay based on a visual pick of the angular position (°2θ) of the composite I(002)/S(003) peak (Figure F4). With progressive illitization, that peak shifts systematically to higher diffraction angles (Moore and Reynolds, 1989a). A reliable determination of %illite is not possible, however, unless the intensity of the I/S peak is high enough to resolve a clear apex above background noise.
Results
Clay mineral assemblages
The results of 76 XRD measurements are tabulated in Table T2, and the computed values of relative and normalized weight percent, using the three computational approaches, are listed in Table T3. When viewed as a whole, the trench-slope section at Site U1519 (Units I and II) displays minimal scatter in clay-sized mineral assemblages (Figure F5), especially when compared to trench-floor deposits at nearby IODP Sites U1518 and U1520 (Underwood, 2021b). The proportions of smectite in Unit I range 29.0–49.4 wt%, with a mean value (µ) of 44.1 wt% and a standard deviation (σ) of 3.7. Weight percent values for illite range 28.7–42.5 wt% (µ = 34.0; σ = 2.8), and the proportion of undifferentiated (chlorite + kaolinite) ranges 8.3–15.1 wt% (µ = 10.7; σ = 1.3). In Unit II, proportions of smectite range 34.4–55.8 wt%, with a slightly higher mean value of 49.9 wt% and a standard deviation of 5.5. Weight percent values for illite range 26.8–56.1 wt% (µ = 31.9; σ = 4.0), and the proportion of undifferentiated (chlorite + kaolinite) ranges 4.3–20.6 wt% (µ = 5.8; σ = 1.8). Careful examination of the overlapping chlorite (004) and kaolinite (002) peaks (following Guo and Underwood, 2011) indicates that kaolinite occurs in trace amounts, with an average of only 0.5 wt%. The content of clay-sized quartz shows more variability, ranging 8.4–46.5 wt%. Higher quartz content in the clay-sized fraction is typically an effect of very fine silt in the muddy tops of turbidites, which are significantly more abundant in Unit II (Figure F5). These mean and standard deviation values are nearly identical to comparable results for mud and mudstone at Site U1517 (Figure F2B) on the upper trench slope (Underwood and Dugan, 2021).

Figure F5. Normalized relative abundance.
Normalized weight percent values among the clay minerals (i.e., where smectite + illite + undifferentiated [chlorite + kaolinite] = 100%) are tabulated in Table T3. These results (Figure F6) also reveal unusually small degrees of scatter within and between the two lithostratigraphic units. The values of mean weight percent and standard deviation for Unit I are as follows:
- Smectite: µ = 49.7 wt% and σ = 4.1.
- Illite: µ = 38.3 wt% and σ = 3.1.
- Undifferentiated (chlorite + kaolinite): µ = 12.0 wt% and σ = 1.3.
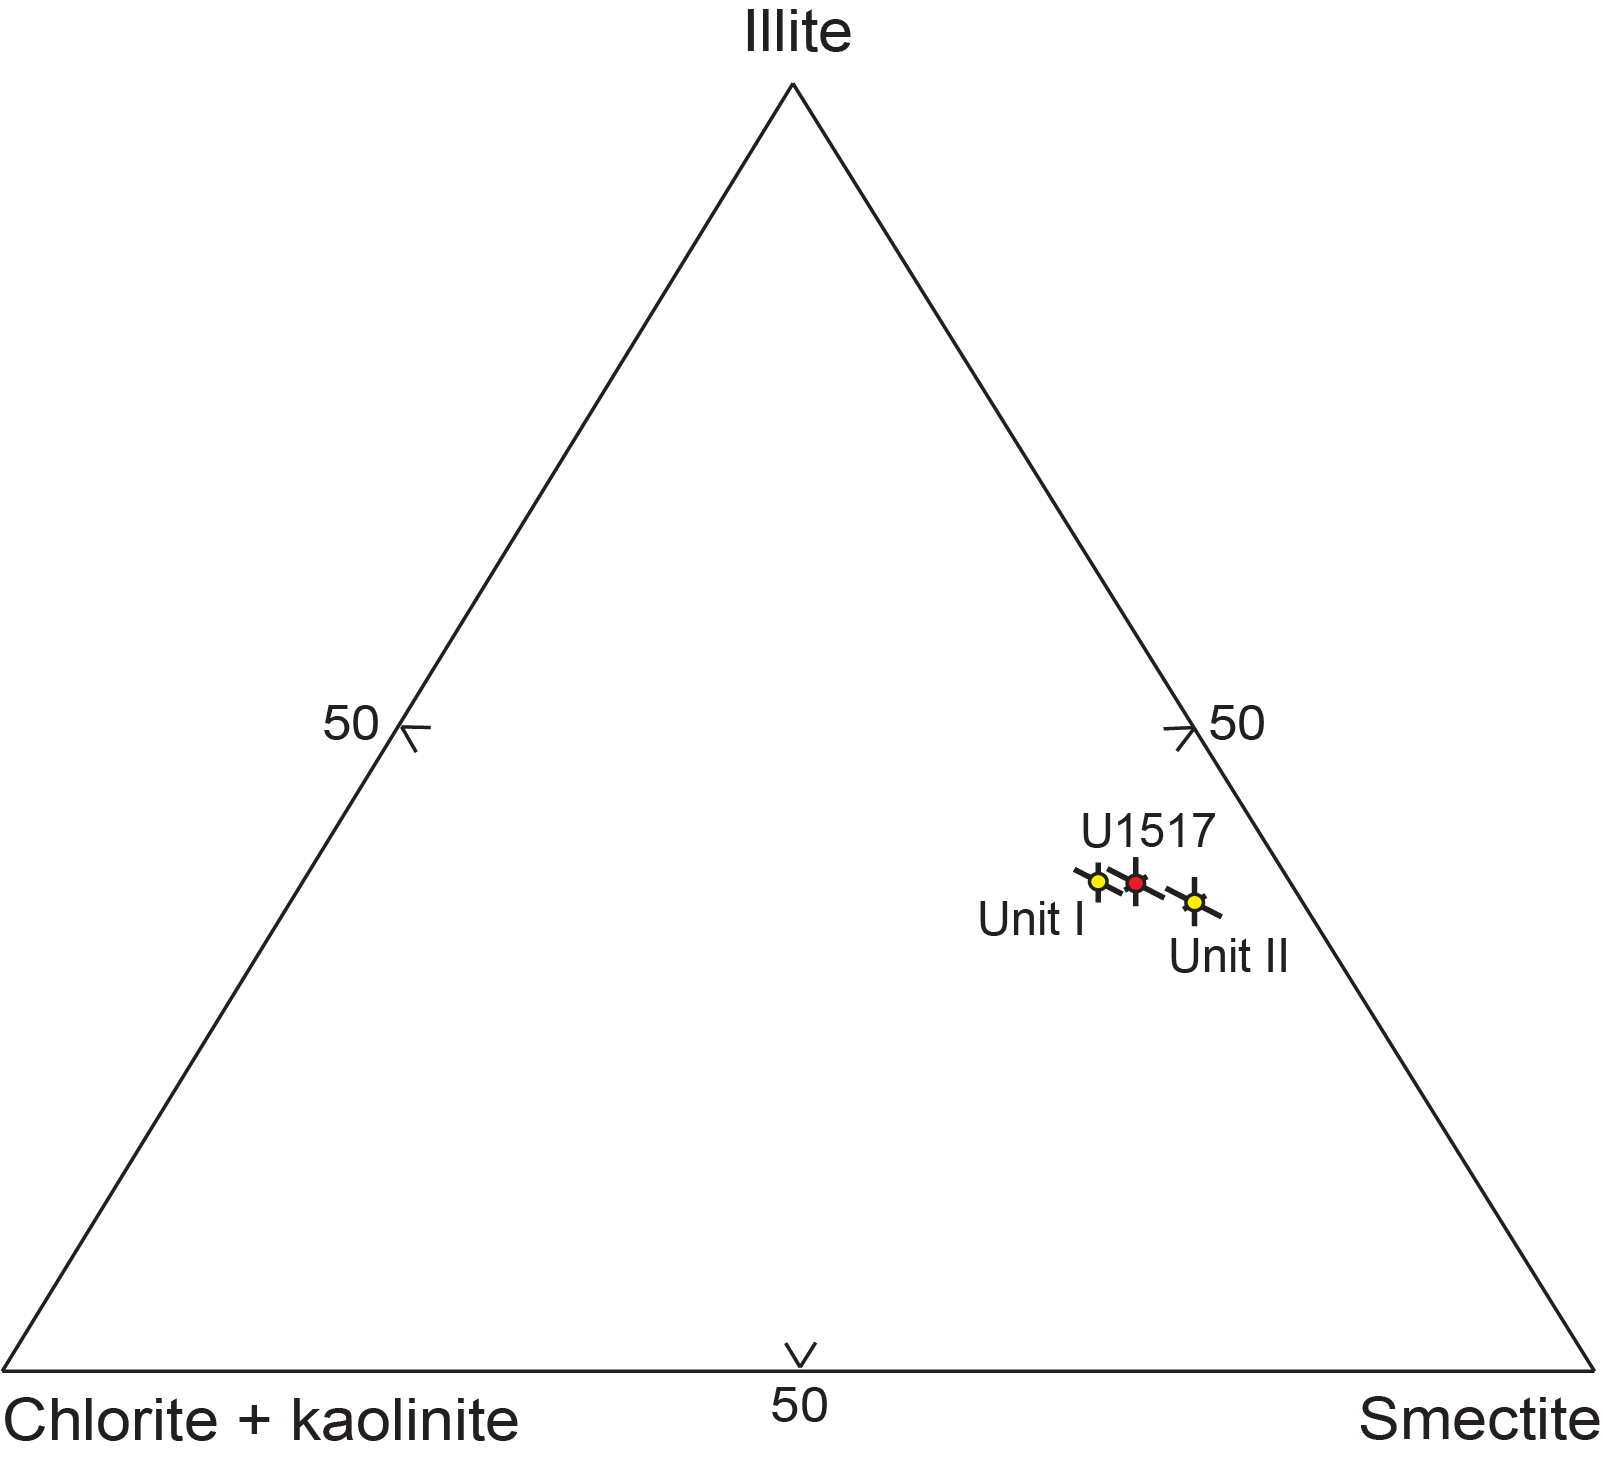
Figure F6. Mean weight percent values.
Comparable values for Unit II are as follows:
- Smectite: µ = 57.0 wt% and σ = 4.9.
- Illite: µ = 36.4 wt% and σ = 3.8.
- Undifferentiated (chlorite + kaolinite): µ = 6.6 wt% and σ = 1.9.
Statistical differences between the two lithostratigraphic units (Figure F6) are only slightly greater than the margins of accuracy for the clay XRD methods. In addition, the statistics for Site U1519 (Figure F6) closely match those reported for comparable lithologies at nearby Site U1517 (Underwood and Dugan, 2021):
- Smectite: µ = 52.4 wt%, σ = 4.9.
- Illite: µ = 37.9 wt%, σ = 4.1.
- Chlorite + kaolinite: µ = 9.7 wt%, σ = 1.8.
Indicators of clay diagenesis
At Site U1519, values of crystallinity index for the detrital illite assemblage fall in a narrow range between 0.479Δ°2θ and 0.588Δ°2θ, with a mean of 0.537Δ°2θ and a standard deviation of 0.019 (Table T2; Figure F7). According to the criteria of Warr and Ferreiro Mählmann (2015), that range of crystallinity values straddles a boundary at 0.52Δ°2θ that separates the realm of advanced diagenesis from anchimetamorphism (i.e., incipient greenschist facies). Given the calculated geothermal gradient for Hole U1519C (Barnes et al., 2019), which projects to a bottom-hole temperature of only 21°C, these results should be viewed as indicators of geologic conditions in the detrital source terranes of New Zealand (e.g., Warr and Cox, 2016) rather than reliable measures of in situ diagenesis. Along similar lines, expandability of the assemblage of smectite and smectite-rich I/S mixed-layer clay ranges 74%–87%, with a mean value of 79% and a standard deviation of 3% (Table T2; Figure F7). For generic reference, lower values (less expandability) are consistent with higher proportions of detrital I/S mixed-layer clay in the mix, whereas higher values are indicative of dominance by discrete smectite derived from altered volcanic sources. Percentages of illite within the I/S mixed-layer phase range 1%–26%, with a mean of 13% and a standard deviation of 6% (Table T2; Figure F7). No systematic variations or gradients are obvious in any of these diagenetic indicators as a function of burial depth.
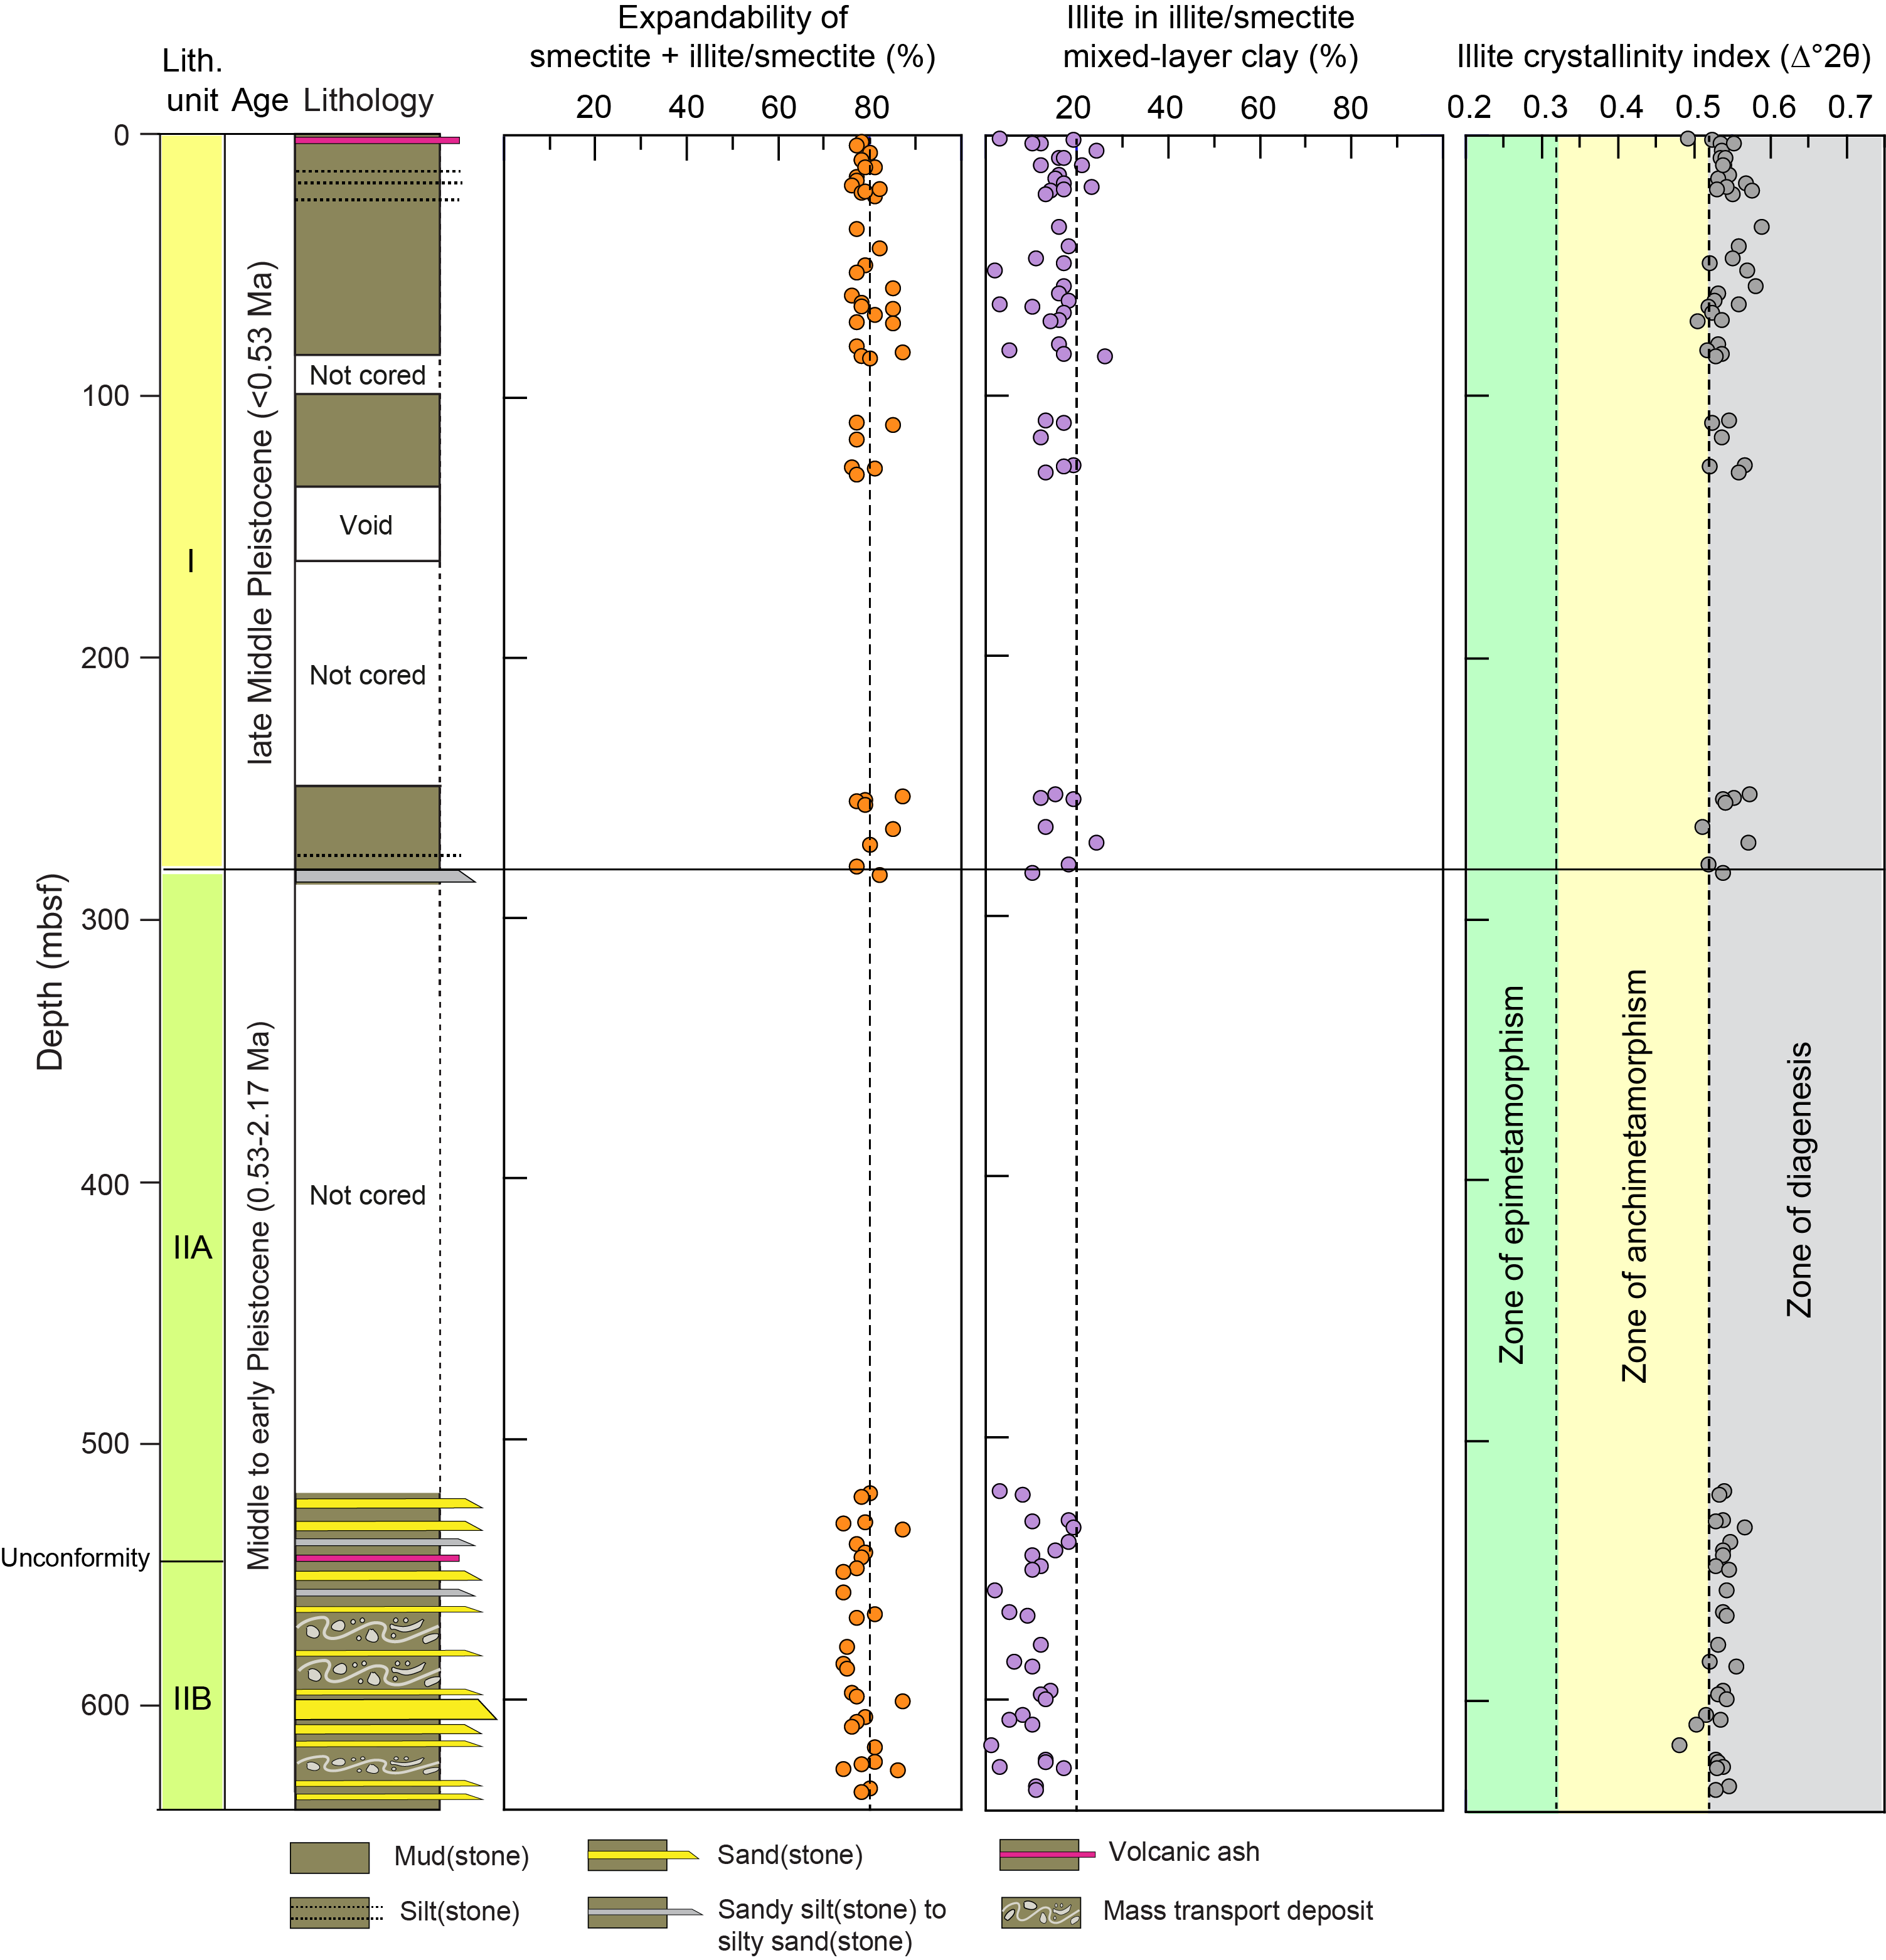
Figure F7. Expandability values.
Conclusions
XRD analyses of the clay-sized fraction of hemipelagic mud(stone) specimens from Site U1519 (trench-slope deposits) reveal unusually small amounts of variability in clay mineral assemblages, especially when compared to data from Hikurangi trench-floor deposits (Underwood, 2021b). Smectite is the dominant clay mineral throughout the cored intervals. Small increases in the abundance of smectite are balanced mostly by decreases in the abundance of illite and vice versa. Results from limited coring intervals at Site U1519 closely match those from continuous coring of the Tuaheni Landslide Complex at nearby Site U1517 (Underwood and Dugan, 2021). Considering Site U1519 as a whole (Units I and II), the proportions of smectite in the clay-sized fraction range 29.0–55.8 wt%, with a mean value (µ) of 46.4 wt% and a standard deviation (σ) of 5.3. Weight percent values for illite range 18.8–42.5 wt% (µ = 33.2; σ = 3.5), and the proportion of undifferentiated (chlorite + kaolinite) ranges 0–15.5 wt% (µ = 8.8; σ = 2.8). The content of clay-sized quartz shows more variability, ranging 8.2–46.5 wt% (µ = 11.7; σ = 4.9). Clay mineralogy does not change significantly across two interpreted unconformities, nor are there compositional excursions across the Unit I/II boundary. Depth-dependent trends are not obvious in XRD indicators of clay diagenesis (illite crystallinity index, smectite expandability, and %illite in I/S mixed layer clay). Their values should be viewed as measures of geologic conditions within potential detrital source regions.
Acknowledgments
This study used samples provided by the International Ocean Discovery Program (IODP). Funding for this research was provided by the U.S. Science Support Program. I thank the crew members, IODP technicians, co-chief scientists, and fellow shipboard scientists for their assistance with sample acquisition during Expedition 375. Karissa Rosenberger and Mercedes Salazar assisted with sample preparation at New Mexico Tech, and Kelsey McNamara completed XRD scans at the New Mexico Bureau of Geology and Mineral Resources. Alan Orpin provided useful review comments.
References
Alexander, C.R., Walsh, J.P., and Orpin, A.R., 2010. Modern sediment dispersal and accumulation on the outer Poverty continental margin. Marine Geology, 270(1–4):213–226. https://doi.org/
Bailey, W., McArthur, A., and McCaffrey, W., 2021a. Sealing potential of contourite drifts in deep-water fold and thrust belts: examples from the Hikurangi Margin, New Zealand. Marine and Petroleum Geology, 123:104776. https://doi.org/
Bailey, W.S., McArthur, A.D., and McCaffrey, W.D., 2021b. Distribution of contourite drifts on convergent margins: examples from the Hikurangi subduction margin of New Zealand. Sedimentology, 68(1):294–323. https://doi.org/
Barnes, P.M., Wallace, L.M., Saffer, D.M., Pecher, I.A., Petronotis, K.E., LeVay, L.J., Bell, R.E., Crundwell, M.P., Engelmann de Oliveira, C.H., Fagereng, A., Fulton, P.M., Greve, A., Harris, R.N., Hashimoto, Y., Hüpers, A., Ikari, M.J., Ito, Y., Kitajima, H., Kutterolf, S., Lee, H., Li, X., Luo, M., Malie, P.R., Meneghini, F., Morgan, J.K., Noda, A., Rabinowitz, H.S., Savage, H.M., Shepherd, C.L., Shreedharan, S., Solomon, E.A., Underwood, M.B., Wang, M., Woodhouse, A.D., Bourlange, S.M., Brunet, M.M.Y., Cardona, S., Clennell, M.B., Cook, A.E., Dugan, B., Elger, J., Gamboa, D., Georgiopoulou, A., Han, S., Heeschen, K.U., Hu, G., Kim, G.Y., Koge, H., Machado, K.S., McNamara, D.D., Moore, G.F., Mountjoy, J.J., Nole, M.A., Owari, S., Paganoni, M., Rose, P.S., Screaton, E.J., Shankar, U., Torres, M.E., Wang, X., and Wu, H.-Y., 2019. Site U1519. In Wallace, L.M., Saffer, D.M., Barnes, P.M., Pecher, I.A., Petronotis, K.E., LeVay, L.J., and the Expedition 372/375 Scientists, Hikurangi Subduction Margin Coring, Logging, and Observatories. Proceedings of the International Ocean Discovery Program, 372B/375: College Station, TX (International Ocean Discovery Program). https://doi.org/
Biscaye, P.E., 1965. Mineralogy and sedimentation of recent deep-sea clay in the Atlantic Ocean and adjacent seas and oceans. Geological Society of America Bulletin, 76(7):803–832. https://doi.org/
Bostock, H., Jenkins, C., Mackay, K., Carter, L., Nodder, S., Orpin, A., Pallentin, A., and Wysoczanski, R., 2019. Distribution of surficial sediments in the ocean around New Zealand/Aotearoa, Part A: Continental slope and deep ocean. New Zealand Journal of Geology and Geophysics, 62(1):1–23. https://doi.org/
Carter, L., Carter, R.M., and McCave, I., 2004. Evolution of the sedimentary system beneath the deep Pacific inflow off eastern New Zealand. Marine Geology, 205(1–4):9–27. https://doi.org/
Carter, L., Manighetti, B., Elliot, M., Trustrum, N., and Gomez, B., 2002. Source, sea level and circulation effects on the sediment flux to the deep ocean over the past 15 ka off eastern New Zealand. Global and Planetary Change, 33(3):339–355. https://doi.org/
Carter, L., and Wilkin, J., 1999. Abyssal circulation around New Zealand—a comparison between observations and a global circulation model. Marine Geology, 159(1–4):221–239. https://doi.org/
Chiswell, S.M., 2005. Mean and variability in the Wairarapa and Hikurangi eddies, New Zealand. New Zealand Journal of Marine and Freshwater Research, 39(1):121–134. https://doi.org/
Chiswell, S.M., Bostock, H.C., Sutton, P.J.H., and Williams, M.J.M., 2015. Physical oceanography of the deep seas around New Zealand: a review. New Zealand Journal of Marine and Freshwater Research, 49(2):286–317. https://doi.org/
Fisher, A.T., and Underwood, M.B., 1995. Calibration of an X-ray diffraction method to determine relative mineral abundances in bulk powders using matrix singular value decomposition: a test from the Barbados accretionary complex. In Shipley, T.H., Ogawa, Y., Blum, P., et al., Proceedings of the Ocean Drilling Program, Initial Reports. 156: College Station, TX (Ocean Drilling Program), 29–37. https://doi.org/
Guo, J., and Underwood, M.B., 2011. Data report: refined method for calculating percentages of kaolinite and chlorite from X-ray diffraction data, with application to the Nankai Margin of southwest Japan. In Kinoshita, M., Tobin, H., Ashi, J., Kimura, G., Lallemant, S., Screaton, E.J., Curewitz, D., Masago, H., Moe, K.T., and the Expedition 314/315/316 Scientists, Proceedings of the Integrated Ocean Drilling Program, Volume 314/315/316. Washington, DC (Integrated Ocean Drilling Program Management International, Inc.). https://doi.org/
Ikari, M.J., Kopf, A.J., Hüpers, A., and Vogt, C., 2018. Lithologic control of frictional strength variations in subduction zone sediment inputs. Geosphere, 14(2):604–625. https://doi.org/
Kisch, H.J., 1991. Illite crystallinity: recommendations on sample preparation, X-ray diffraction settings, and interlaboratory samples. Journal of Metamorphic Geology, 9(6):665–670. https://doi.org/
McArthur, A.D., and McCaffrey, W.D., 2019. Sedimentary architecture of detached deep-marine canyons: examples from the East Coast Basin of New Zealand. Sedimentology, 66(3):1067–1101. https://doi.org/
Moore, D.M., and Reynolds, R.C., Jr., 1989a. Identification of mixed-layered clay minerals. In Moore, D.M., and Reynolds, R.C., Jr. (Eds.), X-ray Diffraction and the Identification and Analysis of Clay Minerals. New York (Oxford University Press), 241–271.
Moore, D.M., and Reynolds, R.C., Jr., 1989b. Sample preparation techniques for clay minerals. In Moore, D.M., and Reynolds, R.C., Jr. (Eds.), X-ray Diffraction and the Identification and Analysis of Clay Minerals. New York (Oxford University Press), 179–201.
Petschick, R., Kuhn, G., and Gingele, F., 1996. Clay mineral distribution in surface sediments of the South Atlantic: sources, transport, and relation to oceanography. Marine Geology, 130(3–4):203–229. https://doi.org/
Phillips, S.C., Johnson, J.E., Underwood, M.B., Guo, J., Giosan, L., and Rose, K., 2014. Long-timescale variation in bulk and clay mineral composition of Indian continental margin sediments in the Bay of Bengal, Arabian Sea, and Andaman Sea. Marine and Petroleum Geology, 58(A):117–138. https://doi.org/
Pouderoux, H., Proust, J.-N., Lamarche, G., Orpin, A., and Neil, H., 2012. Postglacial (after 18 ka) deep-sea sedimentation along the Hikurangi subduction margin (New Zealand): characterisation, timing and origin of turbidites. Marine Geology, 295–298:51–76. https://doi.org/
Rettke, R.C., 1981. Probable burial diagenetic and provenance effects on Dakota Group clay mineralogy, Denver Basin. Journal of Sedimentary Research, 51(2):541–551. https://doi.org/
Saffer, D., Wallace, L., and Petronotis, K., 2017. Expedition 375 Scientific Prospectus: Hikurangi Subduction Margin Coring and Observatories. International Ocean Discovery Program. https://doi.org/
Saffer, D.M., Wallace, L.M., Barnes, P.M., Pecher, I.A., Petronotis, K.E., LeVay, L.J., Bell, R.E., Crundwell, M.P., Engelmann de Oliveira, C.H., Fagereng, A., Fulton, P.M., Greve, A., Harris, R.N., Hashimoto, Y., Hüpers, A., Ikari, M.J., Ito, Y., Kitajima, H., Kutterolf, S., Lee, H., Li, X., Luo, M., Malie, P.R., Meneghini, F., Morgan, J.K., Noda, A., Rabinowitz, H.S., Savage, H.M., Shepherd, C.L., Shreedharan, S., Solomon, E.A., Underwood, M.B., Wang, M., Woodhouse, A.D., Bourlange, S.M., Brunet, M.M.Y., Cardona, S., Clennell, M.B., Cook, A.E., Dugan, B., Elger, J., Gamboa, D., Georgiopoulou, A., Han, S., Heeschen, K.U., Hu, G., Kim, G.Y., Koge, H., Machado, K.S., McNamara, D.D., Moore, G.F., Mountjoy, J.J., Nole, M.A., Owari, S., Paganoni, M., Rose, P.S., Screaton, E.J., Shankar, U., Torres, M.E., Wang, X., and Wu, H.-Y., 2019. Expedition 372B/375 summary. In Wallace, L.M., Saffer, D.M., Barnes, P.M., Pecher, I.A., Petronotis, K.E., LeVay, L.J., and the Expedition 372/375 Scientists, Hikurangi Subduction Margin Coring, Logging, and Observatories. Proceedings of the International Ocean Discovery Program, 372B/375: College Station, TX (Proceedings of the International Ocean Discovery Program). https://doi.org/
Thiry, M., 2000. Palaeoclimatic interpretation of clay minerals in marine deposits: an outlook from the continental origin. Earth-Science Reviews, 49(1–4):201–221. https://doi.org/
Underwood, M.B., 2020. Data report: reconnaissance of bulk sediment composition and clay mineral assemblages: inputs to the Hikurangi subduction system. In Wallace, L.M., Saffer, D.M., Barnes, P.M., Pecher, I.A., Petronotis, K.E., LeVay, L.J., and the Expedition 372/375 Scientists, Hikurangi Subduction Margin Coring, Logging, and Observatories. Proceedings of the International Ocean Discovery Program, 372B/375: College Station, TX (International Ocean Discovery Program). https://doi.org/
Underwood, M.B., 2021a. Data report: clay mineral assemblages within biocalcareous and volcaniclastic inputs to the Hikurangi subduction zone, IODP Expedition 372B/375 Sites U1520 and U1526, offshore New Zealand. In Wallace, L.M., Saffer, D.M., Barnes, P.M., Pecher, I.A., Petronotis, K.E., LeVay, L.J., and the Expedition 372/375 Scientists, Proceedings of the International Ocean Discovery Program, 372B/375: College Station, TX (International Ocean Discovery Program). https://doi.org/
Underwood, M.B., 2021b. Data report: clay mineral assemblages within trench-floor and accreted trench-floor deposits, IODP Expedition 372B/375 Sites U1518 and U1520, offshore New Zealand. In Wallace, L.M., Saffer, D.M., Barnes, P.M., Pecher, I.A., Petronotis, K.E., LeVay, L.J., and the Expedition 372/375 Scientists, Hikurangi Subduction Margin Coring, Logging, and Observatories. Proceedings of the International Ocean Discovery Program, 372B/375: College Station, TX (International Ocean Discovery Program). https://doi.org/
Underwood, M.B., Basu, N., Steurer, J., and Udas, S., 2003. Data report: normalization factors for semiquantitative X-ray diffraction analysis, with application to DSDP Site 297, Shikoku Basin. In Mikada, H., Moore, G.F., Taira, A., Becker, K., Moore, J.C., and Klaus, A., Proceedings of the Ocean Drilling Program, Scientific Results. 190/196: College Station, TX (Ocean Drilling Program), 1–28. https://doi.org/
Underwood, M.B., and Dugan, B., 2021. Data report: clay mineral assemblages within and beneath the Tuaheni Landslide Complex, IODP Site U1517, offshore New Zealand. In Pecher, I.A., Barnes, P.M., LeVay, L.J., and the Expedition 372A Scientists, Creeping Gas Hydrate Slides. Proceedings of the International Ocean Discovery Program, 372A: College Station, TX (International Ocean Discovery Program). https://doi.org/
Underwood, M.B., Lawler, N., and McNamara, K., 2020. Data report: standard mineral mixtures, normalization factors, and determination of error for quantitative X-ray diffraction analyses of bulk powders and clay-sized mineral assemblages. In Wallace, L.M., Saffer, D.M., Barnes, P.M., Pecher, I.A., Petronotis, K.E., LeVay, L.J., and the Expedition 372/375 Scientists, Hikurangi Subduction Margin Coring, Logging, and Observatories. Proceedings of the International Ocean Discovery Program, 372B/375: College Station, TX (International Ocean Discovery Program). https://doi.org/
Wallace, L.M., Saffer, D.M., Barnes, P.M., Pecher, I.A., Petronotis, K.E., LeVay, L.J., Bell, R.E., Crundwell, M.P., Engelmann de Oliveira, C.H., Fagereng, A., Fulton, P.M., Greve, A., Harris, R.N., Hashimoto, Y., Hüpers, A., Ikari, M.J., Ito, Y., Kitajima, H., Kutterolf, S., Lee, H., Li, X., Luo, M., Malie, P.R., Meneghini, F., Morgan, J.K., Noda, A., Rabinowitz, H.S., Savage, H.M., Shepherd, C.L., Shreedharan, S., Solomon, E.A., Underwood, M.B., Wang, M., Woodhouse, A.D., Bourlange, S.M., Brunet, M.M.Y., Cardona, S., Clennell, M.B., Cook, A.E., Dugan, B., Elger, J., Gamboa, D., Georgiopoulou, A., Han, S., Heeschen, K.U., Hu, G., Kim, G.Y., Koge, H., Machado, K.S., McNamara, D.D., Moore, G.F., Mountjoy, J.J., Nole, M.A., Owari, S., Paganoni, M., Rose, P.S., Screaton, E.J., Shankar, U., Torres, M.E., Wang, X., and Wu, H.-Y., 2019. Expedition 372B/375 methods. In Wallace, L.M., Saffer, D.M., Barnes, P.M., Pecher, I.A., Petronotis, K.E., LeVay, L.J., and the Expedition 372/375 Scientists, Hikurangi Subduction Margin Coring, Logging, and Observatories. Proceedings of the International Ocean Discovery Program, 372B/375: College Station, TX (International Ocean Discovery Program). https://doi.org/
Warr, L.N., and Cox, S.C., 2016. Correlating illite (Kübler) and chlorite (Árkai) “crystallinity” indices with metamorphic mineral zones of the South Island, New Zealand. Applied Clay Science, 134(3):164–174. https://doi.org/
Warr, L.N., and Ferreiro Mählmann, R., 2015. Recommendations for Kübler Index standardization. Clay Minerals, 50(3):283–286. https://doi.org/
Winkler, A., and Dullo, W.-C., 2002. Data report: Miocene to Pleistocene sedimentation pattern on the Chatham Rise, New Zealand. In Richter, C. (Ed.), Proceedings of the Ocean Drilling Program, Scientific Results, 181: College Station, TX (Ocean Drilling Program), 1–21. https://doi.org/