Teske, A., Lizarralde, D., Höfig, T.W., and the Expedition 385 Scientists
Proceedings of the International Ocean Discovery Program Volume 385
publications.iodp.org
https://doi.org/10.14379/iodp.proc.385.108.2021
Site U15511
![]() A. Teske,
A. Teske,
![]() D. Lizarralde,
D. Lizarralde,
![]() T.W. Höfig,
T.W. Höfig,
![]() I.W. Aiello,
I.W. Aiello,
![]() J.L. Ash,
J.L. Ash,
![]() D.P. Bojanova,
D.P. Bojanova,
![]() M.D. Buatier,
M.D. Buatier,
![]() V.P. Edgcomb,
V.P. Edgcomb,
![]() C.Y. Galerne,
C.Y. Galerne,
![]() S. Gontharet,
S. Gontharet,
![]() V.B. Heuer,
V.B. Heuer,
![]() S. Jiang,
S. Jiang,
![]() M.A.C. Kars,
M.A.C. Kars,
![]() S. Khogenkumar Singh,
S. Khogenkumar Singh,
![]() J.-H. Kim,
J.-H. Kim,
![]() L.M.T. Koornneef,
L.M.T. Koornneef,
![]() K.M. Marsaglia,
K.M. Marsaglia,
![]() N.R. Meyer,
N.R. Meyer,
![]() Y. Morono,
Y. Morono,
![]() R. Negrete-Aranda,
R. Negrete-Aranda,
![]() F. Neumann,
F. Neumann,
![]() L.C. Pastor,
L.C. Pastor,
![]() M.E. Peña-Salinas,
M.E. Peña-Salinas,
![]() L.L. Pérez-Cruz,
L.L. Pérez-Cruz,
![]() L. Ran,
L. Ran,
![]() A. Riboulleau,
A. Riboulleau,
![]() J.A. Sarao,
J.A. Sarao,
![]() F. Schubert,
F. Schubert,
![]() J.M. Stock,
J.M. Stock,
![]() L.M.A.A. Toffin,
L.M.A.A. Toffin,
![]() W. Xie,
W. Xie,
![]() T. Yamanaka,
T. Yamanaka,
![]() G. Zhuang
2
G. Zhuang
2
1 Teske, A., Lizarralde, D., Höfig, T.W., Aiello, I.W., Ash, J.L., Bojanova, D.P., Buatier, M.D., Edgcomb, V.P., Galerne, C.Y., Gontharet, S., Heuer, V.B., Jiang, S., Kars, M.A.C., Khogenkumar Singh, S., Kim, J.-H., Koornneef, L.M.T., Marsaglia, K.M., Meyer, N.R., Morono, Y., Negrete-Aranda, R., Neumann, F., Pastor, L.C., Peña-Salinas, M.E., Pérez Cruz, L.L., Ran, L., Riboulleau, A., Sarao, J.A., Schubert, F., Stock, J.M., Toffin, L.M.A.A., Xie, W., Yamanaka, T., and Zhuang, G., 2021. Site U1551. In Teske, A., Lizarralde, D., Höfig, T.W., and the Expedition 385 Scientists, Guaymas Basin Tectonics and Biosphere. Proceedings of the International Ocean Discovery Program, 385: College Station, TX (International Ocean Discovery Program). https://doi.org/10.14379/iodp.proc.385.108.2021
2 Expedition 385 Scientists’ affiliations.
1. Summary
1.1. Background and objectives
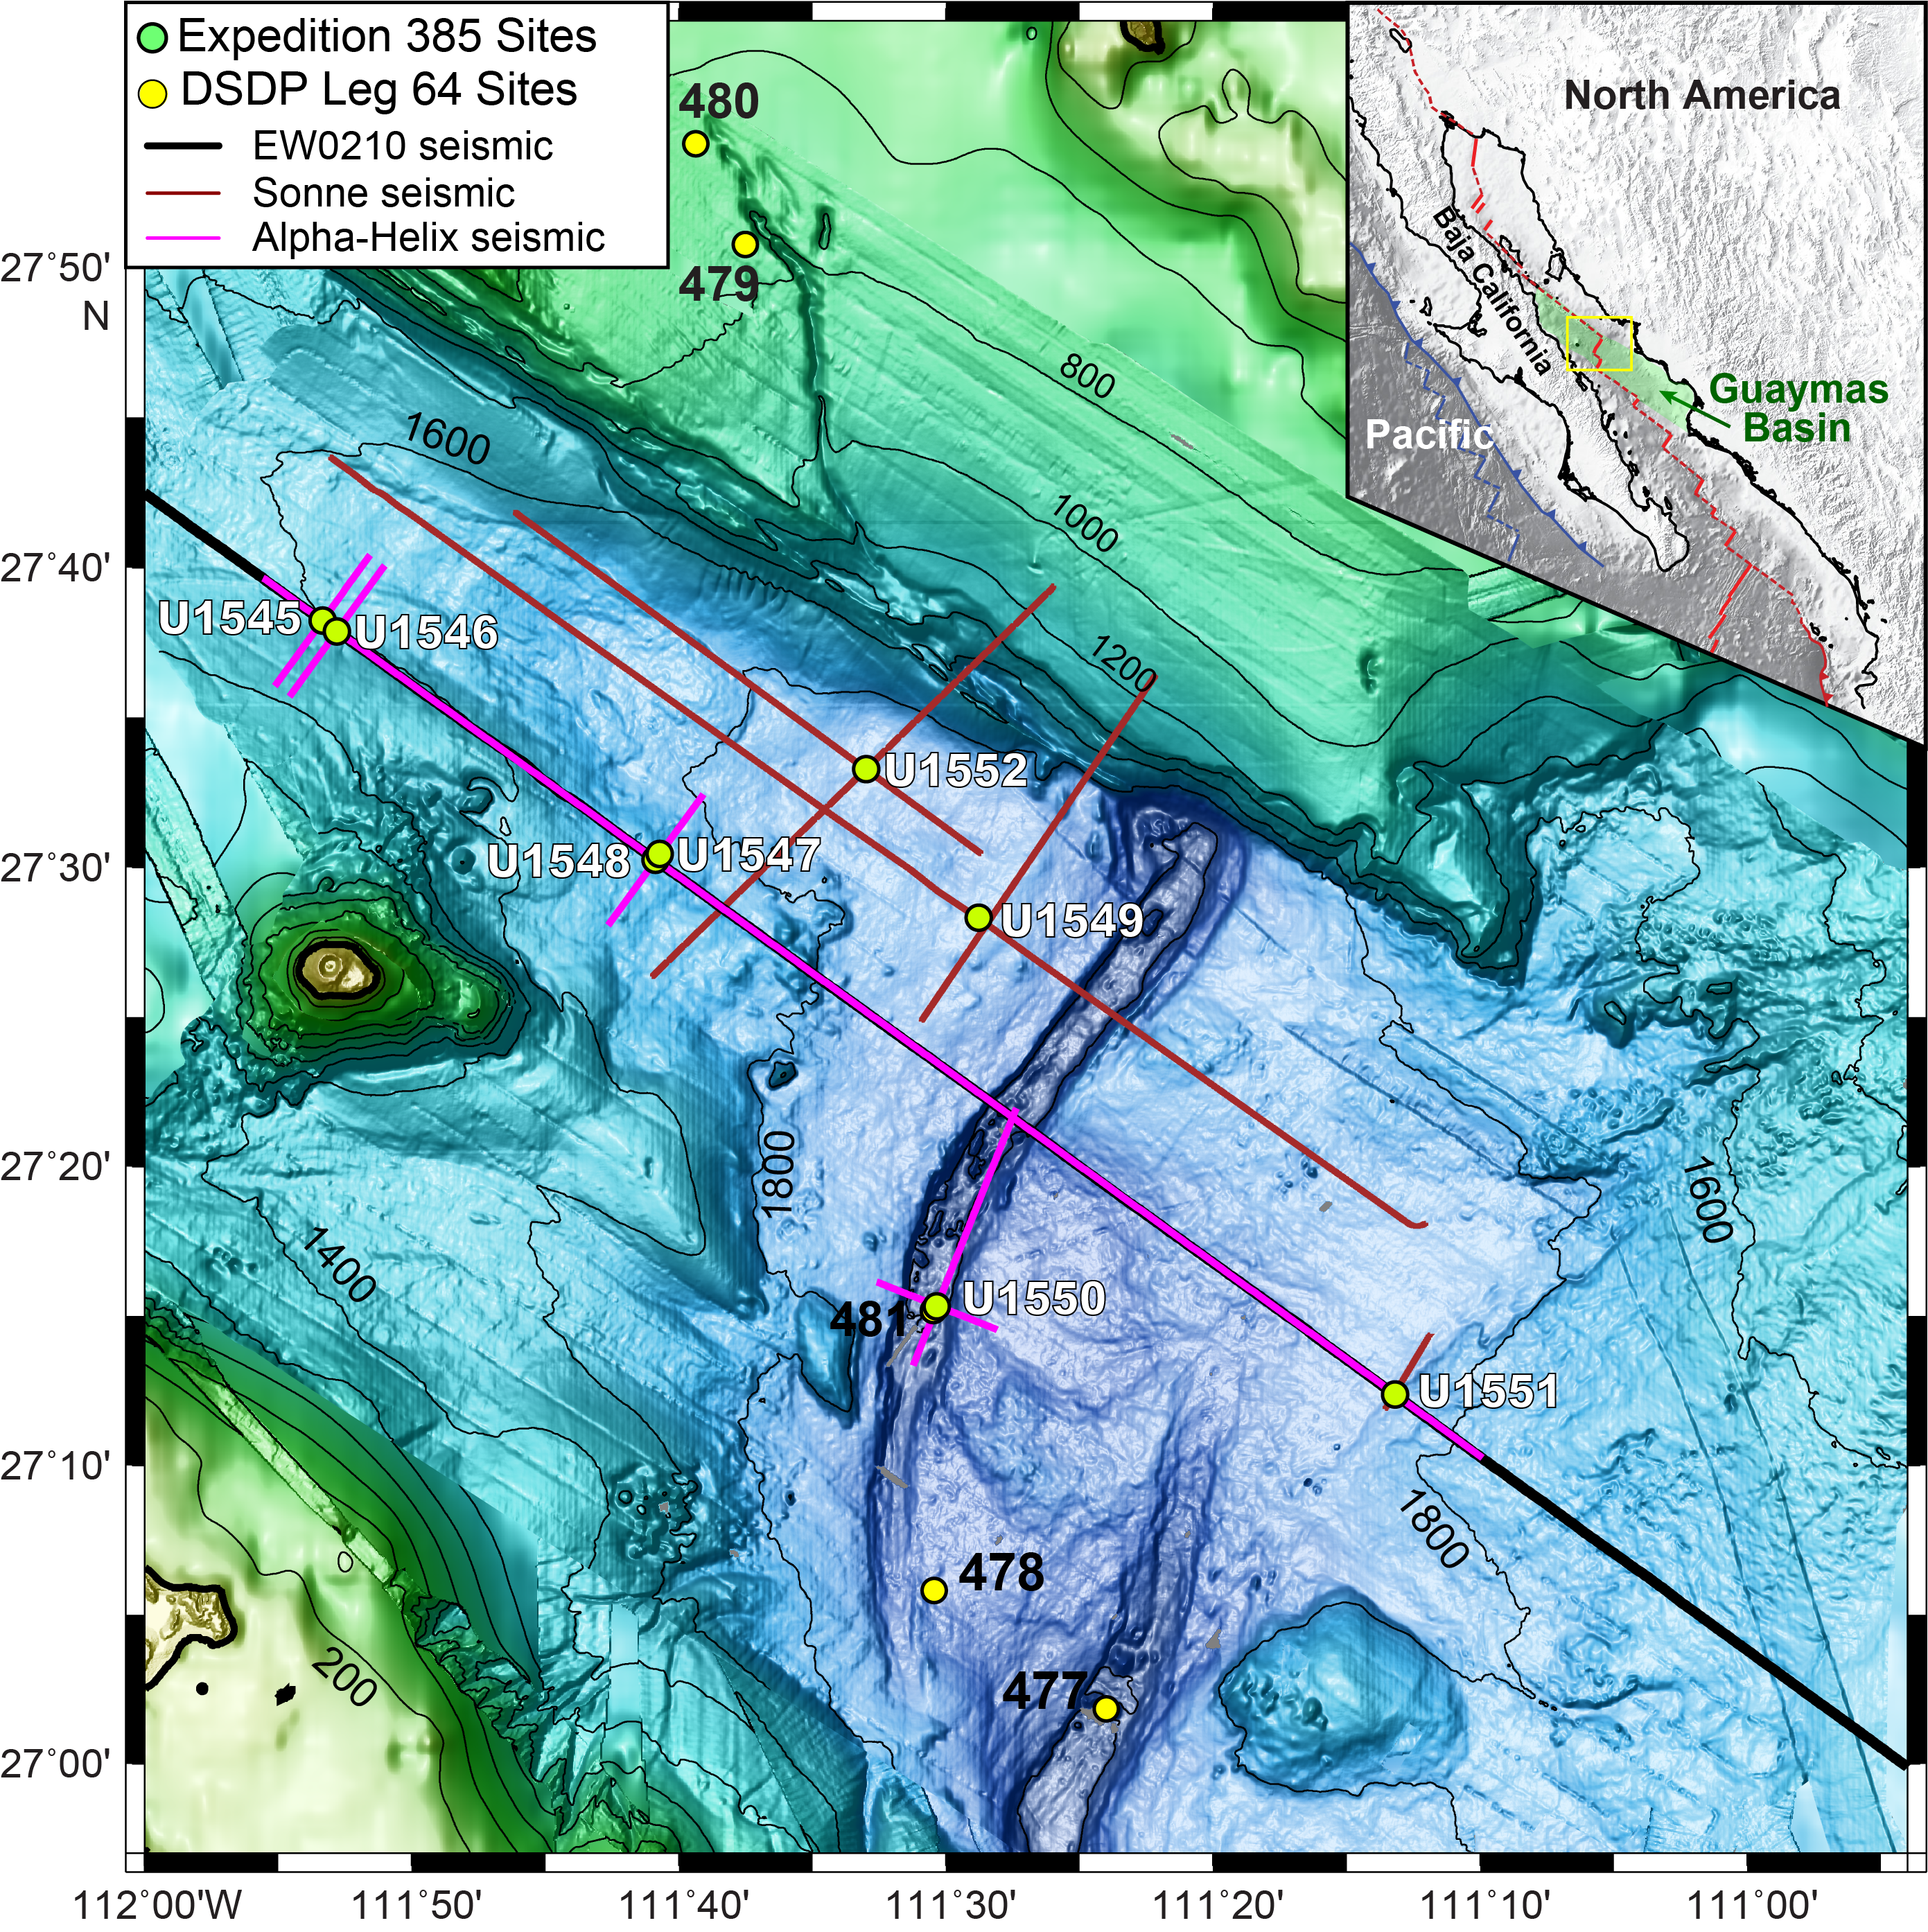
Site U1551 is located ~29 km southeast of the axial graben of the northern Guaymas Basin spreading segment (Figures F1, F2). The type of sediment, the depositional environment, and the type, size, and, presumably, age of sill intrusions were all predicted to differ in the southeastern side of the spreading segment relative to the northwestern side (Teske et al., 2018). The sediment at Site U1551 was predicted to be predominantly terrigenous and deposited as gravity-driven flows ranging from landslides to turbidites, with the underlying sills appearing to be larger and more saucer-shaped than those in the northwest. It was hypothesized that the physical and chemical properties of sediments may impact alteration in response to sill intrusion, and this may have consequences for carbon cycling. Moreover, the physical properties of the sediments may influence the size and shape of the sills beneath Site U1551. In turn, permeability might evolve toward enhanced induration, ultimately affecting the efficiency of alteration. Terrestrial organic carbon and metals are predicted to be more abundant in these sediments relative to the northwestern part of the basin, and this may also affect sediment alteration and its products. The primary scientific objective at Site U1551 was to constrain the influence of sediment type, an important factor controlling alteration and carbon cycling, on sill morphology by studying the response of predominantly terrigenous sediments to sill intrusion.
1.2. Operations
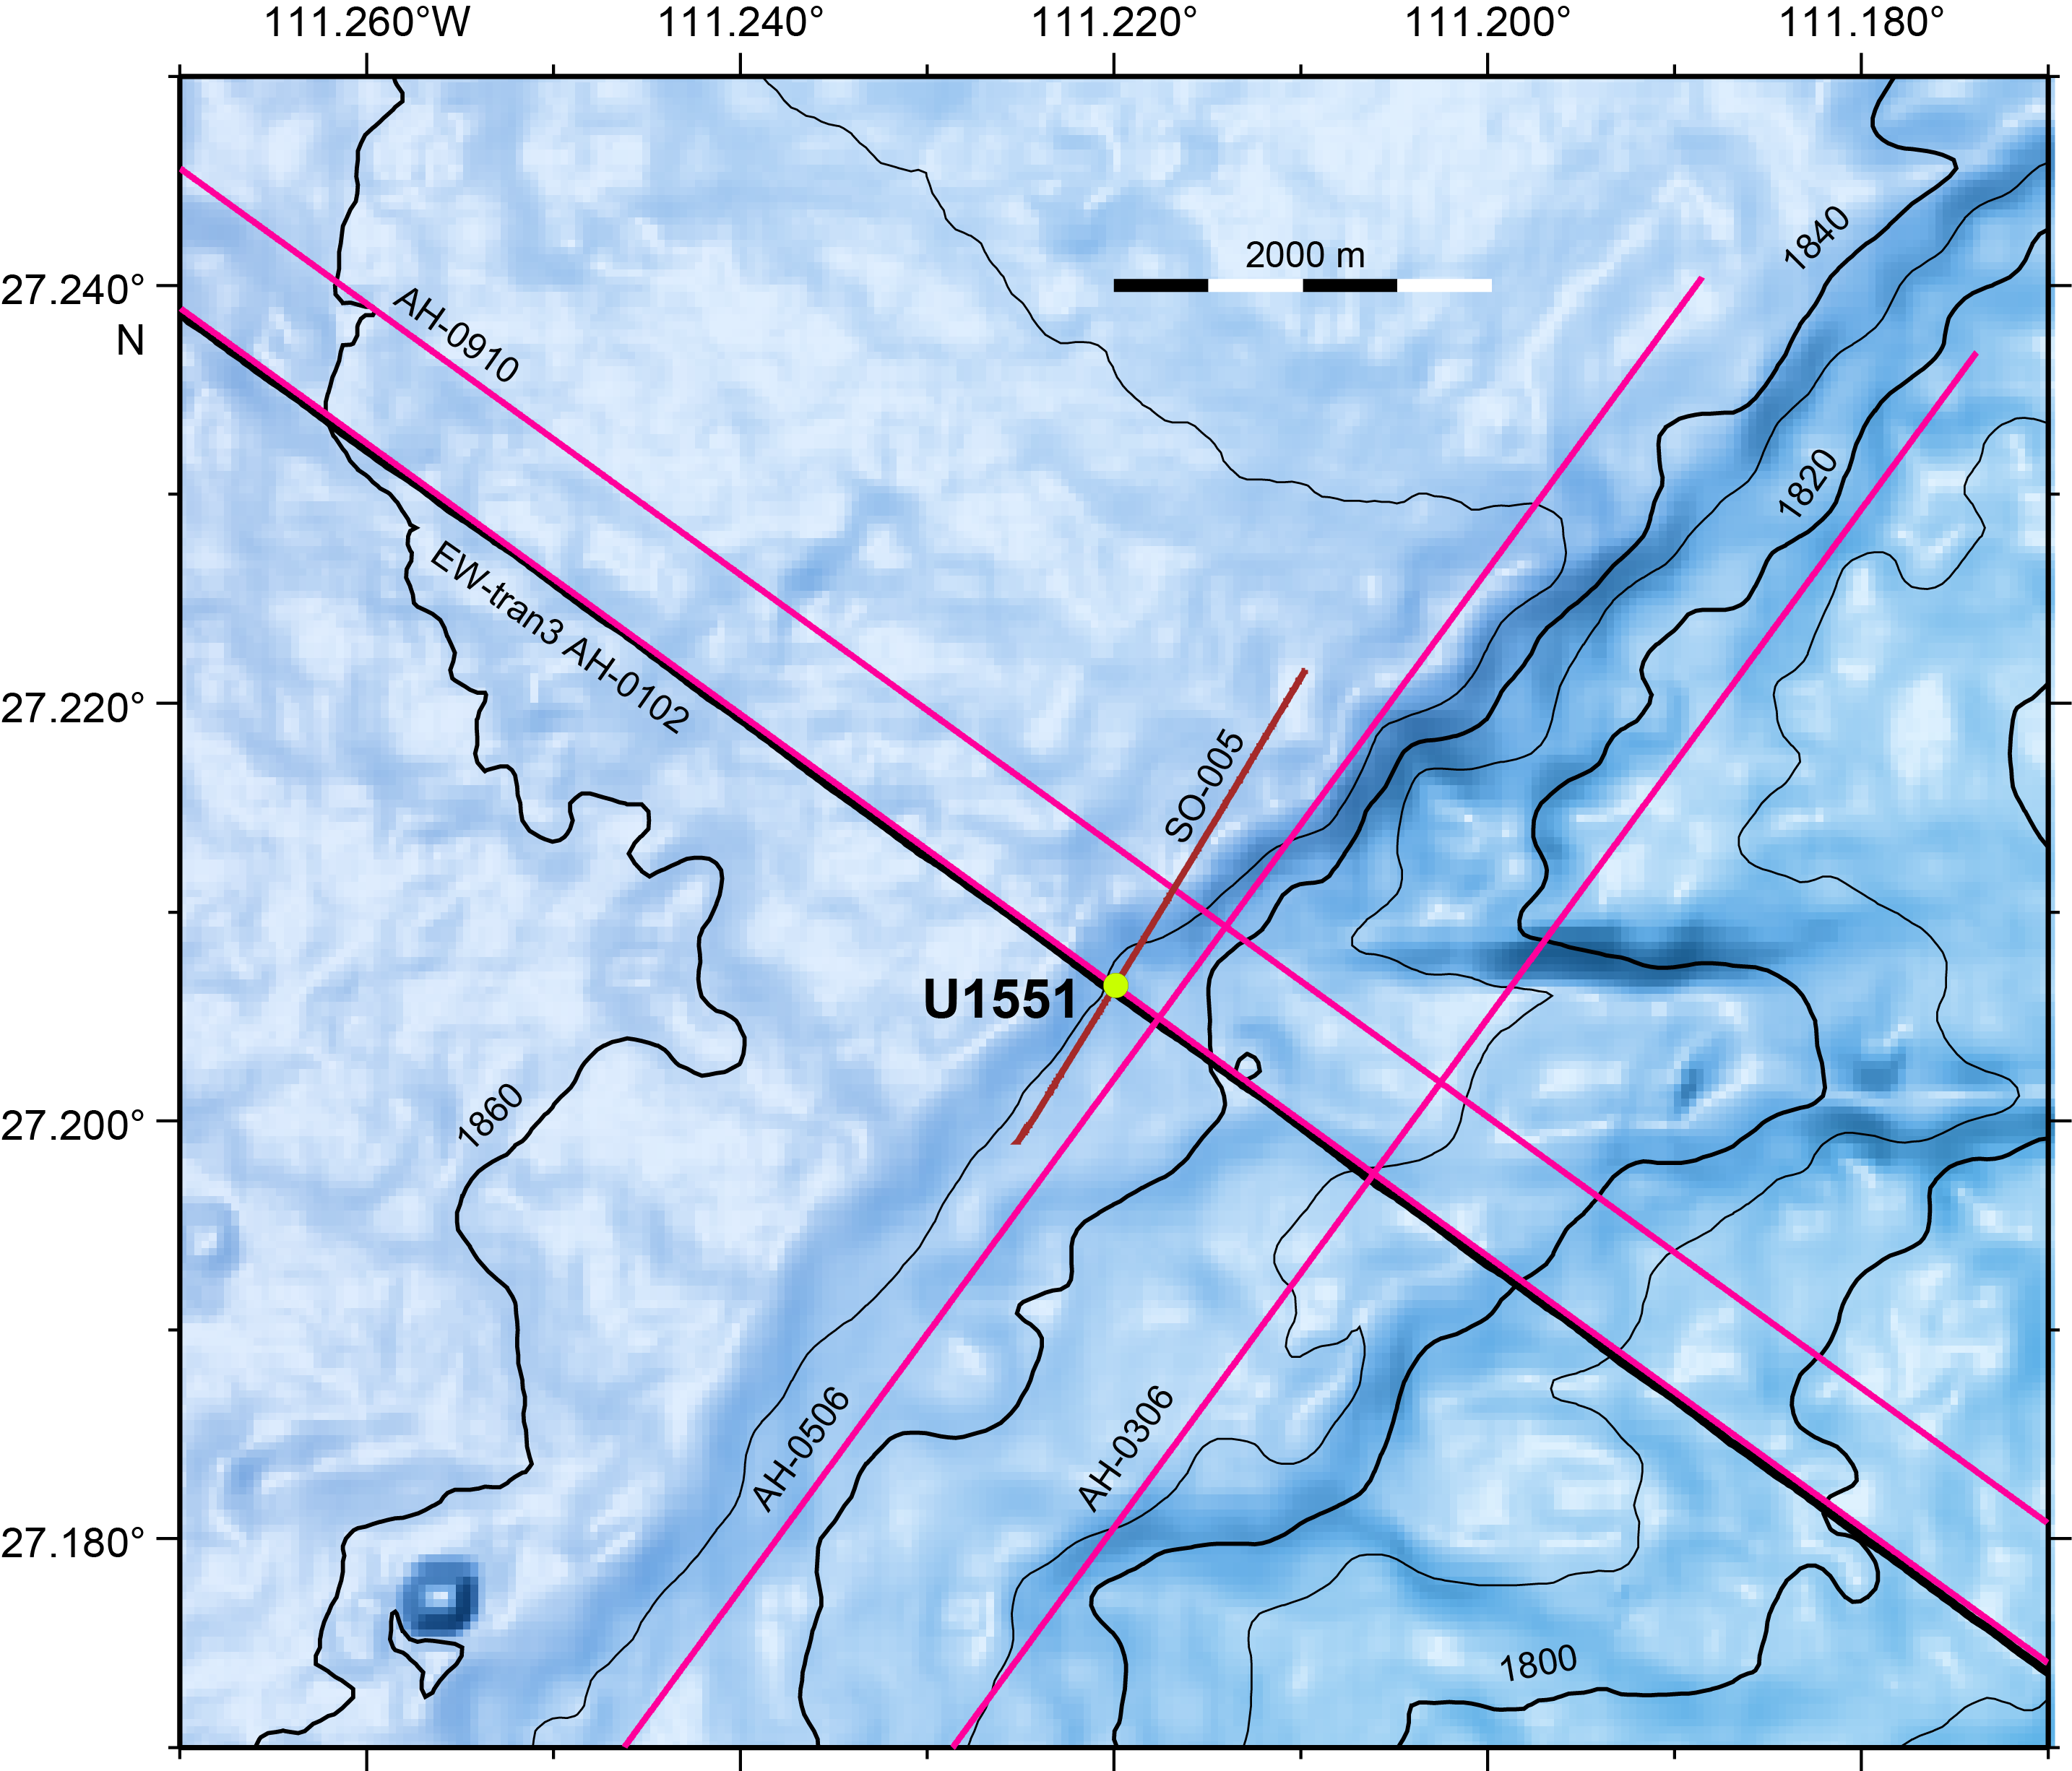
Two holes were cored at Site U1551. Hole U1551A is located at 27°12.3887′N, 111°13.1943′W in a water depth of 1844.1 m. In Hole U1551A, we used the advanced piston corer (APC) and half-length APC (HLAPC) systems to advance from the seafloor to a final depth of 120.3 meters below seafloor (mbsf) with a recovery of 122.1 m (102%). We made formation temperature measurements at several depths using the advanced piston corer temperature (APCT-3) tool. Coring was terminated because unconsolidated sand layers prevented us from reaching the deeper drilling objectives. In Hole U1551B, located at 27°12.3832′N, 111°13.1841′W in a water depth of 1843.9 m, we deployed the APC system. Cores penetrated from the seafloor to a final depth of 48.5 mbsf and recovered 50.0 m (103%). Hole U1551B was dedicated to extensive microbial and biogeochemical sampling that required the deployment of perfluorocarbon tracers (PFTs) downhole on all cores to monitor drilling fluid (seawater) contamination. The pace of coring in Hole U1551B was at times adjusted to accommodate the complex microbial sampling program conducted on the core receiving platform. A total of 34.3 h, or 1.4 days, were spent at Site U1551. The cores, penetration depths, core recovery, and operations schedule are displayed in Table T1.
1.3. Principal results
1.3.1. Lithostratigraphy
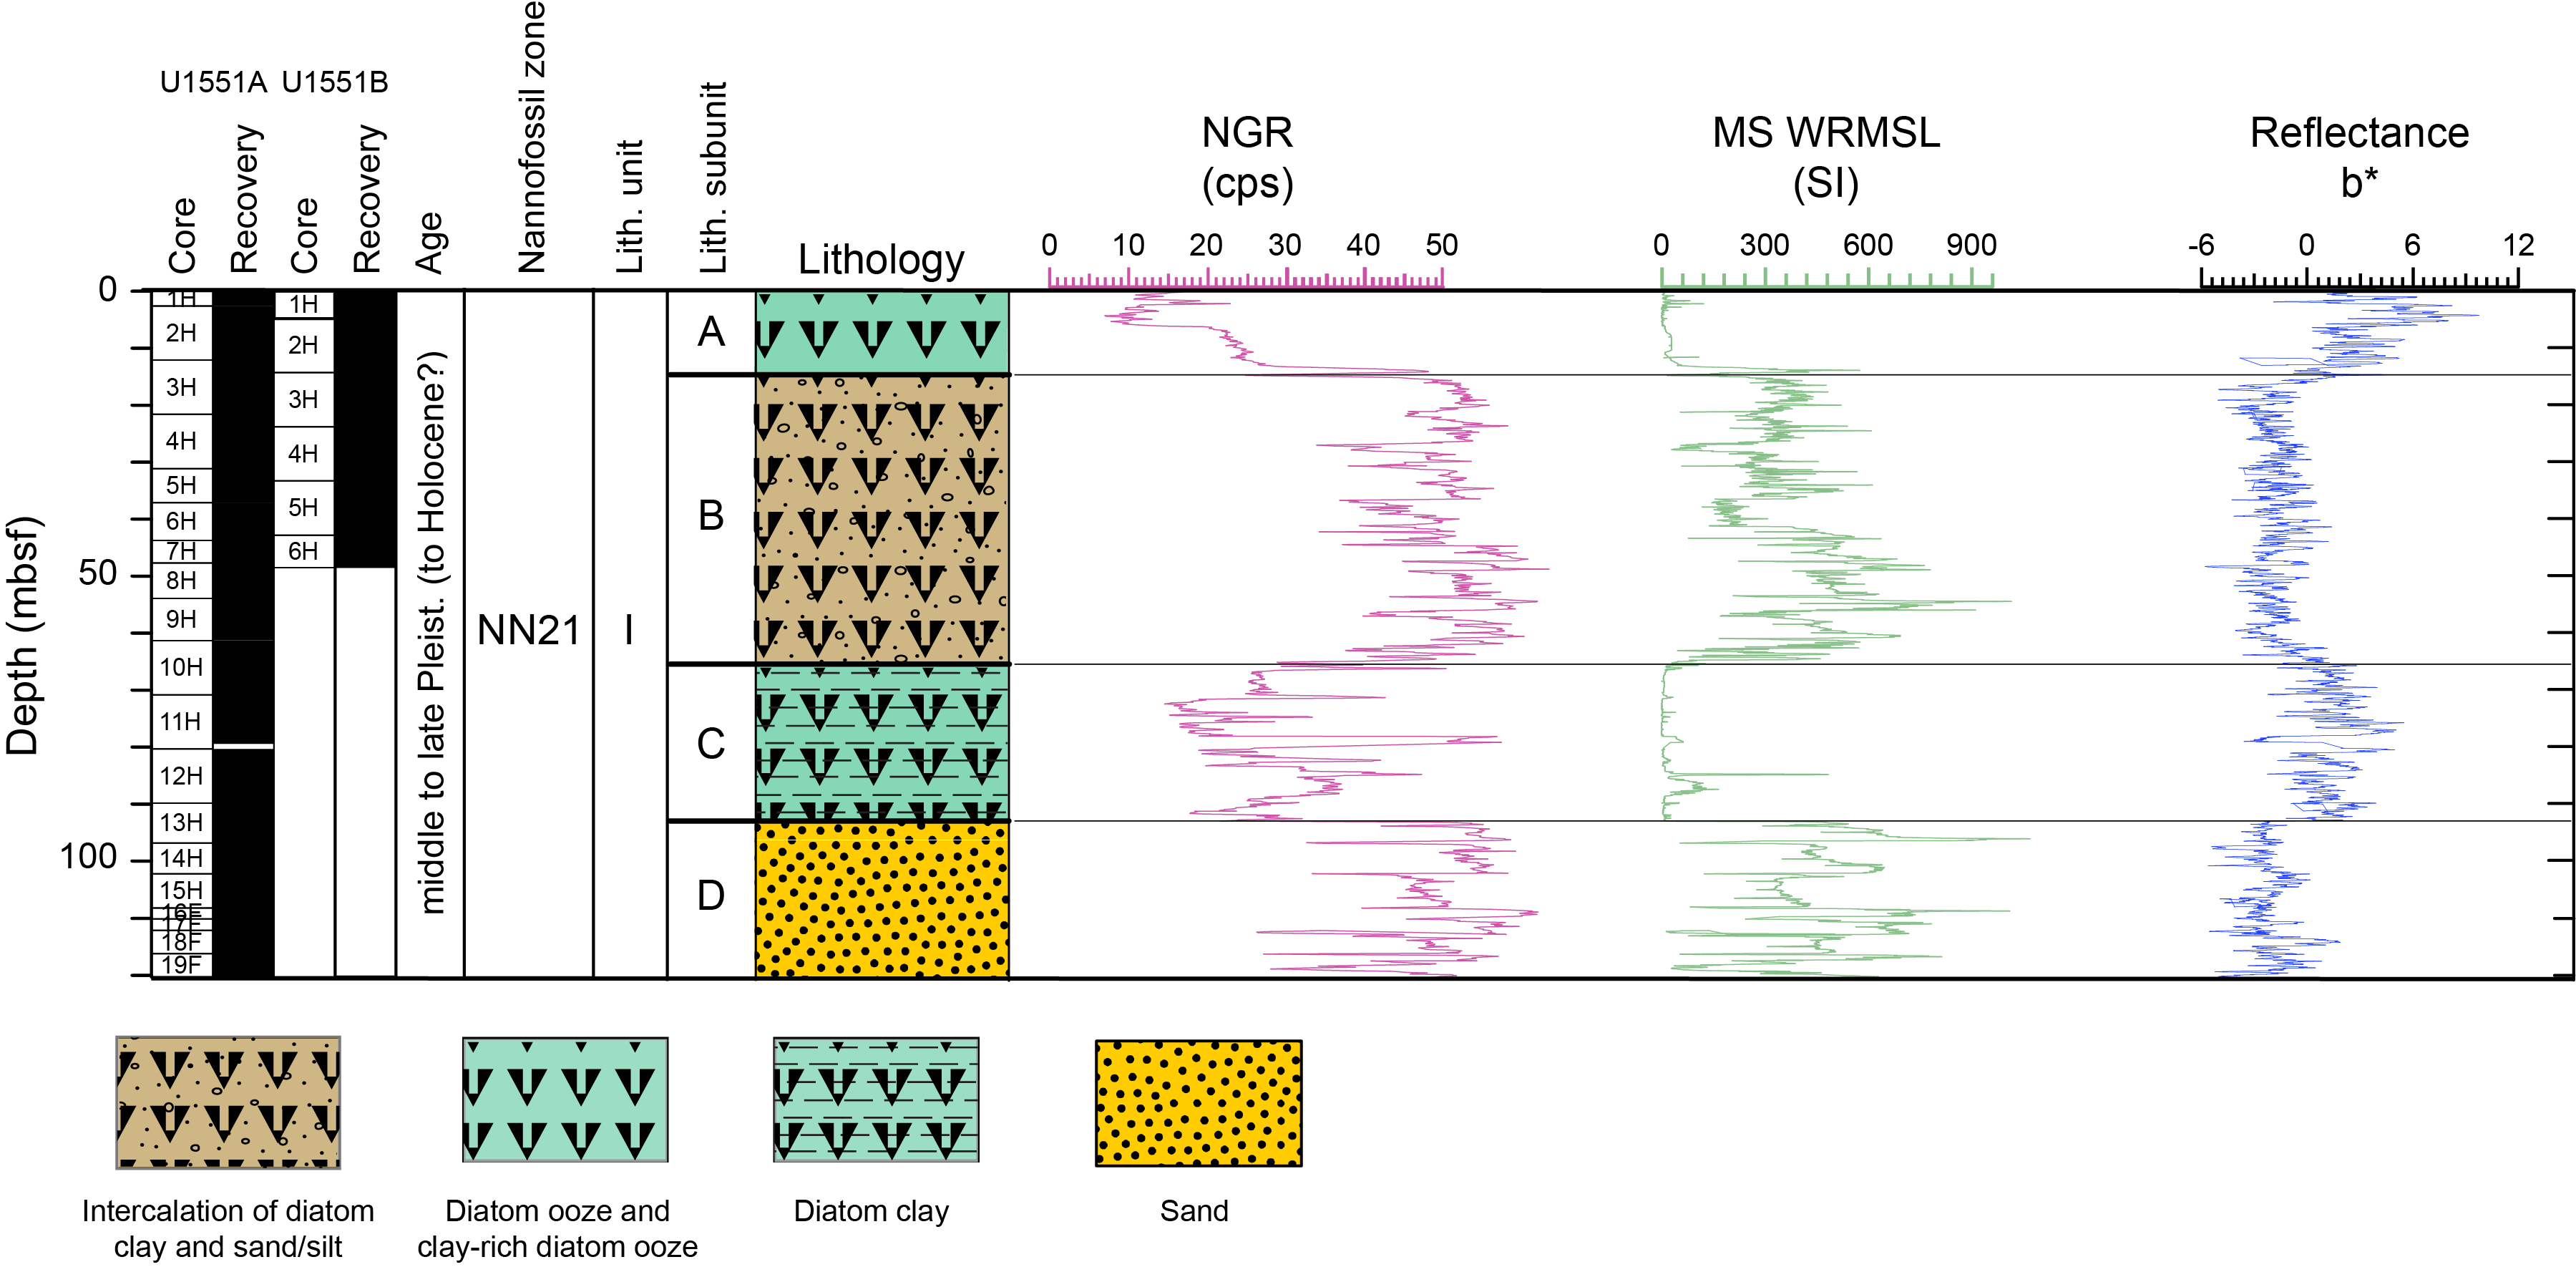
The sediments recovered at Site U1551 are assigned to Lithostratigraphic Unit I. They represent a combination of biogenic (diatom ooze to diatom clay) and terrigenous (sand/silt/clay grade) components with the highest overall proportion of silty to sandy intervals (~60%) cored during Expedition 385 (Figure F4). Macroscopic core description and microscopic smear slide analysis show that two main types of lithologic components are clustered in four different stratigraphic intervals. These lithologic patterns are reflected in the natural gamma radiation (NGR), magnetic susceptibility (MS), and color reflectance data, forming the basis of the division of Unit I into four subunits; Subunits IA and IC are dominated by biogenic sedimentation, and Subunits IB and ID appear more siliciclastic in character. Lithologies in which the content of diatoms is very high (>85%) are mainly found in Subunit IA. The underlying Subunit IB includes authigenic carbonates that occur in small patches of micrite, partly cemented sandstone intervals, or carbonate concretions. This subunit also contains thick sand beds, and overall it is dominated by coarser grained siliciclastic sediments that correspond to higher MS and NGR values. Subunit IC is composed of silt-rich diatom clay and clay-rich, mainly homogeneous, diatom ooze alternating with beds of gray sand and silty sand. Subunit ID is mainly composed of medium-grained sand, which is partially interpreted to represent coring-induced flow-in rather than in situ deposition. Although Sites U1551 and U1549 share many lithostratigraphic similarities, the former contains larger proportions of siliciclastic material. The predominance of siliciclastic components over biogenic ones and the presence of coarse-grained mass-gravity flow deposits suggest that the deposition at this site was more influenced by terrigenous sources than at the other sites drilled in Guaymas Basin during Expedition 385. This may be related to the more proximal location of Site U1551 to the Yaqui River delta.
1.3.2. Structural geology
At Site U1551, Holes U1551A and U1551B penetrated Lithostratigraphic Unit I, recovering a sedimentary sequence of diatom ooze, diatom clay, sand, and silt. Bedding and lamination in the sedimentary succession are similar to those described for Sites U1545–U1550. However, Site U1551 has intervals of massive sand layers in which the lack of stratification prevented any deformation structures from being identified. Folds are seen in Subunit IB in both holes where contortion and soft-sediment deformation produced steep to overturned bedding below ~15 mbsf. The folded strata are cut by a single set of faults with subparallel orientations and apparent dips of 45°–70°. Faults were found in some deeper intervals. The differences in depths characterizing the folded strata in Holes U1551A and U1551B may have been partly caused by faulting prior to the deposition of Subunit IA. No faulting is inferred in Subunit IA at Site U1551 because of the stratigraphic similarity between the two drill holes.
1.3.3. Biostratigraphy
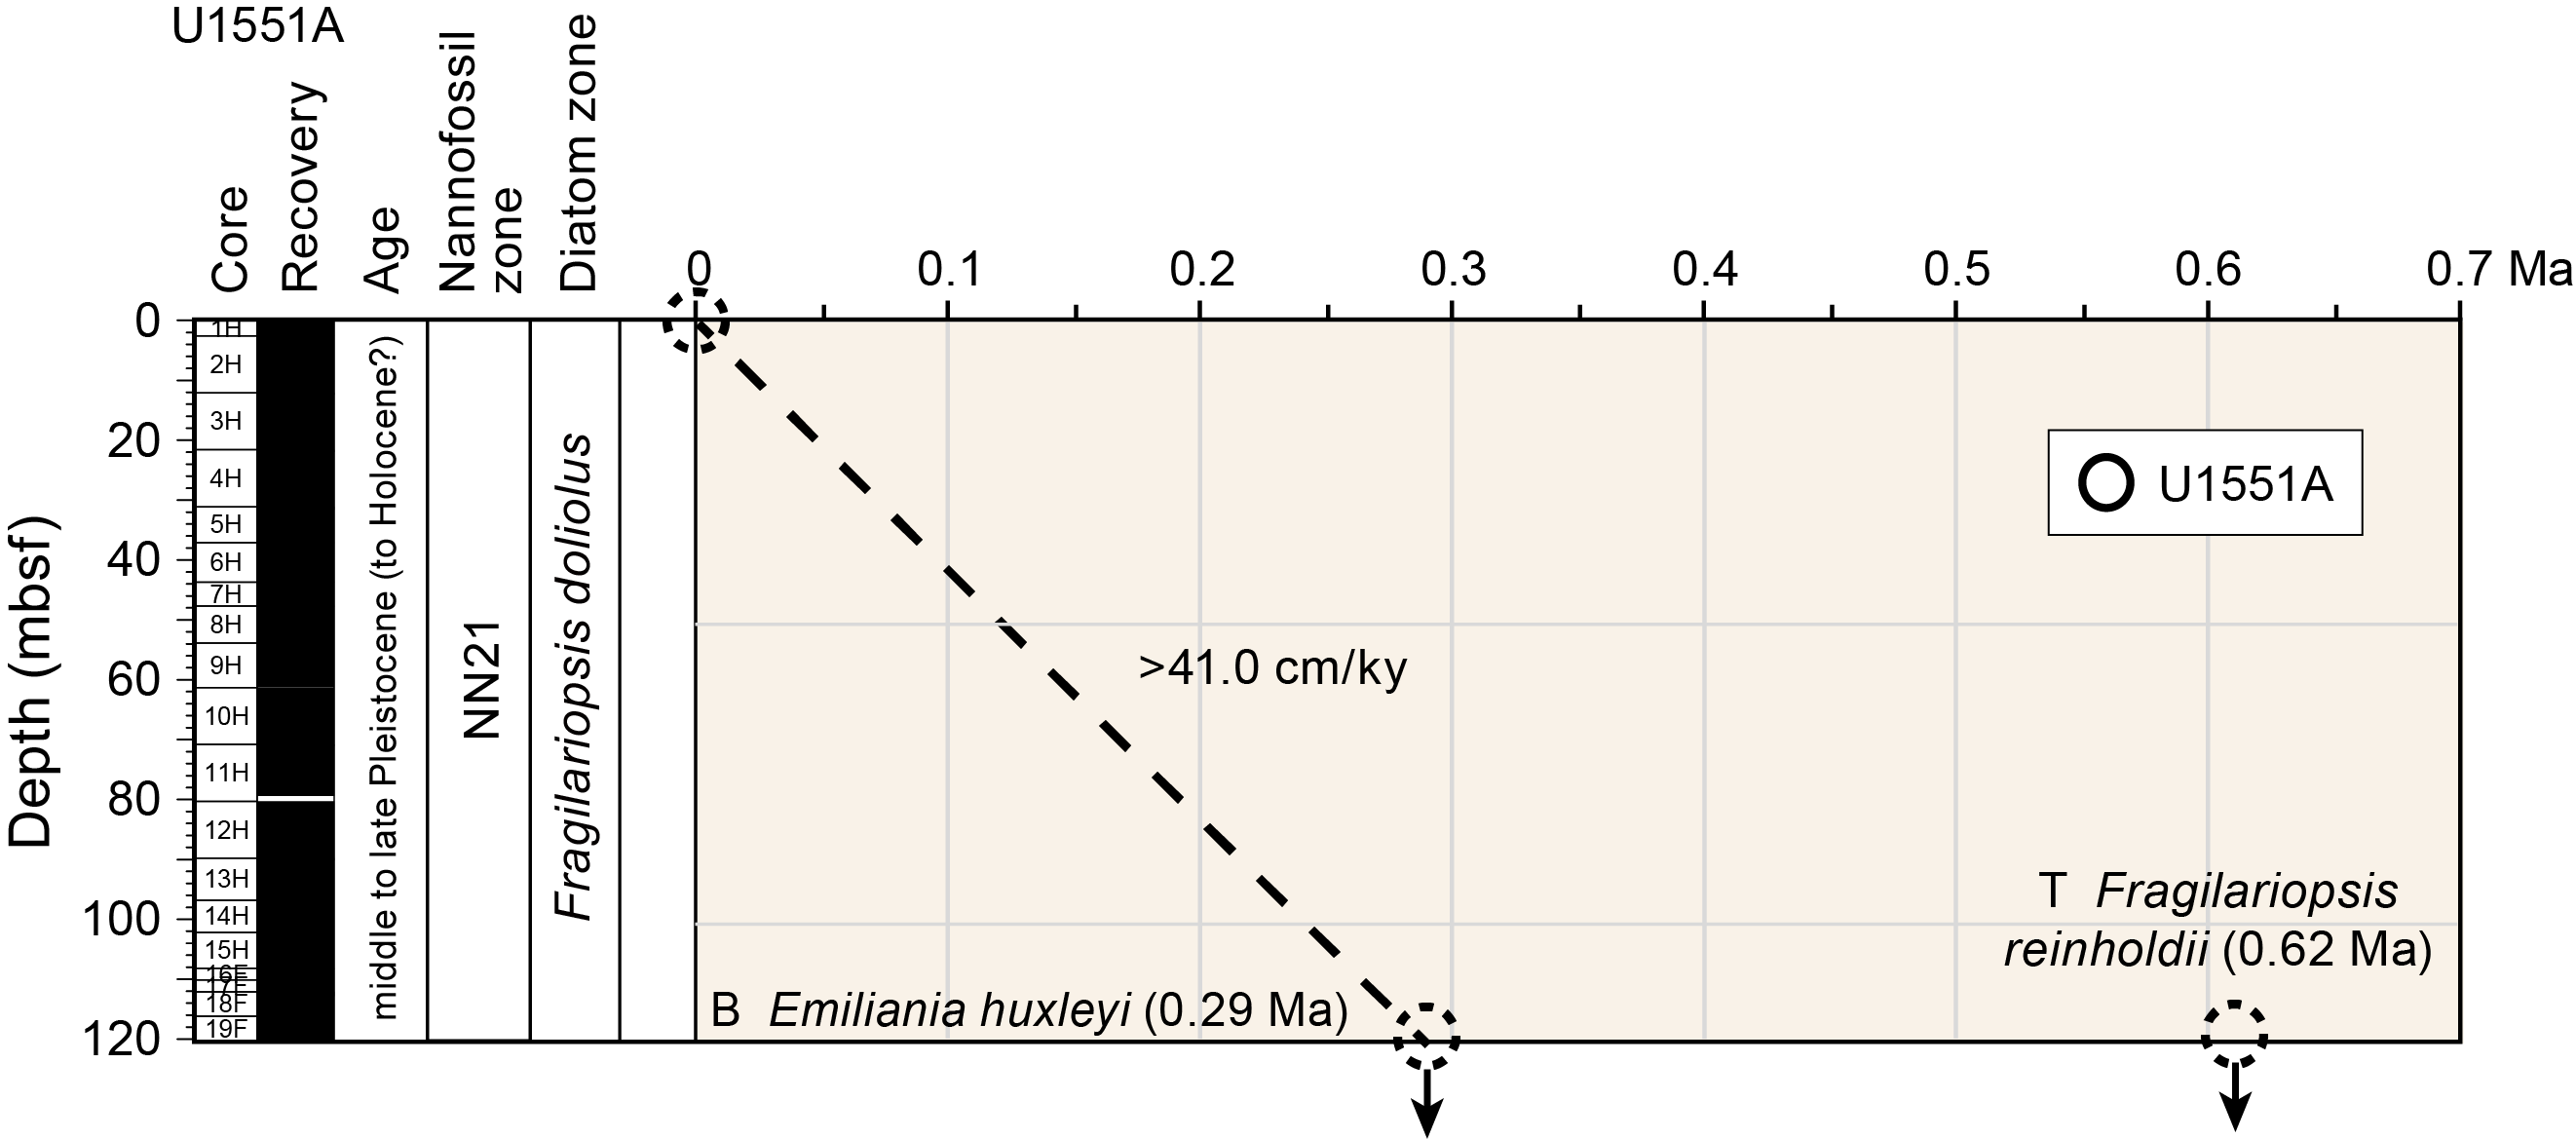
In Hole U1551A, calcareous nannofossils are abundant to rare to 96.8 mbsf; there are two barren intervals around 24.8 and 25.1 mbsf. Farther downhole, nannofossils are barren at 102.14–116.19 mbsf and abundant in the bottom sample from 119.01 mbsf. Nannofossil preservation is good and moderate throughout the entire sedimentary sequence except for two samples with poor preservation at 22.0 and 25.8 mbsf. The barren intervals correspond to recovered sections of predominantly sandy lithology. Marine diatoms are abundant with good preservation only in the uppermost part of Site U1551. They then decrease in abundance with moderate to poor preservation from the seafloor to 36.9 mbsf, followed by an interval without diatoms from 36.9 to 61.22 mbsf. Diatoms vary from common to rare with moderate to poor preservation from 71 to 108.28 mbsf, and they are barren at the bottom of Hole U1551A. Diatoms are abundant but poorly preserved in a spot sample from 119.0 mbsf at the bottom of Hole U1551A. The occurrence of Emiliania huxleyi from the seafloor to the bottom of Hole U1551A dates the entire sediment sequence to (Holocene–)late–middle Pleistocene, or younger than 0.29 Ma (Hole U1551A = 0–119.01 mbsf). This age assignment is consistent with the absence of Pseudoemiliania lacunosa (last appearance datum [LAD] = 0.44 Ma) and Fragilariopsis reinholdii (LAD = 0.62 Ma) in all examined samples. The estimated average sedimentation rate is >410.4 m/My (>41.04 cm/ky).
1.3.4. Paleomagnetism
Alternating field (AF) demagnetization of up to 20 mT was carried out with the superconducting rock magnetometer (SRM) on all sediment archive-half sections from Hole U1551A (Cores 1H–19F). The drilling-induced overprint was successfully removed from APC and HLAPC cores (from the seafloor to ~120 mbsf) upon demagnetization. Inclination values after demagnetization at 20 mT cluster around 47°, which is comparable to the expected geocentric axial dipole (GAD) inclination at the latitude of the site (45.8°). A detailed analysis of the remanence of discrete samples from Hole U1551A shows that the drilling-induced overprint is removed by 10 mT, and the characteristic remanent magnetization (ChRM) is in accordance with the SRM measurements. Thus, Hole U1551A cores were assigned to the normal Brunhes Chron C1n (younger than 0.78 Ma). Sedimentary discrete samples taken in Hole U1551A predominantly show prolate behavior throughout the hole, with the Kmax (maximum) principal axis of the anisotropy of magnetic susceptibility distributed in the horizontal plane. No paleomagnetic measurements were implemented in Hole U1551B.
1.3.5. Inorganic geochemistry
In Holes U1551A and U1551B, a total of 18 interstitial water (IW) samples were taken from all sediment lithologies except for unconsolidated sands. It was challenging to decipher the IW properties because of the limited number of collected IW samples as a consequence of the abundance of sand. However, as demonstrated by the nearly complete sulfate depletion that coincides with a concentration peak for dissolved sulfide, the sulfate–methane transition zone (SMTZ) is located at ~25 mbsf. Concentration maxima for alkalinity (around 32 mM) at the SMTZ and for ammonium (6 mM) below the SMTZ around 35–40 mbsf are the lowest found during this expedition with the exception of those within Ringvent. These low concentrations suggest decreased microbial organic matter remineralization in terrestrially impacted sediments. Authigenic carbonate precipitation was observed visually, and the precipitation depth coincides with a sharp decrease in Ca2+ concentrations.
1.3.6. Organic geochemistry
At Site U1551, organic geochemists sampled and analyzed gas and solid-phase samples to examine whether the terrigenous influence at this site generates specific organic geochemical signatures. In Hole U1551A, one headspace gas sample was analyzed per 9.5 m of advancement for routine hydrocarbon safety monitoring, and the carbon, nitrogen, and sulfur contents of particulate sediment were characterized. In Hole U1551B, hydrocarbon analyses on headspace gas were performed at high resolution (two per 9.5 m of core), H2 and CO contents were measured, and carbon, nitrogen, and sulfur contents of sediment were characterized. Hydrocarbon gases are detectable below ~30 mbsf and are primarily composed of methane and ethane. C3–C6 hydrocarbons were detected in only a few intervals at very low concentrations. Gas concentration with depth is strongly influenced by the presence of sand. From elemental analysis, we infer that the primary source of organic matter in organic-rich intervals is marine in origin. The presence of mineral-bound nitrogen in the organic-poor levels prevents interpreting the C/N values in terms of organic source. H2 and CO are present at nanomolar concentration levels and exhibit no trend with depth.
1.3.7. Microbiology
Site U1551 is located on the southeastern flanking region of Guaymas Basin in an area of low heat flow and is influenced by terrigenous sedimentation derived from the Yaqui River, which drains the Sierra Madre Occidental and coastal Sonora. Consequently, this site presents an opportunity for microbiologists to examine microbial abundance and community structure in terrestrial organic carbon–enriched sediments with more moderate temperature gradients compared to the other sites drilled during Expedition 385. Syringe samples for cell counts, 3-D structural imaging, and RNA analyses were taken on the core receiving platform, preserved or frozen, and stored for further analyses. Whole-round core samples were either stored in a −80°C freezer or temporarily stored in a 4°–8°C cold room and processed further for shore-based analyses, as described for Site U1545. Samples for PFT measurements were taken on the core receiving platform by syringe at five distinct horizons. Cell abundance for selected samples was determined by direct counting with an epifluorescence microscope. Cell abundance was 1.1 × 10⁶ cells/cm3 in bottom seawater and 0.9 × 10⁹ cells/cm3 in seafloor sediments. Below the seafloor, cell abundance gradually decreased to 6.9 × 10⁶ cells/cm3 at approximately 39 mbsf, thus remaining above the detection limit of the protocol that we used for shipboard measurements at this deepest sampling depth in Hole U1551B.
1.3.8. Petrophysics
Physical properties at Site U1551 were measured on whole-round and working-half core sections. Two holes were cored: Hole U1551A to ~120 mbsf and Hole U1551B to ~49 mbsf. The acquired data were compared between holes for lithostratigraphic characterization and correlation of core description information with the physical properties data. Four in situ formation temperature measurements were made with the APCT-3 tool to calculate geothermal gradient (~100°C/km) and heat flow (~108 mW/m2). All petrophysical parameters consistently identify four distinct depth intervals that correspond to alternation of diatom ooze– and silty sand–dominated lithology: from the seafloor to 15 mbsf, ~15 to ~65 mbsf, ~67–92 mbsf, and below 92 mbsf. Shear strength consistently increases with depth, coinciding with higher values in compressive strength. Porosity and density values derived from moisture and density (MAD) measurements show a strong negative correlation at all depths. The other measured physical properties (density, NGR, MS, and P-wave velocity) show a positive correlation with depth that is in accordance with the corresponding presence of diatom ooze, clay, and sand beds.
2. Background and objectives
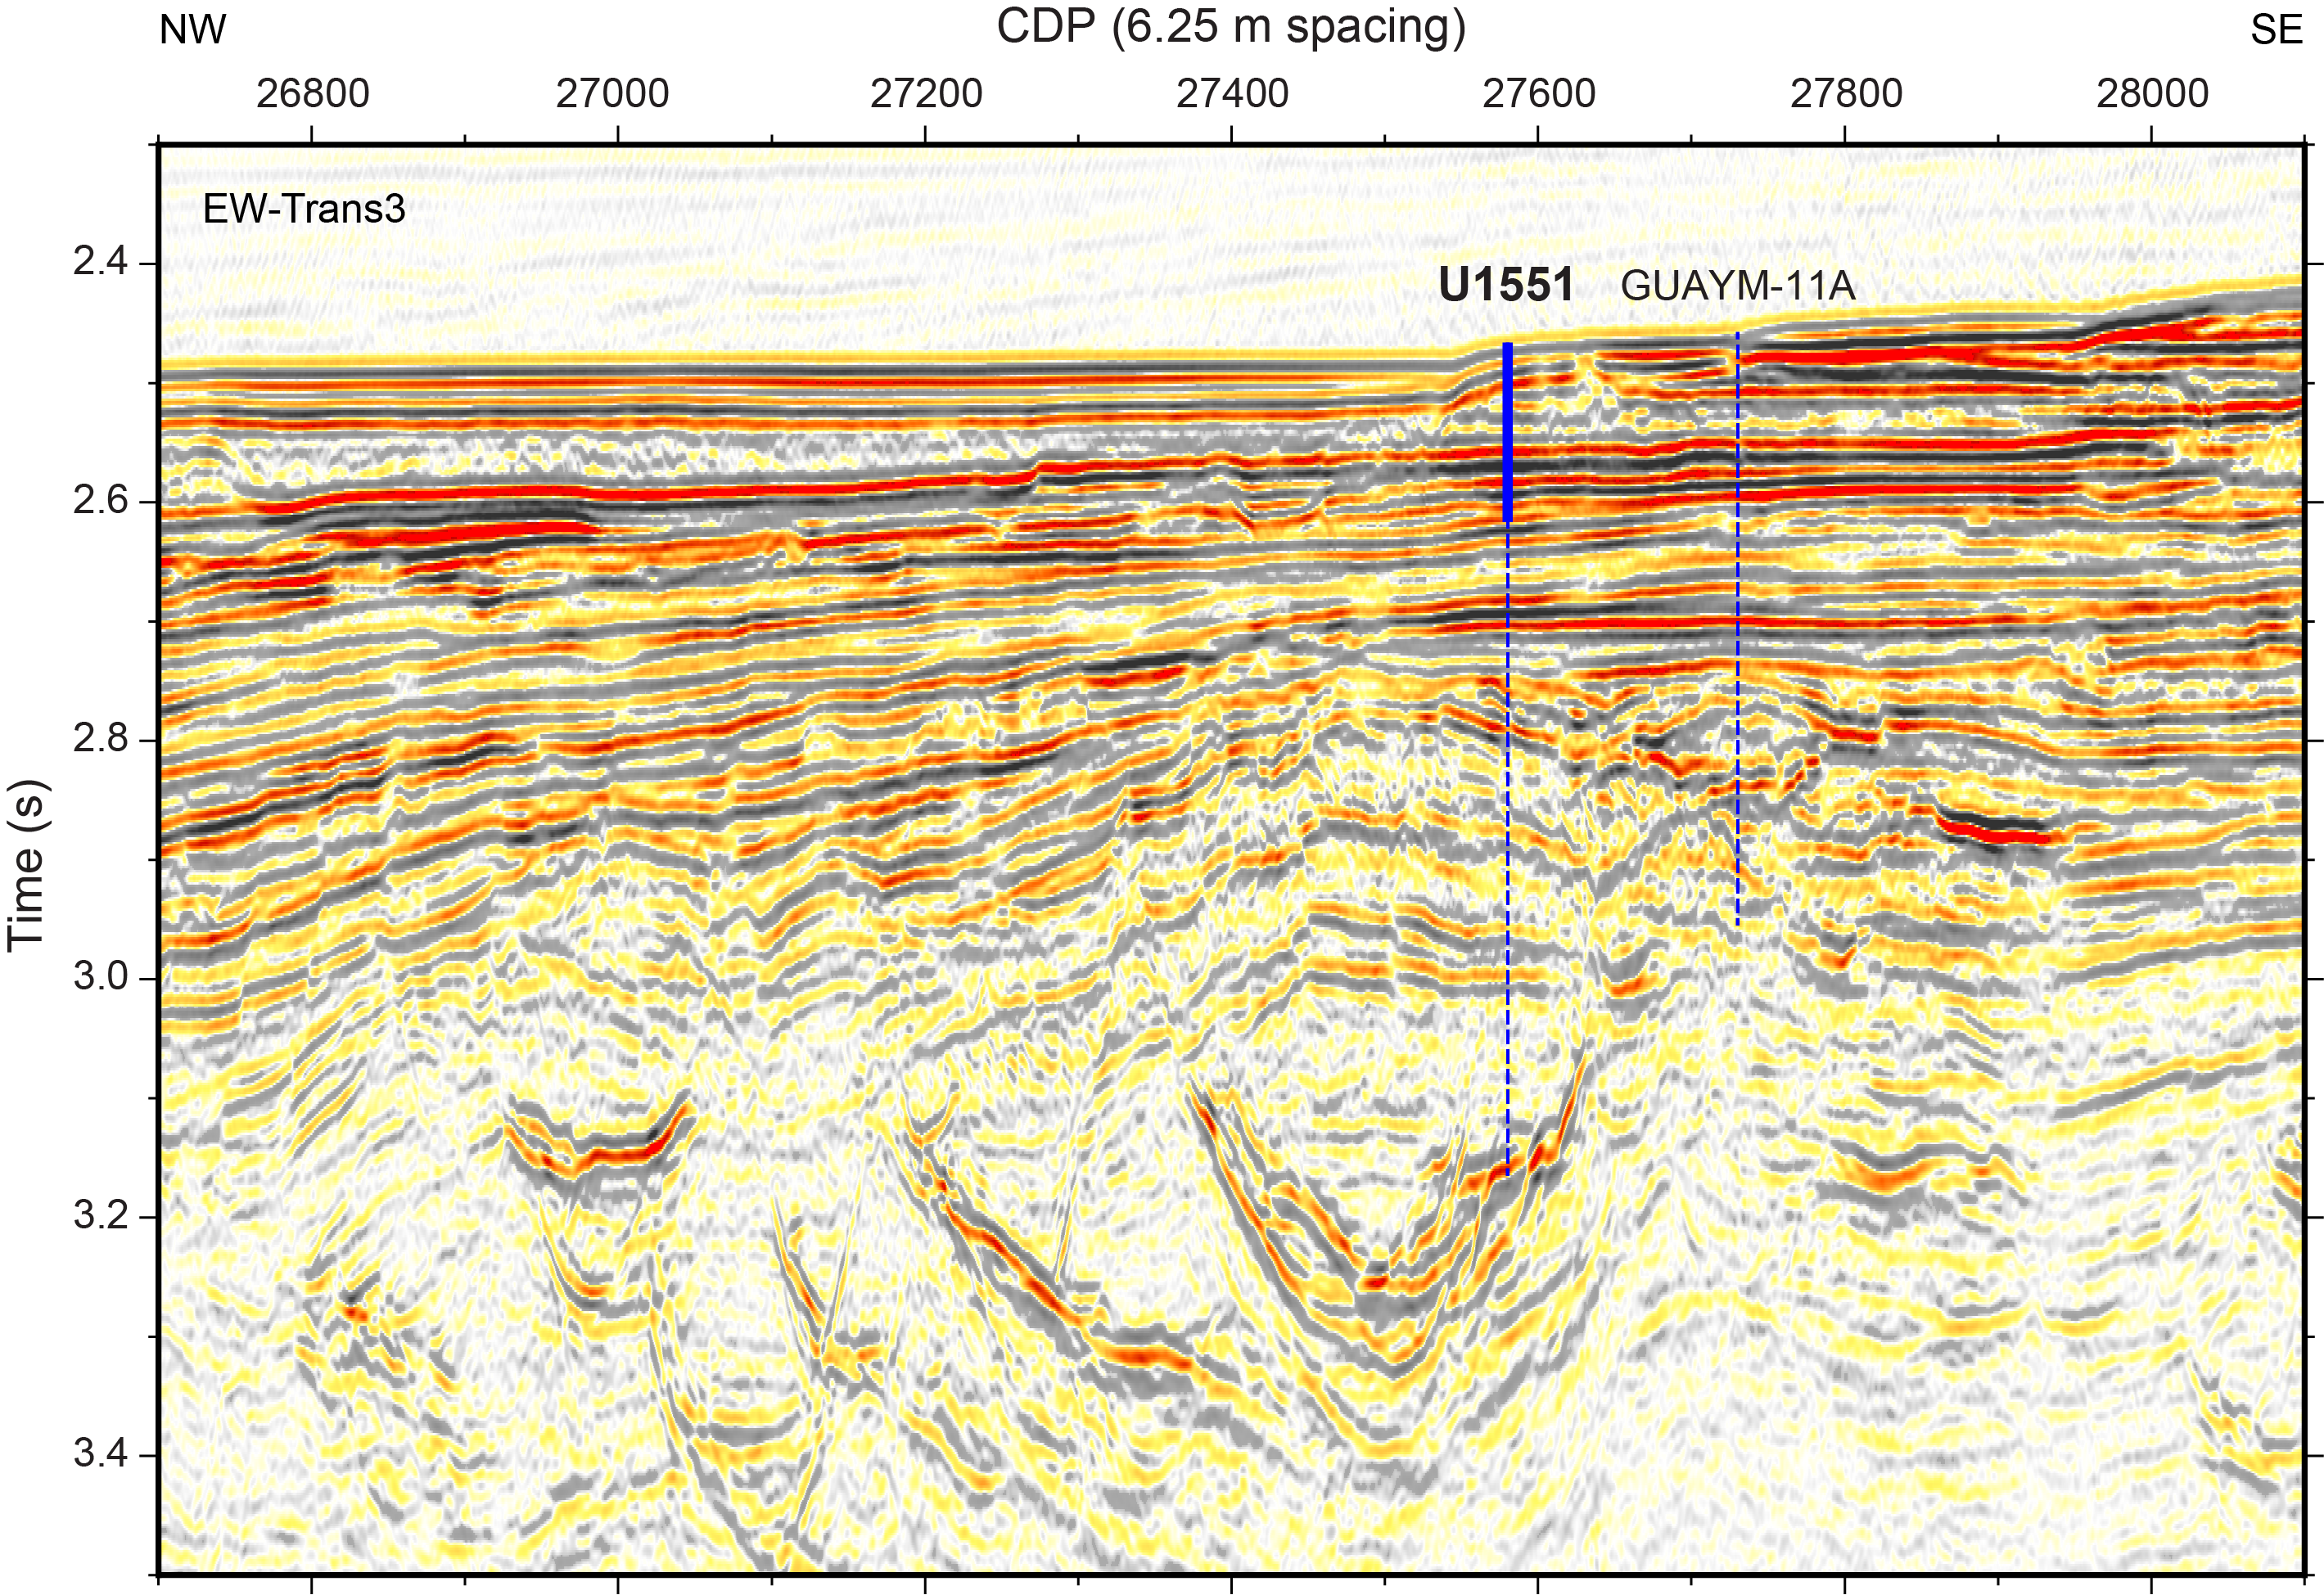
Site U1551 (proposed Site GUAYM-15A) is located at 27°12.3900′N, 111°13.1940′W ~29 km southeast of the axial graben of the northern Guaymas Basin spreading segment (Figures F1, F3). The type of sediment, the depositional environment, and the type, size, and presumably age of sill intrusions all differ on the southeastern side of the spreading segment relative to the northwest. The sediment is predominantly terrigenous and was deposited as gravity flows by mass wasting or turbidites. At Site U1551, the seismic data suggest that a large intact block of sediment (base at ~2.54 s two-way traveltime [TWT]) may have been deposited as a slide onto a wedge of turbidites (base at ~2.74 s TWT) that overlies an unconformity created by uplift in response to the intrusion of multiple sills into an older sequence of terrigenous sediments. The drilling target for this site is the large, saucer-shaped sill that lies at ~650 mbsf at Site U1551. This sill appears to be part of an interconnected complex that likely intruded during a singular event.
The physical and chemical properties of sediments may impact alteration in response to sill intrusion and have consequences for carbon cycling. The sills beneath Site U1551 are larger and more saucer shaped than those in the northwest, presumably because of the physical property differences between terrigenous and biogenic sediments. Sediment physical properties also impact permeability evolution with induration and thus may impact the vigor of hydrothermal circulation and the consequent efficiency of thermogenic alteration. Initial analyses of gravity cores from the 2014 research vessel (R/V) El Puma survey of this area showed that the concentrations of organic matter in and the δ15N isotopic signatures of these sediments differ from the predominantly biogenic sediments in the northwest (Ramírez et al., 2020). There is also typically a greater presence of metals in terrigenous sediments than in biogenic sediments, and this may affect sediment alteration and pyrolysis, which is sensitive to metals.
One overarching goal of Expedition 385 is to understand the response of sediments to sill intrusion by studying a range of key factors that impact this response, and sediment type is an important factor. A primary science objective at Site U1551 is thus to constrain the influence of sediment type—here, predominantly terrigenous sediment—on sill-driven sediment alteration and on carbon processing.
3. Operations
3.1. Site U1551
Site U1551 comprises two holes located on the southeastern flank of the northern Guaymas Basin graben structure. The original plan for Site U1551 was to core two holes, each to 200 mbsf, with the APC system. The second hole would then be deepened to 670 mbsf using the extended core barrel (XCB) system. The first hole would be dedicated to lithologic and pore water analysis, and the second hole would focus on microbiology and biogeochemical sampling. Actual operations proved much different from the plan. Hole U1551A was cored with the APC and HLAPC systems to just 120.3 mbsf because coring had to be terminated early when unconsolidated sands caused hole instability. Nearby Hole U1551B was APC cored to 48.5 mbsf and utilized for intense microbiology sampling, reaching the newly established target depth interval at which the top of the unconsolidated formation occurred. In total, 34.3 h, or 1.4 days, were spent at Site U1551.
3.1.1. Hole U1551A
Upon completing our ~34 nmi sea passage from Hole U1546D, we arrived at the Site U1551 coordinates at 1213 h on 2 November 2019, lowered the thrusters, and switched to dynamic positioning (DP) mode at 1219 h. We then made up an APC/XCB bottom-hole assembly (BHA) and started lowering the drill string to the seafloor to commence coring in Hole U1551A. At 1530 h, we picked up the top drive and positioned the bit above the seafloor at 1836.8 meters below sea level (mbsl). The orientation tool and APC core barrel were installed, and Hole U1551A was spudded at 1700 h on 2 November. Mudline Core 385-U1551A-1H recovered 2.6 m and determined a seafloor depth of 1844.1 mbsl. Cores 1H–19F penetrated from the seafloor to a final depth of 120.3 mbsf and recovered 122.1 m (102%) (Table T1). Partial strokes were encountered on Cores 4H–9H, 11H, and 13H–15H. Nonmagnetic core barrels were used and orientation measurements were taken on Cores 3H–15H using the Icefield MI-5 core orientation tool. We made formation temperature measurements with the APCT-3 tool on Cores 4H, 7H, 10H, and 13H. We switched to the HLAPC system after Core 15H at 108.2 mbsf. Coring was terminated in Hole U1551A after recovering Core 19F because unconsolidated sand layers destabilized hole conditions considerably and prevented us from reaching our deeper drilling objectives. We pulled the drill string out of the hole, and the bit cleared the seafloor at 1025 h on 3 November, ending Hole U1551A. The total time spent on Hole U1551A was 23.3 h, or 0.97 days.
3.1.2. Hole U1551B
The vessel then moved 20 m east to start APC coring in Hole U1551B, which was spudded at 1130 h on 3 November 2019. Mudline Core 385-U1551B-1H recovered 4.9 m and established a seafloor depth of 1843.9 mbsl. Cores 1H–6H penetrated from the seafloor to a final depth of 48.5 mbsf and recovered 50.0 m (103%) (Table T1). Partial strokes were encountered on Cores 3H–6H. We terminated coring in Hole U1551B after recovering Core 6H when the newly established target depth of ~50 mbsf was reached. Nonmagnetic core barrels were used on all cores, and we pumped PFTs for drilling fluid (seawater) contamination monitoring on all cores to facilitate microbiology sampling. At 1645 h on 3 November, we started pulling the drill string out of the hole. The bit cleared the seafloor at 1700 h and arrived at the rig floor at 2100 h. The vessel was then secured for a return to Site U1547. We switched from DP to cruise mode at 2130 h on 3 November, ending Hole U1551B and Site U1551. The thrusters were raised, and our sea passage began at 2200 h on the same day. The total time spent on Hole U1551B was 11.0 h, or 0.46 days.
4. Lithostratigraphy
Site U1551, the easternmost site drilled in the Guaymas Basin, is situated at the toe of submarine lobe-like features in the Yaqui pro-delta, a region not previously drilled during Deep Sea Drilling Project (DSDP) Leg 64. The seafloor at this site lies in a water depth (1844 m) similar to that of Site U1549 and provides insight into the nature of Yaqui pro-delta sedimentation, including mass wasting and channelization. Sediments cored at this site can be traced westward on seismic lines; they appear to cover and fill the northern extreme of the southern graben, diminishing its bathymetric expression (Figure F3).
The purpose of drilling at this site was to penetrate to a deep sill where the interaction between sill and terrigenous sediments could be explored (Teske et al., 2018). The presence of unconsolidated sandy intervals thwarted drilling and resulted in early abandonment of Hole U1551A (penetration of ~120 m rather than 670 m as originally planned; see Operations). The few (n = 6) cores collected in Hole U1551B, located ~20 m from Hole U1551A, extended only to the top of the first thick sand interval encountered at this site. Hole U1551B was extensively sampled for geochemistry and microbiology.
For each hole, the lithostratigraphic descriptions and analyses were carried out based on the curated depth of the cores (core depth below seafloor, Method A [CSF-A]); all references to depths in the text, figures, and tables refer to CSF-A depths and use mbsf as the unit. Hole U1551A was drilled to 120.3 mbsf with a total curated depth of 120.36 mbsf and an overall 102% recovery rate. Hole U1551B penetrated 48.5 m with a total curated depth of 48.54 mbsf and 103% recovery rate.
Of 19 cores collected in Hole U1551A, 15 were acquired using the APC system and 4 were acquired using the HLAPC system (core designators H and F, respectively). The six cores obtained from Hole U1551B were all recovered using the APC system. Although the quality of core using the APC system was very good, the presence of thick sand sections at the bottom of and intercalated within the cores suggests that some of the sandy intervals may be coring-induced flow-in material rather than representing recovery of actual sandy formation. The coring impact likely inflated recovery rates of this lithology.
The lithologic determinations and interpretations made on cores from the two holes used a combination of visual core description, examination of smear slides with a petrographic microscope, mineralogic analysis by X-ray diffraction, and carbonate analyses. Interpretation was also aided by measurement of physical properties such as MS, NGR, and color reflectance (see Lithostratigraphy and Petrophysics in the Expedition 385 methods chapter [Teske et al., 2021a]). Hole U1551A was dedicated to lithostratigraphic description with minor whole-round core sampling. Hence, most of the observations and the depths of lithologic changes reported are from that hole. This is in contrast to Hole U1551B, where significant thicknesses of core were not described because of shipboard microbiology sampling of whole-round cores.
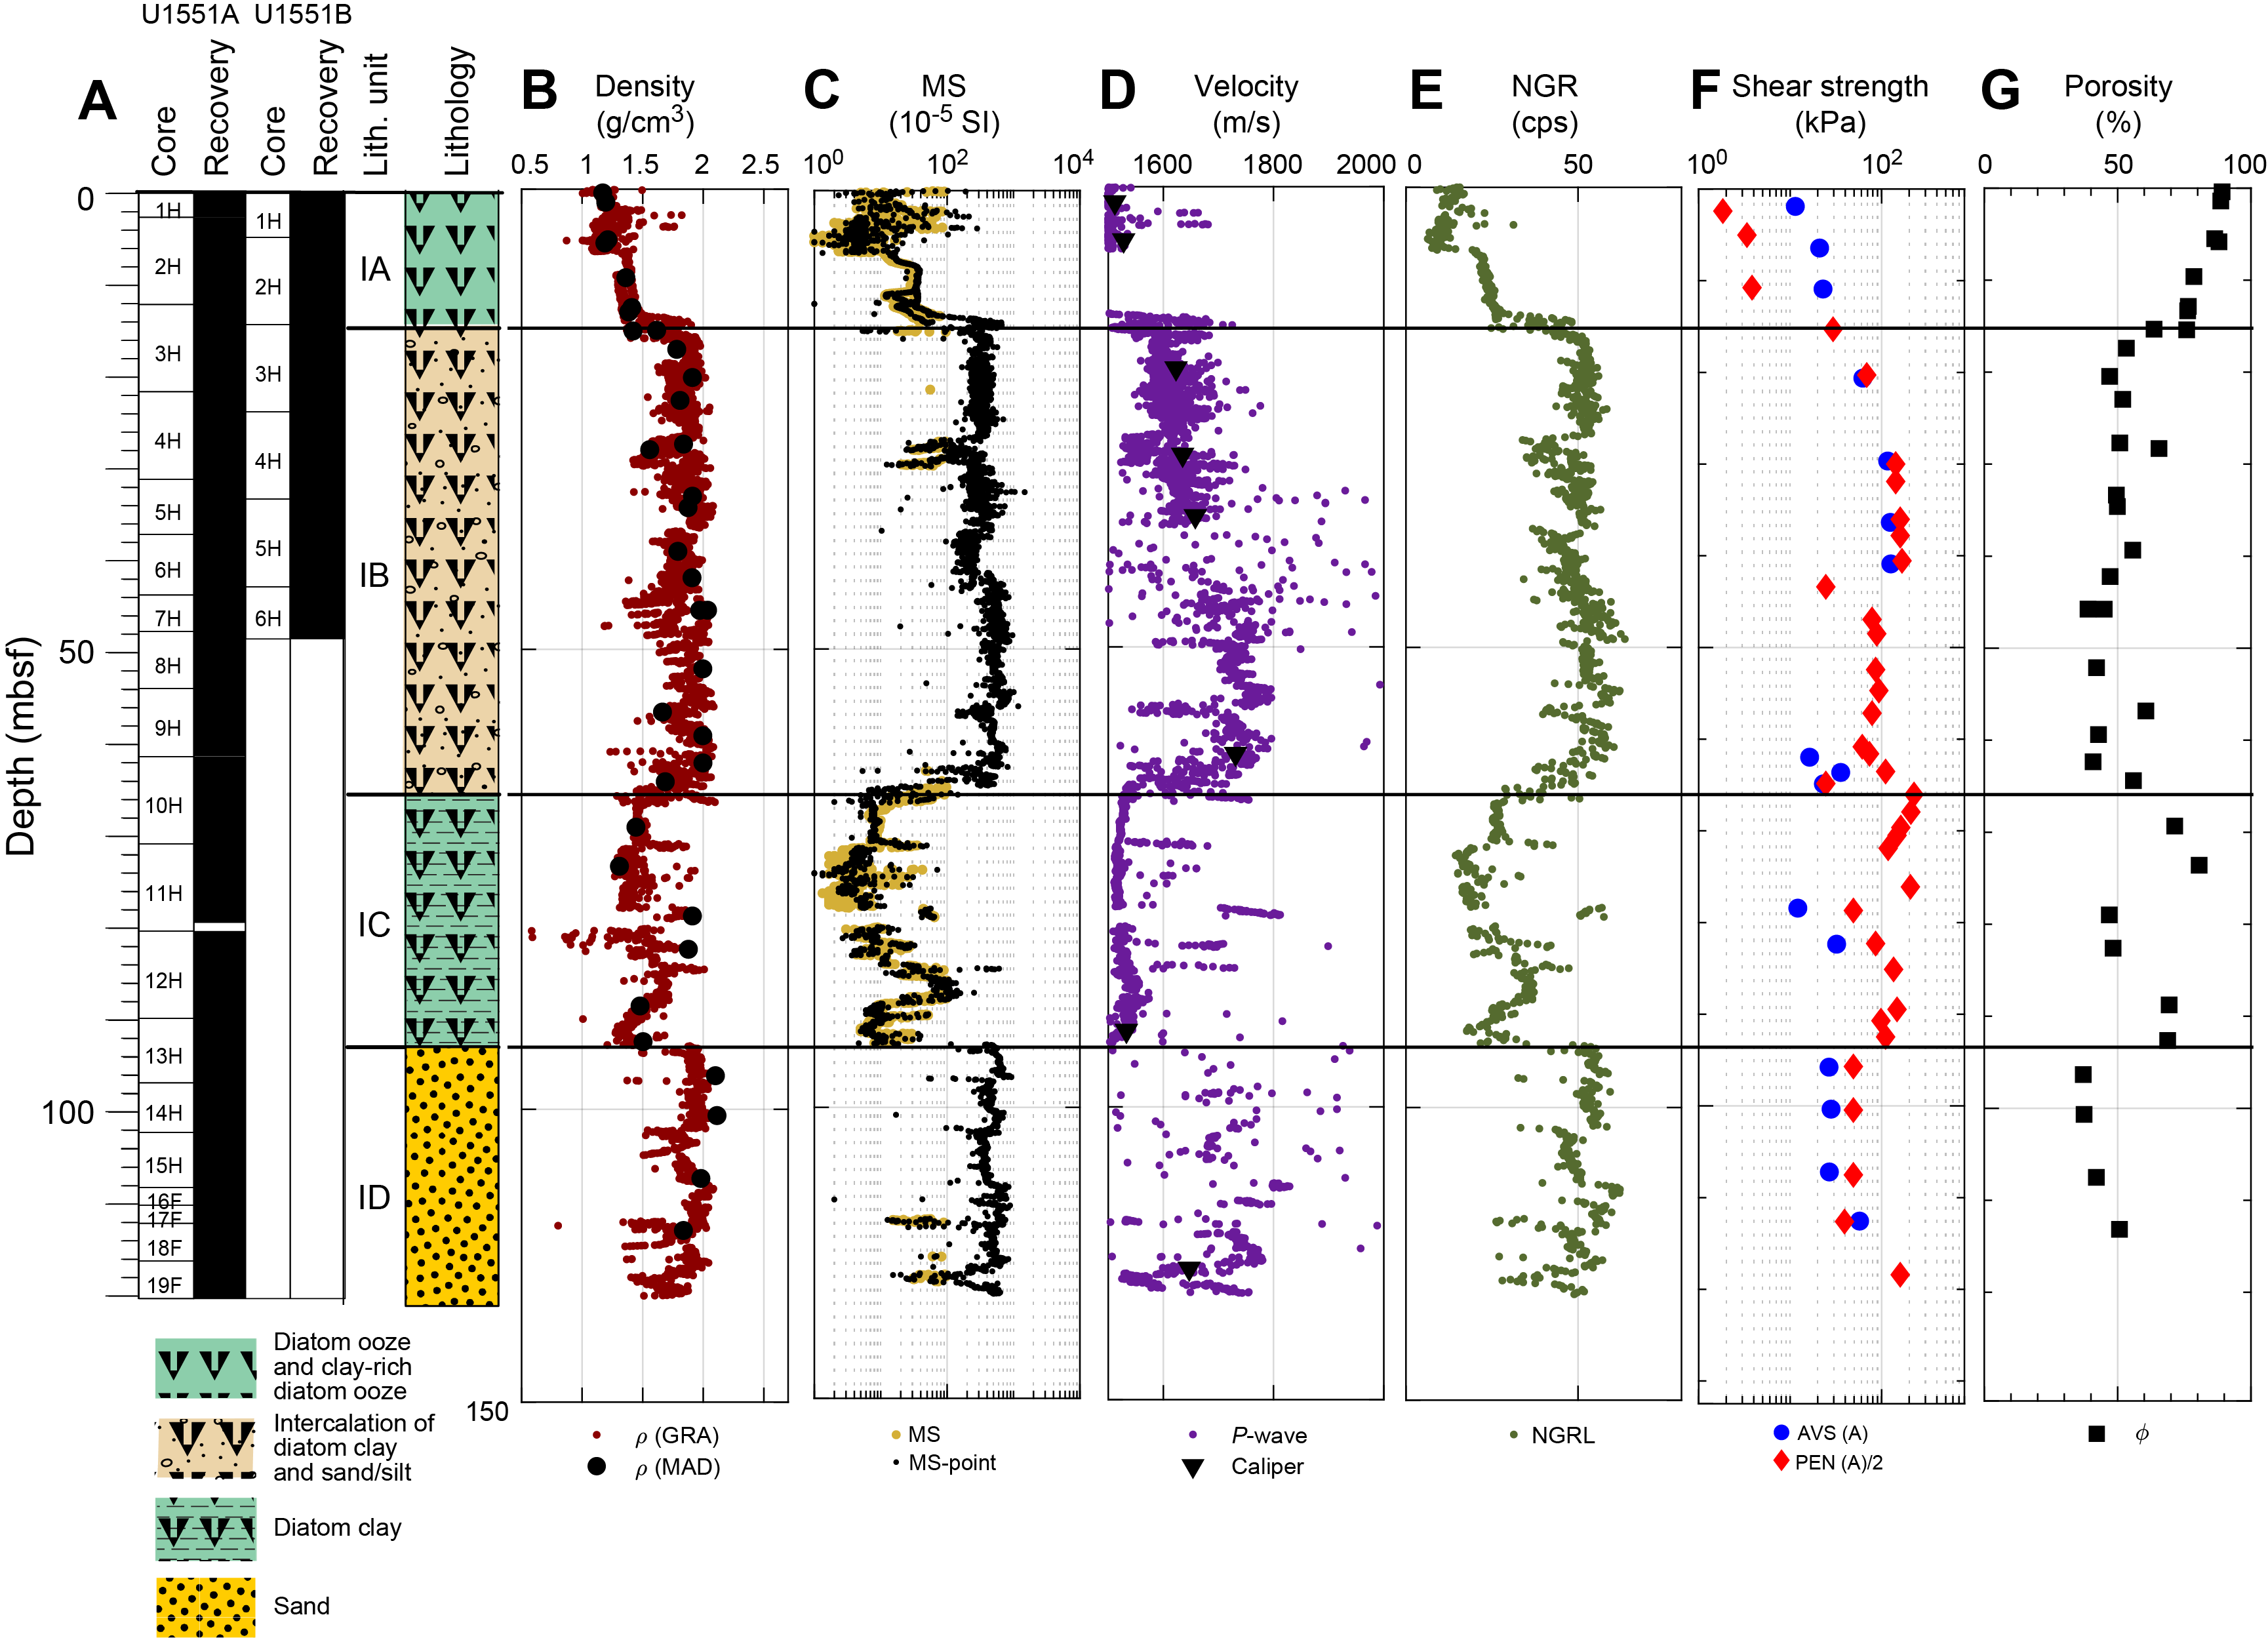
The sediments recovered at Site U1551 are assigned to a single Lithostratigraphic Unit I. The unit represents a combination of biogenic (diatom ooze to diatom clay) and terrigenous (sand/silt/clay grade) components with the highest overall proportion of silty to sandy intervals (~60%) cored during Expedition 385 (Sites U1545–U1548). Biogenic and terrigenous lithologic alternations did not warrant division into more than one lithostratigraphic unit but were deemed significant enough to create four lithostratigraphic subunits (IA–ID) (Figure F4; Table T2).
4.1. Unit description
4.1.1. Lithostratigraphic Unit I
- Intervals: 385-U1551A-1H-1, 0 cm, to 19F-3, 145 cm; 385-U1551B-1H-1, 0 cm, to 6H-5, 100 cm
- Depths: Hole U1551A = 0–120.36 mbsf, Hole U1551B = 0–48.54 mbsf
- Thickness: Hole U1551A = 120.36 m, Hole U1551B = 48.54 m
- Age: (Holocene? to) late to middle Pleistocene
- Lithology: diatom ooze, diatom clay, nannofossil-rich diatom ooze, nannofossil-rich diatom clay, sand, silty sand, silt, clayey silt to silty clay, micrite, and limestone/dolostone
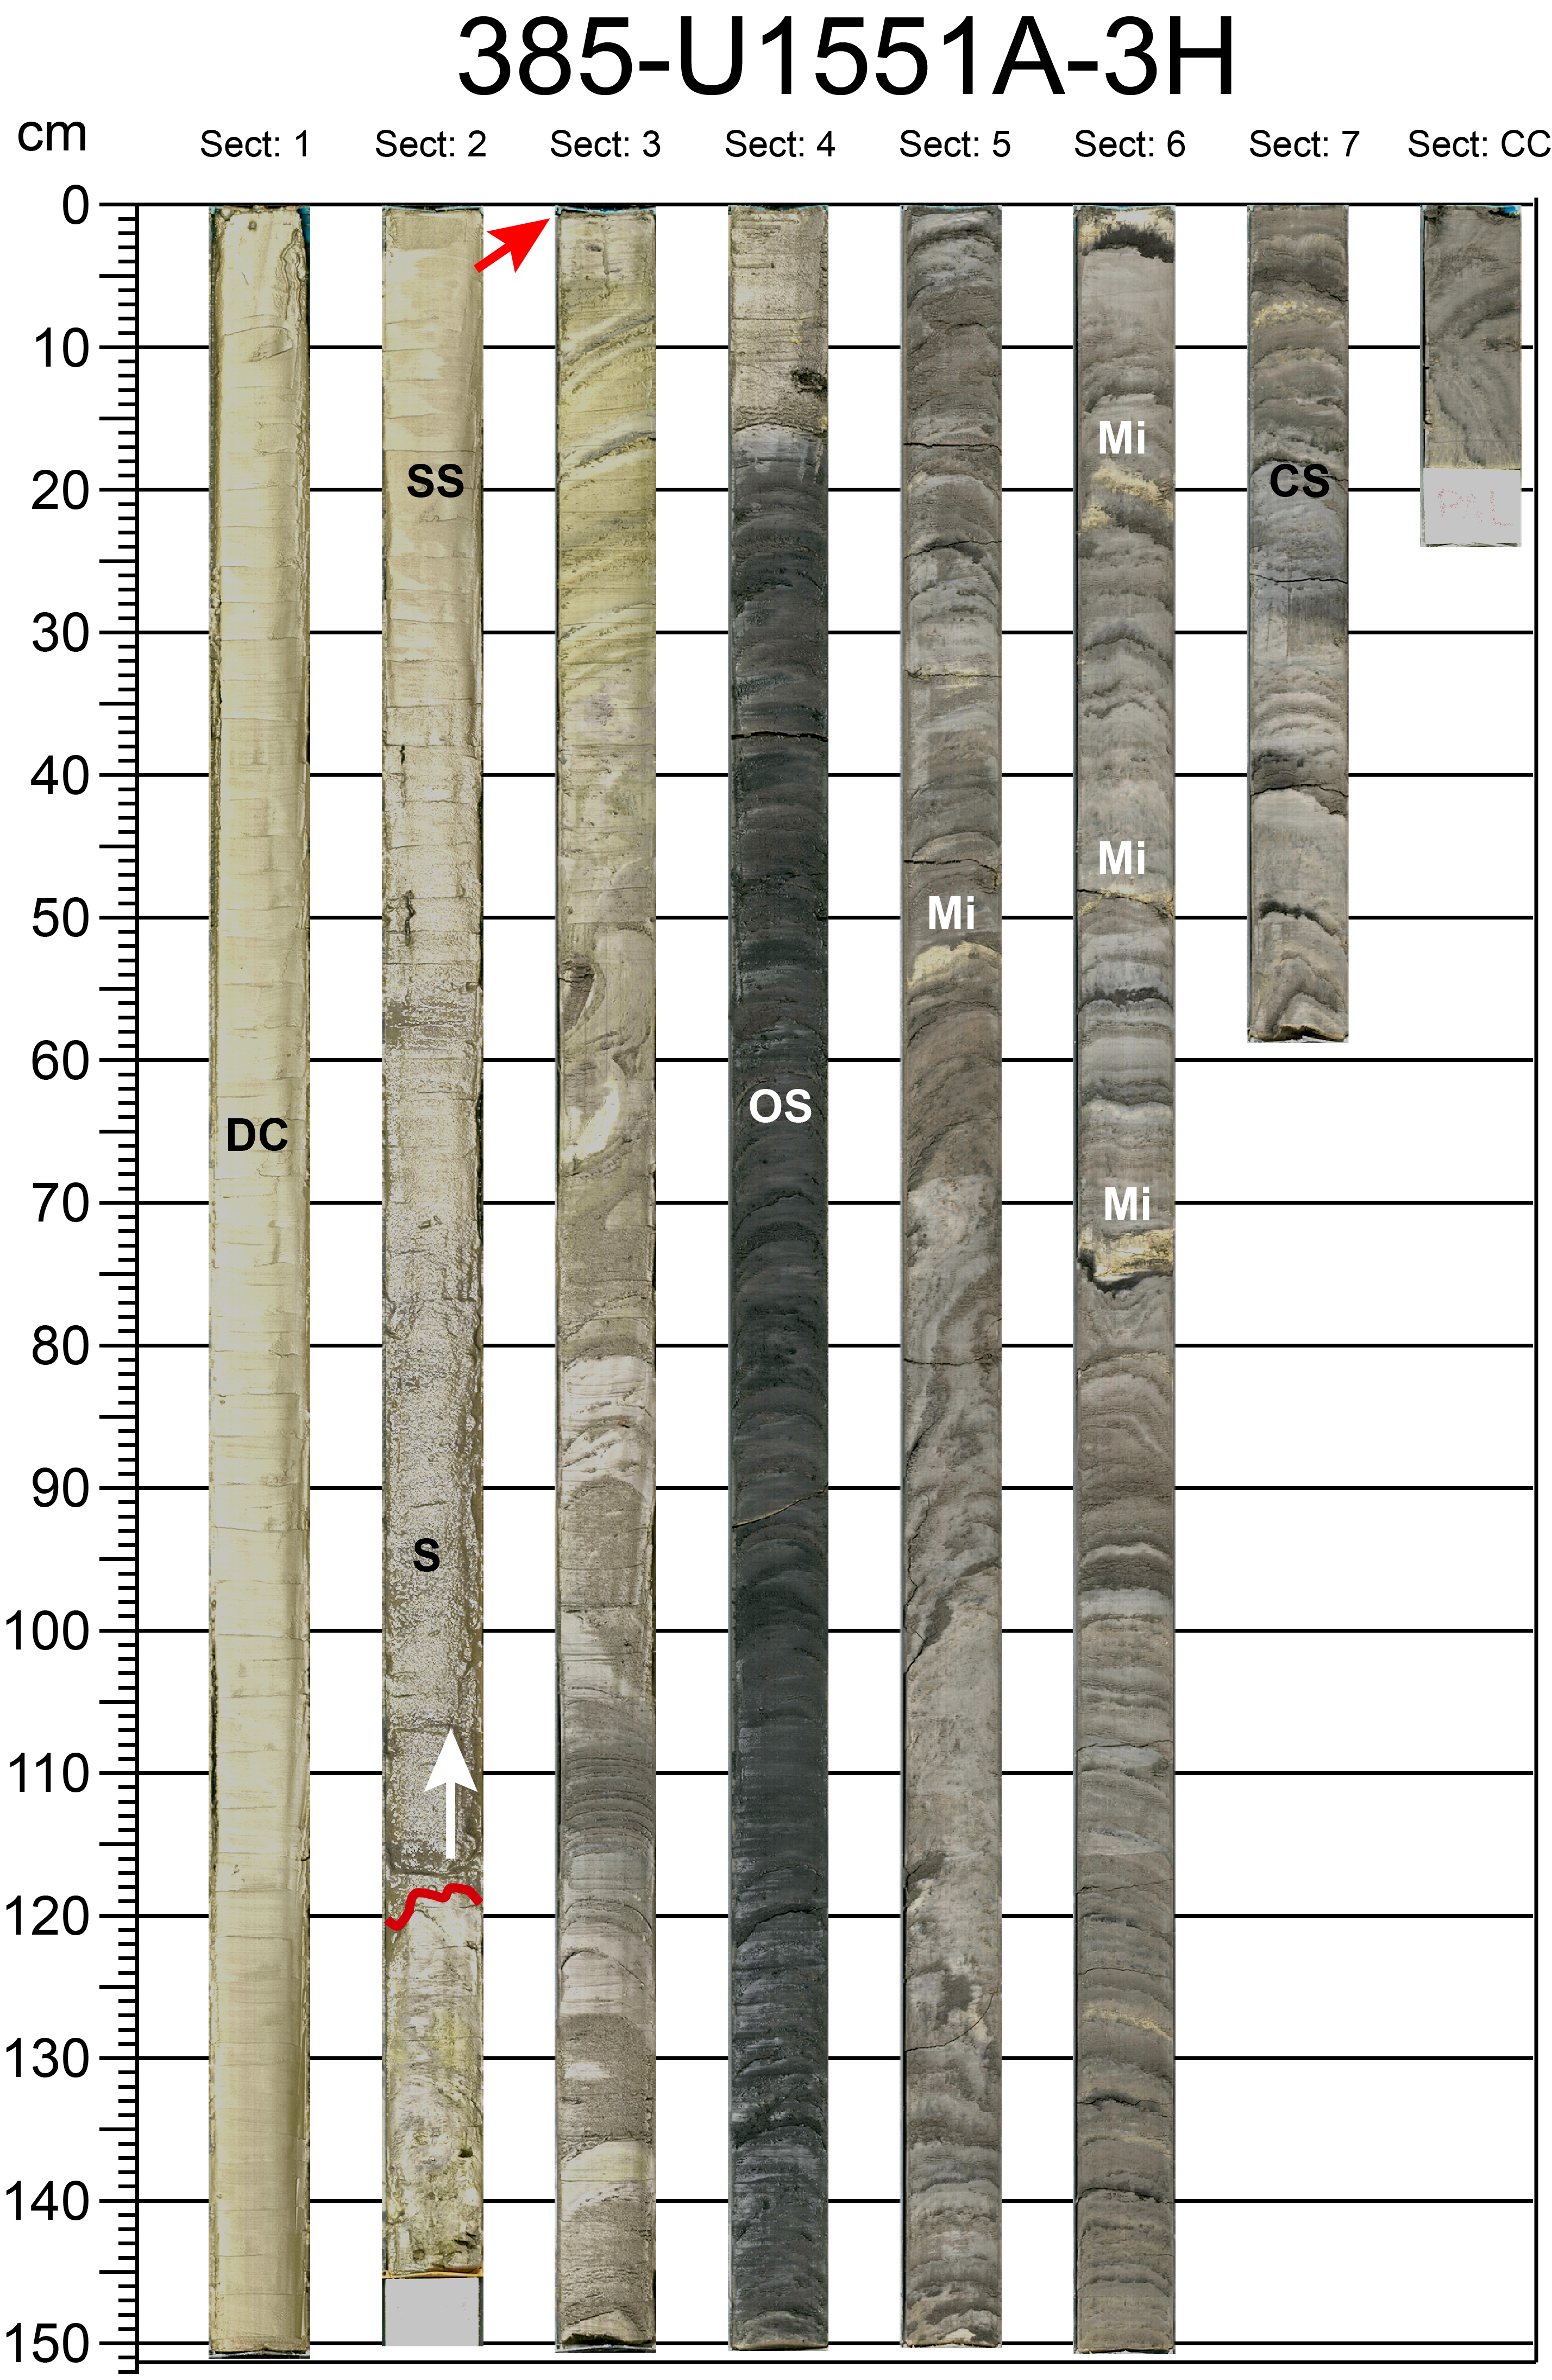
Lithostratigraphic Unit I is composed of ~120 m of Holocene(?) and late to middle Pleistocene biogenic and siliciclastic sediment. It is characterized by alternating centimeter-thick to several meters–thick intervals of sediment that are dominated by either biogenic or siliciclastic components. Roughly 60% of the record is composed of siliciclastic particles (e.g., sand, silty sand, and silty clay to clayey silt). This lithologic component is most abundant in two main stratigraphic intervals occurring in Cores 358-U1551A-3H through 9H and 13H–19F (Figure F4). In contrast, the remaining 40% of the recovered section drilled consists of lithologies dominated by biogenic particles and/or mixed with fine-grained siliciclastics (e.g., diatom ooze and diatom clay). In particular, lithologies in which the content of diatoms is very high (>85%) were mainly found in Cores 1H, 2H, and 10H–12H (Figure F4). These lithologic patterns are reflected in the NGR, MS, and color reflectance data, forming the basis of the division of Unit I into four subunits: Subunits IA and IC are more biogenic rich, and Subunits IB and ID are more siliciclastic rich. Authigenic carbonate, the third lithologic component observed at this relatively shallow site, includes patchy micrite, partly cemented sandstone intervals, and carbonate concretions. The shallowest carbonate occurrence is in Section 3H-2, corresponding to the depth of the first thick sand bed.
Sand intervals in Unit I, which range from massive to locally discrete beds, exhibit normal grading, lamination, and scoured bases. Silty intervals are normally limited to thinner beds or the tops of fining-upward sandy beds. The colors of the sand and silty sand beds in Unit I range from dusky yellowish brown to dark yellowish brown to brownish gray and, less frequently, olive-gray, medium gray, and olive-black. The color variations may be related to changes in composition. For example, the darker sand intervals are rich in terrestrial organic matter. The sand is largely composed of lithic debris (rock fragments) and feldspar with lesser quartz, mica, and dense minerals. There also appears to be a relationship between composition and grain size. Although the coarser (medium) sand is more enriched in rock fragments, the very fine sand to silt fractions are more feldspar rich. Accessory (heavy and micaceous) mineral contents are variable on a low percentage level. Smear slides of the silt to fine sand fractions show average quartz-feldspar-rock (QFR) percentages of 7%, 31%, and 62%, respectively.
Smear slide analyses show that the main biogenic components are diatoms with trace to minor amounts of silicoflagellates, sponge spicules, and radiolarians. Calcareous biogenic components are mainly nannofossils with traces of foraminifers. Where nannofossils are locally common biogenic components in diatom ooze, the ooze is light olive-gray. Where nannofossils are common in diatom clay, the color ranges from olive-gray to moderate olive-brown. Geochemical analyses show a maximum carbonate content of 13.6 (Hole U1551A) to 9.1 wt% (Hole U1551B) in these nannofossil-bearing lithologies in Subunit IA, whereas carbonate values elsewhere in Subunit IB range from ~2 to 6 wt% (see Inorganic geochemistry). Terrigenous clay minerals and siliciclastic silt (mainly quartz, feldspar, and mica) are admixed in homogeneous intervals or concentrated in laminae within laminated intervals of diatom ooze.
4.1.1.1. Subunit IA
- Intervals: 385-U1551A-1H-1, 0 cm, to 3H-3, 0 cm; 385-U1551B-1H-1, 0 cm, to 3H-1, 36 cm
- Depths: Hole U1551A = 0–15.1 mbsf, Hole U1551B = 0–14.66 mbsf
- Thickness: Hole U1551A = 15.1 m, Hole U1551B = 14.66 m
- Age: (Holocene? to) late Pleistocene
- Lithology: diatom ooze, diatom clay, silty sand, and silty clay
Subunit IA is predominantly composed of olive-gray clay-rich diatom ooze, nannofossil-rich diatom clay, diatom clay, and subordinate diatom-rich silty clay. Open burrows are common at the very top of this subunit (Sections 385-U1551A-1H-1 and 1H-2). Gray silty sand forms the base of a depositional unit that starts in Section 3H-2, 118 cm, and fines upward to silty clay and then diatom clay through Section 3H-1 (Figure F5) and up into Core 2H. The top of this depositional unit is in Section 2H-3 at ~110 cm, for a total depositional unit thickness of ~8.7 m. Changes in both lithology and physical properties (NGR, MS, and color reflectance b* value increase) and the occurrence of carbonate authigenic precipitates warranted designation of a subunit boundary (Subunit IA/IB) at the top of Section 3H-3 (Figures F4, F5) in that depositional unit.
4.1.1.2. Subunit IB
- Intervals: 385-U1551A-3H-3, 0 cm, to 10H-4, 101 cm; 385-U1551B-3H-1, 36 cm, to 6H-5, 100 cm
- Depths: Hole U1551A = 15.1–66.65 mbsf, Hole U1551B = 14.66–48.54 mbsf (total depth)
- Thickness: Hole U1551A = 51.55 m, Hole U1551B = 33.88 m
- Age: late Pleistocene
- Lithology: silty sand, silty clay, clayey silt, sand, diatom-rich clayey silt, diatom clay, micrite, clay, organic-rich silty sand, and carbonate-cemented sandstone
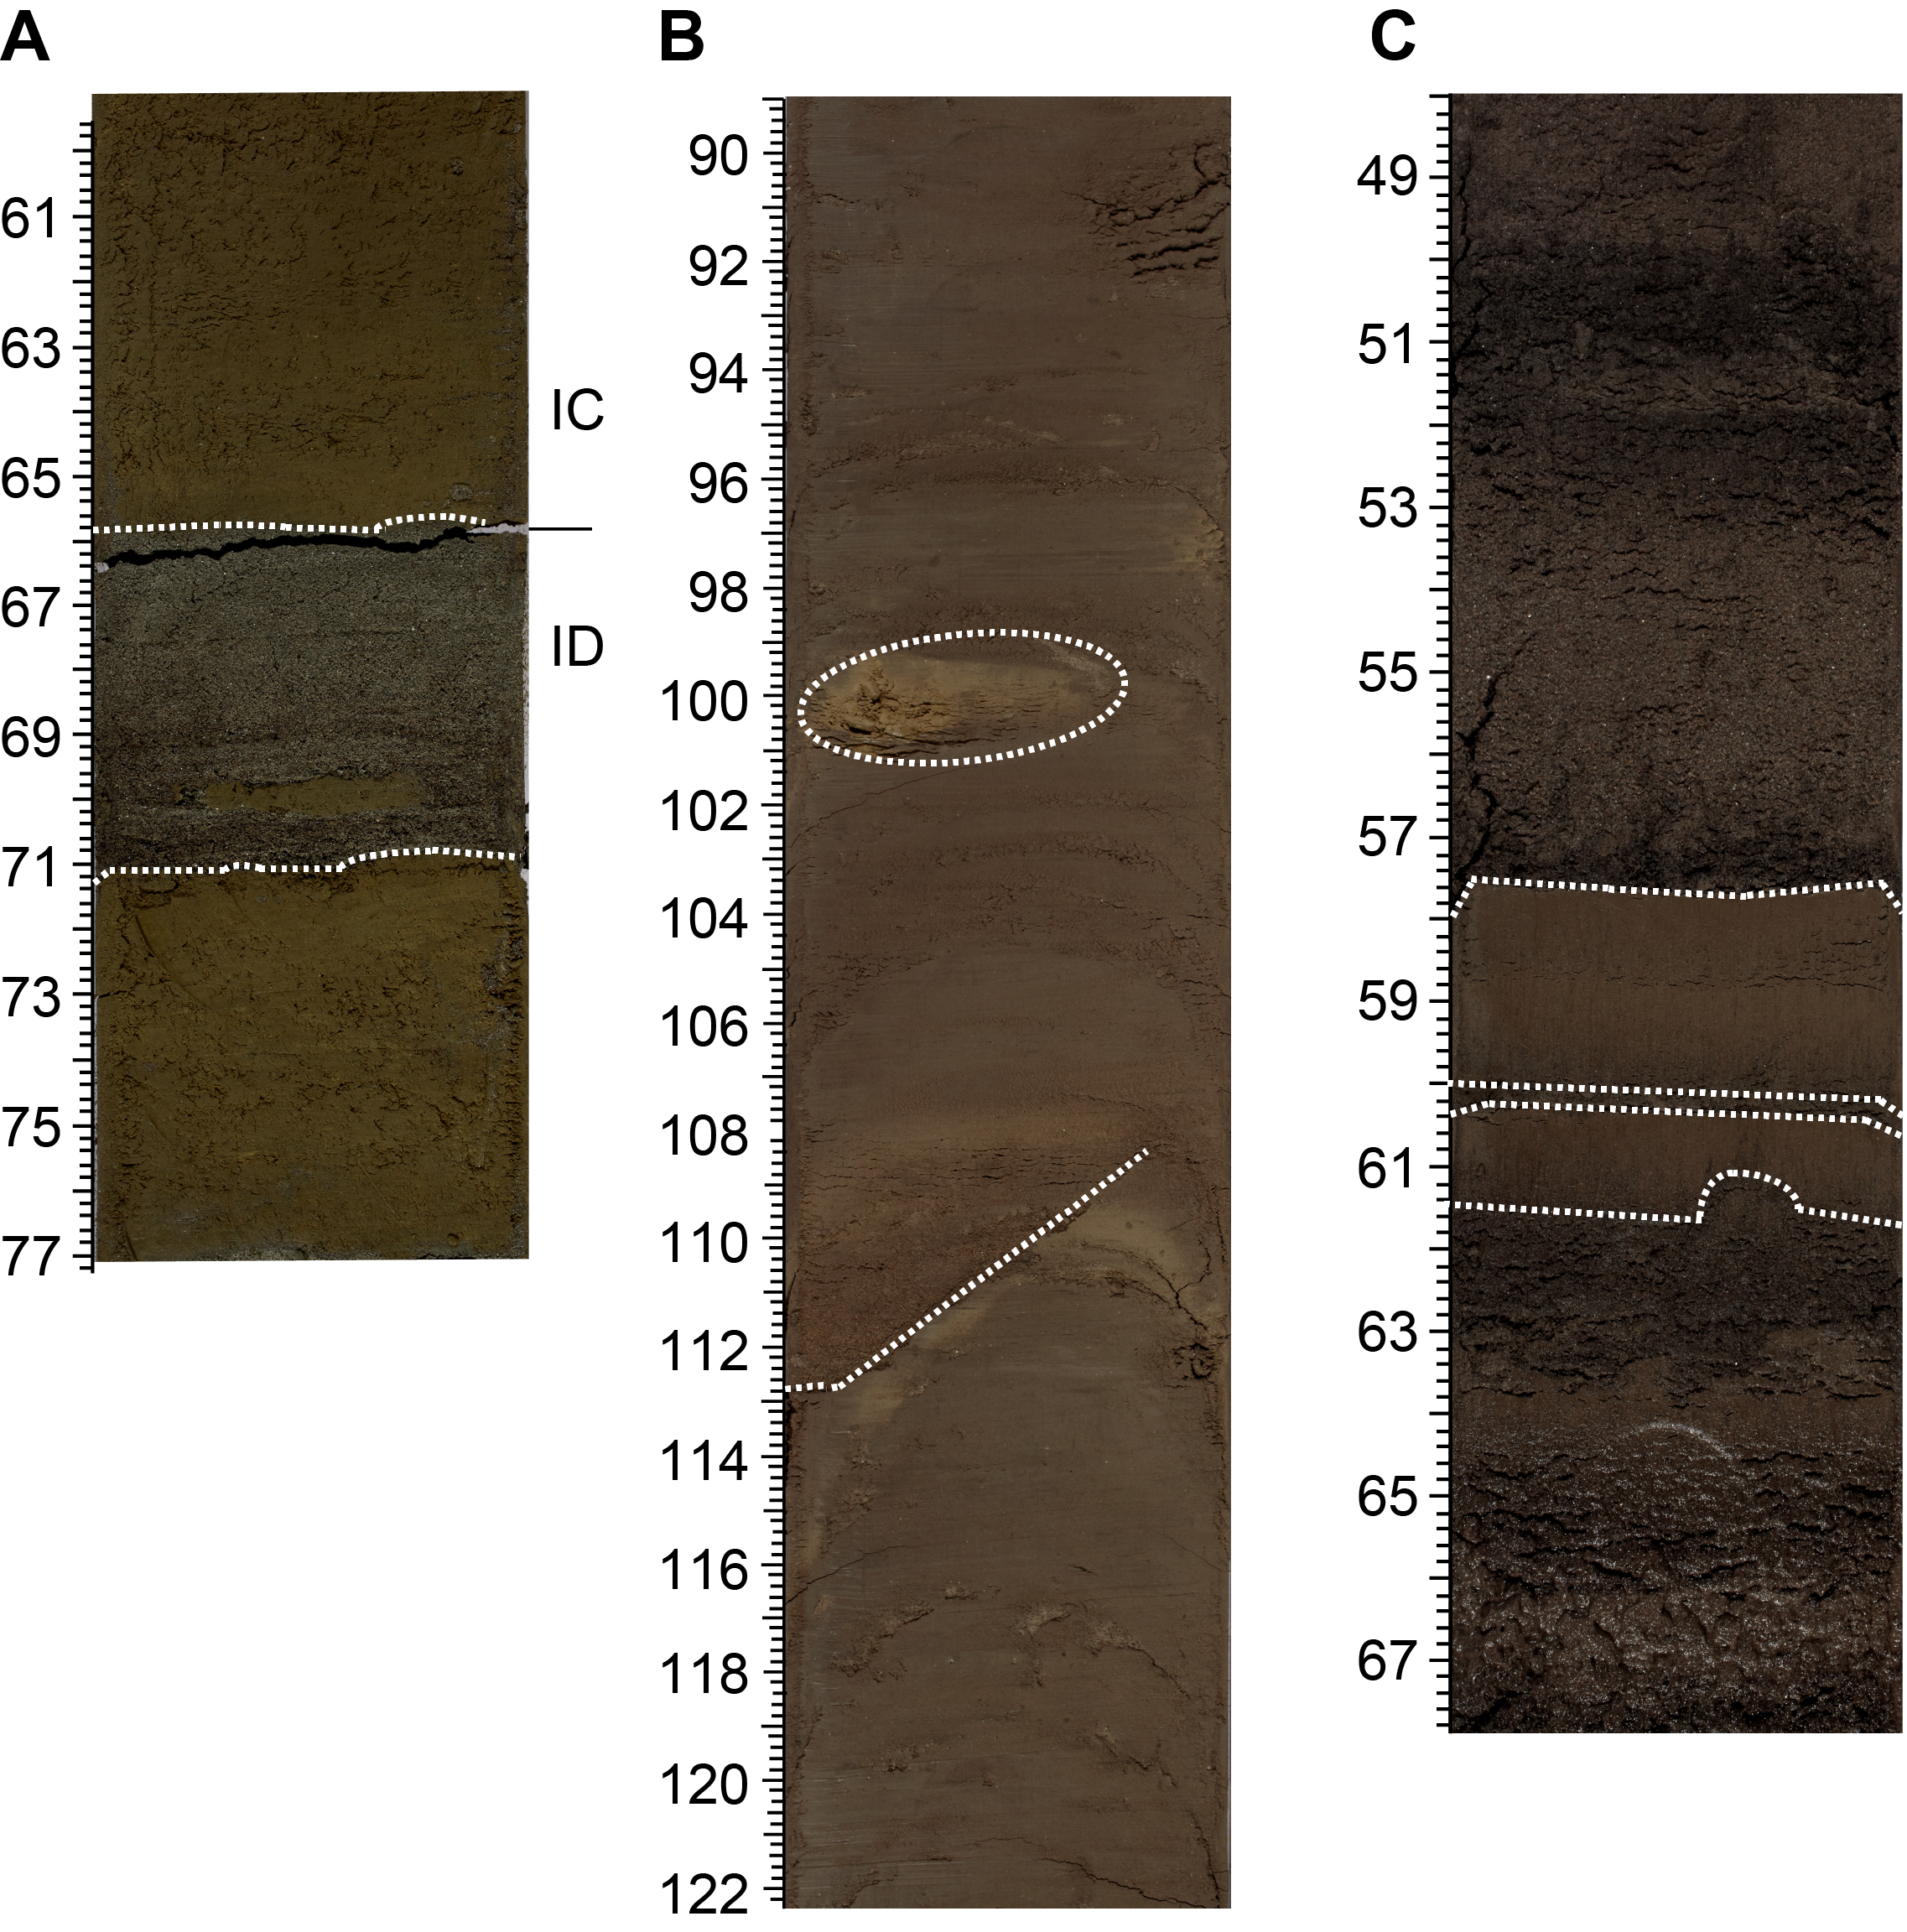
Subunit IB is dominated by coarse-grained (silt and sand) siliciclastic sediments and minor biogenic sediments; the latter is more abundant in the middle part of the subunit. The uppermost part of Subunit IB (Cores 385-U1551A-3H through 5H) displays extensive folding, tilting, and faulting (see Structural geology), although most of the sand layers (e.g., Section 3H-2) show normal grading (Figure F5). The lithologies include diatom-bearing silty sand to clayey silt and local intervals of sulfide- or organic-rich clayey silt and silty sand. Starting with Section 4H-5 at ~40 cm, the sediment locally contains yellowish brown patches of micrite, carbonate concretions, and carbonate-cemented sandstone (Figure F6).

Coarse-grained siliciclastics become the dominant lithologic component from Section 385-U1551A-6H-4 through Core 9H (Figure F6). The sediment in this part of the record shows alternating intervals of sand (locally organic rich), silty clay, and silt-rich diatom clay (Figure F7). The lower boundary of Subunit IB is lithologically gradational with Subunit IC and was placed at the base of the lowermost sand bed at 101 cm in Section 10H-4.
4.1.1.3. Subunit IC
- Interval: 385-U1551A-10H-4, 101 cm, to 13H-2, 66 cm
- Depth: Hole U1551A = 66.65–91.96 mbsf
- Thickness: Hole U1551A = 25.31 m
- Age: late Pleistocene
- Lithology: diatom clay, diatom ooze, silt, sand, and organic-rich sand
Subunit IC is composed of silt-rich diatom clay and clay-rich, mainly homogeneous diatom ooze alternating with beds of gray silty sand and sand. Shell fragments are sparse throughout the subunit. The top of Subunit IC is marked by a ~5 m thick depositional interval with a sandy base. Normal grading and abrupt bases are also common to other thinner beds in the subunit. Laminated intervals of alternating clay-rich and sand-rich lithologies are also present. Soft-sediment deformation is present throughout the subunit and includes folding and tilting of beds. The bottom part of this subunit (Sections 385-U1551A-13H-1 and 13H-2) is characterized by fine-scale alternations between diatom ooze, silt, and sand layers that end abruptly in Section 13H-2 with the appearance of dark yellowish brown to olive-gray medium-grained sand (see Subunit ID below). The Subunit IC/ID boundary is marked by the reappearance of sand and was located at the top of the shallowest sand bed. This also marks a switch to higher values of NGR and MS, which continue throughout Subunit ID (at 66 cm in Section 13H-2).
4.1.1.4. Subunit ID
- Interval: 385-U1551A-13H-2, 66 cm, to 19F-3, 145 cm
- Depth: Hole U1551A = 91.96–120.36 mbsf
- Thickness: Hole U1551A = 28.4 m
- Age: late Pleistocene
- Lithology: sand, diatom ooze, and silt
Subunit ID is dominated by brownish gray to dark yellowish brown to olive-gray medium-grained sand, which is interpreted to be partially coring-induced flow-in rather than an in situ deposit. The upper ~15 m (Cores 385-U1551A-13H through 15H) of Subunit ID are dominated by homogeneous, often organic-rich sand with intervening intervals of diatom ooze and clay-rich diatom ooze. The sand often displays vertical structures indicating drilling disturbance, specifically flow-in. In the bottom part of the subunit (Cores 16F–19F), the lithology transitions to fine-scale alternations between graded silty sand and clay laminae/very thin beds. The sand is often black because of its high organic content (e.g., Section 19F-3).
4.2. Discussion
The sedimentary succession at Site U1551 presents a complex assemblage of lithologic end-members and styles of deposition and deformation. This complexity and the extensive whole-round core sampling carried out in Hole U1551B make the correlation between the two holes drilled at this site difficult. There are, however, a few intervals in both holes that can be correlated relatively well (e.g., the diatom ooze in Subunit IA interval 385-U1551A-2H-2, 74–79 cm, matches the diatom ooze in interval 385-U1551B-2H-1, 74–79 cm).
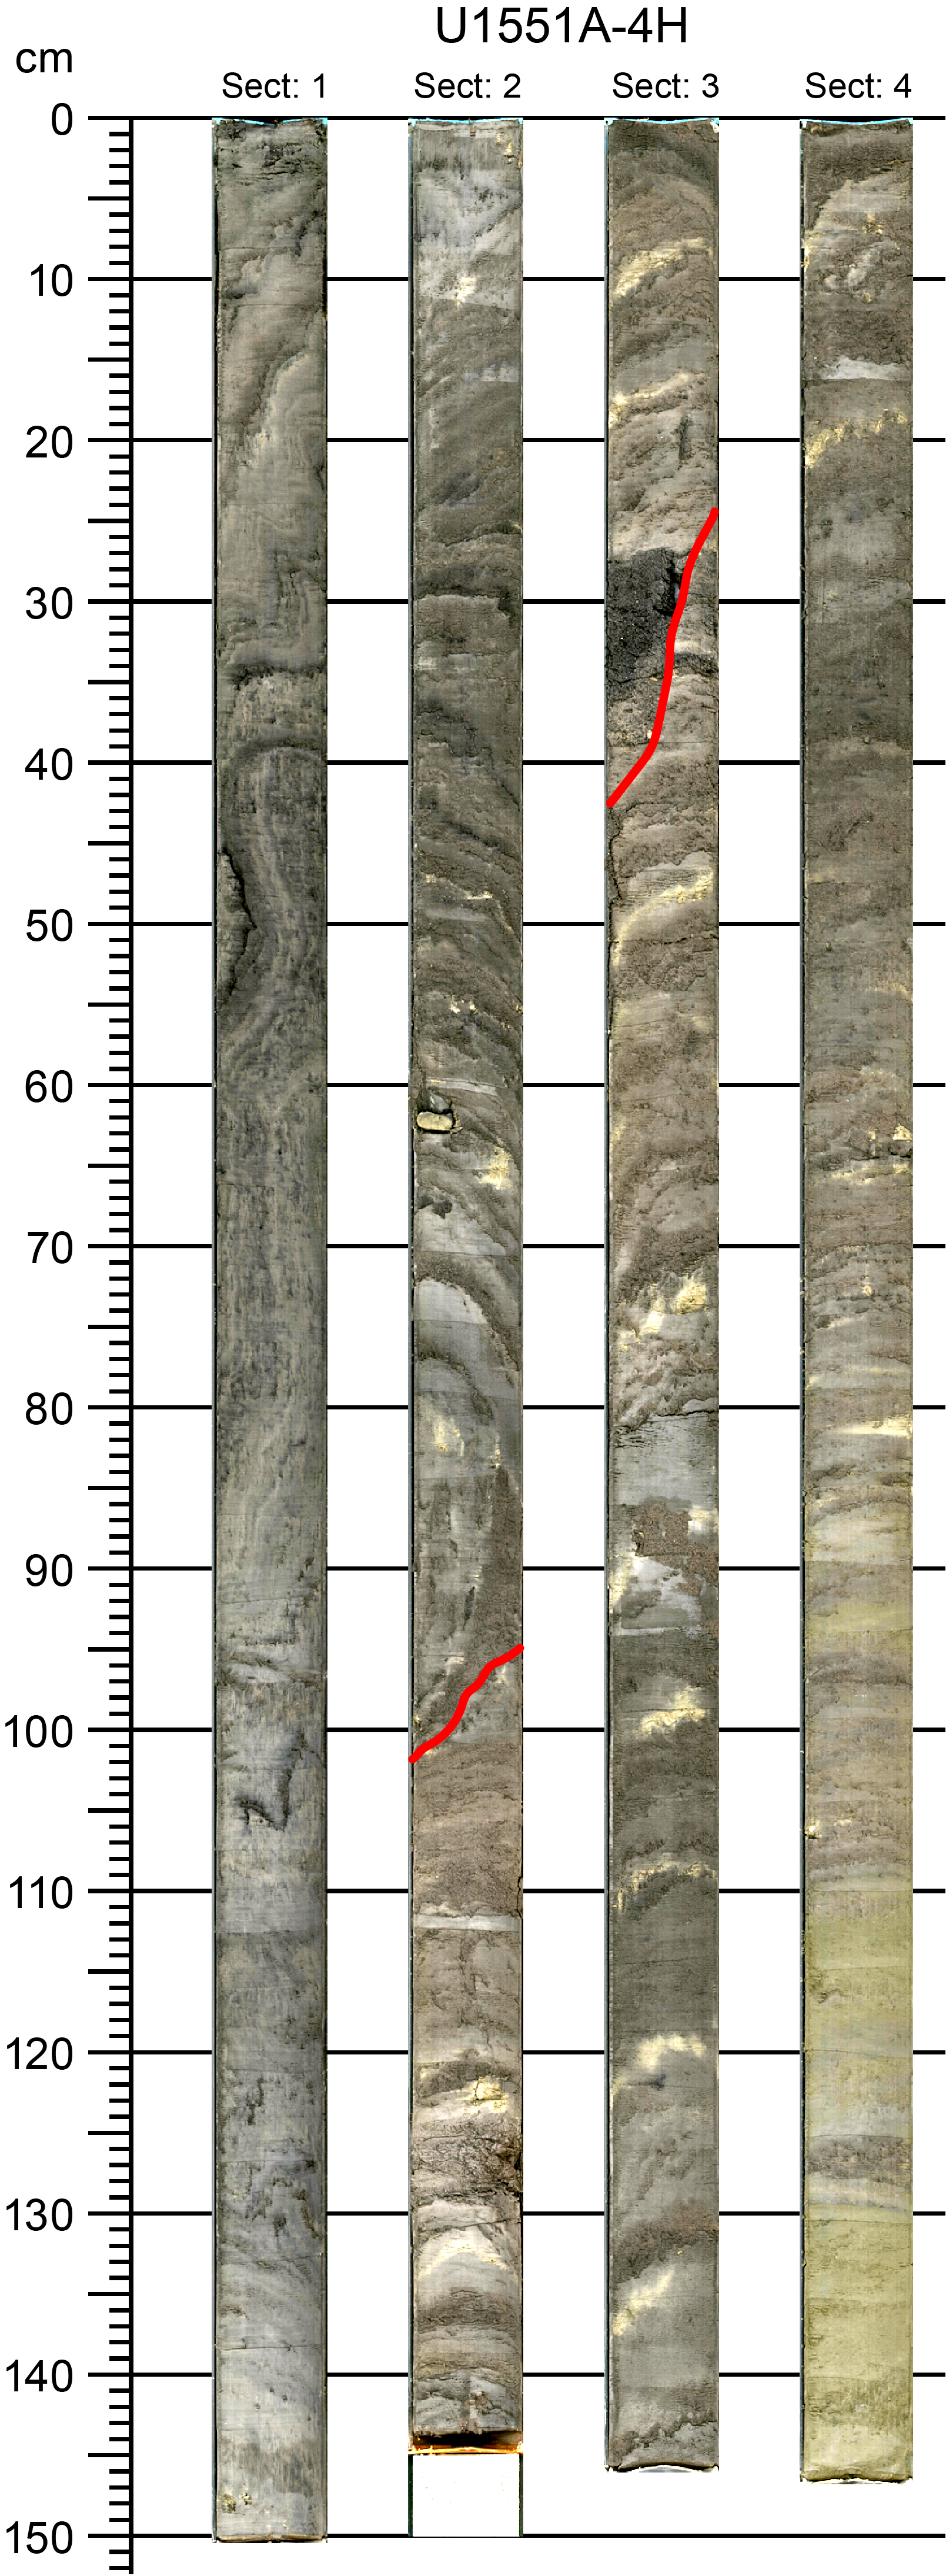
For the intervals of the lithologic record dominated by sand, coring-induced disturbances, specifically flow-in, are common phenomena (e.g., Core 6H in Holes U1551A and U1551B). These features raise questions about the actual distribution and relative abundance of this lithology, which might be overrepresented. However, some of the very thick and homogeneous sand beds locally contain coherent structures that are mainly visible in X-ray images, suggesting that they are still in place and were not artificially remobilized during coring (Figure F7). In the majority of these sand beds, centimeter- to several centimeters–thick basal layers are often normally graded with scoured basal contacts. These graded units are best seen where the sand beds are encased in more cohesive diatom-rich lithologies. Conversely, silty beds are normally limited to thinner intervals or the tops of fining-upward sandy beds.
Thick depositional units mark transitions between Subunits IA and IB (e.g., Cores 385-U1551A-3H and 2H) and between Subunits IB and IC (e.g., Cores 10H and 11H), suggesting that they may have been products of events associated with major changes of the Yaqui River pro-delta depositional system. The submarine morphology of the pro-delta slope (see Background and objectives) suggests that there has been significant mass wasting and channelization that could be responsible for the complexity of the stratigraphic succession at Site U1551. Although Site U1551 and the previously drilled Site U1549 share many similarities, Site U1551 contains greater proportions of siliciclastic (terrigenous) material. The homogeneous sandy facies recovered at this site are also different and unique compared to the sites previously drilled in the Guaymas Basin during Expedition 385. This can be directly related to the more proximal position of Site U1551 to the Yaqui River delta.
5. Structural geology
Holes U1551A and U1551B penetrated Lithostratigraphic Unit I, recovering a sedimentary sequence of diatom ooze, diatom clay, sand, and silt. The sequence corresponds to Lithostratigraphic Subunits IA–ID. All four subunits were encountered in Hole U1551A, which was drilled to 120.3 mbsf. Hole U1551B was drilled to 48.45 mbsf and only encountered Subunits IA and IB (Table T2).
For all cores, structures were measured and/or described, where present, from the archive-half or whole-round sections of the cores as well as their high-resolution archive-half section images. X-ray images were also used for Hole U1551A.
5.1. Sedimentary units
Structural information was obtained from sedimentary units in both holes at Site U1551. Hole U1551A was lithologically more complete and reached greater depth in the sedimentary section. In Hole U1551B, only six cores were drilled, and the sections removed for microbiological sampling were not available for structural/stratigraphic characterization or imaging.
Bedding and lamination in the recovered sediments and sedimentary rocks are similar to those described for Sites U1545–U1550. However, Site U1551 recovered intervals of massive sand. The lack of stratification in the sand layers implies that any deformation structures in those sections of the cores cannot be identified. In both sand and mud layers, many sections revealed so much drilling disturbance that bedding and lamination could not be recognized. The remaining stratified parts of the recovered sedimentary cores were examined carefully for faults, folds, and tilted bedding.
5.2. Folds
Folds are present in both holes at Site U1551, starting about 1 m below the depth of a very well correlated stratigraphic horizon of diatom ooze in Subunit IA (interval 385-U1551A-2H-2, 74–79 cm; 4.84–4.89 mbsf) (see Lithostratigraphy). This stratum and those above it are inferred to be horizontal and identical in the two holes. In Subunit IB, contortion and soft-sediment deformation produced steep to overturned bedding. This is first recognizable in intervals 385-U1551A-3H-3, 0 cm (15.1 mbsf), and 385-U1551B-3H-4, 0 cm (18.8 mbsf). The top of the folded sequence in Hole U1551B may be as shallow as 15 mbsf but was not observed because interval 3H-2, 63 cm, to 3H-4, 0 cm, was not available for study. The folding continues through Sections 385-U1551A-4H-1 and 4H-2. Contorted bedding and opposing directions of tilt in adjacent sections throughout Core 4H indicate that folding is still present. It must vary spatially or be displaced by faulting over a scale smaller than the distance between the two drill holes because of differences in the depth where it occurs. For example, Section 385-U1551B-4H-1 (23.6–25.3 mbsf) shows parallel laminae and no folding, whereas Sections 385-U1551A-4H-1 through 4H-4 (21.6–27.3 mbsf) are strongly folded and contorted. At deeper levels, folding is not prominent, although a fold is directly imaged as a sigmoidal shape in interval 12H-4, 110–130 cm (~85 mbsf).
Soft-sediment deformation was also caused by the coring process, producing shear adjacent to the core liner. In an extreme case, the shear may affect the entire diameter of the core, resulting in folds coaxial with the core (e.g., interval 385-U1551A-8H-2, 20–70 cm). Because these are inferred to be caused by drilling, they are not included as structures in the database.
5.3. Brittle fractures and faults
In both holes at Site U1551, identified faults were measured on the split core surfaces of archive-half sections. In Hole U1551A, faults were seen in Cores 4H and 5H cutting the folded strata (Figure F8). These faults are planar and therefore postdate the folding. They comprise a single set of faults with subparallel orientations and apparent dips of 45°–70° in Cores 4H and 5H. Earlier faults in the slumped strata, if present and folded, are not likely to have been recognized. Faults at deeper levels were found in some locations, such as in Section 10H-4 at about 66 mbsf (Figure F9). As usual, the strikes of these faults are not known because the geographic direction relative to the core axis could not be constrained.
The differences in depths characterizing the folded strata in Holes U1551A and U1551B may have been partly caused by faulting prior to the deposition of Subunit IA. No faulting is inferred in Subunit IA at Site U1551 based on the stratigraphic similarity between the two drill holes.
6. Biostratigraphy
Smear slides of toothpick samples from core catcher sections of Hole U1551A (2.62–116 mbsf) were taken and analyzed for calcareous nannofossils and marine diatoms to determine any existent biostratigraphic events. One toothpick sample from Core 385-U1551A-19F (the last core recovered in Hole U1551A) was taken to confirm the age of the sediment at the bottom of the hole (Table T3).
No biostratigraphic datum was defined in the generally continuous succession from the Holocene to the middle Pleistocene (Table T4). The occurrence of E. huxleyi at the bottom of the hole dates the entire sediment sequence of Hole U1551A to Holocene or late to middle Pleistocene, or younger than 0.29 Ma (0–119.01 mbsf). This age assignment is consistent with the absence of P. lacunosa (LAD = 0.44 Ma) and F. reinholdii (LAD = 0.62 Ma) in all samples examined. The estimated average sedimentation rate is greater than 410.4 m/My (>41.04 cm/ky) (Figure F10).
6.1. Calcareous nannofossils
Calcareous nannofossil abundance varies from abundant to barren throughout the entire sampled sequence at Site U1551. Nannofossils are abundant and common from the top of the sampled sequence through Section 385-U1551A-2H-CC (12.39 mbsf) and then dramatically decrease to few/barren in the sand-dominated intervals in Cores 3H–19F (21.95–120.36 mbsf). Preservation of calcareous nannofossils is good/moderate when the sample was taken from a predominantly clay-rich interval and moderate/poor when sampled from a sandy unit (Table T3).
Reworked Cretaceous and Miocene taxa are present throughout Hole U1551A. The origin of reworked nannofossils is uncertain, although possible provenance areas may be represented by eroded Cretaceous outcrops in the Colorado River catchment, Cretaceous chalk strata underlying the Sierra Madre Occidental mountain range, and Miocene marine deposits on Isla Tiburón (McDougall and Martínez, 2014; Helenes et al., 2009). The source and environmental implications of reworking will be analyzed in detail during postexpedition research.
The sediment sequence in Hole U1551A is assigned to Nannofossil Zone NN21 based on the presence of E. huxleyi in all samples obtained from the hole. The corresponding nannofossil biostratigraphic datum, namely, the first appearance of E. huxleyi (0.29 Ma), was, however, estimated to be present below the bottom of the recovered sediment sequence in Hole U1551A (Table T3), indicating a deposition age younger than 0.29 Ma for the entire sediment sequence of Hole U1551A.
6.2. Diatoms
Marine diatoms are abundant with good preservation only in the uppermost part of Hole U1551A, in Section 1H-CC at 2.6 mbsf. Common and few diatom occurrences coinciding with moderate to poor preservation characterize the upper sediment column in Sections 2H-CC (12.37 mbsf) through 4H-CC (31.17 mbsf). Diatoms are generally barren in Sections 5H-CC (36.93 mbsf) through 9H-CC (61.25 mbsf) (Table T5), except at 43.8 mbsf, where rare diatoms were found. Farther downcore, diatoms recover again and vary from common to rare, with moderate to poor preservation, in Sections 10H-CC (71.03 mbsf) through 13H-CC (96.78 mbsf). Farther downhole, diatoms remain rare with poor preservation in Sections 14H-CC and 15H-CC (102.17–108.31 mbsf). They are barren below 110 mbsf in Sections 16F-CC (110.08 mbsf) through 18F-CC (116.17 mbsf) (Table T5). Corresponding to the change in lithology (see Lithostratigraphy), diatoms were found to be abundant but poorly preserved in Sample 19F-3, 10 cm (119.01 mbsf), which was taken from the last core retrieved from Hole U1551A (see photomicrograph Plate 9 in DIATOMS in Supplementary material for decreasing diatom preservation with increasing degree of diagenesis based on documentation from Holes U1545A and U1546A). No apparent diagenetic alteration of diatoms was found at the bottom of Hole U1551A.
In Hole U1551A, no age-diagnostic diatom species were found, indicating an age younger than 0.62 Ma, as indicated by the top/LAD of F. reinholdii (Table T5).
Samples with few, rare, and barren diatoms repeated at different depths at Site U1551, similar to Site U1550 but obviously different from Sites U1545–U1548, which were barren of diatoms only at the bottom of the holes. This changing variation pattern of diatom abundance and preservation in Hole U1551A might be related to the dominance of terrestrial sedimentation, via gravity flows, over marine sedimentation and to associated disruption of the marine sedimentary record (see Lithostratigraphy).
7. Paleomagnetism
Paleomagnetic shipboard measurements consisted of the analysis of the natural remanent magnetization (NRM) and its demagnetization on archive-half sections and discrete samples from Hole U1551A to establish a magnetostratigraphy of the site. Representative discrete samples were collected from APC and HLAPC cores (one sample per core when possible). No paleomagnetic measurements were conducted for Hole U1551B.
7.1. Archive-half section analysis
NRM was measured on all sections from Hole U1551A (Cores 1H–19F). All archive-half sections from Hole U1551A containing fine-grained sediment were demagnetized at 5 cm intervals up to 20 mT. Sections with sand only were not demagnetized because of random grain orientation. Paleomagnetic measurements for Hole U1551B were not conducted for the same reasons as at previous sites: (1) a discontinuous record of the archive-half sections because of sampling for microbiology and geochemistry and (2) the absence in the paleomagnetic record of excursions and reversals (see Magnetostratigraphy). Furthermore, Hole U1551B consisted of only six cores.
In-line AF demagnetization of archive-half sections from Hole U1551A indicates a drilling overprint (steep inclination) that was removed by an AF demagnetization treatment of 5–10 mT (Figure F11A). Before demagnetization, negative inclinations are found at ~40–60 and ~92–106 mbsf (Figure F11A). These depth intervals correspond to thick unconsolidated sand layers (see Lithostratigraphy; also see the visual core descriptions [VCDs] in Core descriptions) where grains are randomly oriented. After AF demagnetization at 20 mT, inclination values for APC and HLAPC cores, excluding sand-only sections (data not shown), cluster around an average value of 47°, which is comparable to the expected GAD inclination value at the latitude of the site (~45.8°) (Figure F11B).
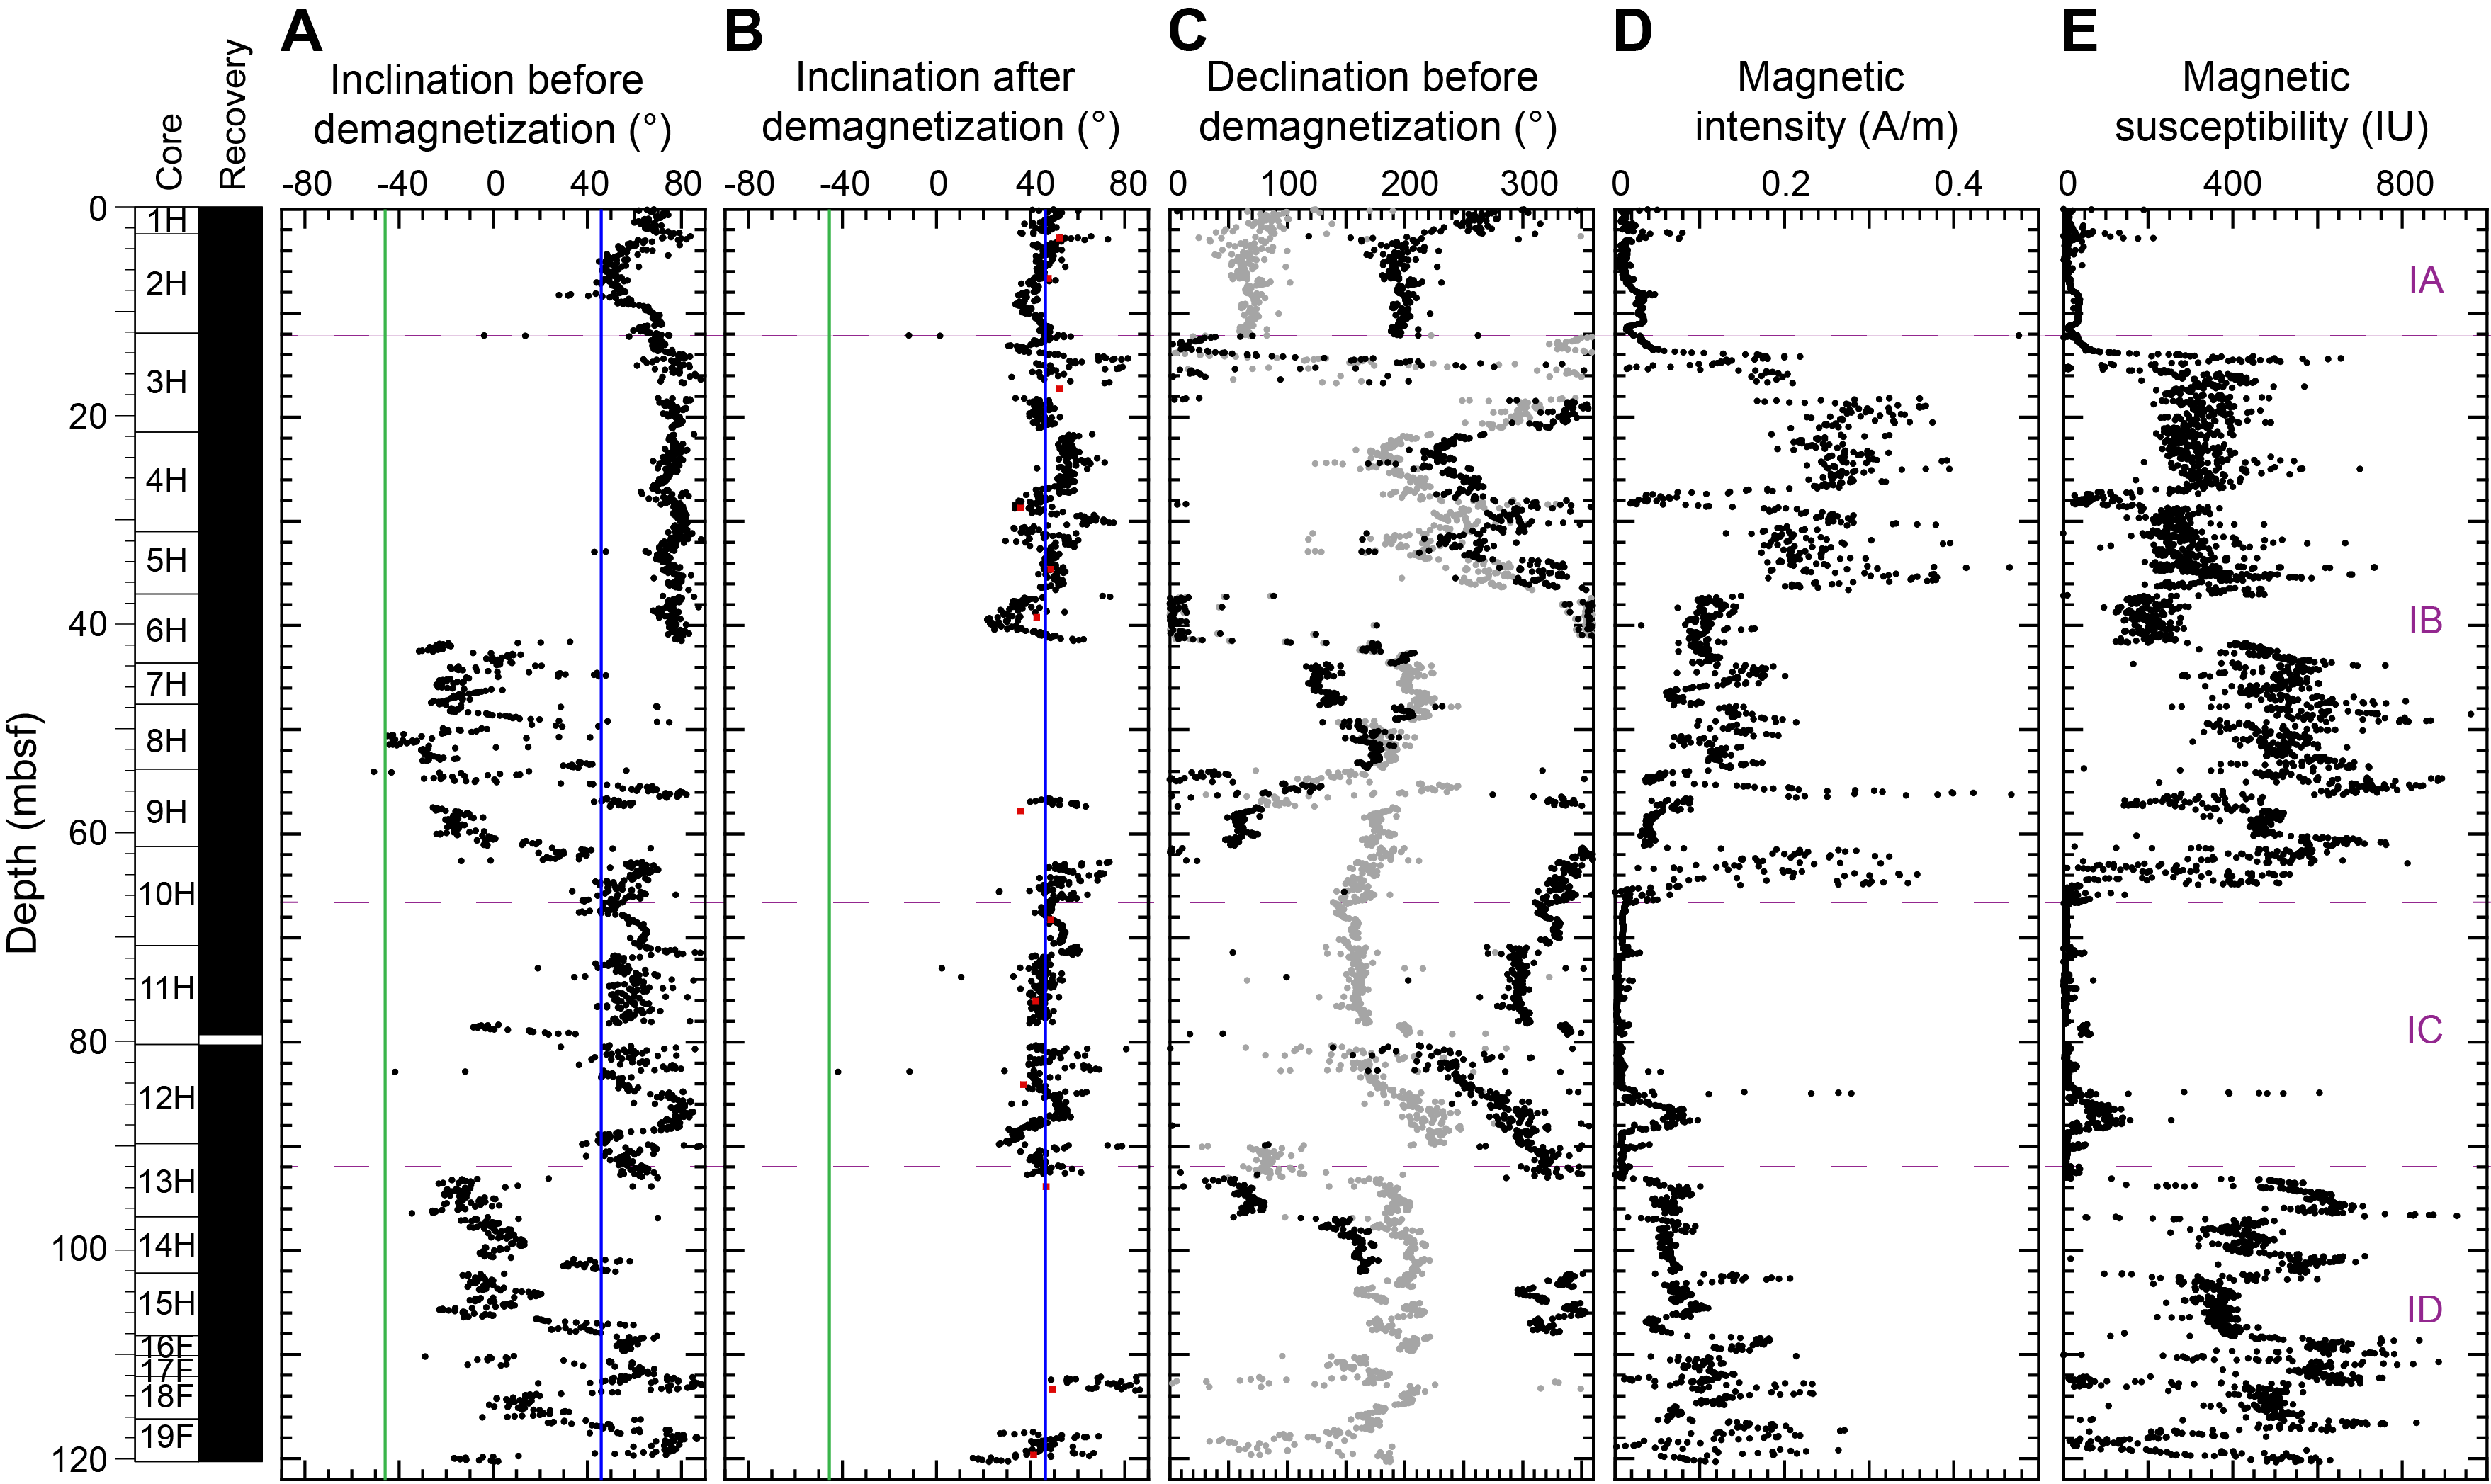
Magnetic intensity in Hole U1551A sediments varies according to the lithology. In fine-grained sediments, magnetic intensity is generally <0.05 A/m (Figure F11D), which is similar to the other sites drilled during Expedition 385 (see Paleomagnetism in the Site U1545, Site U1546, Sites U1547 and U1548, Site U1549, Site U1550, and Site U1552 chapters [Teske et al., 2021b, 2021c, 2021d, 2021e, 2021f, 2021g]). Higher magnetic intensity values up to 0.5 A/m are found in coarser sandy intervals (e.g., at ~15–62 mbsf) (see Lithostratigraphy; also see the VCDs in Core descriptions). Intervals of higher (lower) magnetic intensity are mirrored in the point magnetic susceptibility (MSP) downhole profile (Figure F11E). Similar to Sites U1549 and U1550, no decrease of magnetic intensity related to the occurrence of a SMTZ is observed in shallow cores.
7.2. Discrete sample analysis
For a more detailed study of the remanence in Hole U1551A, discrete samples were taken from the working-half sections of Cores 1H–19F at intervals of one discrete sample per APC and HLAPC core where fine-grained intervals are present. No discrete samples were taken from recovered unconsolidated sand.
Remanence measurements were made using an AGICO JR-6A spinner magnetometer on a total of thirteen 8 cm3 cube samples (see Figure F21 in the Expedition 385 methods chapter [Teske et al., 2021a]). All of these samples were demagnetized using a stepwise-increasing AF to isolate the ChRM direction using principal component analysis (PCA) (Kirschvink, 1980). No samples were thermally demagnetized because all discrete samples were taken using plastic sampling boxes.
NRM intensities vary between 3.62 × 10⁻³ and 1.34 × 10⁻¹ A/m with a mean intensity of 3.87 × 10⁻² A/m (Table T6). AF demagnetization was done up to 60 mT, by which level the samples had lost more than 90% of their total magnetization (Figure F12B). Representative demagnetization diagrams (Zijderveld, 1967) are shown in Figure F12A. All reported declination and inclination data are shown in the sample coordinate reference frame. However, because cores are free to rotate in the core barrel, only the inclination data are taken into account for interpretation. Two magnetic components can be identified on the demagnetization diagrams for each discrete sample (Figure F12A). The first component is removed by an AF demagnetization treatment of 5–10 mT and corresponds to a drilling overprint. The second component is stable and points toward the origin. This component is of normal polarity for all analyzed discrete samples. The median destructive field ranges from 3.3 to 24.3 mT with a mean of 12.0 mT, comparable to results obtained from previous sites during this expedition. This suggests a magnetic mineral assemblage dominated by low-coercivity (titano)magnetite.
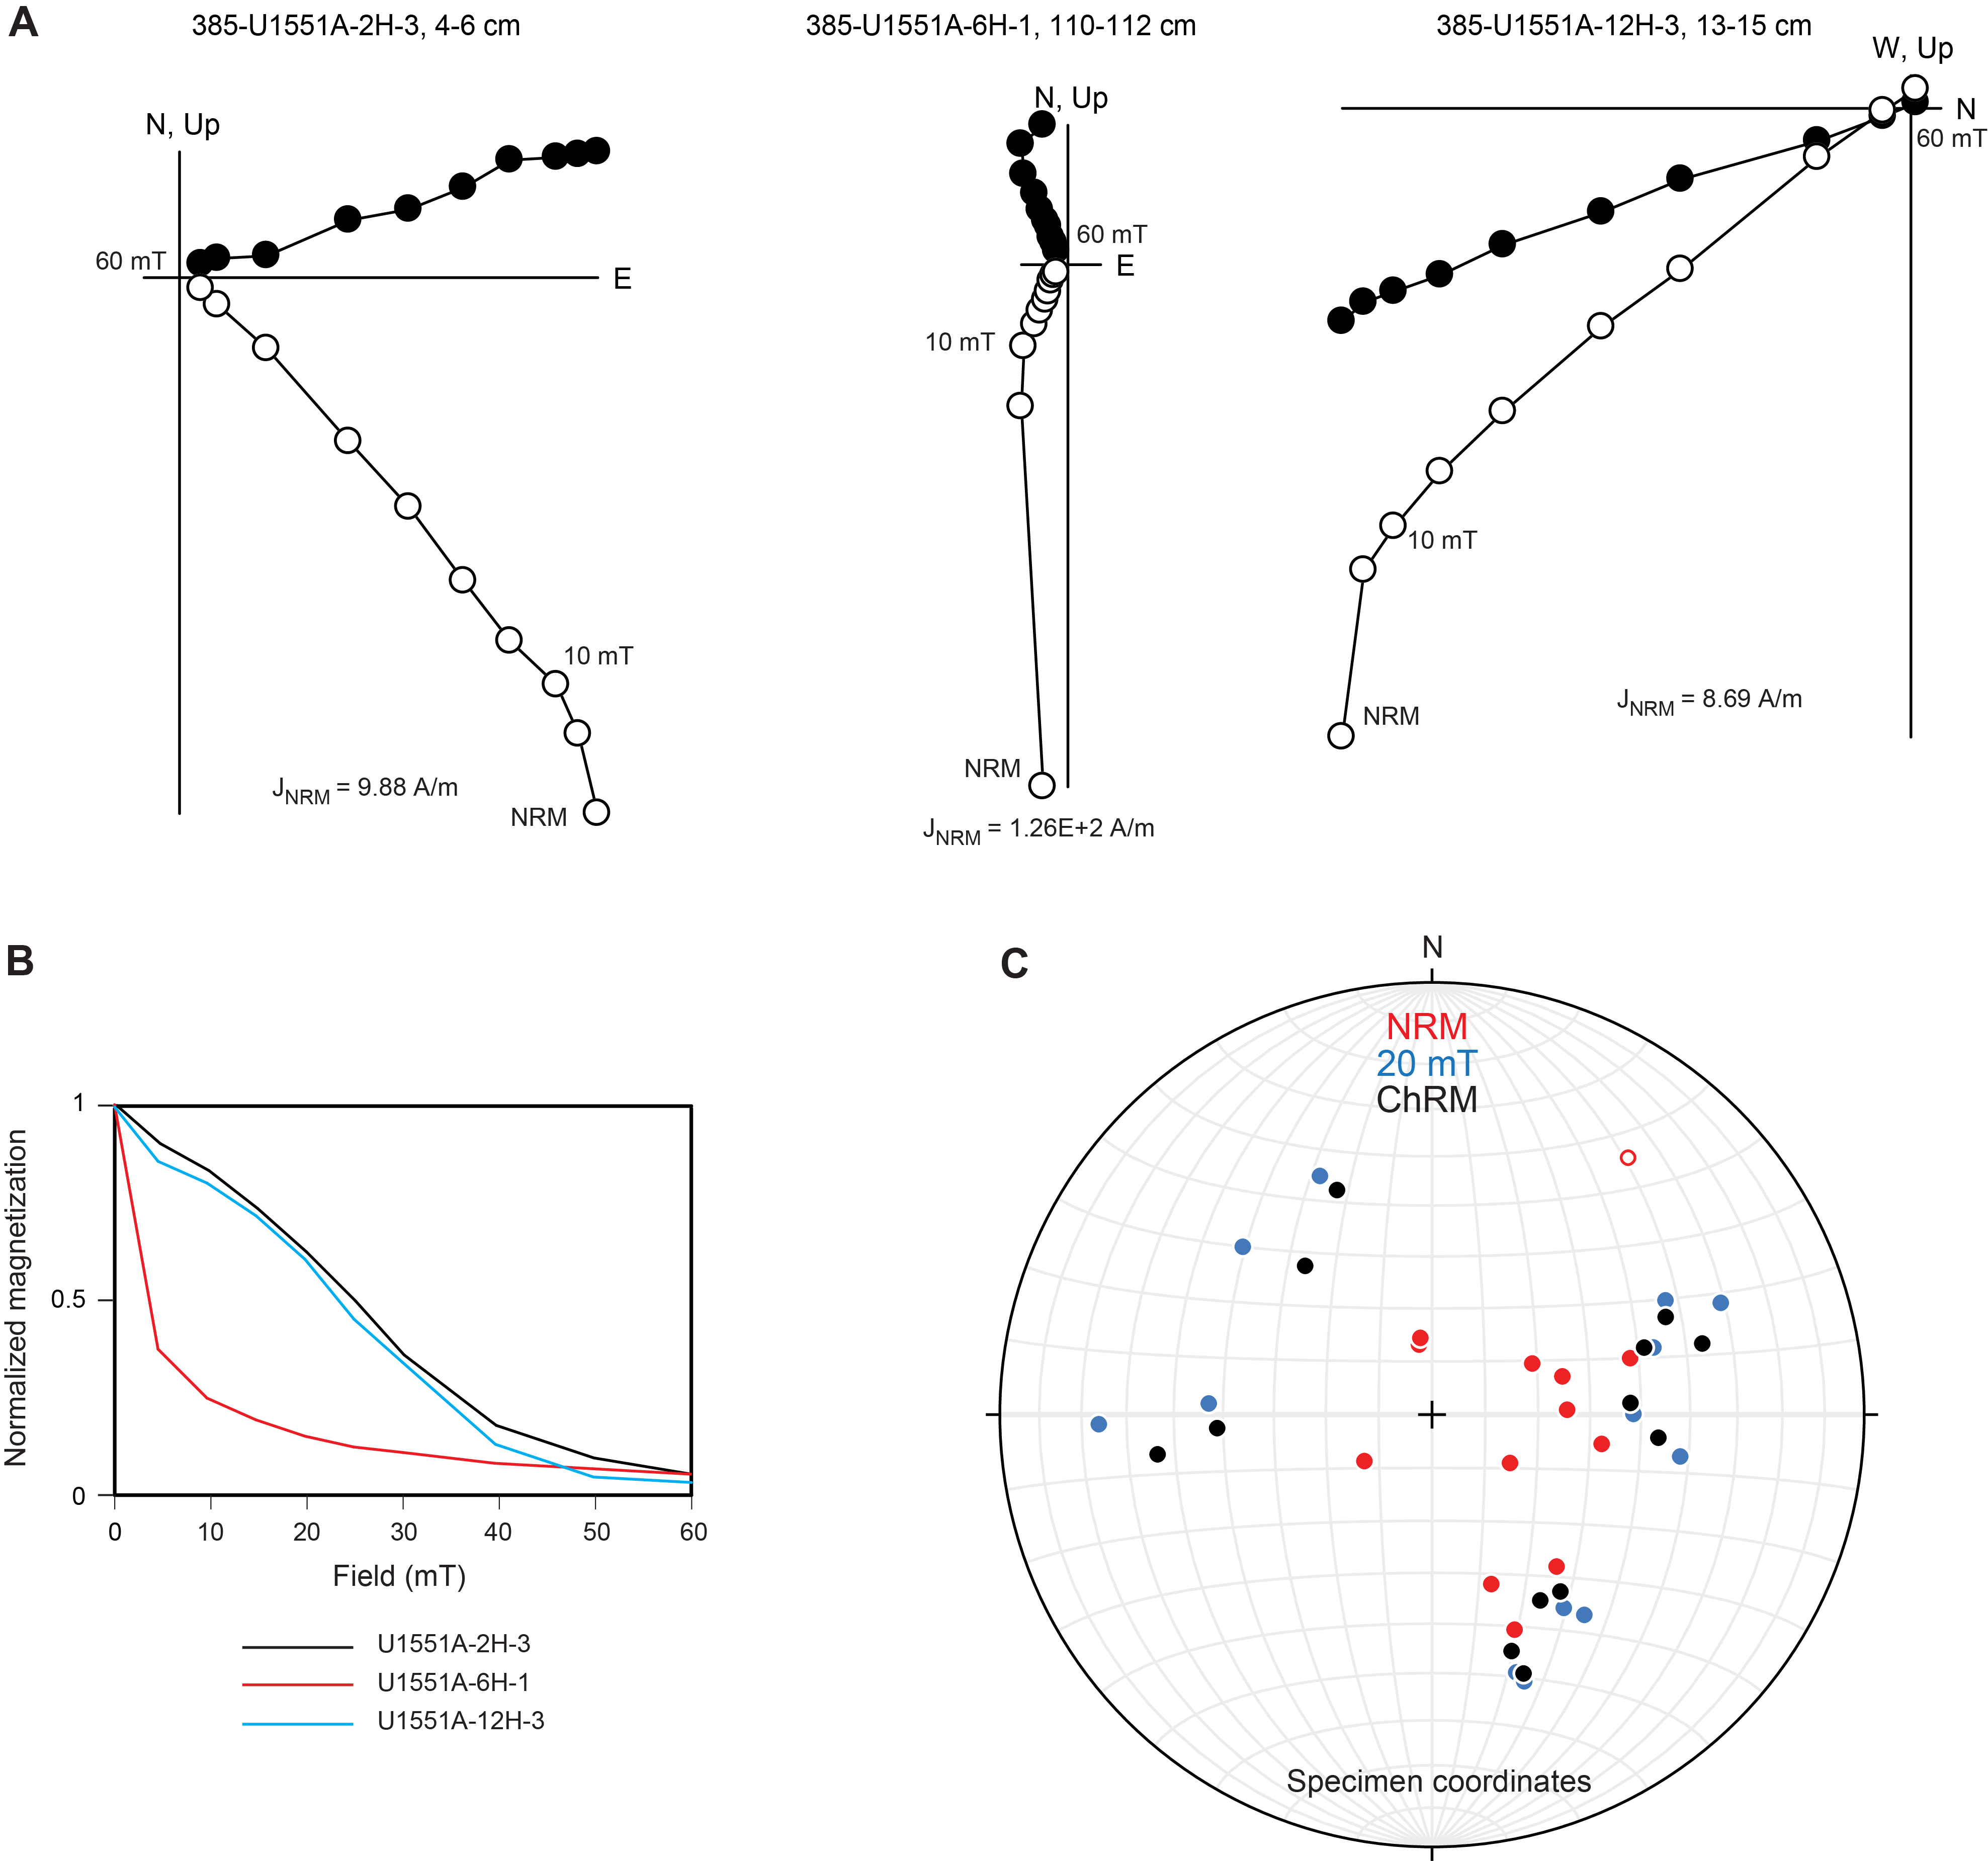
The distributions of the inclinations of the NRM and ChRM of all discrete samples are shown in Figure F12C. NRM inclinations range from −26.1° to 76.3° with a mean of 56.5° (Figure F12C). Demagnetization at 20 mT brings the inclinations to a shallower average of 39.9°, ranging between 23.6° and 51.8°. Upon implementing PCA, a mean inclination for the ChRM was calculated using the maximum likelihood method of Arason and Levi (2010) (Table T7). The calculated mean inclination for the ChRM results in 44.86°, which is close to the GAD inclination expected at this location (~45.8°).
7.3. Anisotropy of magnetic susceptibility
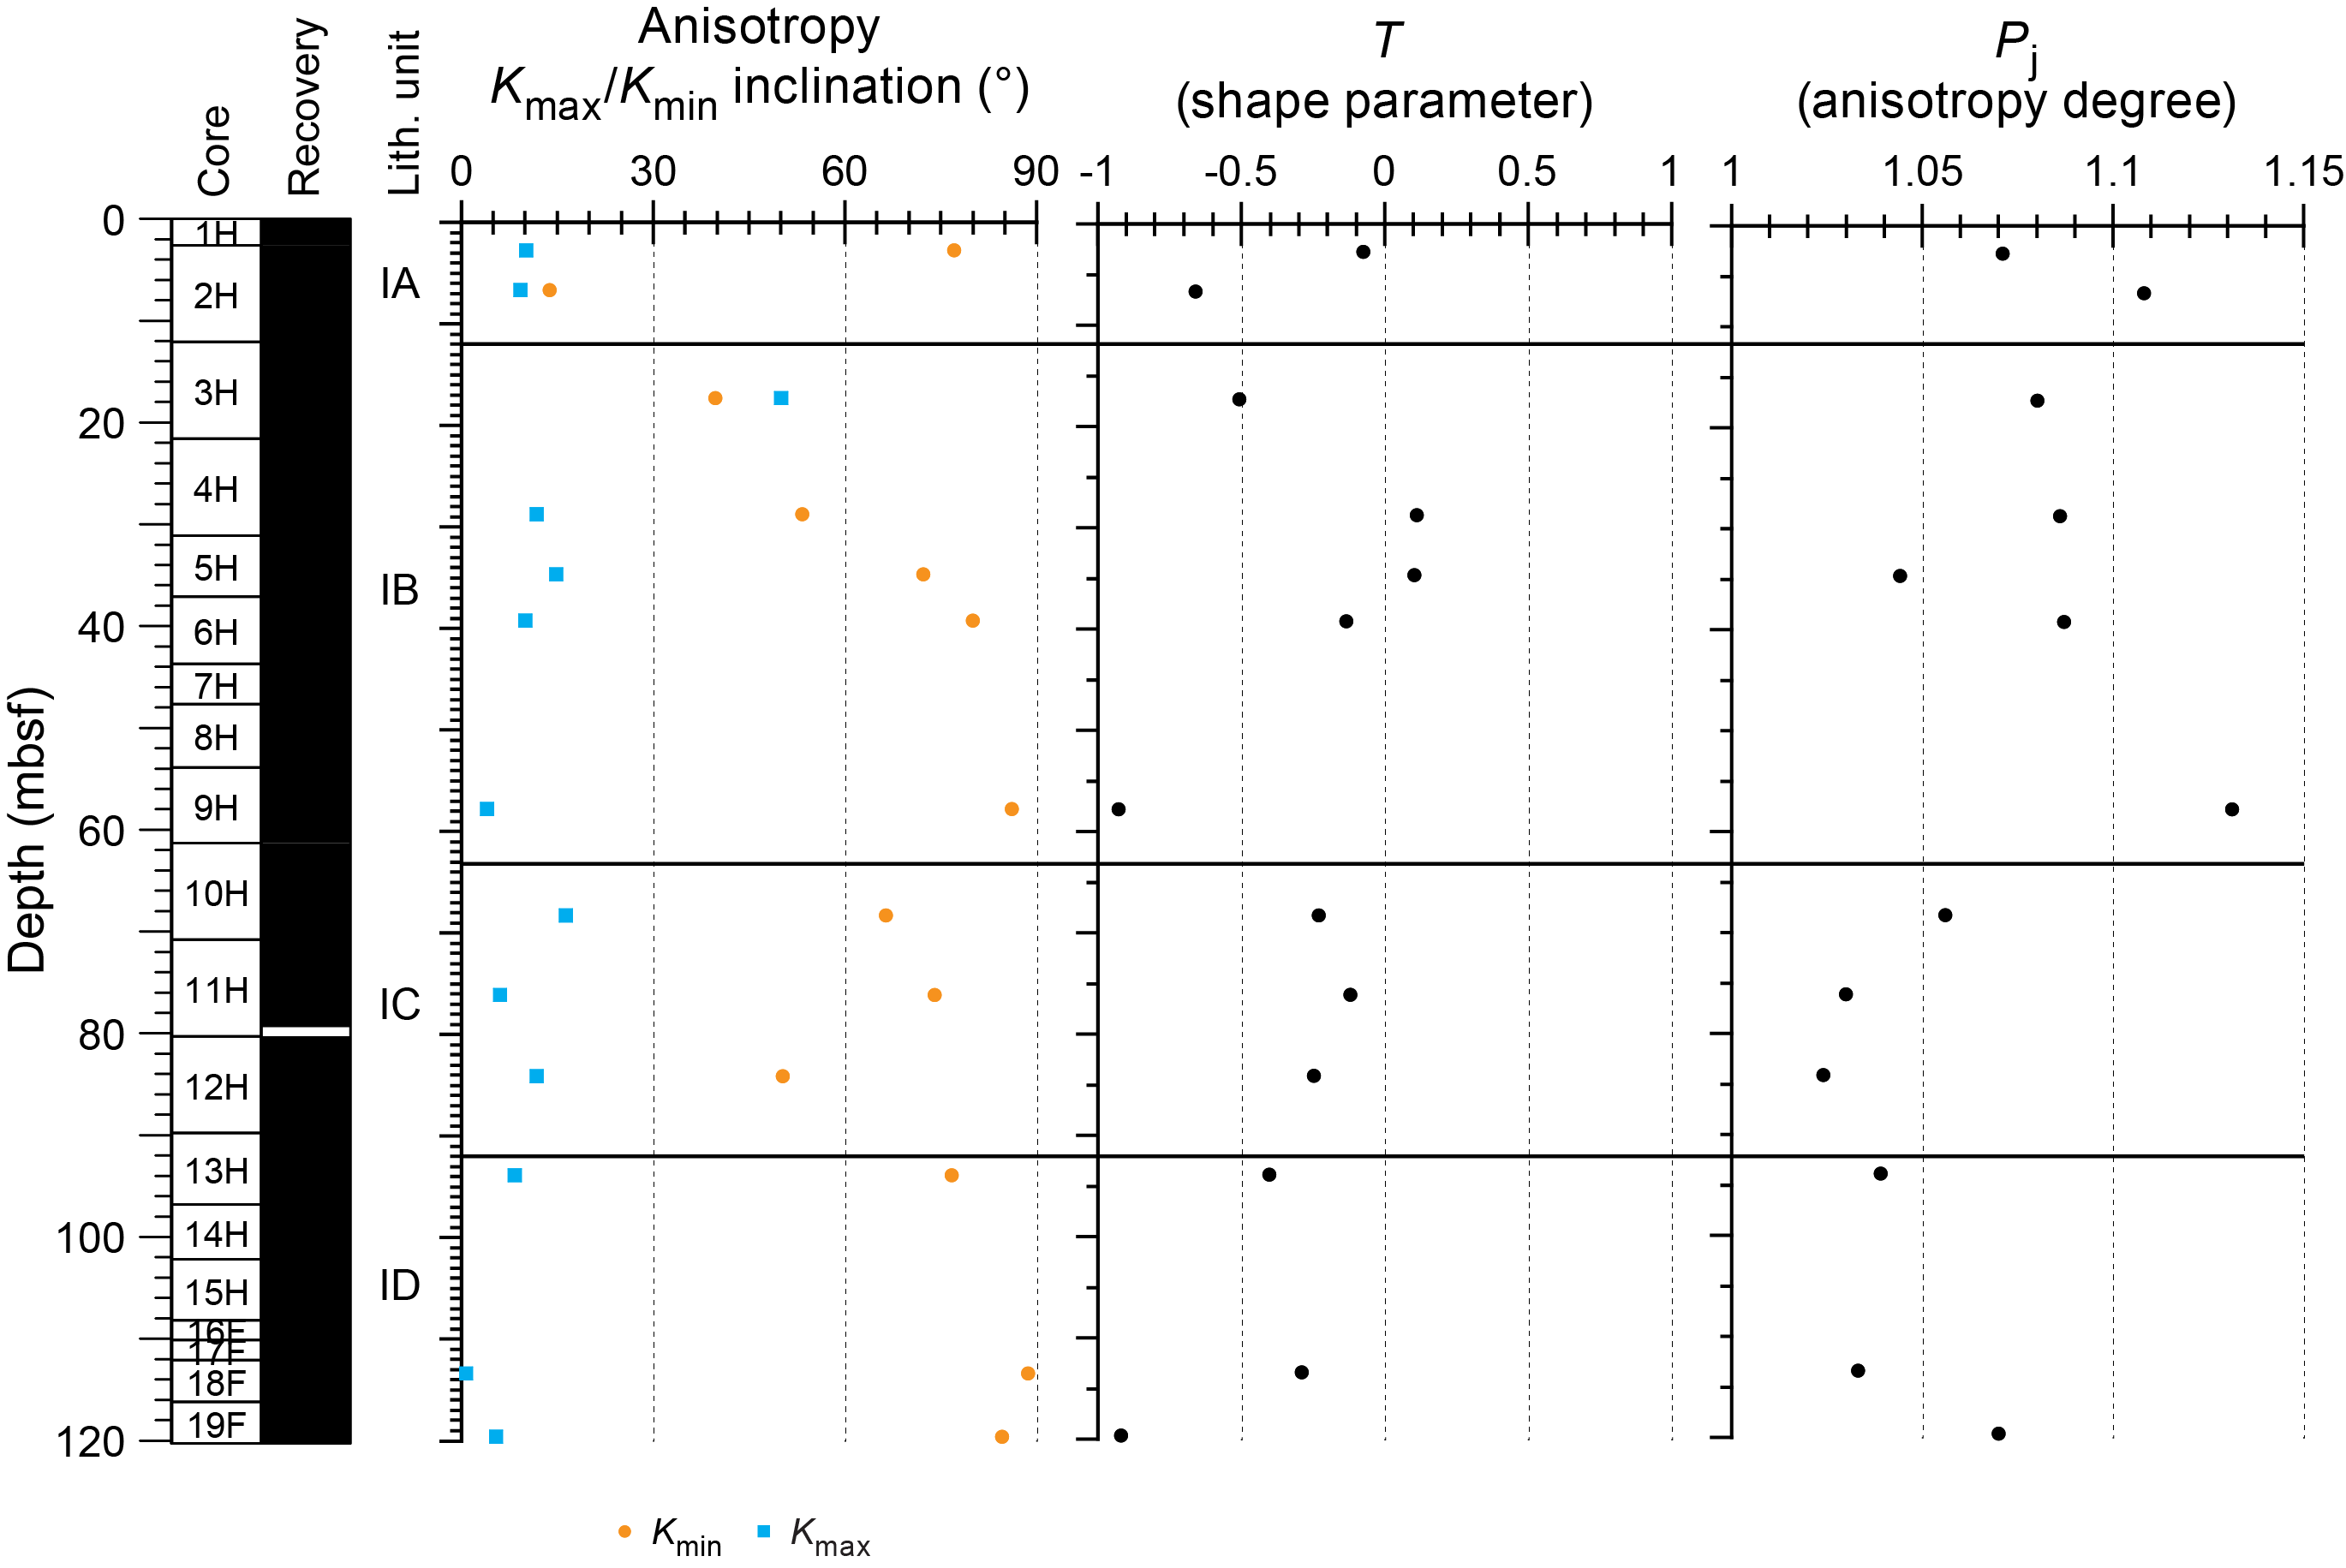
Anisotropy of magnetic susceptibility was measured for all discrete samples from Site U1551 prior to demagnetization to characterize the magnetic fabrics present in the samples. Results for sediments from Hole U1551A are shown in Figure F13 in the core reference frame. Because these results are unoriented, it is not possible to determine whether there is a preferred magnetic lineation in these rocks; therefore, only the inclination of the anisotropy is taken into account. Sedimentary samples taken in these holes predominantly show prolate behavior throughout the hole; Kmax (maximum) principal axes are distributed in the horizontal plane, and Kmin (minimum) principal axes are oriented perpendicular to the sedimentary bedding.
7.4. Magnetostratigraphy
We used the SRM measurements on archive-half sections to determine the polarity at Site U1551. We based our interpretation of the magnetic polarity on the sign of inclination at the maximum AF demagnetization step of 20 mT (Figure F11B). All APC and HLAPC cores (385-U1551A-1H through 19F) show a positive inclination of ~47°. This is supported by the detailed discrete sample analysis (Table T6). Therefore, we assigned the cores to the normal Brunhes Chron (C1n; <0.78 Ma), which is in agreement with the biostratigraphic observations (see Biostratigraphy). No magnetic excursions during Chron C1n were identified, although previously published paleomagnetic results from DSDP Leg 64 Site 480 identified the Mono Lake and Laschamp magnetic polarity excursions at ~29–26 and ~51–49 ky before present (BP), respectively (Levi and Karlin, 1989).
8. Inorganic geochemistry
8.1. Interstitial water sampling
Sample preparation and squeezing were performed under laboratory atmosphere for Hole U1551A and under nitrogen atmosphere for Hole U1551B. The chemical composition of the IW is listed in Table T8, and all downhole profiles of elements are presented in Figure F14.

8.2. Interstitial water results
8.2.1. pH, salinity, chloride, and sodium
pH values range from 7.8 to 7.9. Salinity decreases from 35 to 32 in the uppermost 40 m and then has a constant value around 33–34 below this depth. Chloride (Cl−) concentration is constant with depth at around seawater values (551–554 mM). Sodium (Na+) shows no particular trend, and its concentration ranges between 460 and 480 mM.
8.2.2. Sulfate, sulfide, alkalinity, ammonium, phosphate, and bromide
Sulfate (SO42−) concentration decreases from 28 to <1 mM in the upper 23 m of the sediment column. Methane concentration increases markedly around 27 mbsf (>1 mM; see Organic geochemistry). Therefore, the SMTZ is located around 25 mbsf at this site (Figure F14). In Subunit IC, sulfate concentration is anomalously high for a given depth below the SMTZ: 10.5 mM in Section 385-U1551A-10H-2 (65 mbsf) and 2.8 mM in Section 11H-2 (74 mbsf). These elevated concentrations could be derived from contamination with seawater during APC coring due to the high permeability of penetrated sand layers, or they could result from in situ diffusion of seawater into the unconsolidated sand. Below 86 mbsf, sulfate concentration decreases again to <1 mM. Sulfide concentration (ΣH2S = S2 + HS− + H2S) exhibits two local maxima at 8 mbsf (328 µM in Hole U1551A and 115 µM in Hole U1551B) and 74 mbsf (439 µM in Hole U1551B).
Alkalinity and phosphate (PO43−) linearly increase from the seafloor to 23 mbsf to values around 32–36 and 300–374 µM, respectively, and then decrease toward the first significant sand layer. Alkalinity exhibits a slight increase from 65 to 93 mbsf in Hole U1551A. Ammonium (NH4+) concentration increases linearly from the seafloor to 35 mbsf, where it reaches 7.9–8.4 mM. Below 65 mbsf (Subunit IC), it ranges from 4.8 to 6.7 mM in Hole U1551A. Bromide (Br−) concentration ranges from 0.83 to 0.91 mM throughout Site U1551 without any observable trend.
8.2.3. Calcium, magnesium, potassium, and silica
Dissolved calcium (Ca2+) concentration decreases from 10.2 to 3–4 mM in the upper 23 m (Figure F14). This trend is generally caused by carbonate precipitation (2HCO3− + Ca2+ = CaCO3 + H2O + CO2), evidenced here by authigenic carbonates observed in this interval (see Lithostratigraphy). Below 65 mbsf, dissolved calcium has a narrow range of 3.3–4.2 mM in Hole U1551A. Dissolved magnesium (Mg2+) and potassium (K+) concentrations decrease in the first 40 mbsf from 52 to 41 mM and from 10.9 to 8.9 mM, respectively. Their concentrations then remain around 50 and 10 mM, respectively, below 65 mbsf. Dissolved silica (expressed in solution as H4SiO4) varies between 621 and 884 µM downhole.
8.2.4. Manganese and iron
Manganese (Mn = Mn2+ + Mn4+) concentration decreases from 100 to <1 µM in the upper 23 m of the sedimentary sequence (Figure F14), reflecting the reduction of manganese oxides during organic matter mineralization in the upper part of the sediment column and the precipitation of Mn2+ below this depth. Below this interval, Mn concentrations remain consistently low (<2 µM) except for two excursions around 73 (8.2 µM) and 93 mbsf (10.2 µM) in Hole U1551A.
Iron (Fe = Fe2+ + Fe3+) concentration increases in the uppermost 40 m to 60 µM in Hole U1551B (sediment trimmed under N2 atmosphere) and remains between 7 and 35 µM below the first sand layer in this hole. In Hole U1551A, concentrations are lower, probably due to trimming under laboratory atmosphere, leading to a rapid oxidation of Fe and precipitation as ferric iron compounds.
8.2.5. Boron, lithium, strontium, and barium
Boron (B; dissolved as borate; B[OH]4−) ranges between 450 and 580 µM with no distinct trend. Lithium (Li+) decreases in the upper 23 m from 20 to <3 µM and then displays a downhole increase that is interrupted by the sand layers. Strontium (Sr2+) concentration is constant to 15 mbsf at around 86–87 µM (seawater values) and then increases to 107–122 µM at 24–27 mbsf. Below 60 mbsf, it remains between 109 and 123 µM. Barium (Ba2+) concentration is below the detection limit from the seafloor to 18 mbsf and then increases below the SMTZ to 7 µM. Its value is very low again at the beginning of Subunit IC and increases again to 21 µM around 74 mbsf.
8.3. Concluding remarks
The number of meaningful IW samples is limited because it was hard to extract IW from unconsolidated sand layers and it could be contaminated by drilling fluids. Therefore, it is difficult to decipher the specific geochemical and lithologic factors that control the IW properties at Site U1551. However, as evidenced by nearly complete sulfate depletion coinciding with concentration peaks for dissolved sulfide, as well as methane and alkalinity (as high as 32–36 mM), the SMTZ was identified at ~25 mbsf at Site U1551 (Figure F14). Authigenic carbonate precipitation is also visually observed at Site U1551 at and below 19 mbsf (see Lithostratigraphy), and these depth intervals coincide with a sharp decrease in Ca2+ concentrations.
9. Organic geochemistry
At Site U1551, organic geochemists performed sampling and analysis of gas and solid-phase samples. For Hole U1551A, one headspace gas sample was analyzed per 9.5 m of core for routine hydrocarbon safety monitoring and the carbon, nitrogen, and sulfur contents of particulate sediment were characterized. For Hole U1551B, hydrocarbon analyses on headspace gas were performed at high resolution (two per 9.5 m core); H2 and CO contents were measured; carbon, nitrogen, and sulfur contents of sediment were characterized; and a comprehensive suite of gas and sediment samples for postexpedition analyses was taken.
9.1. Solid-phase carbon, nitrogen, and sulfur contents
Solid-phase sediment samples were analyzed to determine the weight percent of CaCO3, total organic carbon (TOC), total nitrogen (TN), and total sulfur (TS). For Holes U1551A and U1551B, the sampling frequency was approximately one sample per 9.5 m core (Table T9). For Hole U1551A, the core description team selected samples from primary and secondary sedimentary components, whereas for Hole U1551B, material was subsampled from the community gas (COMGAS) whole-round core for correlation to other biogeochemical data to be generated during shore-based analyses. Trends observed in Holes U1551A and U1551B are combined for discussion below.
At Site U1551, CaCO3 content varies around 10 wt% in the uppermost diatom ooze (Figure F15) and decreases to ~5 wt% in the dominant silty sand to clayey silts. One sample in a sand layer (Sample 385-U1551A-8H-3, 50–51 cm) has CaCO3 content below the detection limit, and a micrite-rich layer (Sample 12H-2, 67–68 cm) has 28 wt% CaCO3. TOC values vary between 2.6 and 3.6 wt% in the uppermost diatom ooze and decrease rapidly to values lower than 0.8 wt% in the silty sand to clayey silts. Below this interval, samples mostly originate from diatom ooze and show TOC values fluctuating between 1.4 and 2.0 wt%. The TOC/TN value is ~9 in the uppermost diatom ooze and ~11 in the lower diatom ooze. These ratio values are similar to those observed in the diatom ooze at the other drill sites. From 6 to 57 mbsf, the TOC/TN values progressively decrease to a minimum of 0.7, and the lowest values in this interval are associated with silty sand to clayey silts. These low TOC/TN values may indicate the dominance of organic matter derived from algal biomass in the studied sediment (Meyers, 1994). However, TOC/TN values lower than 6 are rarely observed in the settling material of the Guaymas Basin (Thunell, 1998). In addition, although TN content and TOC are linearly correlated in both Holes U1551A and U1551B, the correlation line has a positive intercept at 0.1% N, which indicates the presence of nitrogen in the mineral phase of the low-TOC samples. Therefore, the TOC/TN values of the low-TOC samples mainly corresponding to the silty sand to clayey silts cannot be used for determining the origin of the organic matter.
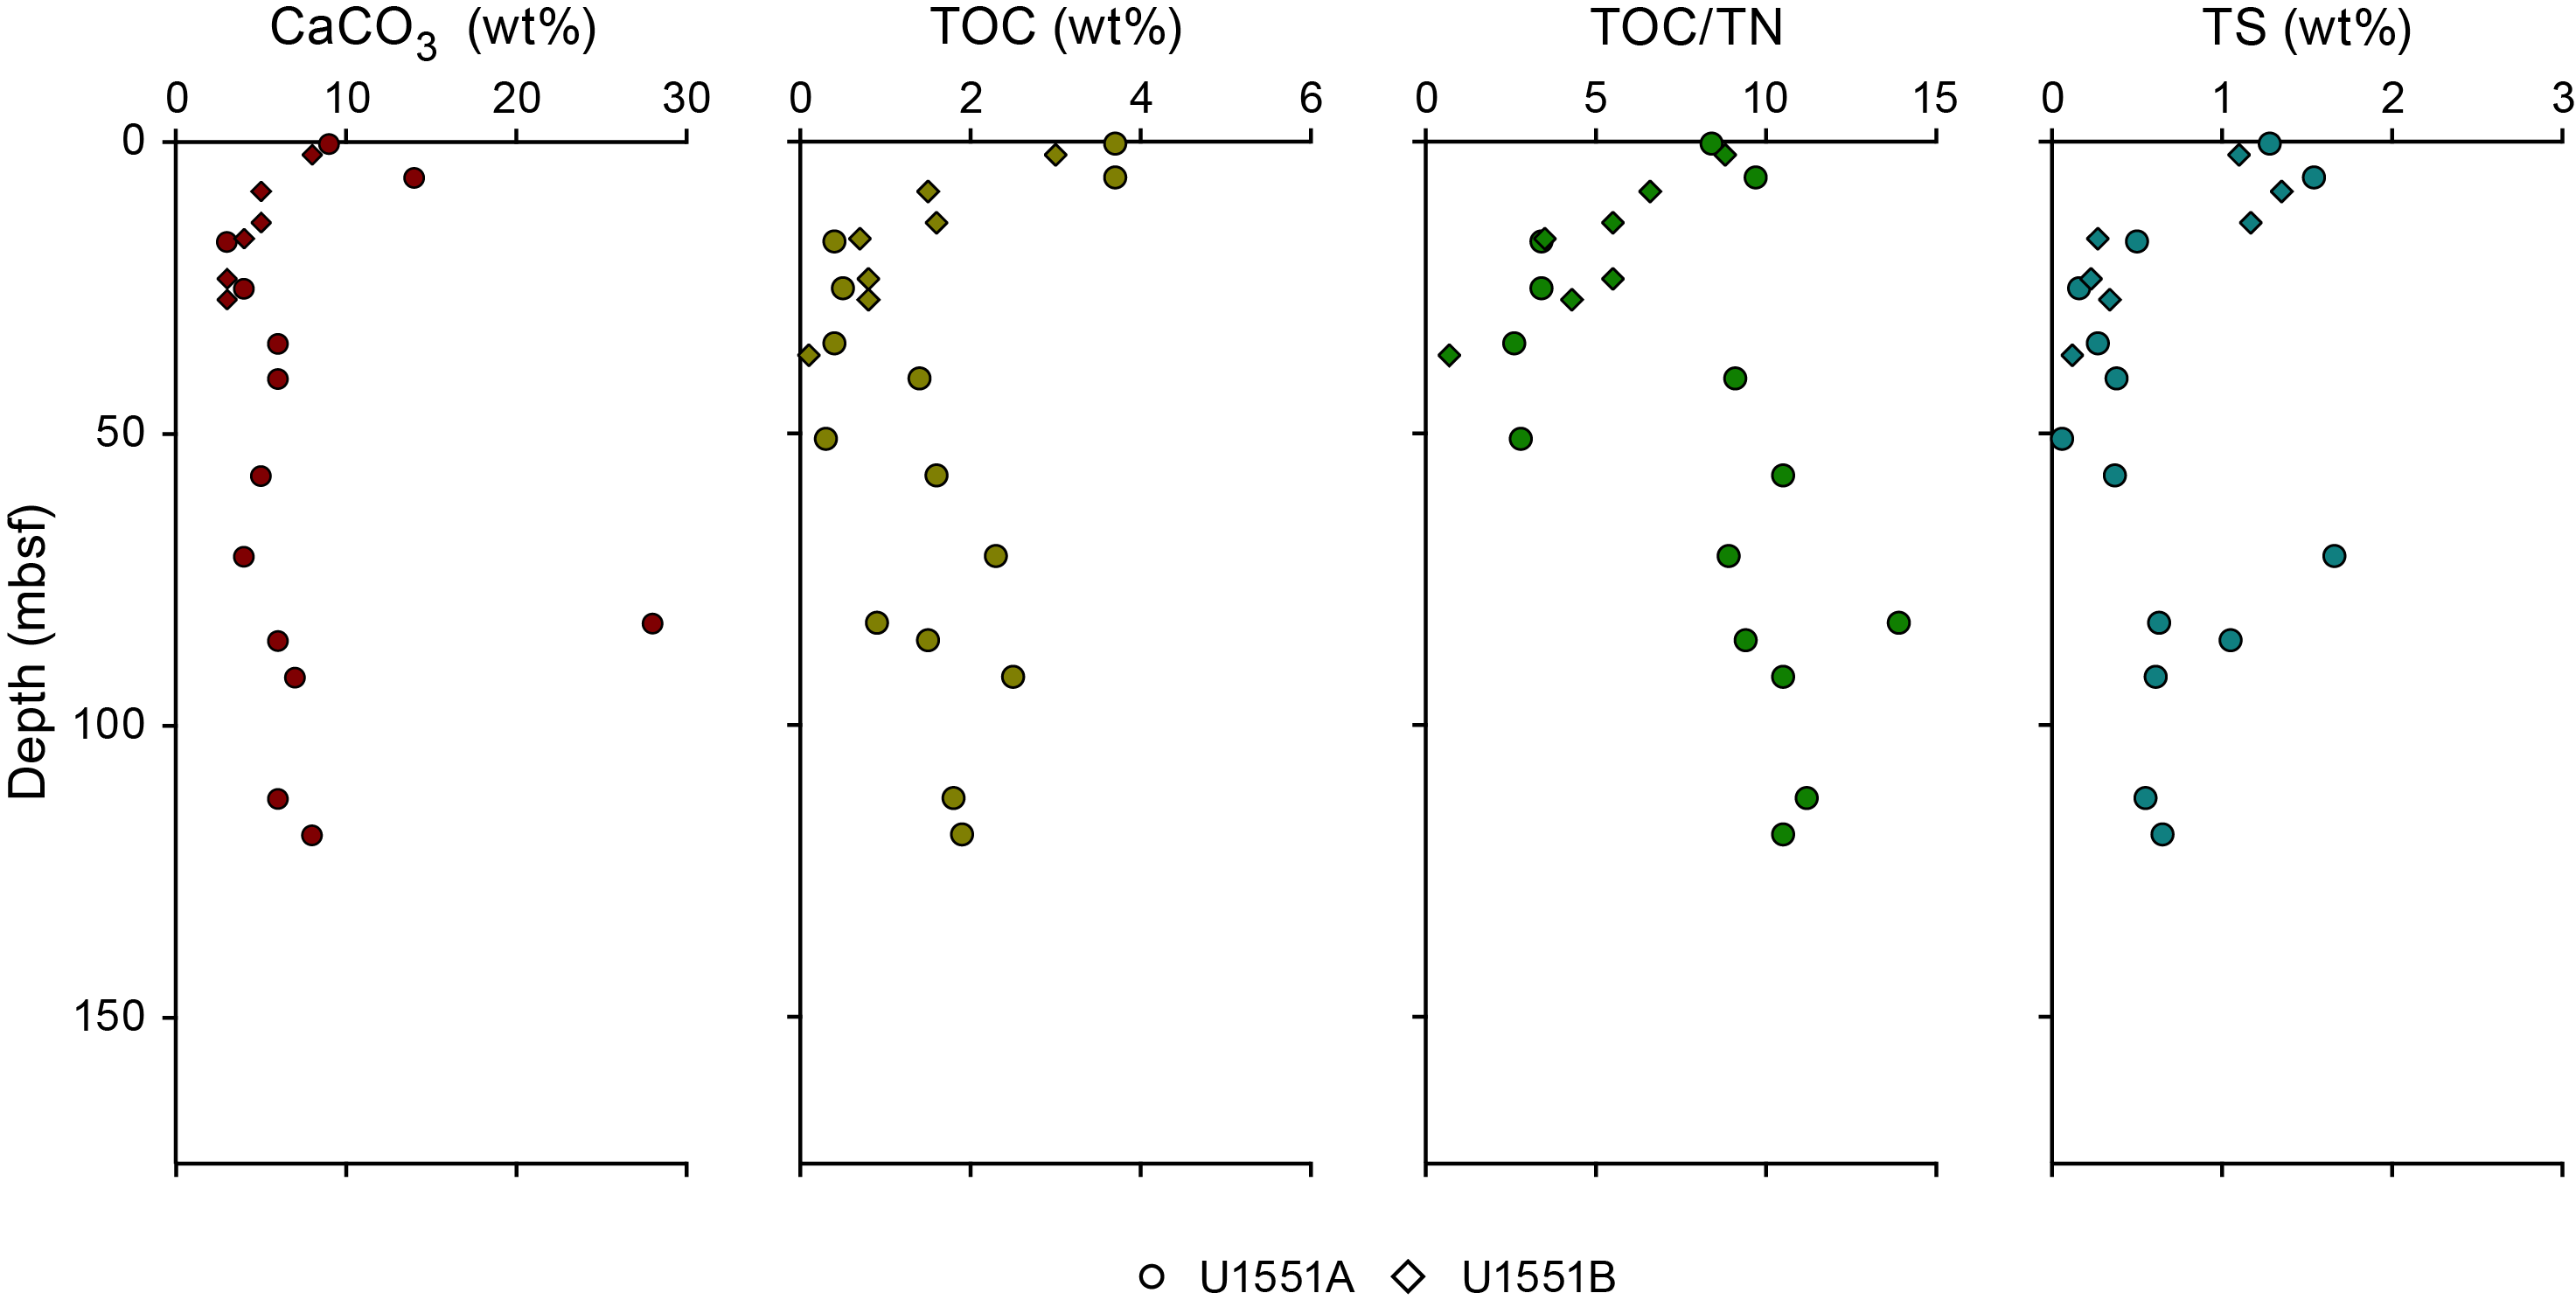
In the uppermost ~15 m, TS concentration ranges between 1.1 and 1.5 wt%. A marked drop to values lower than 0.5 wt% at 16 mbsf corresponds to the transition between diatom ooze and silty sand to clayey silts. Below 57 mbsf, TS concentration increases to a maximum of ~1.7 wt% at 71 mbsf and then decreases to plateau at 0.6 wt% between 91 and 119 mbsf. TS concentrations positively correlate with TOC and globally follow the normal marine trend (Goldhaber and Kaplan, 1974; Berner, 1982) with an average TOC/TS value of 2.5.
9.2. Hydrocarbon gases
Headspace samples were taken from each core to monitor C1–C6 hydrocarbons per the standard safety protocol during drilling (Pimmel and Claypool, 2001). For Holes U1551A and U1551B, 27 headspace samples were analyzed for their parts per million by volume concentration (Table T10) and then corrected by sample weight and porosity to determine the molar concentration of dissolved hydrocarbons (Table T11). Trends observed in Holes U1551A and U1551B are combined for discussion below.
Site U1551 hydrocarbon data are shown in Figure F16. Methane concentrations are below the detection limit to ~30 mbsf. Farther downhole, methane concentrations initially increase to a maximum value of 7.6 mM at ~37 mbsf and then sharply decrease to ~62 mbsf, and values remain very low to 73 mbsf. This marked drop in methane content corresponds to a sand interval. At 73 mbsf, a second increase occurs, leading to a local maximum of ~6 mM at ~90–100 mbsf. This increase is associated with an interval of diatom ooze and silty clay. Below ~100 mbsf, methane concentration decreases to values around 2 mM in a sand-dominated lithology. C2–C6 compounds are sporadically present at concentrations generally lower than 0.5 µM. Ethane tends to increase downhole to a maximum of 1.9 µM at 93 mbsf, coincident with the deepest methane maximum, and decreases below that depth.
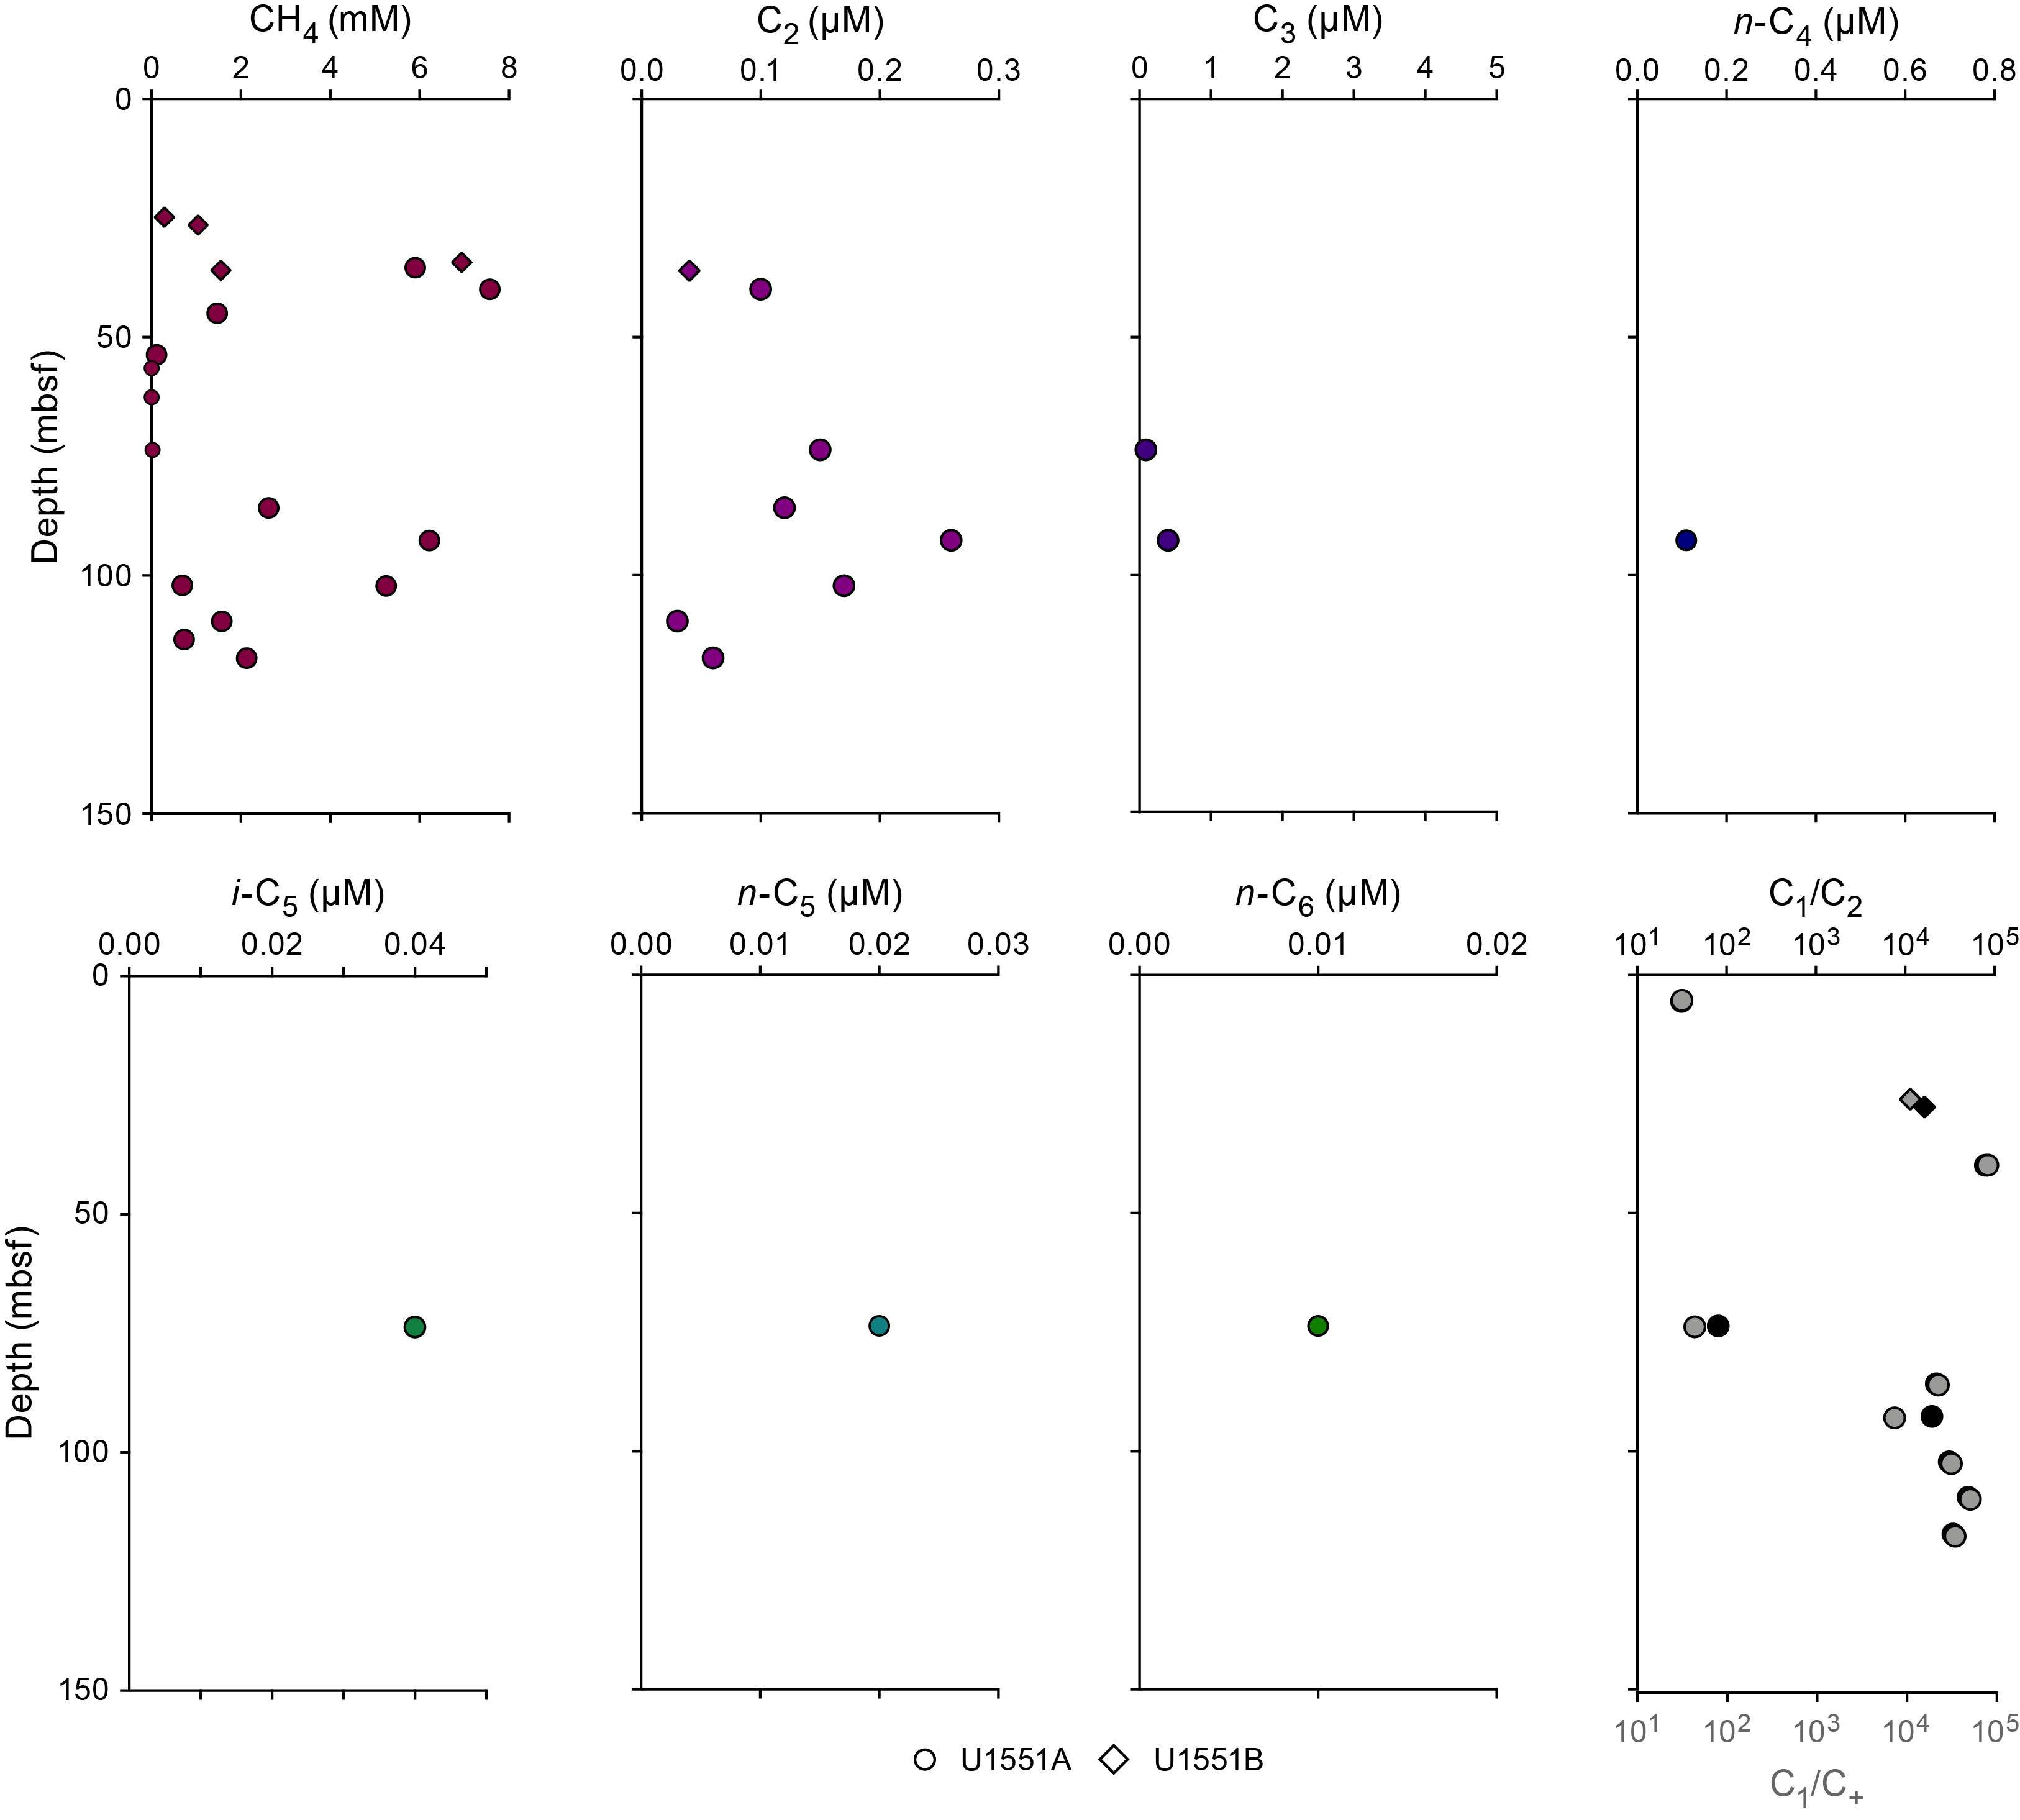
Despite the frequent absence of higher hydrocarbons, these trends in methane and C+ are reflected in C1/C2 and C1/C+ values (Figure F16). In the uppermost diatom ooze interval, a C1/C2 value of 31 is observed in one sample. The methane peak at ~37 mbsf coincides with high C1/C2 values showing a maximum of ~79,200. At the base of the methane-poor sandy interval, one sample has a C1/C2 value of 80. Below 85 mbsf, C1/C2 values fluctuate between ~15,000 and ~51,000 without a clear trend. Neither C1/C2 nor C1/C+ values show an anomalous relationship with temperature, as defined by Pimmel and Claypool (2001).
9.3. Hydrogen and carbon monoxide
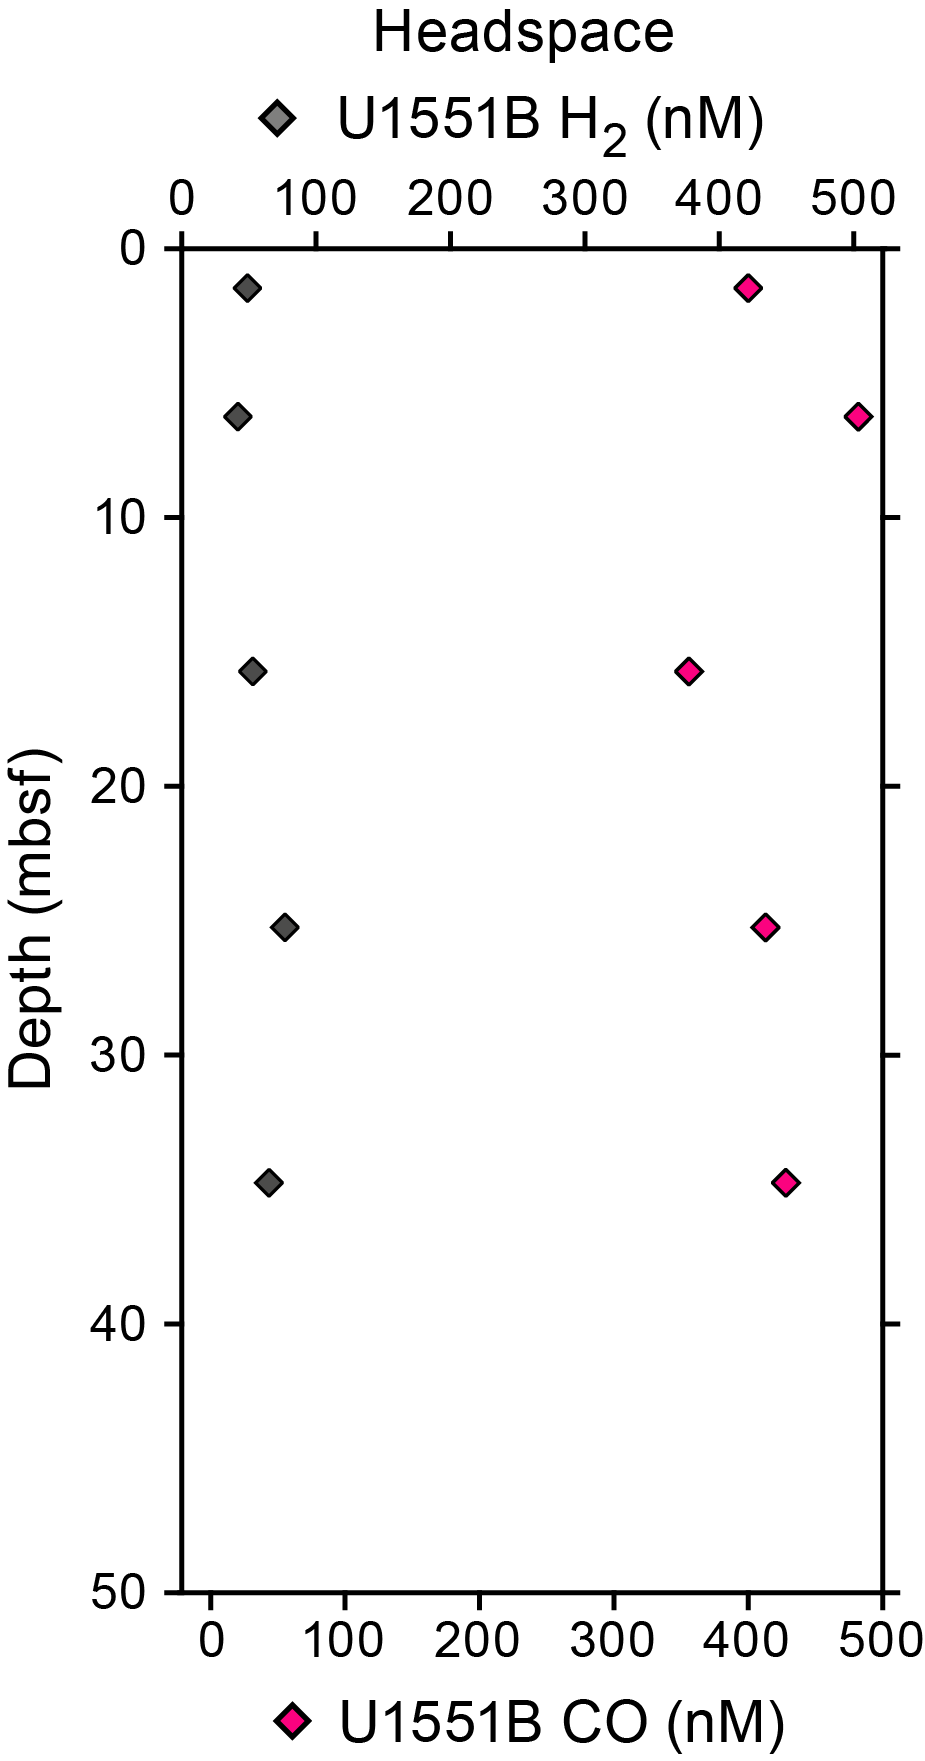
For Hole U1551B, headspace samples were taken from each core to monitor molecular hydrogen (H2) and carbon monoxide (CO) contents. Duplicate samples were collected from depths next to samples for safety gas monitoring of hydrocarbon gases (Table T12). Dissolved H2 and CO were extracted into a defined headspace, the headspace gas was analyzed, and molar concentrations of dissolved H2 and CO were determined as described in Organic geochemistry in the Expedition 385 methods chapter (Teske et al., 2021a). Because of the presence of H2 and CO in the analytical blank, the minimum quantification limits for in situ concentrations of dissolved H2 and CO were 40 and 150 nM, respectively. Concentrations of dissolved H2 show a slightly increasing trend downhole from a value close to the detection limit at 1.5 mbsf to 65 nM at 34.7 mbsf (Figure F17). CO values are close to 400 nM throughout and show no clear trend with increasing depth. The maximum value of 482 nM is observed at 6.25 mbsf.
10. Microbiology
10.1. Sampling
Sediment cores for microbiological studies were obtained from Hole U1551B using the APC system. Site U1551 is located on the southeastern flanking region of Guaymas Basin in an area of low heat flow influenced by terrigenous sedimentation derived from the Yaqui River, which drains the Sierra Madre Occidental and coastal Sonora. As such, this site presents an opportunity for microbiologists to examine microbial abundance and community structure in organic carbon–depleted sediments with more moderate temperature gradients than the other sites drilled during Expedition 385. Sampling for cell counting, 3-D structural imaging, RNA analyses, and contamination tracing was performed as described in Microbiology in the Expedition 385 methods chapter (Teske et al., 2021a).
Detailed curatorial information about all samples taken (e.g., core, section, interval, and absolute depths of samples) can be retrieved from the Curation and Samples Laboratory Information Management System Online Report (http://web.iodp.tamu.edu/LORE).
10.2. Microbial cell detection and enumeration
10.2.1. Microbial cell counts
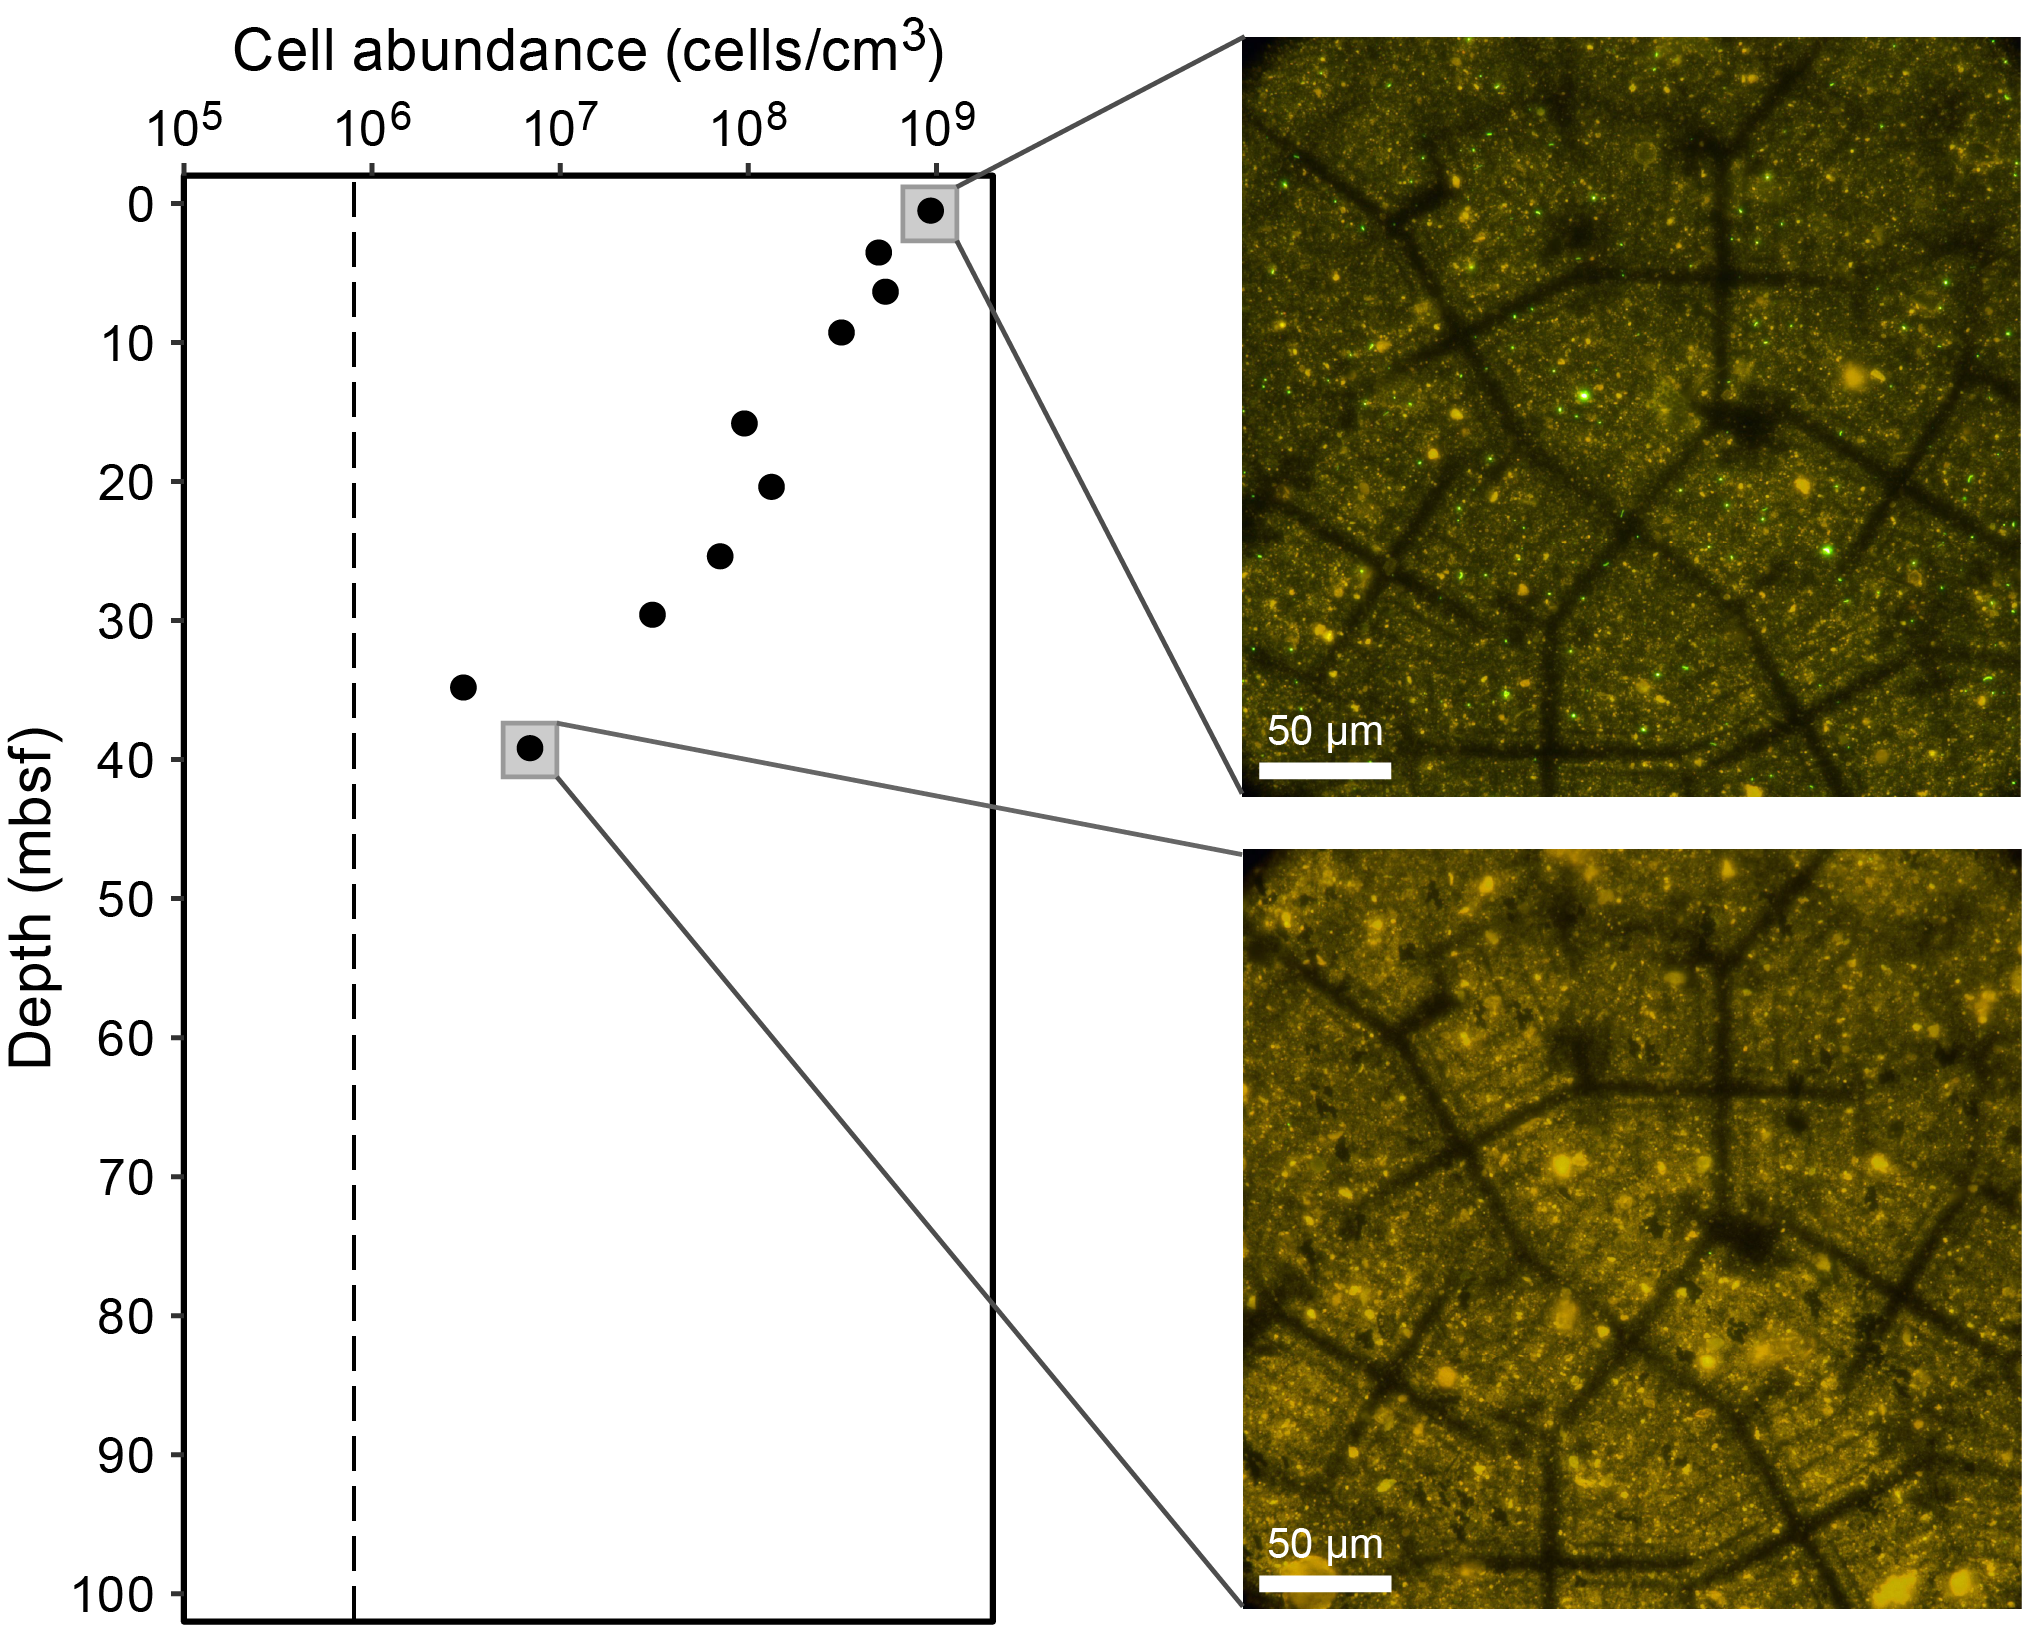
Cell abundance was determined by direct counting through an epifluorescence microscope. For shipboard analysis of sediment, samples (1 cm3) were aseptically taken from Hole U1551B sections using tip-cut syringes. Selected samples (Sections 385-U1551B-1H-1, 1H-4, 2H-1, 2H-4, 3H-2, 3H-5, 4H-2, 4H-5, 5H-2, and 5H-5) were processed using the noncell extraction method described in Microbiology in the Expedition 385 methods chapter (Teske et al., 2021a). Cell abundance was 1.1 × 10⁶ cells/cm3 in bottom seawater and 0.9 × 10⁹ cells/cm3 in seafloor sediments. Below the seafloor, cell abundance gradually decreased to 6.9 × 10⁶ cells/cm3 at approximately 39.1 mbsf (Figure F18), the lowermost depth sampled in Hole U1551B.
10.2.2. CARD-FISH cell counts of fungi
For catalyzed reporter deposition–fluorescence in situ hybridization (CARD-FISH) cell counts of fungi, samples were collected from Sections 385-U1551B-1H-2, 2H-2, 3H-2, 4H-3, and 5H-2 and processed following established protocols (see Microbiology in the Expedition 385 methods chapter [Teske et al., 2021a]).
10.3. Cultivation experiments
10.3.1. Cultivation of methanogenic subsurface microorganisms
Sediment samples from Hole U1551B were selected for stable isotope incubations and enrichments of potential methanogenic populations. On board the ship, whole-round sediment samples (Table T13) were transferred to a cold room immediately after core retrieval and kept for ~2–3 days at ~4°C in argon-flushed and heat-sealed trilaminated foil bags until further processing. For enrichment cultures, whole-round samples were transferred to an anaerobic chamber. Sediment subsamples were taken aseptically from whole-round interiors at least 1 cm away from the core liners and top and bottom caps. Enrichment samples were preserved for incubations in the home laboratory (see Microbiology in the Expedition 385 methods chapter [Teske et al., 2021a]). As a starting point for enrichment and incubation monitoring, subsamples of around 50 cm3 were frozen at −80°C within a few hours of core recovery for shore-based metagenomic and metabarcoding analyses.
10.3.2. Cultivation experiments for fungi
For each sample from Sections 385-U1551B-1H-2, 2H-2, 3H-2, 4H-2, and 5H-2, two enrichment cultures were initiated according to the methods established for Expedition 385 (see Microbiology in the Expedition 385 methods chapter [Teske et al., 2021a]).
10.3.3. Methanogenic and sulfate-reducing microbial enrichments and DNA preservation for metagenomic analyses
Whole-round core samples were collected from Hole U1551B (Sections 1H-2, 2H-2, 3H-2, 4H-2, and 5H-2) for shore-based microbial enrichments and DNA extraction for downstream metagenomic analyses. The 10 cm long whole-round core samples were stored in anaerobic (N2 gassed) Mylar bags at ~4°C for shore-based enrichments and in sterile Whirl-Pak bags at −80°C for shore-based metagenomic analyses.
10.4. Sample collection for postexpedition analyses
Because samples from Hole U1551B were collected late during the expedition, material for specific analyses previously performed shipboard was stored in gas-tight bags or bottles under nitrogen atmosphere for experiments in shore-based laboratories. This included material for stable isotope probing of hydrocarbon degradation (Sections 385-U1551B-1H-1, 1H-2, 2H-2, 3H-2, 3H-3, 5H-2, and 6H-2), radio- and stable-isotope incubations (Sections 1H-2, 2H-3, 3H-3, 4H-3, and 5H-3), high-temperature and high-pressure incubations (Sections 1H-2, 2H-3, 3H-3, 4H-3, and 5H-3), and enrichments for methanogens (Table T13) and fungi (Sections 1H-1, 1H-2, 2H-2, 3H-2, 3H-3, 5H-2, 6H-2) as described for previous sites.
11. Petrophysics
The physical properties of core recovered from Site U1551 were measured in the core laboratory on whole-round cores as well as working- and (subordinate) archive-half sections. Two holes were cored, one to ~120 (Hole U1551A) and one to ~49 mbsf (Hole U1551B). Measured properties and measurement procedures are listed in Tables T17 and T18 in the Expedition 385 methods chapter (Teske et al., 2021a). The data acquired from Hole U1551A and U1551B cores were compared for lithostratigraphic characterization and correlation of core description information with core-based physical properties data. All measured petrophysical parameters consistently identify four distinct depth intervals, delineating lithologies that alternate between diatom ooze and silty sand dominated: from the seafloor to 15 mbsf, ~15 to ~65 mbsf, ~67–92 mbsf, and below 92 mbsf. Shear strength measured by two separate instruments (automated vane shear [AVS] and pocket penetrometer [PEN]) show consistently increasing values with depth from the seafloor. Porosity and density values from MAD measurements show a strong negative correlation at all depths. The depth trends of the other measured physical properties (density, NGR, MS, and P-wave velocity) show a positive correlation between their peaks that can in turn be correlated to the relative abundance of diatom ooze, clay, and sand beds.
11.1. Data acquisition
Core laboratory measurements for Holes U1551A and U1551B were conducted as described in Microbiology in the Expedition 385 methods chapter (Teske et al., 2021a). Whole-round measurements were conducted throughout without divergence from the standard measurement suite and protocols (see Table T17 in the Expedition 385 methods chapter [Teske et al., 2021a] for measurement spacings). All discrete sample measurements were conducted with the shortest measurement spacing (10 m) for the deepest Hole U1551A. Measurements for Hole U1551B were limited to the Section Half Multisensor Logger (SHMSL), MSP, and MAD sampling in coordination with the safety monitoring of hydrocarbon gases (see Organic geochemistry).
11.2. Downhole temperature and thermal conductivity
11.2.1. Downhole temperature
Four in situ formation temperature measurements were made using the APCT-3 tool (see Table T18 in the Expedition 385 methods chapter [Teske et al., 2021a]). Measured temperature values range from 7.70°C at 31.1 mbsf (Core 385-U1551A-4H) to 14.53°C at 99.3 mbsf (Core 13H) (Table T14). These values indicate that temperatures increase with depth along a linear geothermal gradient of ~100°C/km (Figure F19A). The slope of the linear fit between cumulative thermal resistance and formation temperature (Figure F19C) indicates a heat flow of ~108 mW/m2.
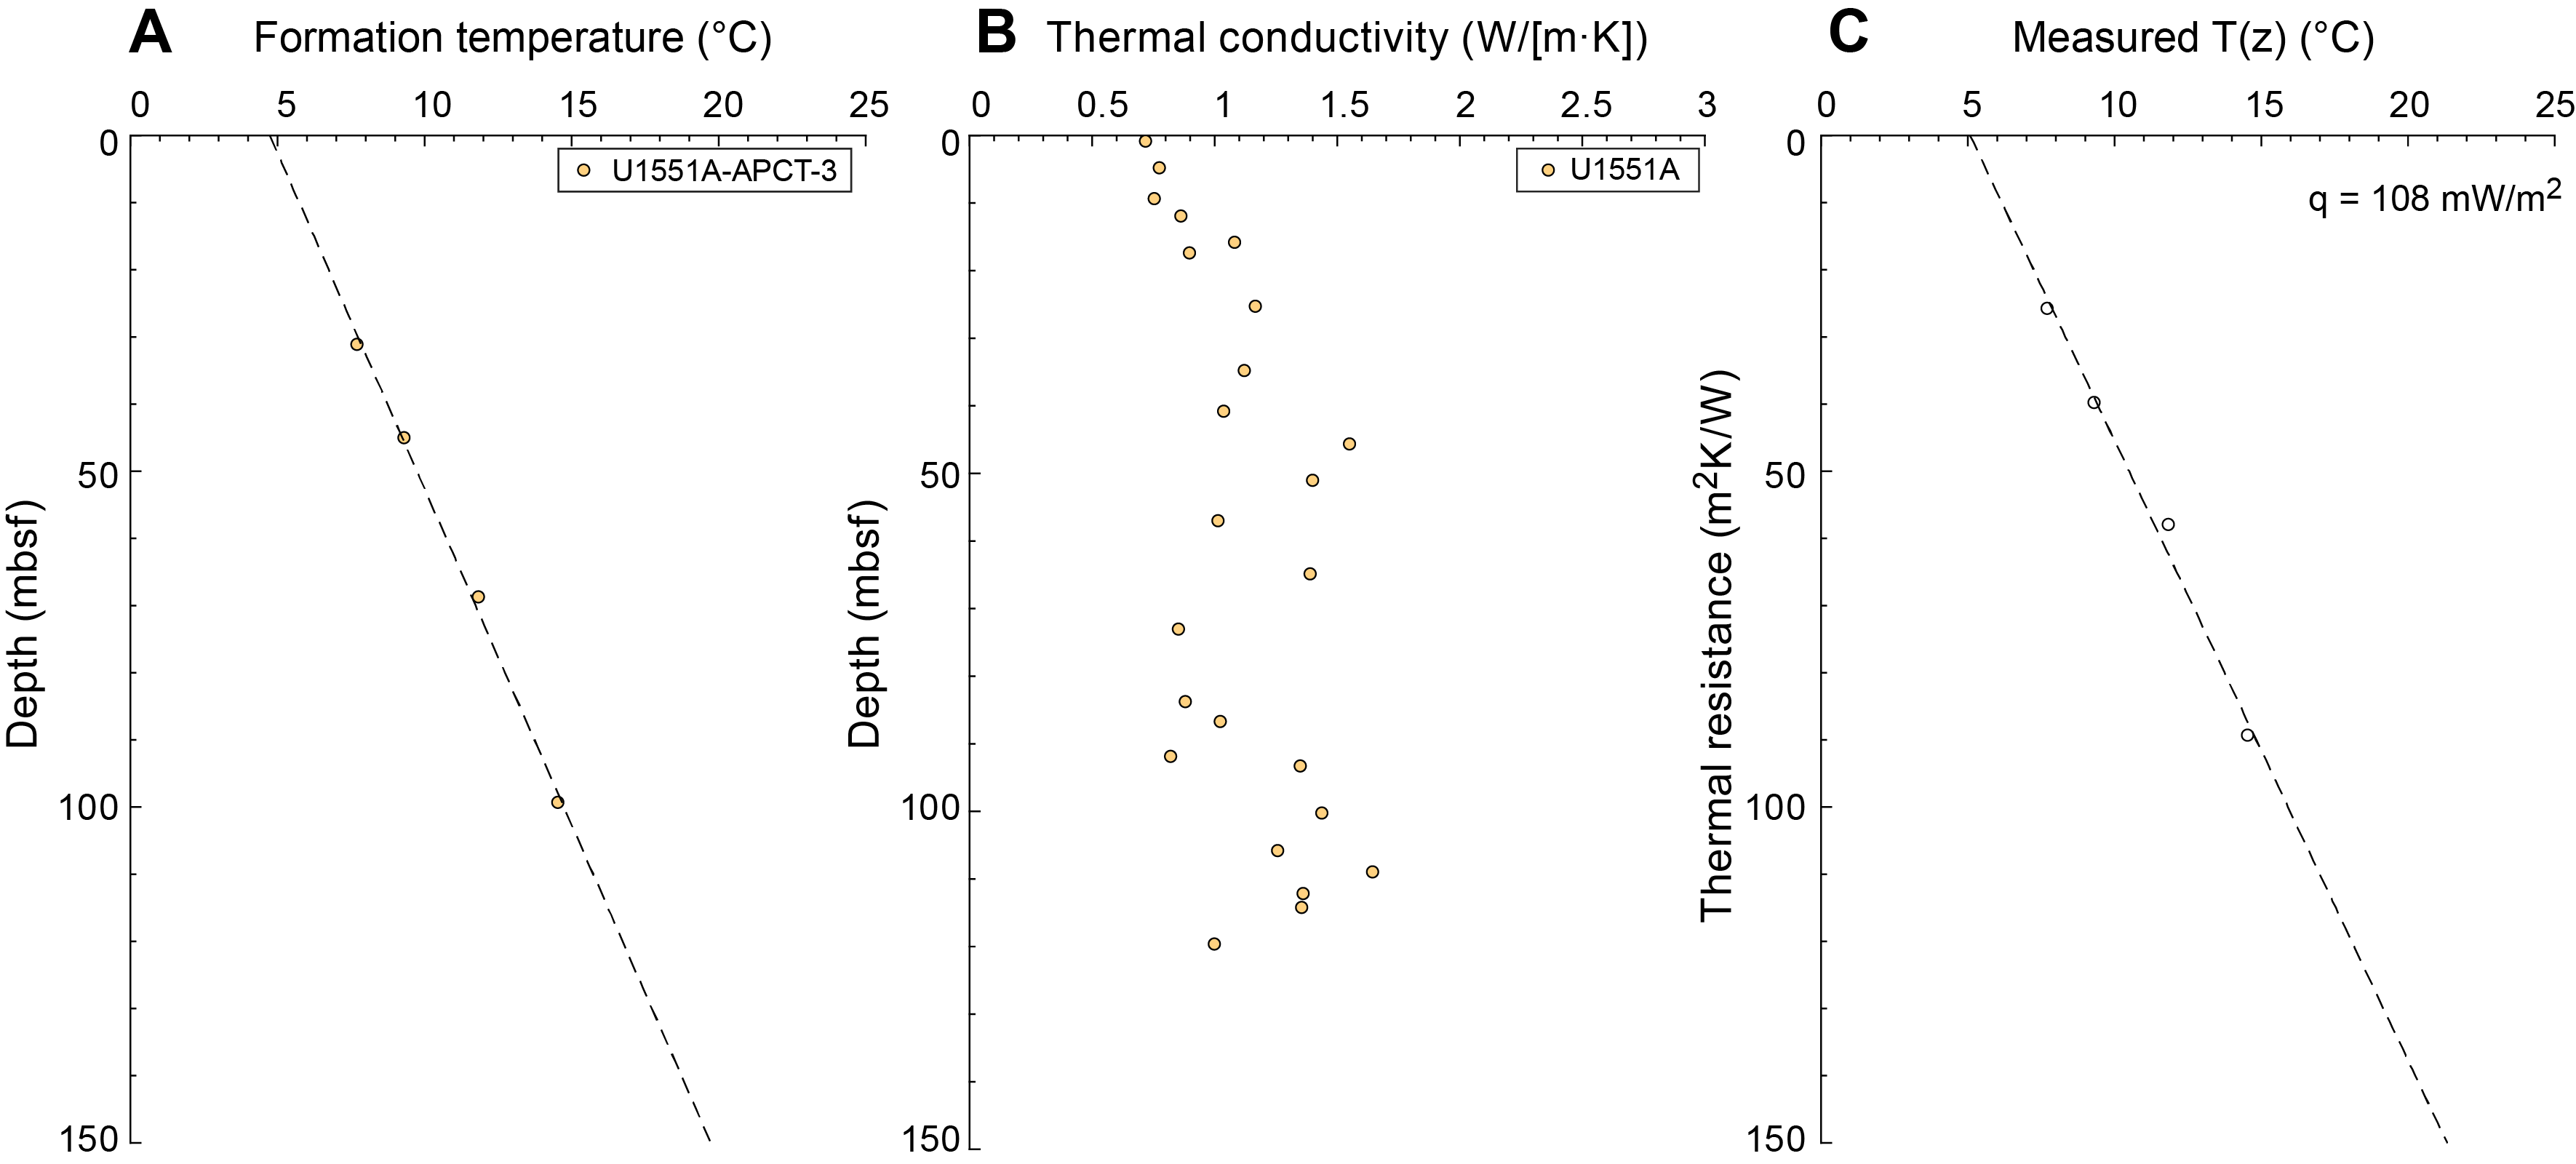
11.2.2. Thermal conductivity
Thermal conductivity for Hole U1551A varies between ~0.7 and ~1.6 W/(m·K) with a mean of 1.1 ± 0.3 W/(m·K) (Figure F19B). Conductivity values in clay- and silt-rich layers are ~0.9 W/(m·K), whereas sand layers show higher values around 1.4 W/(m·K).
11.3. Density (core and grain)
Bulk density values determined from discrete samples agree well with those obtained on the whole-round cores (Figure F20B). Density increases in the uppermost ~15 m from ~1.2 to ~1.4 g/cm3 (Hole U1551A). After a sharp increase to ~1.8–2.0 g/cm3 (gamma ray attenuation [GRA] bulk density; Hole U1551A), density remains relatively constant to ~37 mbsf. This interval is punctuated by a relatively pronounced negative anomaly at ~28 mbsf with a value of ~1.5 g/cm3. From 40 to 45 mbsf, density increases from ~1.8 to ~2.0 g/cm3 and then remains constant to ~66 mbsf (GRA bulk density; Hole U1551A), except for a small negative anomaly of ~1.6 g/cm3 at ~56 mbsf. From 66 to 93 mbsf, density is generally lower and ranges from ~1.3 to ~1.5 g/cm3. The following detailed variations were observed:
- From ~66 to ~83 mbsf, density ranges over much lower values of ~1.4–1.5 g/cm3. Several anomalous peaks are observed at ~71, ~75, ~79, and ~82 mbsf, where densities are as high as ~1.9 g/cm3.
- The interval from ~83 to 88 mbsf is marked by higher density values up to ~1.7 g/cm3 that are followed by a significant decrease in density values to ~1.3 g/cm3 at 92.5 mbsf.
- The bottom depth interval from ~93 to ~116 mbsf is marked by higher and more constant density values up to ~2.0 g/cm3. Lower values (as low as ~1.5 g/cm3) are observed at ~102 and ~114 mbsf, defining two equally thick units (9 m): ~93 to ~102 mbsf and ~105 to ~114 mbsf.
11.4. Magnetic susceptibility
Both MS data sets (Whole-Round Multisensor Logger [WRMSL] and SHMSL) are in very good agreement along the entire depth profile (Figure F20C) and correlate with peaks observed in NGR, density, and P-wave velocity. A large fluctuation in MS intensity is observed from the seafloor to 6 mbsf. From 6 to 9 mbsf, MS intensity rapidly increases to 36 SI; it then remains constant to ~12 mbsf. After a shift of two orders of magnitude to ~300–822 SI, MS intensity values remain relatively constant over the next 50 m to 65 mbsf. Below 65 mbsf, MS intensity drops by two to three orders of magnitude and remains at low values to 93 mbsf (minimum of 2 SI at ~76 mbsf). Over the remaining 24 m of Hole U1551A, MS intensity reaches 750 SI and averages ~500 SI. This latter trend matches that observed in the NGR downhole variation.
11.5. Sonic velocities
P-wave velocities measured using the WRMSL and the Section Half Measurement Gantry (SHMG) caliper show values close to seawater (1506–1512 m/s) and slightly less over the uppermost 14 m of penetration (Figure F20D). From 14.5 to 36 mbsf, P-wave velocities slowly increase from 1600 to 1658 m/s (Figure F20D); an anomalously low value of 1536 m/s disturbs this trend at ~27 mbsf. The interval from ~36 to 50 mbsf is characterized by erratic data typically related to cracks in the core liner. Values measured in this interval were discarded (Figure F20D).
From ~45 to 65 mbsf, P-wave velocities range between 1690 and 1777 m/s. A couple of low-velocity anomalies interrupt this trend at 50 and 57 mbsf with values of 1589 and 1543 m/s, respectively (Figure F20D). From ~66 to 90 mbsf, P-wave velocities range between 1518 and 1550 m/s. This is followed by a depth interval (~90–113 mbsf) where noise prevails (Figure F20D). Finally, from 113 to 117 mbsf, P-wave velocities consistently increase from ~1718 to ~1778 m/s, followed by a sharp drop from ~1790 m/s at ~116 mbsf to ~1542 m/s at ~118 mbsf that is mirrored by a corresponding rise over the next 2 m (Figure F20D). This pattern is also seen in MS and NGR measurements.
11.6. Natural gamma radiation
NGR values for Holes U1551A and U1551B are similar (Figure F20E). A peak value of 31 counts/s is observed at ~2 mbsf and is positively correlated with peaks in density, MS, and P-wave velocity. NGR increases linearly from ~5 mbsf to around 13 mbsf. A shift to greater NGR values, up to 50 counts/s, is observed over a 3 m interval to ~16 mbsf. Below this depth, values are constant around 50 counts/s to ~60 mbsf and then decrease to ~15 counts/s at ~72 mbsf. They increase again to 36 counts/s at ~86 mbsf with a notable cluster of high values (50–60 counts/s) near 80 mbsf and then drop to ~18 counts/s between ~86 and ~91 mbsf. After a sharp increase to ~58 counts/s between ~90 and 93 mbsf, values vary around a mean of ~50 counts/s to the bottom of Hole U1551A. Generally, NGR values are in good agreement with MS, P-wave velocity, and density measurements.
11.7. Rheology
Shear strength values derived from compressive strength measurements (PEN) become reliable below ~14 mbsf (Figure F20F). Shear strength obtained with the AVS consistently increases from the seafloor to ~40 mbsf and ranges from 11.4 to 125 kPa.
Between ~47 and ~63 mbsf, shear strength derived from compressive strength measurements (PEN/2) ranges between 78.5 and 110 kPa. This depth interval is bounded by lower compressive strength values of 24.5 and 49 kPa at 43 and 65 mbsf, respectively. Shear strength measurements in the same depth interval were not possible because of the sand-dominated layers. Shear strength measurements at ~62 and ~63.5 mbsf show an increase from 16.3 to 35.5 kPa that is well correlated with the trend obtained from the compressive strength measurement in the overall depth range of ~47 to ~63 mbsf.
Between 66 and 92.5 mbsf, shear strength derived from compressive strength measurements (PEN/2) generally ranges between 14 and 225.5 kPa with a drop to ~49 kPa at ~78 mbsf. Although only two measurements with the AVS were possible from 66 to 92.5 mbsf, they confirm the general trend obtained from PEN measurements (Figure F20F).
Finally, the deepest part of Hole U1551A is marked by consistently low values in shear strength obtained by both measurement methods: ~46 (PEN/2) and ~28 kPa (AVS) between ~95 and ~110 mbsf.
11.8. Porosity
Porosity measured on discrete MAD samples generally outlines a trend that mirrors the density measurements (Figure F20G). From the seafloor to 15 mbsf, porosity decreases from 89% to 76%. Between ~16 and 62 mbsf, porosity trends toward lower values, decreasing to ~47% at 20 mbsf and to ~41% at 62 mbsf. From 65 to 88 mbsf, porosity generally increases, with a local maximum of 85.5% at 73.5 mbsf (Figure F20G). Porosity and density values from the MAD measurements show a strong negative correlation at all depths (Figure F20G). The trend suggested by the few MAD samples collected at 65–88 mbsf is partly a sampling bias reflecting the discrete sand beds reported in the lithostratigraphy description (see Lithostratigraphy). Samples from 79 and 82 mbsf indicate porosity values as low as ~47% and ~48%, respectively. The deepest part of Hole U1551A (~96–113 mbsf) shows porosity increasing with depth from ~37% to ~50% (Figure F20G).
11.9. Data integration and lithology correlation
Four depth intervals were identified in all petrophysical parameters:
- From the seafloor to 15 mbsf, density increases; it is positively correlated with rheological measurements (Figure F20), gamma ray, and MS and is negatively correlated with porosity. P-wave velocity remains close to seawater values. This shallow unit corresponds to diatom ooze (see Lithostratigraphy).
- Between ~15 and ~65 mbsf, all petrophysical parameters show relatively constant values. Small contrasts in the profiles of density, NGR, MS, P-wave velocity, and rheology suggest a division into two petrophysical units: ~15–40 mbsf and ~40–65 mbsf (Figures F20). The 15–65 mbsf interval consists of silty sand and sand interrupted by a 16 m thick layer of clayey silt at 28–44 mbsf (see Lithostratigraphy).
- The 67–92 mbsf interval, marked by a decrease in density, NGR, MS, and P-wave velocity and an increase in porosity (Figure F20), corresponds to a silt-rich lithology punctuated by centimeter-scale sand beds at ~71, ~75, ~79, and ~82 mbsf (see Lithostratigraphy).
- Finally, below 92 mbsf, the main lithology is composed of sand with silt-rich layers. This unit is very similar in terms of petrophysical signals to the sand-dominated interval found between 42 and 64 mbsf (Figures F20).
References
Arason, P., and Levi, S., 2010. Maximum likelihood solution for inclination-only data in paleomagnetism. Geophysical Journal International, 182(2):753–771. https://doi.org/
Berner, R.A., 1982. Burial of organic carbon and pyrite sulfur in the modern ocean: its geochemical and environmental significance. American Journal of Science, 282(4):451–473. https://doi.org/
Goldhaber, M.B., and Kaplan, I.R., 1974. The sulfur cycle. In Goldberg, E.D. (Ed.), The Sea (Volume 5): Marine Chemistry. New York (Wiley), 569–655.
Helenes, J., Carreño, A.L., and Carrillo, R.M., 2009. Middle to late Miocene chronostratigraphy and development of the northern Gulf of California. Marine Micropaleontology, 72(1):10–25. https://doi.org/
Kirschvink, J.L., 1980. The least-squares line and plane and the analysis of palaeomagnetic data. Geophysical Journal International, 62(3):699–718. https://doi.org/
Levi, S., and Karlin, R., 1989. A sixty thousand year paleomagnetic record from Gulf of California sediments: secular variation, late Quaternary excursions and geomagnetic implications. Earth and Planetary Science Letters, 92(2):219–233. https://doi.org/
Martini, E., 1971. Standard Tertiary and Quaternary calcareous nannoplankton zonation. In McKee, E.D., and Weir, G.W. (Ed.), Trace Elements Investigations Report, 269: Washington, DC (US Department of the Interior). https://doi.org/
McDougall, K., and Martínez, A.Y.M., 2014. Evidence for a marine incursion along the lower Colorado River corridor. Geosphere, 10(5):842–869. https://doi.org/
Meyers, P.A., 1994. Preservation of elemental and isotopic source identification of sedimentary organic matter. Chemical Geology, 114(3–4):289–302. https://doi.org/
Pimmel, A., and Claypool, G., 2001. Introduction to shipboard organic geochemistry on the JOIDES Resolution. Ocean Drilling Program Technical Note, 30. https://doi.org/
Ramírez, G.A., McKay, L.J., Fields, M.W., Buckley, A., Mortera, C., Hensen, C., Ravelo, A.C., and Teske, A.P., 2020. The Guaymas Basin subseafloor sedimentary archaeome reflects complex environmental histories. iScience, 23(9):101459. https://doi.org/
Teske, A., Lizarralde, D., and Höfig, T.W., 2018. Expedition 385 Scientific Prospectus: Guaymas Basin Tectonics and Biosphere, College Station, TX (International Ocean Discovery Program). https://doi.org/
Teske, A., Lizarralde, D., Höfig, T.W., Aiello, I.W., Ash, J.L., Bojanova, D.P., Buatier, M.D., Edgcomb, V.P., Galerne, C.Y., Gontharet, S., Heuer, V.B., Jiang, S., Kars, M.A.C., Khogenkumar Singh, S., Kim, J.-H., Koornneef, L.M.T., Marsaglia, K.M., Meyer, N.R., Morono, Y., Negrete-Aranda, R., Neumann, F., Pastor, L.C., Peña-Salinas, M.E., Pérez Cruz, L.L., Ran, L., Riboulleau, A., Sarao, J.A., Schubert, F., Stock, J.M., Toffin, L.M.A.A., Xie, W., Yamanaka, T., and Zhuang, G., 2021a. Expedition 385 methods. In Teske, A., Lizarralde, D., Höfig, T.W. and the Expedition 385 Scientists, Guaymas Basin Tectonics and Biosphere. Proceedings of the International Ocean Discovery Program, 385: College Station, TX (International Ocean Discovery Program). https://doi.org/
Teske, A., Lizarralde, D., Höfig, T.W., Aiello, I.W., Ash, J.L., Bojanova, D.P., Buatier, M.D., Edgcomb, V.P., Galerne, C.Y., Gontharet, S., Heuer, V.B., Jiang, S., Kars, M.A.C., Khogenkumar Singh, S., Kim, J.-H., Koornneef, L.M.T., Marsaglia, K.M., Meyer, N.R., Morono, Y., Negrete-Aranda, R., Neumann, F., Pastor, L.C., Peña-Salinas, M.E., Pérez Cruz, L.L., Ran, L., Riboulleau, A., Sarao, J.A., Schubert, F., Stock, J.M., Toffin, L.M.A.A., Xie, W., Yamanaka, T., and Zhuang, G., 2021b. Site U1545. In Teske, A., Lizarralde, D., Höfig, T.W., and the Expedition 385 Scientists, Guaymas Basin Tectonics and Biosphere. Proceedings of the International Ocean Discovery Program, 385: College Station, TX (International Ocean Discovery Program). https://doi.org/
Teske, A., Lizarralde, D., Höfig, T.W., Aiello, I.W., Ash, J.L., Bojanova, D.P., Buatier, M.D., Edgcomb, V.P., Galerne, C.Y., Gontharet, S., Heuer, V.B., Jiang, S., Kars, M.A.C., Khogenkumar Singh, S., Kim, J.-H., Koornneef, L.M.T., Marsaglia, K.M., Meyer, N.R., Morono, Y., Negrete-Aranda, R., Neumann, F., Pastor, L.C., Peña-Salinas, M.E., Pérez Cruz, L.L., Ran, L., Riboulleau, A., Sarao, J.A., Schubert, F., Stock, J.M., Toffin, L.M.A.A., Xie, W., Yamanaka, T., and Zhuang, G., 2021c. Site U1546. In Teske, A., Lizarralde, D., Höfig, T.W., and the Expedition 385 Scientists, Guaymas Basin Tectonics and Biosphere. Proceedings of the International Ocean Discovery Program, 385: College Station, TX (International Ocean Discovery Program). https://doi.org/
Teske, A., Lizarralde, D., Höfig, T.W., Aiello, I.W., Ash, J.L., Bojanova, D.P., Buatier, M.D., Edgcomb, V.P., Galerne, C.Y., Gontharet, S., Heuer, V.B., Jiang, S., Kars, M.A.C., Khogenkumar Singh, S., Kim, J.-H., Koornneef, L.M.T., Marsaglia, K.M., Meyer, N.R., Morono, Y., Negrete-Aranda, R., Neumann, F., Pastor, L.C., Peña-Salinas, M.E., Pérez Cruz, L.L., Ran, L., Riboulleau, A., Sarao, J.A., Schubert, F., Stock, J.M., Toffin, L.M.A.A., Xie, W., Yamanaka, T., and Zhuang, G., 2021d. Sites U1547 and U1548. In Teske, A., Lizarralde, D., Höfig, T.W., and the Expedition 385 Scientists, Guaymas Basin Tectonics and Biosphere. Proceedings of the International Ocean Discovery Program, 385: College Station, TX (International Ocean Discovery Program). https://doi.org/
Teske, A., Lizarralde, D., Höfig, T.W., Aiello, I.W., Ash, J.L., Bojanova, D.P., Buatier, M.D., Edgcomb, V.P., Galerne, C.Y., Gontharet, S., Heuer, V.B., Jiang, S., Kars, M.A.C., Khogenkumar Singh, S., Kim, J.-H., Koornneef, L.M.T., Marsaglia, K.M., Meyer, N.R., Morono, Y., Negrete-Aranda, R., Neumann, F., Pastor, L.C., Peña-Salinas, M.E., Pérez Cruz, L.L., Ran, L., Riboulleau, A., Sarao, J.A., Schubert, F., Stock, J.M., Toffin, L.M.A.A., Xie, W., Yamanaka, T., and Zhuang, G., 2021e. Site U1549. In Teske, A., Lizarralde, D., Höfig, T.W., and the Expedition 385 Scientists, Guaymas Basin Tectonics and Biosphere. Proceedings of the International Ocean Discovery Program, 385: College Station, TX (International Ocean Discovery Program). https://doi.org/
Teske, A., Lizarralde, D., Höfig, T.W., Aiello, I.W., Ash, J.L., Bojanova, D.P., Buatier, M.D., Edgcomb, V.P., Galerne, C.Y., Gontharet, S., Heuer, V.B., Jiang, S., Kars, M.A.C., Khogenkumar Singh, S., Kim, J.-H., Koornneef, L.M.T., Marsaglia, K.M., Meyer, N.R., Morono, Y., Negrete-Aranda, R., Neumann, F., Pastor, L.C., Peña-Salinas, M.E., Pérez Cruz, L.L., Ran, L., Riboulleau, A., Sarao, J.A., Schubert, F., Stock, J.M., Toffin, L.M.A.A., Xie, W., Yamanaka, T., and Zhuang, G., 2021f. Site U1550. In Teske, A., Lizarralde, D., Höfig, T.W., and the Expedition 385 Scientists, Guaymas Basin Tectonics and Biosphere. Proceedings of the International Ocean Discovery Program, 385: College Station, TX (International Ocean Discovery Program). https://doi.org/
Teske, A., Lizarralde, D., Höfig, T.W., Aiello, I.W., Ash, J.L., Bojanova, D.P., Buatier, M.D., Edgcomb, V.P., Galerne, C.Y., Gontharet, S., Heuer, V.B., Jiang, S., Kars, M.A.C., Khogenkumar Singh, S., Kim, J.-H., Koornneef, L.M.T., Marsaglia, K.M., Meyer, N.R., Morono, Y., Negrete-Aranda, R., Neumann, F., Pastor, L.C., Peña-Salinas, M.E., Pérez Cruz, L.L., Ran, L., Riboulleau, A., Sarao, J.A., Schubert, F., Stock, J.M., Toffin, L.M.A.A., Xie, W., Yamanaka, T., and Zhuang, G., 2021g. Site U1552. In Teske, A., Lizarralde, D., Höfig, T.W., and the Expedition 385 Scientists, Guaymas Basin Tectonics and Biosphere. Proceedings of the International Ocean Discovery Program, 385: College Station, TX (International Ocean Discovery Program). https://doi.org/
Teske, A., Lizarralde, D., Höfig, T.W., and the Expedition 385 Scientists, 2021h. Supplementary material, https://doi.org/
Thunell, R.C., 1998. Seasonal and annual variability in particle fluxes in the Gulf of California: a response to climate forcing. Deep Sea Research Part I: Oceanographic Research Papers, 45(12):2059–2083. https://doi.org/
Zijderveld, J.D.A., 1967. AC demagnetization of rocks: analysis of results. In Runcorn, S.K.C., Creer, K.M., and Collinson, D.W. (Eds.), Methods in Palaeomagnetism: Amsterdam (Elsevier), 254–286.