Teske, A., Lizarralde, D., Höfig, T.W., and the Expedition 385 Scientists
Proceedings of the International Ocean Discovery Program Volume 385
publications.iodp.org
https://doi.org/10.14379/iodp.proc.385.109.2021
Site U15521
![]() A. Teske,
A. Teske,
![]() D. Lizarralde,
D. Lizarralde,
![]() T.W. Höfig,
T.W. Höfig,
![]() I.W. Aiello,
I.W. Aiello,
![]() J.L. Ash,
J.L. Ash,
![]() D.P. Bojanova,
D.P. Bojanova,
![]() M.D. Buatier,
M.D. Buatier,
![]() V.P. Edgcomb,
V.P. Edgcomb,
![]() C.Y. Galerne,
C.Y. Galerne,
![]() S. Gontharet,
S. Gontharet,
![]() V.B. Heuer,
V.B. Heuer,
![]() S. Jiang,
S. Jiang,
![]() M.A.C. Kars,
M.A.C. Kars,
![]() S. Khogenkumar Singh,
S. Khogenkumar Singh,
![]() J.-H. Kim,
J.-H. Kim,
![]() L.M.T. Koornneef,
L.M.T. Koornneef,
![]() K.M. Marsaglia,
K.M. Marsaglia,
![]() N.R. Meyer,
N.R. Meyer,
![]() Y. Morono,
Y. Morono,
![]() R. Negrete-Aranda,
R. Negrete-Aranda,
![]() F. Neumann,
F. Neumann,
![]() L.C. Pastor,
L.C. Pastor,
![]() M.E. Peña-Salinas,
M.E. Peña-Salinas,
![]() L.L. Pérez-Cruz,
L.L. Pérez-Cruz,
![]() L. Ran,
L. Ran,
![]() A. Riboulleau,
A. Riboulleau,
![]() J.A. Sarao,
J.A. Sarao,
![]() F. Schubert,
F. Schubert,
![]() J.M. Stock,
J.M. Stock,
![]() L.M.A.A. Toffin,
L.M.A.A. Toffin,
![]() W. Xie,
W. Xie,
![]() T. Yamanaka,
T. Yamanaka,
![]() G. Zhuang
2
G. Zhuang
2
1 Teske, A., Lizarralde, D., Höfig, T.W., Aiello, I.W., Ash, J.L., Bojanova, D.P., Buatier, M.D., Edgcomb, V.P., Galerne, C.Y., Gontharet, S., Heuer, V.B., Jiang, S., Kars, M.A.C., Khogenkumar Singh, S., Kim, J.-H., Koornneef, L.M.T., Marsaglia, K.M., Meyer, N.R., Morono, Y., Negrete-Aranda, R., Neumann, F., Pastor, L.C., Peña-Salinas, M.E., Pérez Cruz, L.L., Ran, L., Riboulleau, A., Sarao, J.A., Schubert, F., Stock, J.M., Toffin, L.M.A.A., Xie, W., Yamanaka, T., and Zhuang, G., 2021. Site U1552. In Teske, A., Lizarralde, D., Höfig, T.W., and the Expedition 385 Scientists, Guaymas Basin Tectonics and Biosphere. Proceedings of the International Ocean Discovery Program, 385: College Station, TX (International Ocean Discovery Program). https://doi.org/
2 Expedition 385 Scientists’ affiliations.
1. Summary
1.1. Background and objectives
Site U1552 is located ~20 km northwest of the northern axial graben in Guaymas Basin (Figure F1), proximal to the Sonora margin (Figure F2). The site is adjacent to a mostly buried mound that sits atop a pipe-like, acoustically blanked zone that was observed in Seismic Line SO-112 (Figure F1) extending toward the edge of an interpreted sill intrusion at ~700 meters below seafloor (mbsf). Cold-seep seafloor communities are known to exist in the area above the edges of the interpreted deep sill. The mound structure is similar to the surficial mound near Site U1549, where gas hydrate is present at the seafloor, and it was thus expected that massive gas hydrate would be sampled in Hole U1552A, which is situated directly adjacent to the mostly buried mound. As at Site U1549, the association of a relatively deep sill, gas hydrates, and nearby seafloor communities connects multiple components of the carbon budget in a sediment deposition system influenced by a deep sill. Therefore, the primary objectives for Site U1552 were to characterize the physical, chemical, and microbial properties of this environment and to assess (1) the influence of the deep sill on interstitial water (IW) chemistry and gas hydrate stability, (2) the role of gas hydrate as a carbon storage buffer, (3) the utilization of permeable pathways between the sill and the seafloor for the transport of deep thermogenic gas, and (4) the impact of lateral gradients away from the pipe structure on microbial life.
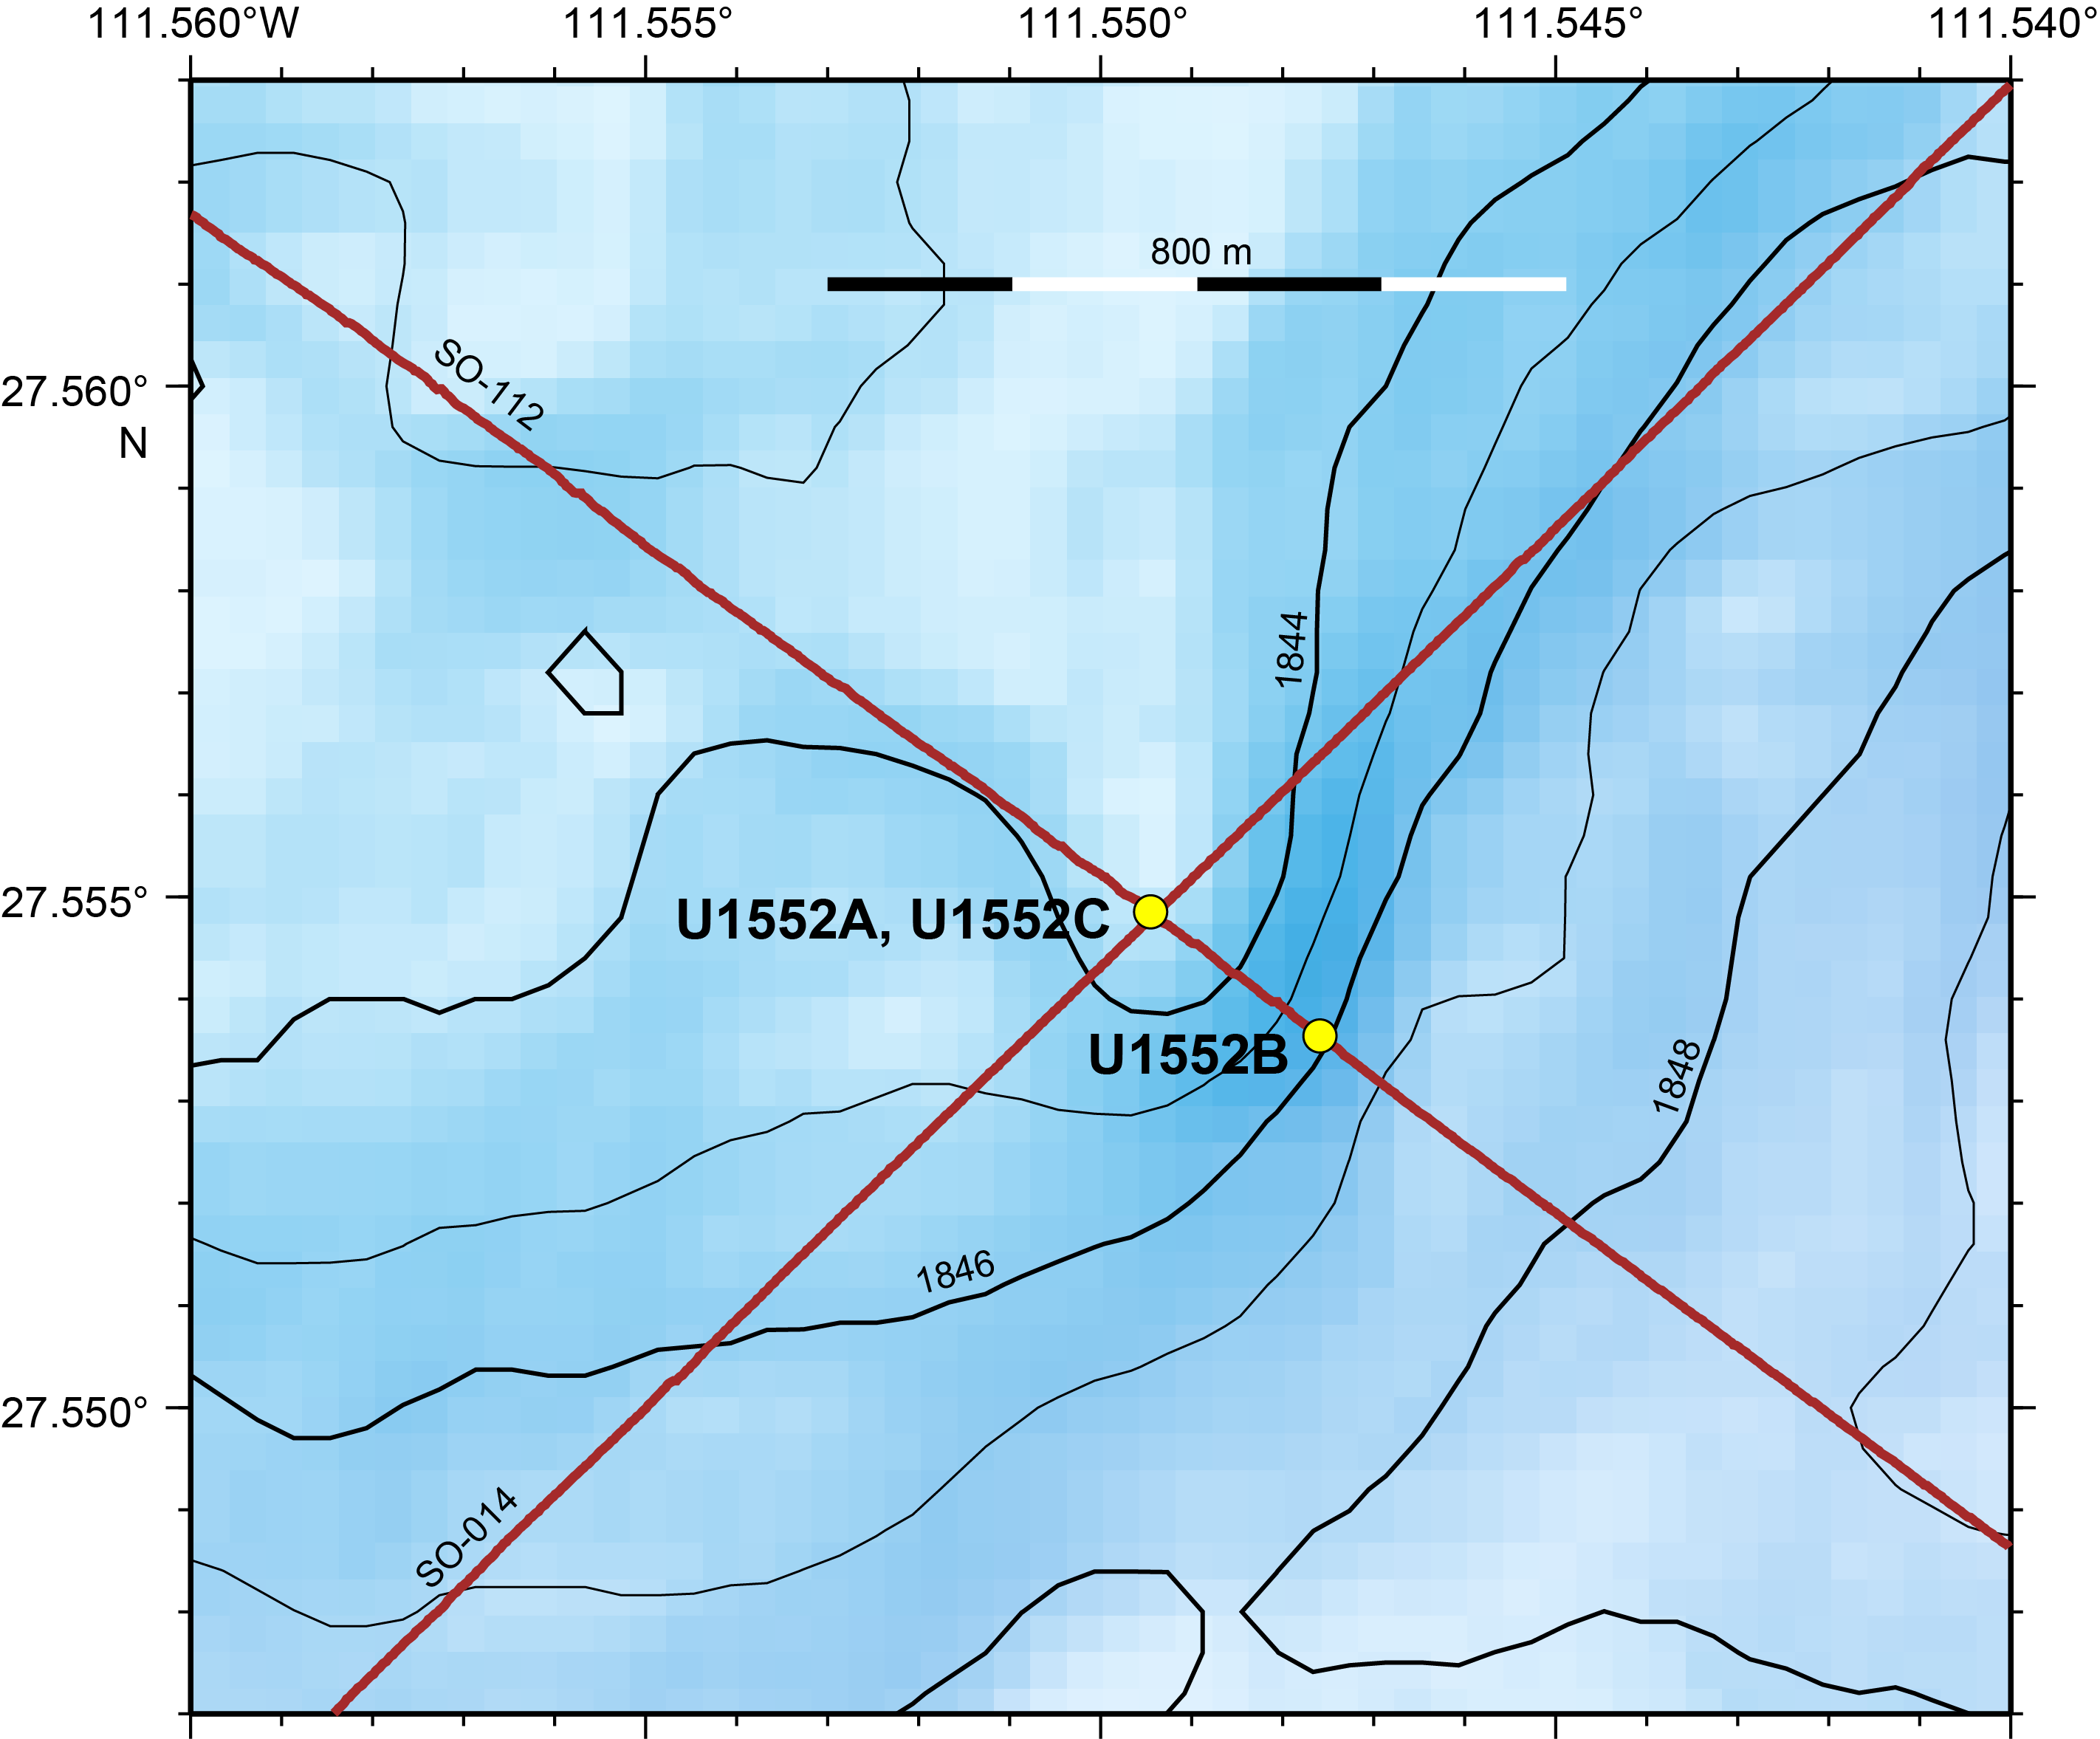
Figure F1. Bathymetric map, Holes U1552A–U1552C.
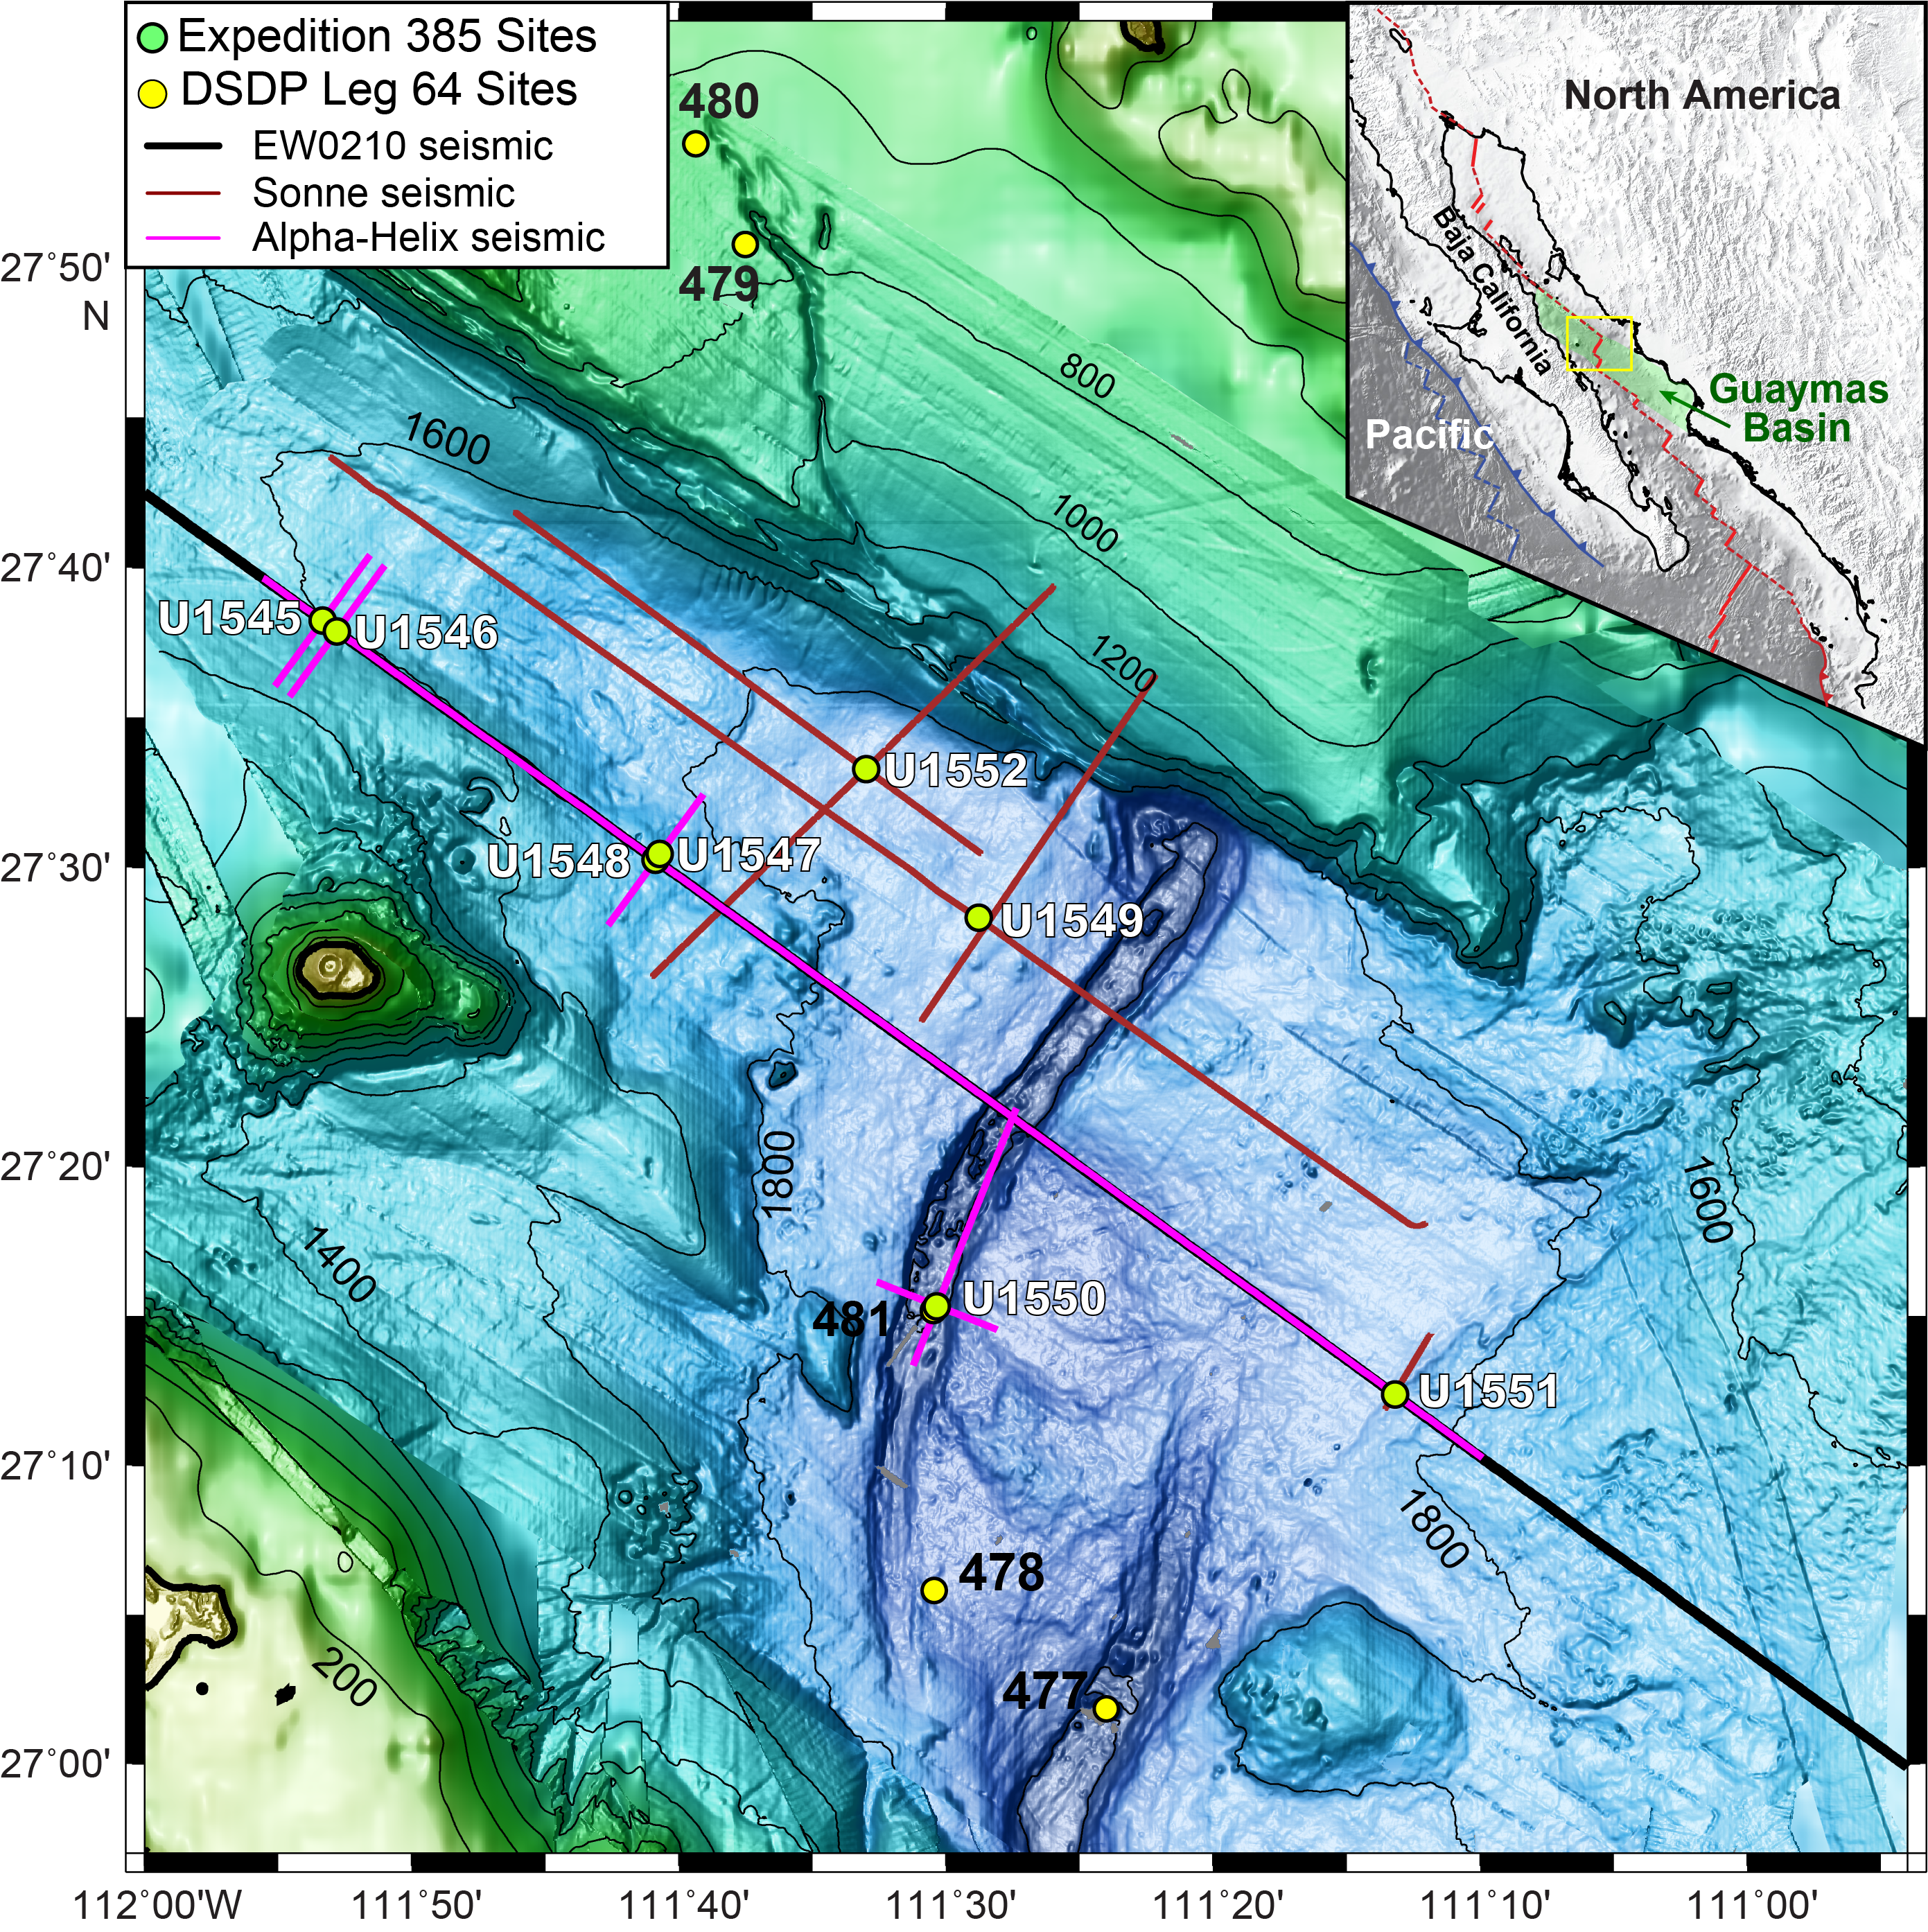
Figure F2. Bathymetric map, DSDP Leg 64 and IODP Expedition 385 sites.
1.2. Operations
We cored three holes at Site U1552. Hole U1552A is located at 27°33.2906′N, 111°32.9665′W in a water depth of 1841.6 m. In Hole U1552A, we used the advanced piston corer (APC) system to advance from the seafloor to a final depth of 107.5 mbsf with a recovery of 73.9 m (69%). We made formation temperature measurements at several depths with the advanced piston corer temperature (APCT-3) tool. In Hole U1552B, located at 27°33.2885′N, 111°32.9640′W in a water depth of 1841.1 m, APC coring penetrated from the seafloor to a final depth of 55.0 mbsf and recovered 40.0 m (73%). Hole U1552B was dedicated to extensive microbial and biogeochemical sampling that required the deployment of perfluorocarbon tracers (PFTs) downhole on all cores to monitor drilling fluid (seawater) contamination. Few cores from Holes U1552A and U1552B recovered gas hydrates. In Hole U1552C, located at 27°33.2181′N, 111°32.8557′W in a water depth of 1844.3 m, we deployed the APC system. Cores penetrated from the seafloor to a final depth of 99.3 mbsf and recovered 78.3 m (79%). A total of 32.6 h, or 1.4 days, were spent at Site U1552. Cores, penetration depths, core recovery, and the operations schedule for all holes of Site U1552 are provided in Table T1.
1.3. Principal results
1.3.1. Lithostratigraphy
The deepest hole (Hole U1552A) recovered a 105.2 m thick succession of sediments that constitute Lithostratigraphic Unit I (Figure F4). The lithologies at this site are mainly diatom clay, silty clay, and sandy silt alternating at vertical scales of meters. This alternation occurs throughout the recovered section without any specific trend or clustering of one lithology with respect to the others. Hence, only one lithostratigraphic unit was identified. Holes U1552A and U1552C have a high level of correlation observed at the scale of a single bed. The most traceable of these beds are dominated by coarse-grained siliciclastic deposits (sand and silt). The thickest beds (~5 m) exhibit scoured bases and normally graded sand that fines upward into clayey silt to silty clay. The main biogenic components in the sediment are siliceous diatoms with rare radiolarians and silicoflagellates. The silt to sand fraction mainly consists of feldspar and lithic fragments with lesser quartz, micaceous, and dense minerals. Foraminifers also are a significant component in several beds. Overall, calcareous nannofossils and foraminifers are present throughout the recovered sediments, along with organic matter and plant debris. Authigenic carbonates occur only in the upper part of the site as disseminated micrite (micrometer-sized authigenic carbonate particles) or as cements in small, sandy concretions. Fossil bivalves belonging to the Lucinidae family were observed at the uppermost part of all three holes. Holes U1552A–U1552C recovered gas hydrates from ~22–32 mbsf that decomposed quickly after the cores arrived on deck. As a consequence of hydrate dissociation and gas expansion, the sediments were often disturbed. Thus, most cores displayed gas expansion cracks and voids. Complex structures were observed in Hole U1552C, including laminated diatom clay intervals that are crosscut by gray clayey silt at high-angle contacts, which locally extend down the core as far as 1 m.
1.3.2. Structural geology
Coring at Site U1552 was intended to constrain differences in seismic reflection stratigraphy that were seen on either side of a seafloor mound. In the three holes cored, the sequence has beds that are generally horizontal, with no significant tilt domains or folded strata. However, gas hydrates that disturbed the sediments were found between ~22 and ~32 mbsf in all three holes at Site U1552. Overall, Hole U1552C revealed much more deformation than the other two holes, showing evidence for considerable injection and mobilization of sand along a high-angle conduit or clastic dike that continues through two sections of core. In some places, the clastic dike occupies a preexisting fault plane. The remobilization of sand indicates that a substantial volume of sediment may have been lost from below. Other oblique faults and fractures were found in Hole U1552C at depths below the clastic dike, and we attribute these to mechanical instability caused by the presence of gas hydrates.
1.3.3. Biostratigraphy
At Site U1552, calcareous nannofossils are well preserved and abundant to common throughout the entire sedimentary sequence, and marine diatoms are dominant/abundant to common with good/moderate preservation. No biostratigraphic datum was defined in the succession from the (Holocene? to) late to middle Pleistocene. The occurrence of calcareous nannofossil Emiliania huxleyi at the bottom of both holes dates the entire sediment sequence to (Holocene–)late–middle Pleistocene, or younger than 0.29 Ma. This age assignment is consistent with the absence of Pseudoemiliania lacunosa (last appearance datum [LAD] = 0.44 Ma) and Fragilariopsis reinholdii (LAD = 0.62 Ma) in all examined samples. The estimated average sedimentation rate is >362.6 m/My (>36.26 cm/ky).
1.3.4. Paleomagnetism
Alternating field (AF) demagnetization up to 20 mT was conducted with the superconducting rock magnetometer (SRM) on all sediment archive-half sections from Hole U1552A (Cores 1H–12H) and Hole U1552C (Cores 1H–11H). A small drilling-induced overprint was successfully removed following demagnetization. Inclination values after demagnetization at 20 mT cluster around 40° and 43° for Holes U1552A and U1552C, respectively, which is slightly lower than the expected geocentric axial dipole (GAD) inclination at the latitude of the site (~46.2°). Only the natural remanent magnetization (NRM) of archive-half sections in Hole U1552B (Cores 1H–6H) was measured. A detailed analysis of the remanence of discrete samples from Holes U1552A and U1552C shows that the drilling-induced overprint was removed by 5 mT and the characteristic remanent magnetization (ChRM) is in accordance with the SRM measurements. Thus, all Site U1552 cores were assigned to the normal Brunhes Chron C1n (younger than 0.78 Ma). The anisotropy of magnetic susceptibility (AMS) of discrete sediment samples is characterized by a mixture of prolate and oblate behavior throughout Hole U1552A.
1.3.5. Inorganic geochemistry
A total of 31 IW samples were collected from the sedimentary succession at Site U1552. Based on the sulfate profile and a slight increase of methane, the sulfate–methane transition zone (SMTZ) is estimated at 10 mbsf, one of the shallowest SMTZs encountered during this expedition. Concentrations of ammonium exceed 35 mM at 60 mbsf, and alkalinity remains at around 150 mM below 30 mbsf and peaks at 175 mM; these values are the highest recorded at any of the Expedition 385 sites. Salinity and Cl− concentrations were measured on gas hydrate–bound water from Hole U1552C. Salinity values of 2 mM and Cl− values of 10.5 mM are both depleted compared to seawater (salinity = 35 mM; Cl− = 559 mM). Thus, the dissociation of gas hydrate could cause anomalies in the retrieved IW as observed in the ~500 mM Cl− concentration at 25 mbsf from Hole U1552C. Below the SMTZ, many cation concentrations (K+, Mg2+, Ca2+, etc.) increase, except the Cl− concentration.
1.3.6. Organic geochemistry
At Site U1552, organic geochemists sampled and analyzed gas samples. In Hole U1552A, one to two headspace gas samples were analyzed per 9.5 m of advancement for routine hydrocarbon safety monitoring, and void gases were quantified and sampled for hydrocarbon content. In Hole U1552B, hydrocarbon analyses on headspace gas were performed; H2 and CO contents in headspace vials were measured; and void gases were quantified and sampled for hydrocarbons, H2, and CO contents. In Hole U1552C, hydrocarbon analyses on headspace gas were performed and void gases were quantified and sampled for hydrocarbon, H2, and CO contents as well as for shore-based analyses. Because time was running out at the conclusion of Expedition 385, no Site U1552 sediment samples were analyzed for carbon, nitrogen, or sulfur contents. Site U1552 featured the presence of gas hydrates in the sediment column between 9 and 27 mbsf. Maximum methane concentrations in headspace gas were detected in this depth interval. C2–C6 hydrocarbons were detectable at depths below ~25 mbsf without a clear trend downhole. The abundance of dissolved gas in the sediment was marked by an abundance of voids in the cores, which could represent more than 100% of the sediment recovery. Methane was dominant in these voids. H2 and CO were detected in the void gases but showed no clear trend downhole.
1.3.7. Microbiology
Site U1552 provided access to hydrate-rich sediments overlying cooler, deep sills on the northern flank of Guaymas Basin near the transition to the Sonora margin. This site presented an opportunity for microbiologists to examine microbial abundance and community structure changes throughout the gas hydrate stability zone in the sediment. Syringe samples for cell counts, 3-D structural imaging, and RNA analyses were taken on the core receiving platform, preserved or frozen, and stored for further analyses. Whole-round core samples were either stored in a −80°C freezer or temporarily stored in a 4°–8°C cold room and processed further for shore-based analyses, as described for Site U1545. Cell abundance for selected samples was determined by direct counting with an epifluorescence microscope. Cell abundance was 6.6 × 10⁶ cells/cm3 in bottom seawater and 1.2 × 10⁹ cells/cm3 in seafloor sediments. Below the seafloor, cell abundance gradually decreased to 8.1 × 10⁶ cells/cm3 at approximately 47 mbsf but remained above the detection limit of the protocol that we used for shipboard measurements of this deepest sample obtained from Hole U1552B.
1.3.8. Petrophysics
Physical properties were measured on whole-round and split-core sections. The acquired data were compared between Holes U1552A and U1552C for lithostratigraphic characterization and correlation of core description information with physical properties data. Seven in situ formation temperature measurements were taken with the APCT-3 tool to calculate the geothermal gradient (262°C/km) and heat flow (222 mW/m2). Two different intervals were identified in all petrophysical parameters. From the seafloor to ~12 mbsf and at 18–87 mbsf, density, natural gamma radiation (NGR), and magnetic susceptibility (MS) are mainly constant. Peaks observed at ~18, ~58, and ~93 mbsf show increases in density, NGR, and MS values and decreases in porosity and strength values. Porosity measured on discrete moisture and density (MAD) samples generally outlines a trend that mirrors the bulk density measurements. The shear strength regularly increases with depth. For P-wave velocity, values from 12 mbsf to the bottom of Holes U1552A and U1552C predominantly show an erratic pattern typically related to voids and cracks in the cores.
2. Background and objectives
Site U1552 (proposed Site GUAYM-10B) is located at 27.5548°N, 111.5494°W, ~20 km northwest of the axial graben of the northern Guaymas Basin spreading segment (Figure F2). This site is adjacent to a mostly buried mound structure imaged by seismic data (Figure F3) showing a pipe-like blanked zone extending beneath the mound toward the southeast edge of an interpreted sill intrusion at ~3.15 s two-way traveltime (TWT) (~700 mbsf). Another blanked zone is seen extending upward from the northwest edge of the interpreted sill near Common Depth Point (CDP) 7950. Deep-tow sidescan sonar backscatter data and seafloor photography from the research vessel Atlantis Leg AT15-54 show that Site U1552 is situated ~200 m south of an active seep area with typical cold-seep seafloor communities (e.g., tube worm colonies and mats of benthic polychaetes) and ~800 m southeast of a second, similar seep site located near CDP 7950 (Lizarralde et al., 2011). Hole U1552A is sited sufficiently close to the pipe structure to enable direct sampling of expected massive hydrate deposits. The base of the gas hydrate stability zone is discernible southeast of the pipe structure as a change in reflectivity that crosscuts strata (dashed line in Figure F3), but it is not apparent to the northwest.

Figure F3. Seismic Line SO-112 with sill intrusion.
As at Site U1549, the association of a relatively deep sill, gas hydrates, and nearby seafloor communities connects multiple components of the carbon budget of an active system that is influenced or possibly driven by a deep sill. The primary objectives for Site U1552 are thus to characterize the physical, chemical, and microbial properties of this setting and to assess the influence of the deep sill on pore water chemistry and gas hydrate stability; the role of gas hydrates as a carbon storage buffer; the persistence of permeable pathways created during sill emplacement and their possible continued role in advective transport of fluids and gas; and the extent of lateral gradients away from the pipe structure.
3. Operations
3.1. Site U1552
Site U1552 consists of three holes situated around a gas pipe structure of an active seep area. The original plan for this site was to drill two holes, each using the APC system to 150 mbsf and the extended core barrel (XCB) system to 200 mbsf. The first hole would be dedicated to lithologic and pore water analysis, and the second hole would focus on microbiology and biogeochemical sampling. Actual operations proved different from the plan. Hole U1552A was cored with the APC system to 107.5 mbsf, which somewhat exceeded the new target depth of 100 mbsf that was set given the limited amount of time remaining at the end of the expedition. Nearby Hole U1552B was APC cored to 55.0 mbsf and dedicated to intense microbiology sampling. Hole U1552C was established diametrically opposed to Holes U1552A and U1552B on the other side of the gas pipe to investigate the depth distribution of gas hydrates that had already been recovered in the other two holes. Hole U1552C was APC cored to 99.3 mbsf, reaching the target depth of ~100 mbsf. In total, 32.6 h, or 1.4 days, were spent at Site U1552.
3.1.1. Hole U1552A
Upon completing operations at Site U1548, we began to move the vessel in dynamic positioning (DP) mode to Site U1552 at 1715 h on 8 November 2019. We arrived at Site U1552, located ~22 km northwest of the northern axial graben of Guaymas Basin, at 0200 h on 9 November. The drill string with the APC system was lowered to the seafloor, and at 0315 h, we deployed the subsea camera to conduct a survey of the seafloor. The survey did not find any vent communities. Upon retrieving the subsea camera by 0615 h, we picked up the top drive and spudded Hole U1552A at 0730 h on 9 November. Mudline Core 385-U1552A-1H recovered 3.1 m and established a seafloor depth of 1841.6 meters below sea level (mbsl). Cores 1H–12H penetrated from the seafloor to a final depth of 107.5 mbsf and recovered 73.9 m (69%) (Table T2). Gas hydrates were recovered in Core 4H. The APCT-3 tool was deployed to make formation temperature measurements on Cores 4H, 7H, 10H, and 12H. The latter core reached the target depth objective, which led to termination of coring. We pulled the drill string out of the hole, and the bit cleared the seafloor at 1547 h on 9 November, ending Hole U1552A. The time spent in Hole U1552A was 13.7 h, or 0.6 days.
3.1.2. Hole U1552B
We then shifted the vessel to Hole U1552B to recover cores for extensive microbiology and biogeochemistry sampling. Hole U1552B was spudded at 1620 h on 9 November 2019. Mudline Core 385-U1552B-1H recovered 7.6 m and determined a seafloor depth of 1841.1 mbsl. Cores 1H–6H penetrated from the seafloor to a final depth of 55.0 mbsf and recovered 40.0 m (73%) (Table T2). Gas hydrates were recovered in Cores 4H and 5H. Upon accomplishing the target depth and microbial sampling objectives, coring was terminated after recovering Core 6H. We pulled the drill string out of the hole, and the bit cleared the seafloor at 1957 h, ending Hole U1552B. The total time spent in Hole U1552A was 4.3 hours, or 0.2 days.
3.1.3. Hole U1552C
After moving the vessel to the Hole U1552C coordinates, we positioned the bit above the seafloor to start coring the final hole of Expedition 385. We spudded Hole U1552C at 2037 h on 9 November 2019. Mudline Core 385-U1552C-1H recovered 4.4 m and established a seafloor depth of 1844.3 mbsl. Cores 1H–11H penetrated from the seafloor to a final depth of 99.3 mbsf and recovered 78.3 m (79%) (Table T2). Gas hydrates were recovered in Core 4H. We made formation temperature measurements with the APCT-3 tool on Cores 4H, 7H, and 10H. Upon accomplishing the target depth objective, coring was terminated after recovering Core 11H. We pulled the drill string out of the hole, and the bit cleared the seafloor at 0545 h and arrived at the rig floor at 1045 h on 9 November, ending Hole U1552C and Site U1552. This concluded Expedition 385 coring operations. A total of 14.6 h, or 0.6 days, were spent in Hole U1552C. We then disassembled the bottom-hole assembly (BHA) and cleared the rig floor. The next 11.25 h were spent laying out 43 stands of drill pipe (129 joints) to the riser hatch. Upon securing the vessel for transit, we switched from DP to cruise mode at 2235 h. We began our sea passage back to San Diego, California (USA), at 2300 h on 9 November and completed the 1191 nmi voyage at an average speed of 10.4 kt at 1724 h on 15 November with the first line ashore at Tenth Avenue Marine Terminal in the port of San Diego, ending Expedition 385.
4. Lithostratigraphy
Site U1552, located in the deeper (water depth = ~1840 m) and more central part of Guaymas Basin near the Sonora margin, provides additional information on the history of basin sedimentation and methanogenesis near a methane-rich cold-seep mound (Teske et al., 2018). Three holes were drilled at Site U1552, recovering a stratigraphic succession of sediments that constitute lithostratigraphic Unit I and, as discussed below, did not warrant further division into subunits (Figure F4). Hole U1552A was drilled to 107.5 mbsf and a total curated depth of 105.2 mbsf; Hole U1552B was drilled to 55.0 mbsf and a total curated depth of 52.21 mbsf; and Hole U1552C was drilled to 99.3 mbsf and a total curated depth of 98.38 mbsf. Lithostratigraphic description was carried out based on the curated depth of the cores. Hence, all references to depths in the text, figures, and tables represent core depth below seafloor, Method A (CSF-A), and use mbsf as the unit of measure. The quality of the lithostratigraphic analysis depended on the quantity and the quality of the cores recovered, which in turn were partially a function of the lithologies encountered. The coring tool used for Site U1552 was the full-length APC tool (core designator H). Although the quality of core obtained using piston coring was very good, significant gas expansion disrupted the core in many sections and resulted in “extruded” material, often included as a shorter Section 1.

Figure F4. Lithologic summary, Site U1552.
Lithologic description at Site U1552 was based on combining the visual description of the cores and the results of the petrographic analyses of smear slides. Measured physical properties such as MS, NGR, and color reflectance were also used to aid with the interpretation of the cores and compared to the lithologic data (Figure F4). Holes U1552A and U1552C provided the most complete and the deepest recovered record for this site. Hole U1552B, located just 5 m away from Hole U1552A, consisted of a few (n = 6) cores aimed at retrieving gas hydrates, so it was heavily sampled prior to sediment description. Numerous whole-round core samples were collected for microbiology and geochemistry analyses (Figure F4) (see Microbiology, Organic geochemistry, and Inorganic geochemistry). Hence, most of the lithologic observations and the depths of lithologic changes used in this report refer to Holes U1552A and U1552C, and the lithologic column is based on Hole U1552A.
4.1. Unit descriptions
4.1.1. Lithostratigraphic Unit I
- Intervals: 385-U1552A-1H-1, 0 cm, to 12H-CC, 22 cm; 385-U1552B-1H-1, 0 cm, to 6H-CC, 19 cm; 385-U1552C-1H-1, 0 cm, to 11H-CC, 23 cm
- Depths: Hole U1552A = 0–105.2 mbsf, Hole U1552B = 0–52.21 mbsf, Hole U1552C = 0–98.38 mbsf
- Thickness: Hole U1552A = 105.2 m, Hole U1552B = 52.21 m, Hole U1552C = 98.38 m
- Age: (Holocene? to) late to middle Pleistocene
- Lithology: clay-rich diatom ooze, diatom clay, micrite-bearing diatom clay, clay, silty clay to clayey silt, silt, and sand
Lithostratigraphic Unit I is composed of a 105.2 m thick sequence of upper to middle Pleistocene sediments. The lithology recovered at this site shows prominent downhole variability and contains four main lithologic types alternating at vertical scales of meters: diatom clay, clay-rich diatom ooze, silty clay, and sandy silt. Lithologic alternations occur throughout the recovered sections without any specific trend or clustering of one lithology with respect to the others. Also, there is no apparent diagenetic modification of the sediments (e.g., occurrence of authigenic carbonate) to warrant subunit designations used at previous sites. Hence, description of this site is based only on one lithostratigraphic unit without any further division. Holes U1552A and U1552C, the most complete and deepest holes, show a high level of correlation that can be observed at the scale of a single bed. The most traceable of these beds are dominated by coarse-grained siliciclastic deposits (sand and silt). Clay minerals and subordinate diatoms occur either mixed or in homogeneous layers. The two thickest depositional units characterized by normal graded bedding and scoured bases were correlated among the three holes (Depositional Units T1 and T2; Figure F4).
For all three holes at Site U1552, Core 1H includes fossil bivalves belonging to the Lucinidae family, which hosts sulfur-oxidizing symbionts capable of chemosynthesis. The shallowest and only occurrence of authigenic carbonates was found in Cores 385-U1552A-2H and 385-U1552C-2H as scattered micrite (micrometer-sized authigenic carbonate particles), generally <5%, in diatom clay. Carbonate also locally occurs as cement forming sandstone nodules at ~16 mbsf in Hole U1552A and deeper, at ~26.2 mbsf, in Hole U1552B.
For Holes U1552A–U1552C, the sediment from Core 4H contained gas hydrates that decomposed quickly after the core arrived on deck. As a consequence of hydrate dissociation and gas expansion, the sediments were often disturbed, and most cores displayed gas-expansion cracks and voids throughout the drilled sections in all holes at Site U1552 (Figure F5A).
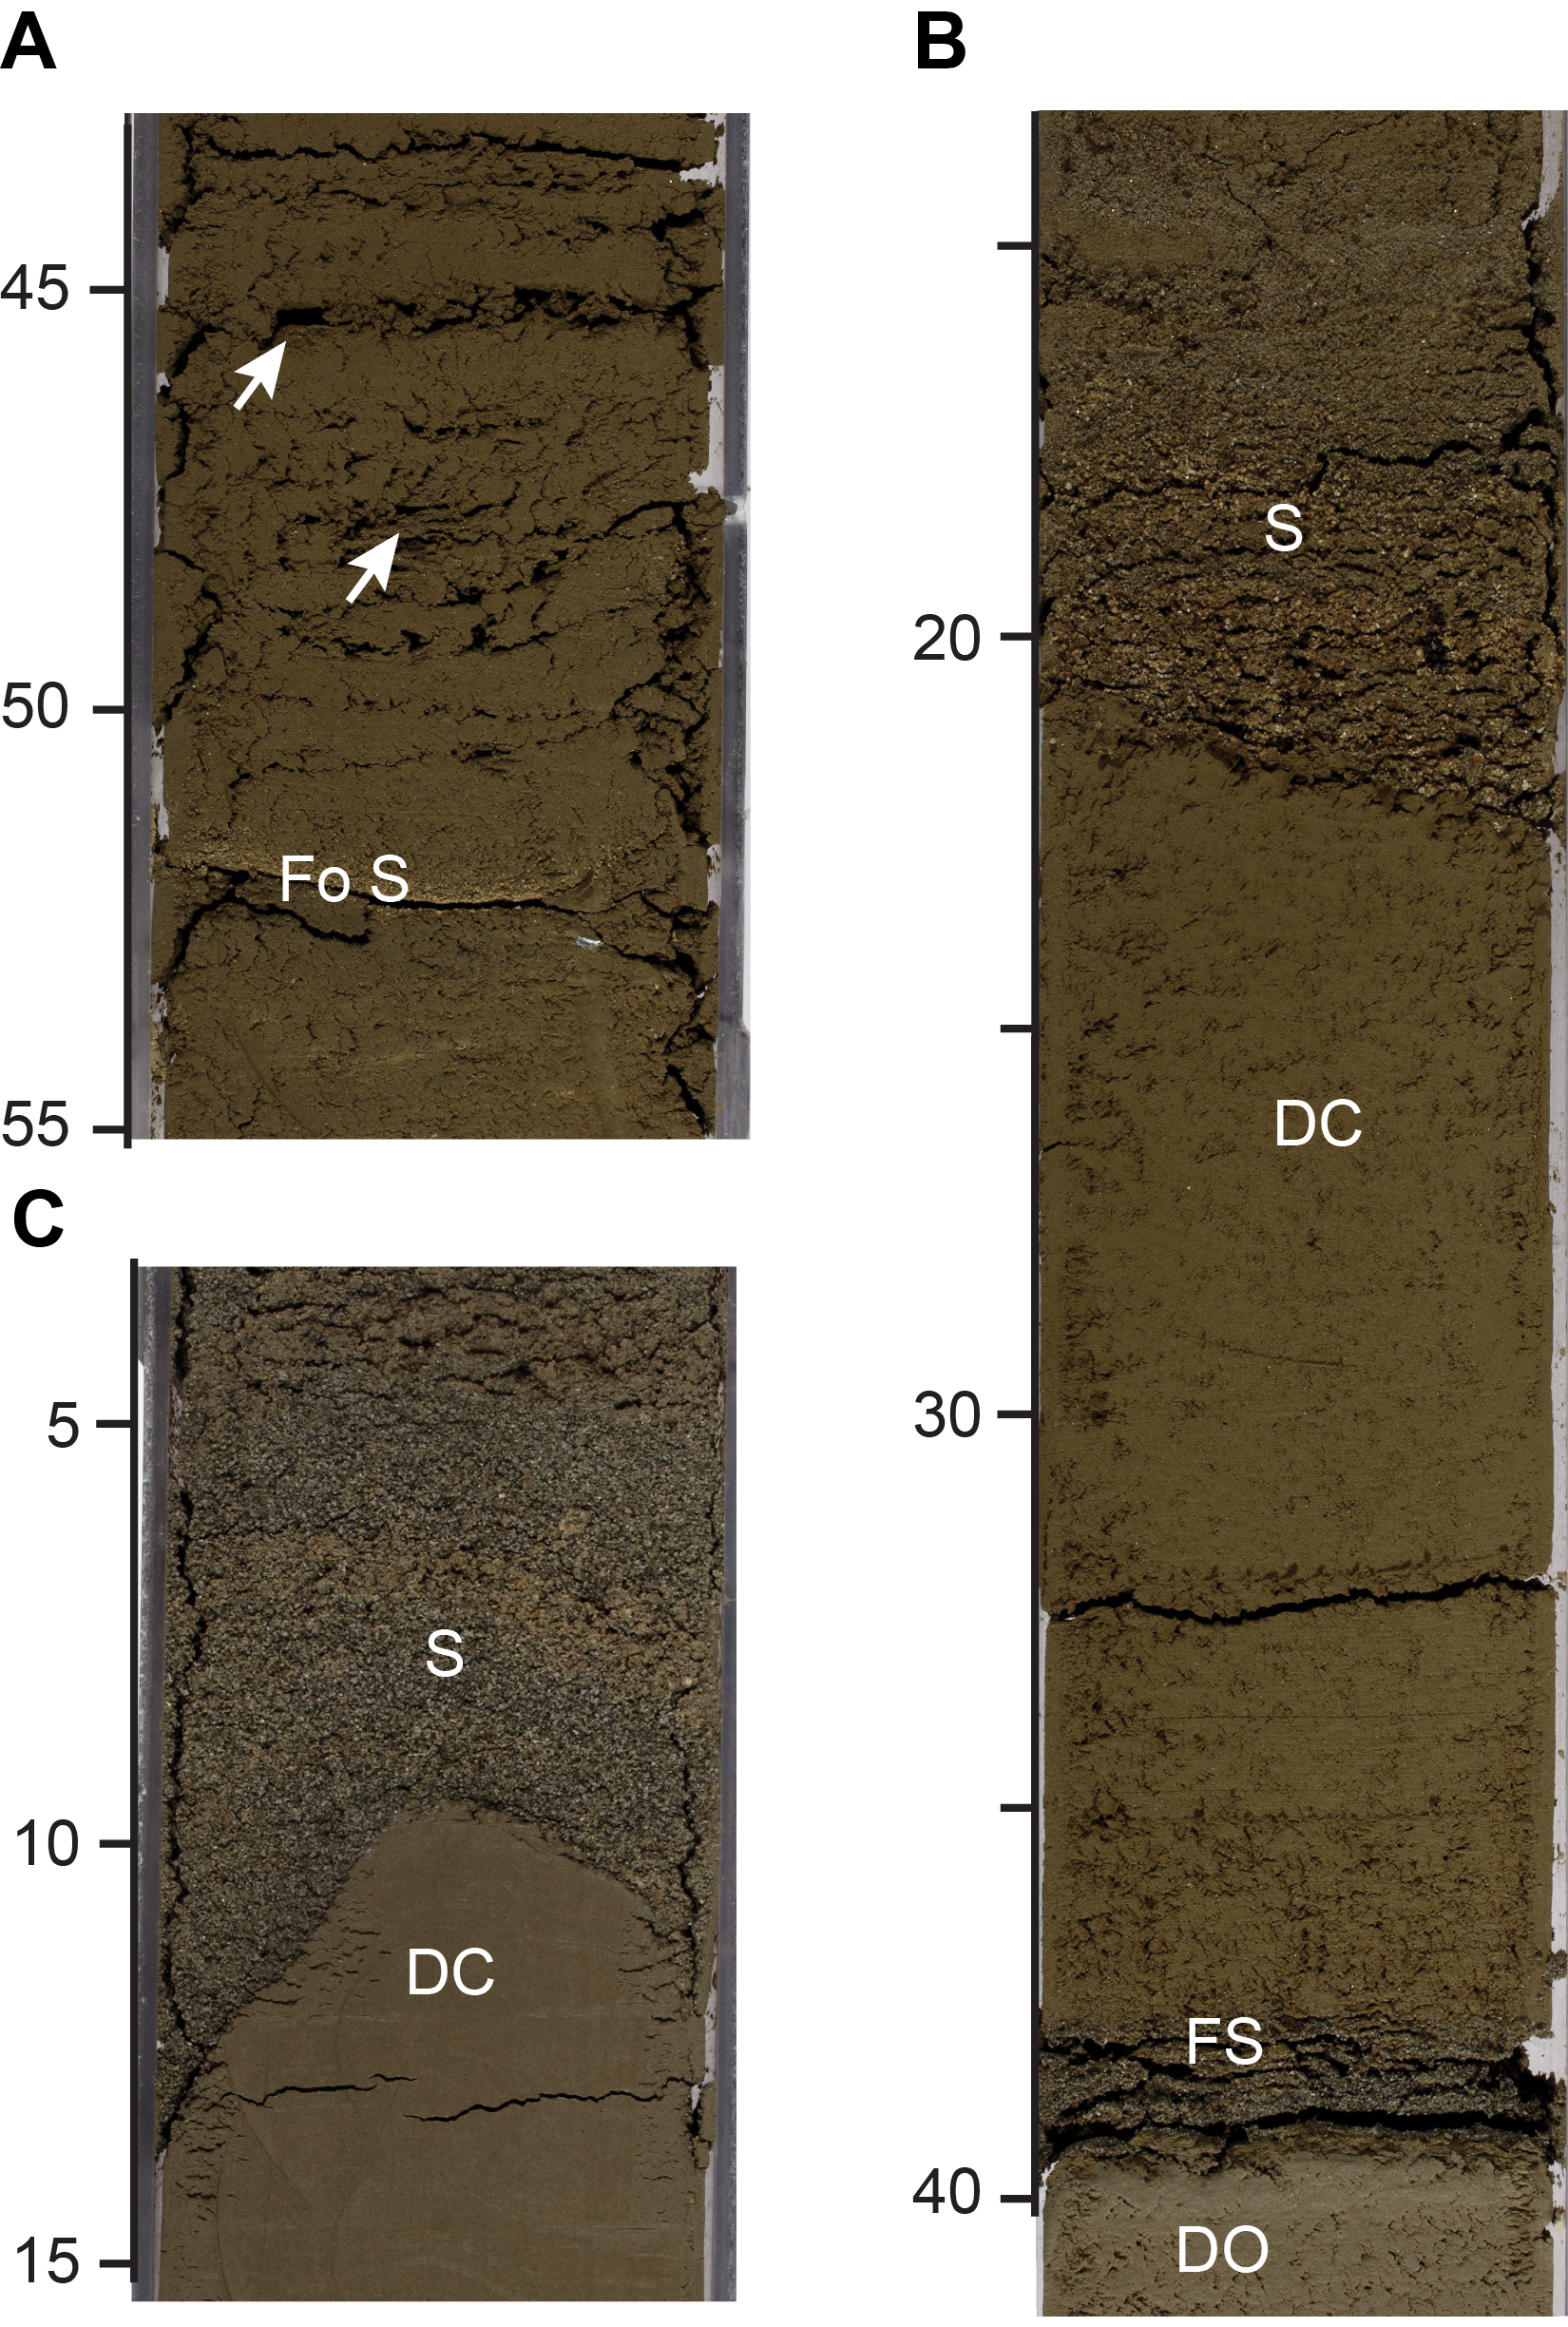
Figure F5. Sand layers, Unit I.
Two thicker (~5 m) depositional units composed of normally graded sand and silt overlain by clayey silt and silty clay are present: (1) an upper unit (T1) in Cores 385-U1552A-2H and 3H, 385-U1552B-2H (Figure F6), and 385-U1552C-3H and (2) a lower unit (T2) in Sections 385-U1552A-10H-4 through 11H-1 (~82.1–89.9 mbsf) and 385-U1552C-10H-6 through 11H-4 (~86.8–95.3 mbsf). Thinner and finer grained versions of these normally graded units are present elsewhere in the core, roughly 50% ranging from 1 to 10 cm thick, 25% ranging from 10 to 20 cm thick, and 25% ranging from 20 to 30 cm thick (Figure F5). These thinner siliciclastic beds are spread throughout Unit I, totally absent in only a few cores (e.g., Core 385-U1552A-12H) and making up <5% of Cores 2H, 4H, 6H, and 9H. There is a notable concentration of thin siliciclastic beds in Core 7H, roughly midway between the two thicker beds; the core contains 16% terrigenous intervals in ~10 beds ranging from 4 to 30 cm, plus some additional <1 cm thin sandy laminae. Some of the sandy bases of these siliciclastic beds are rich in foraminifers, and there are often one or two laminae of foraminifer sand or silt per core (Figure F5A).
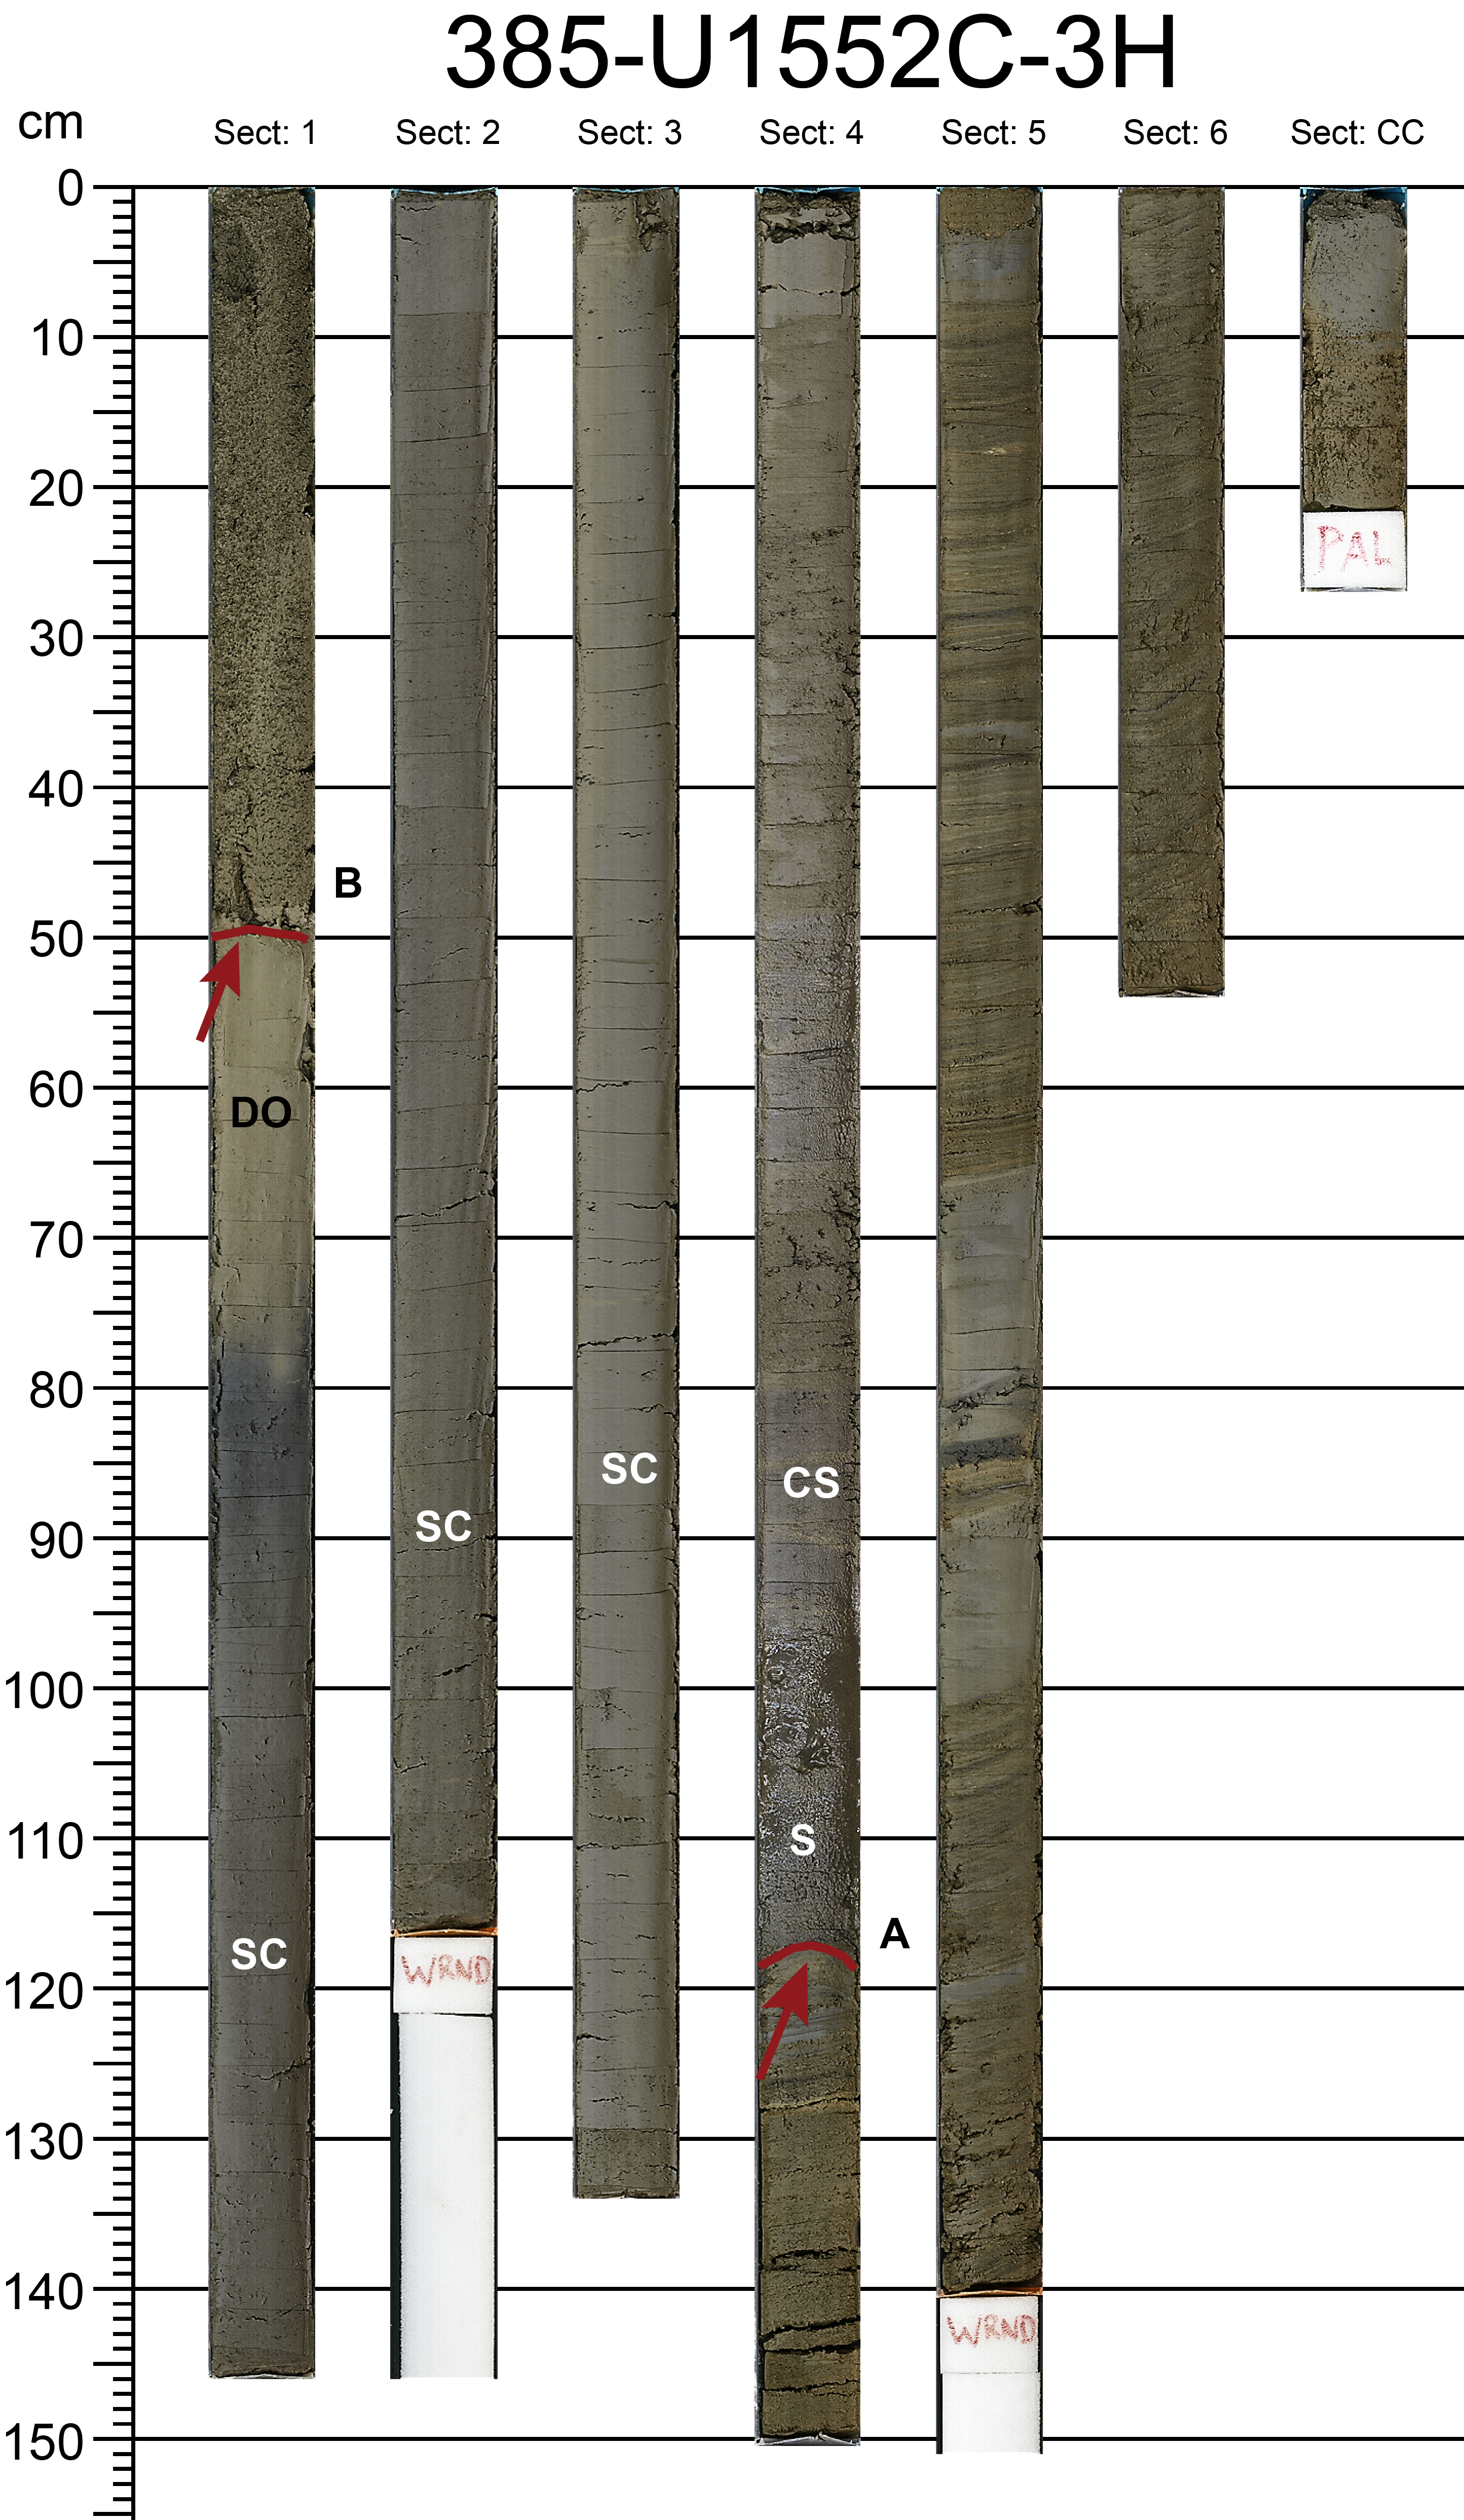
Figure F6. Depositional units, Section 385-U1552C-3H.
Smear slide analysis shows that the silt to sand fractions mainly consist of feldspar and lithic fragments with lesser quartz, dense, and micaceous minerals; foraminifer tests are significant components in several beds. The main biogenic components comprising the siliceous ooze to diatom clay intervals are siliceous diatoms with rare radiolarians and silicoflagellates. Calcareous nannofossils and foraminifers are present in almost every smear slide, along with organic matter and plant debris. There is unusually dark diatom clay in Sections 385-U1552A-7H-4 and 385-U1552C-7H-6 that may contain microbially formed sulfide minerals (e.g., greigite; see Paleomagnetism).
Hole U1552C displays some specific features that are absent from otherwise correlative sections in Hole U1552A. In Section 385-U1552C-7H-6, laminated diatom clay is crosscut by gray clayey silt along a high-angle contact (Figure F7). The clayey silt layer extends down the core for about 1 m. In Section 7H-5, the boundary with the overlying diatom clay also displays a high-angle contact. A vein of clayey silt and sand is observed extending up from the top of this contact. Other disrupted contacts between the background (host) sediment and sand layers were observed in Sections 8H-3 and 8H-7.

Figure F7. Sediment variation, Core 385-U1552C-7H.
4.2. Discussion
Site U1552 was drilled in a setting similar to that of Site U1549 that resembles the former in terms of a very low percentage of laminated biogenic sediment. We interpret the same pelagic to hemipelagic processes (anoxic to suboxic conditions) to have created laminated intervals at Site U1552, as well as homogenization through bioturbative mixing below the oxygen minimum zone. In contrast to Site U1549, there are few homogeneous mixed biogenic (diatom ooze cap) and siliciclastic beds and a larger abundance of gray terrigenous units. These can be attributed to slope instability in this tectonically active basin, with terrigenous input from Sonoran rivers like the Yaqui or runoff from Baja California. The gray depositional units locally show scoured bases, normal grading, and upward fining. These elements represent distinctive sedimentological characteristics of sediment gravity flows (mass flows) potentially triggered by earthquake destabilization of steep slopes and/or enhanced river discharge resulting from large storms (Barbara et al., 2016; Silverberg et al., 2007). The subvertical features that crosscut the stratigraphy in Section 385-U1552C-7H-6 are interpreted to be sediment-injection features, specifically clastic dikes because of their high angle with respect to the observed bedding. The presence of these injection features, disruptions from gas hydrate dissociation, and significant whole-round sampling of the core made detailed correlation among the three holes at Site U1552 difficult except for the distinctly thicker beds (gravity-flow deposits) shown as Depositional Units T1 and T2 in Figure F4.
5. Structural geology
Holes U1552A–U1552C penetrated Lithostratigraphic Unit I, recovering a layered sedimentary sequence of diatom ooze, diatom clay, sand, and silt to 107 mbsf. The sequence was not divided into subunits. Coring here was intended to help compare differences in seismic stratigraphy that were seen on either side of a cold-seep mound. There were unexpected complications in sampling because of the presence of unstable gas hydrates that caused gas release from the core, as well as the loss of part of the core on the rig floor and another core barrel that came back empty (Core 385-U1552A-8H).
For all cores, structures were measured and/or described from the archive-half sections of the cores as well as high-resolution photographs of visible light. Also, X-ray images were used for Hole U1552A and part of Hole U1552C.
5.1. Sedimentary units
Structural information was obtained from sedimentary units in each of the three holes at Site U1552. Holes U1552A and U1552C were lithologically more complete and reached 107 mbsf and 99 mbsf, respectively. However, Core 385-U1552A-8H returned an empty core barrel, causing a stratigraphic gap that made it more challenging to correlate the strata from Hole U1552A to the other holes. In Hole U1552B, only six cores were drilled, and the sections removed for microbiological sampling were not available for structural/stratigraphic characterization or imaging.
Bedding and lamination in the recovered sediments and sedimentary rocks are similar to those described for Sites U1545–U1550. The packages of laminae and other bedding indicators in all three holes show that the entire sequence is generally horizontal and has no significant tilt domains or folded strata. However, Hole U1552C provides evidence for considerable injection and mobilization of sand along a high-angle conduit or clastic dike (Figures F7, F8, F9). Although a few strata can be correlated among the three drill holes in this region, the remobilization of sand indicates that a substantial volume of sediment may have been lost from below. The clastic dike appears to follow a fault in some parts of the core, but in other places it is not associated with any fault displacement. In a few cases, it appears to bifurcate or follow a curved path.
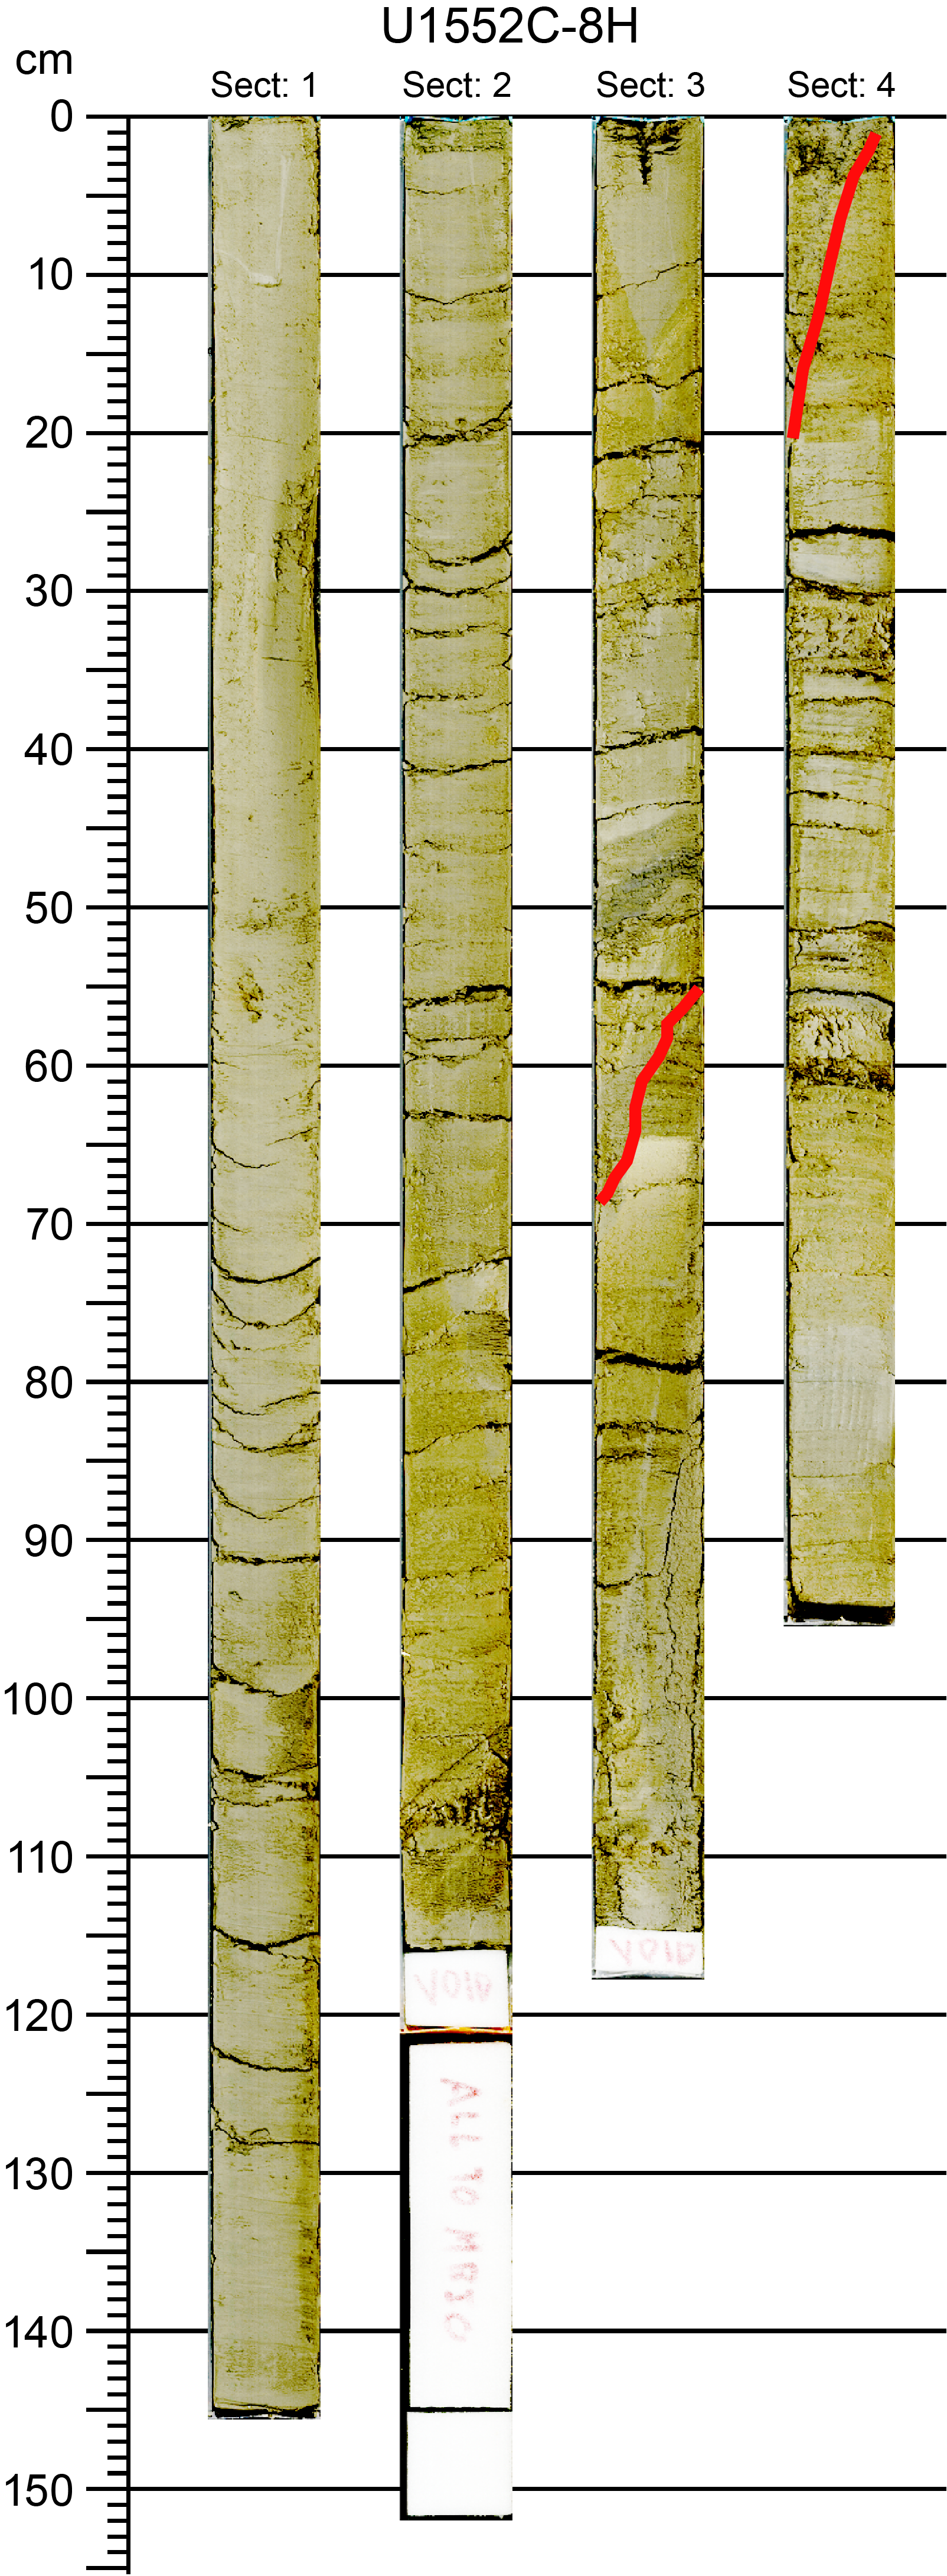
Figure F8. Faulting and sediment injection, Core 385-U1552C-8H.
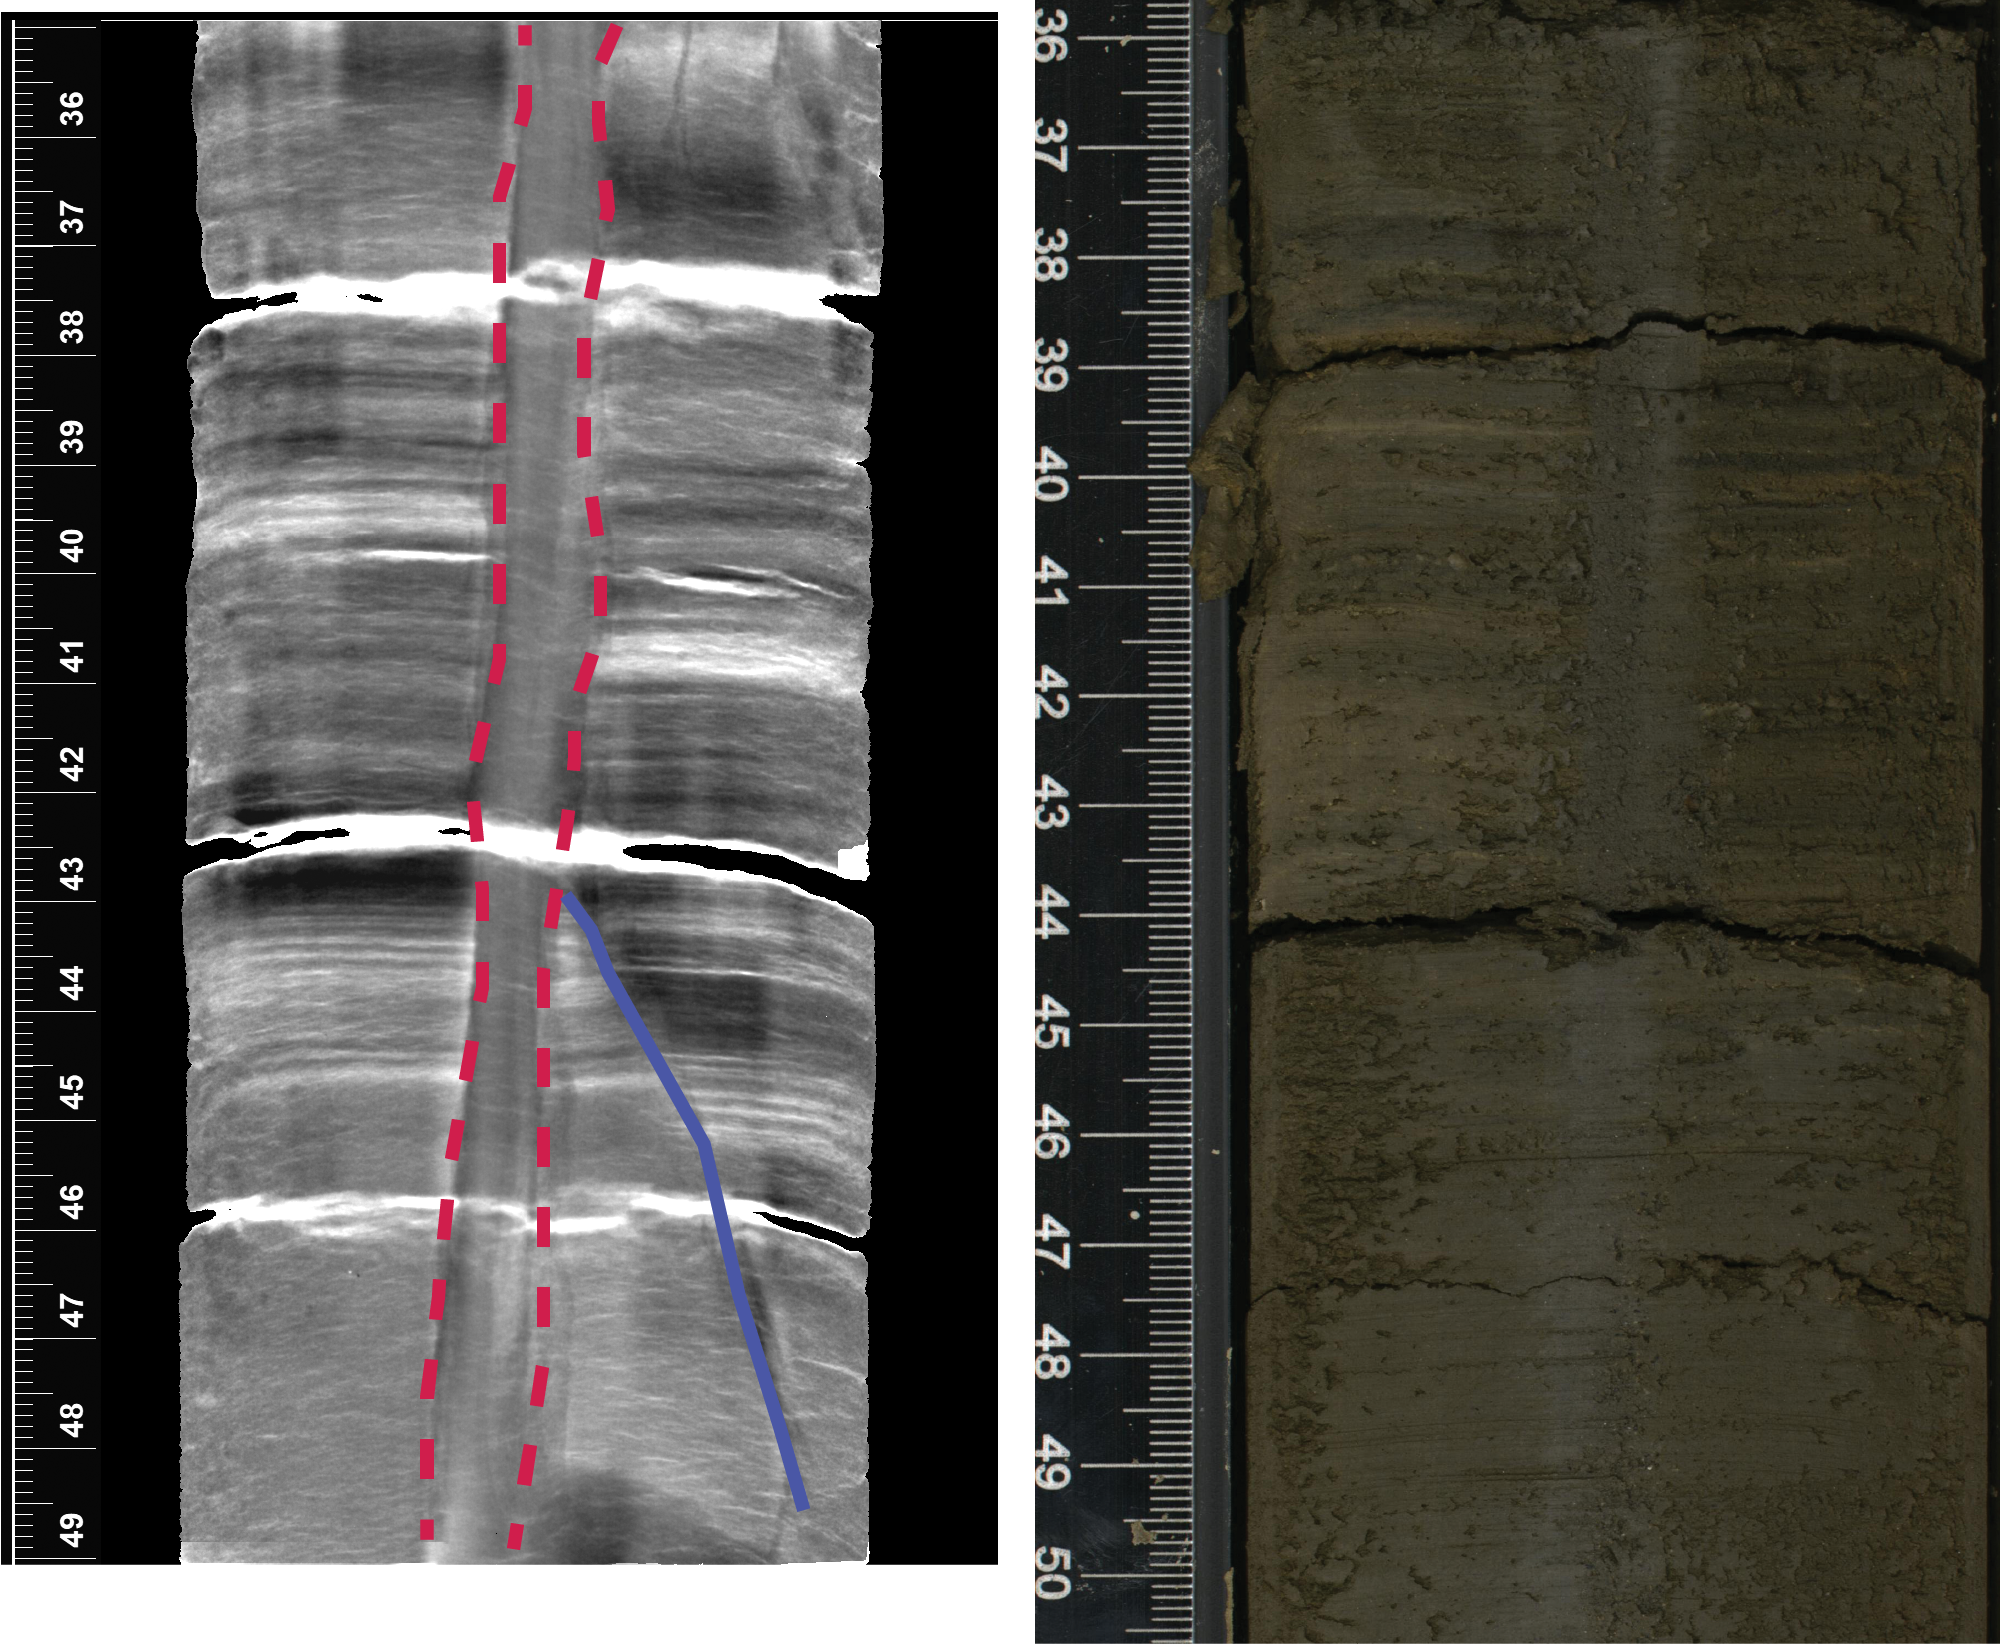
Figure F9. Clastic dike, Section 385-U1552C-7H-5.
5.2. Brittle fractures and faults
For Site U1552, identified faults were measured on the split core surfaces of archive-half sections. The strikes of the faults are not known because the geographic direction relative to the core axis is not constrained. The fault patterns are quite different in each hole. Hole U1552C revealed much more deformation than the other two holes. In Hole U1552C, a single fracture set is nearly vertical and continues for about 1 m between 69 and 67 mbsf (Sections 8H-6 and 8H-7). Other oblique faults and fractures were found at shallower depths in this hole at distinct orientations, indicating that the deformation here varies on a local scale both horizontally and vertically.
6. Biostratigraphy
Smear slides made from core catcher samples from Holes U1552A (3.02–105.15 mbsf) and U1552C (4.31–98.33 mbsf) were analyzed for calcareous nannofossils and marine diatoms to identify and constrain possible biostratigraphic events (Tables T3, T4).
No biostratigraphic datum was defined in the succession from the (Holocene? to) late to middle Pleistocene (Table T5). The occurrence of E. huxleyi in the bottom samples of both holes dates the entire sediment sequence at Site U1552 to younger than 0.29 Ma (Hole U1552A = 0–105.15 mbsf; Hole U1552B = 0–98.33 mbsf). This age assignment is consistent with the absence of P. lacunosa (LAD = 0.44 Ma) and F. reinholdii (LAD = 0.62 Ma) in all samples examined. The estimated average sedimentation rate is greater than 362.6 m/My (>36.26 cm/ky) (Figure F10).
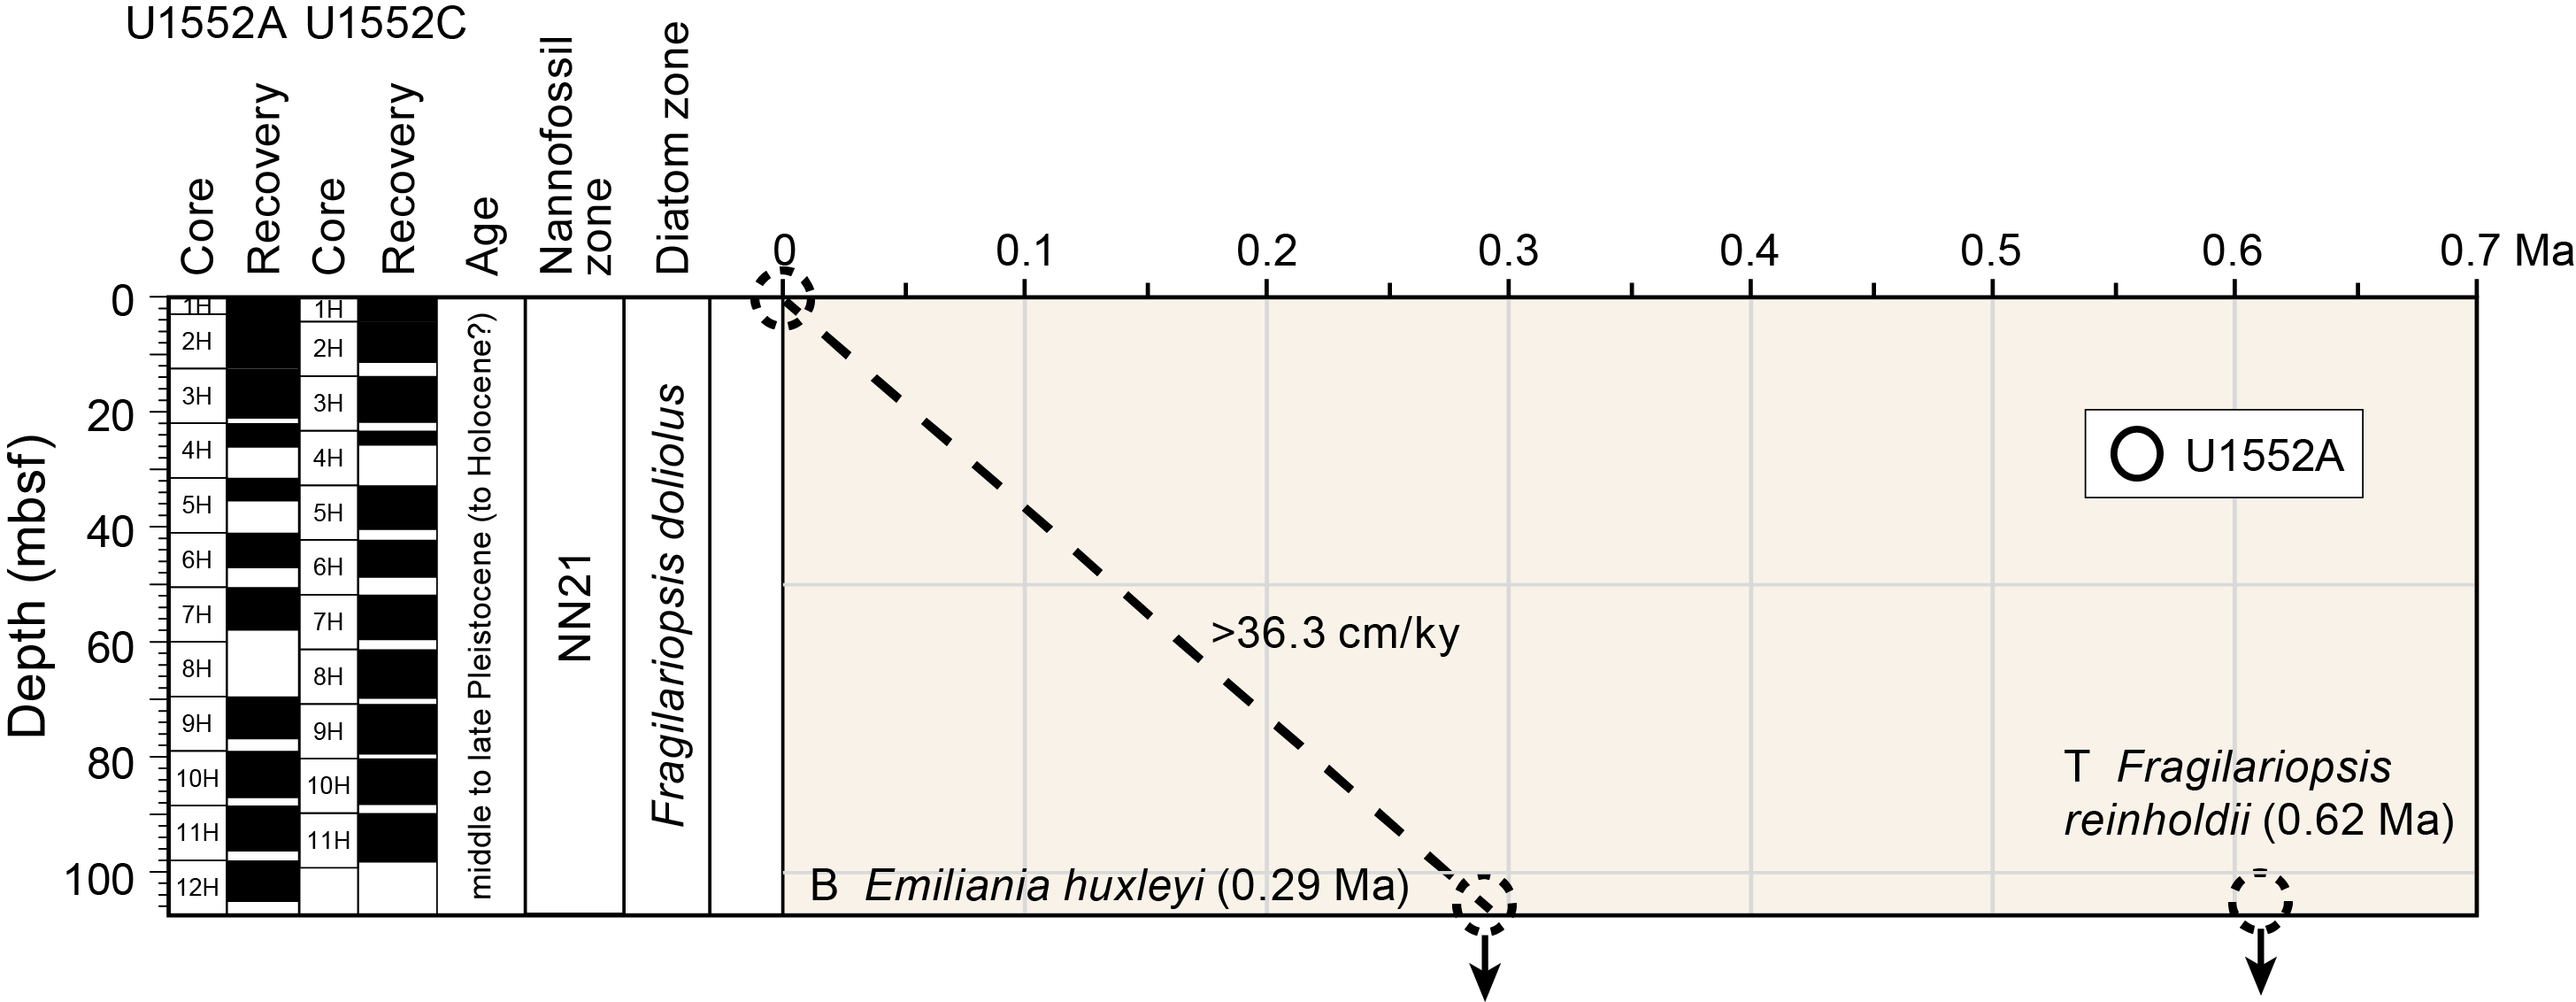
Figure F10. Age-depth plot, Site U1552.
6.1. Calcareous nannofossils
Calcareous nannofossil abundances are abundant or common, and they are generally well preserved throughout the entire sampled sequence at Site U1552 (Table T3).
Reworked Cretaceous and Miocene taxa can be found throughout Holes U1552A and U1552C. The origin of reworked nannofossils is uncertain, with possible sources pointing to Cretaceous outcrops in the Colorado River catchment, Cretaceous chalk deposits underlying the Sierra Madre Occidental orogen, and Miocene marine strata on Isla Tiburón (McDougall and Martínez, 2014; Helenes et al., 2009). The source and environmental implications of deposition of reworked material will be analyzed in detail during postexpedition research.
The sediment sequence from Holes U1552A and U1552C is assigned to Nannofossil Zone NN21 based on the presence of E. huxleyi in all samples from both holes. The corresponding nannofossil biostratigraphic datum, the first appearance of E. huxleyi (0.29 Ma), was not observed and is therefore estimated to occur below the drilled bottom of Holes U1552A and U1552C (Table T3), indicating an age younger than 0.29 Ma for the sediment successions intersected in both holes.
6.2. Diatoms
Marine diatoms vary between dominant, abundant, and common and have good and moderate preservation in Hole U1552A; in Hole U1552C, they vary between abundant and common and have moderate preservation (Table T4).
No age-diagnostic diatoms were found in either Hole U1552A or Hole U1552C, which indicates an age younger than 0.62 Ma, consistent with the top of F. reinholdii (Table T4).
7. Paleomagnetism
Paleomagnetic shipboard measurements included the analysis of the NRM and its demagnetization on archive-half sections and discrete samples from Holes U1552A and U1552C to establish a magnetostratigraphy for the site. Representative discrete samples were collected from APC cores (one sample per core when possible). Only NRM measurements were conducted on archive-half sections from Hole U1552B, located 5 m away from Hole U1552A. Because Hole U1552B recovered six cores only designated for microbiology and geochemistry sampling, data from this hole are not presented here.
7.1. Archive-half section analysis
Archive-half sections from Holes U1552A (Cores 1H–12H) and U1552C (Cores 1H–11H) were demagnetized at 5 cm intervals up to 20 mT. In-line AF demagnetization indicates a drilling overprint that was removed by an AF demagnetization treatment of 5–10 mT (Figures F11A, F12A). After AF demagnetization at 20 mT, inclinations for APC cores have average values of ~40° and ~43° for Holes U1552A and U1552C, respectively. Inclination values cluster around the expected GAD inclination value at the latitude of the site (~46.2°) (Figures F11B, F12B). Negative inclinations are likely related to gas expansion due to the presence of methane hydrates (recovered in Core 4H in both holes) and free gas below the base of the gas hydrate stability zone.
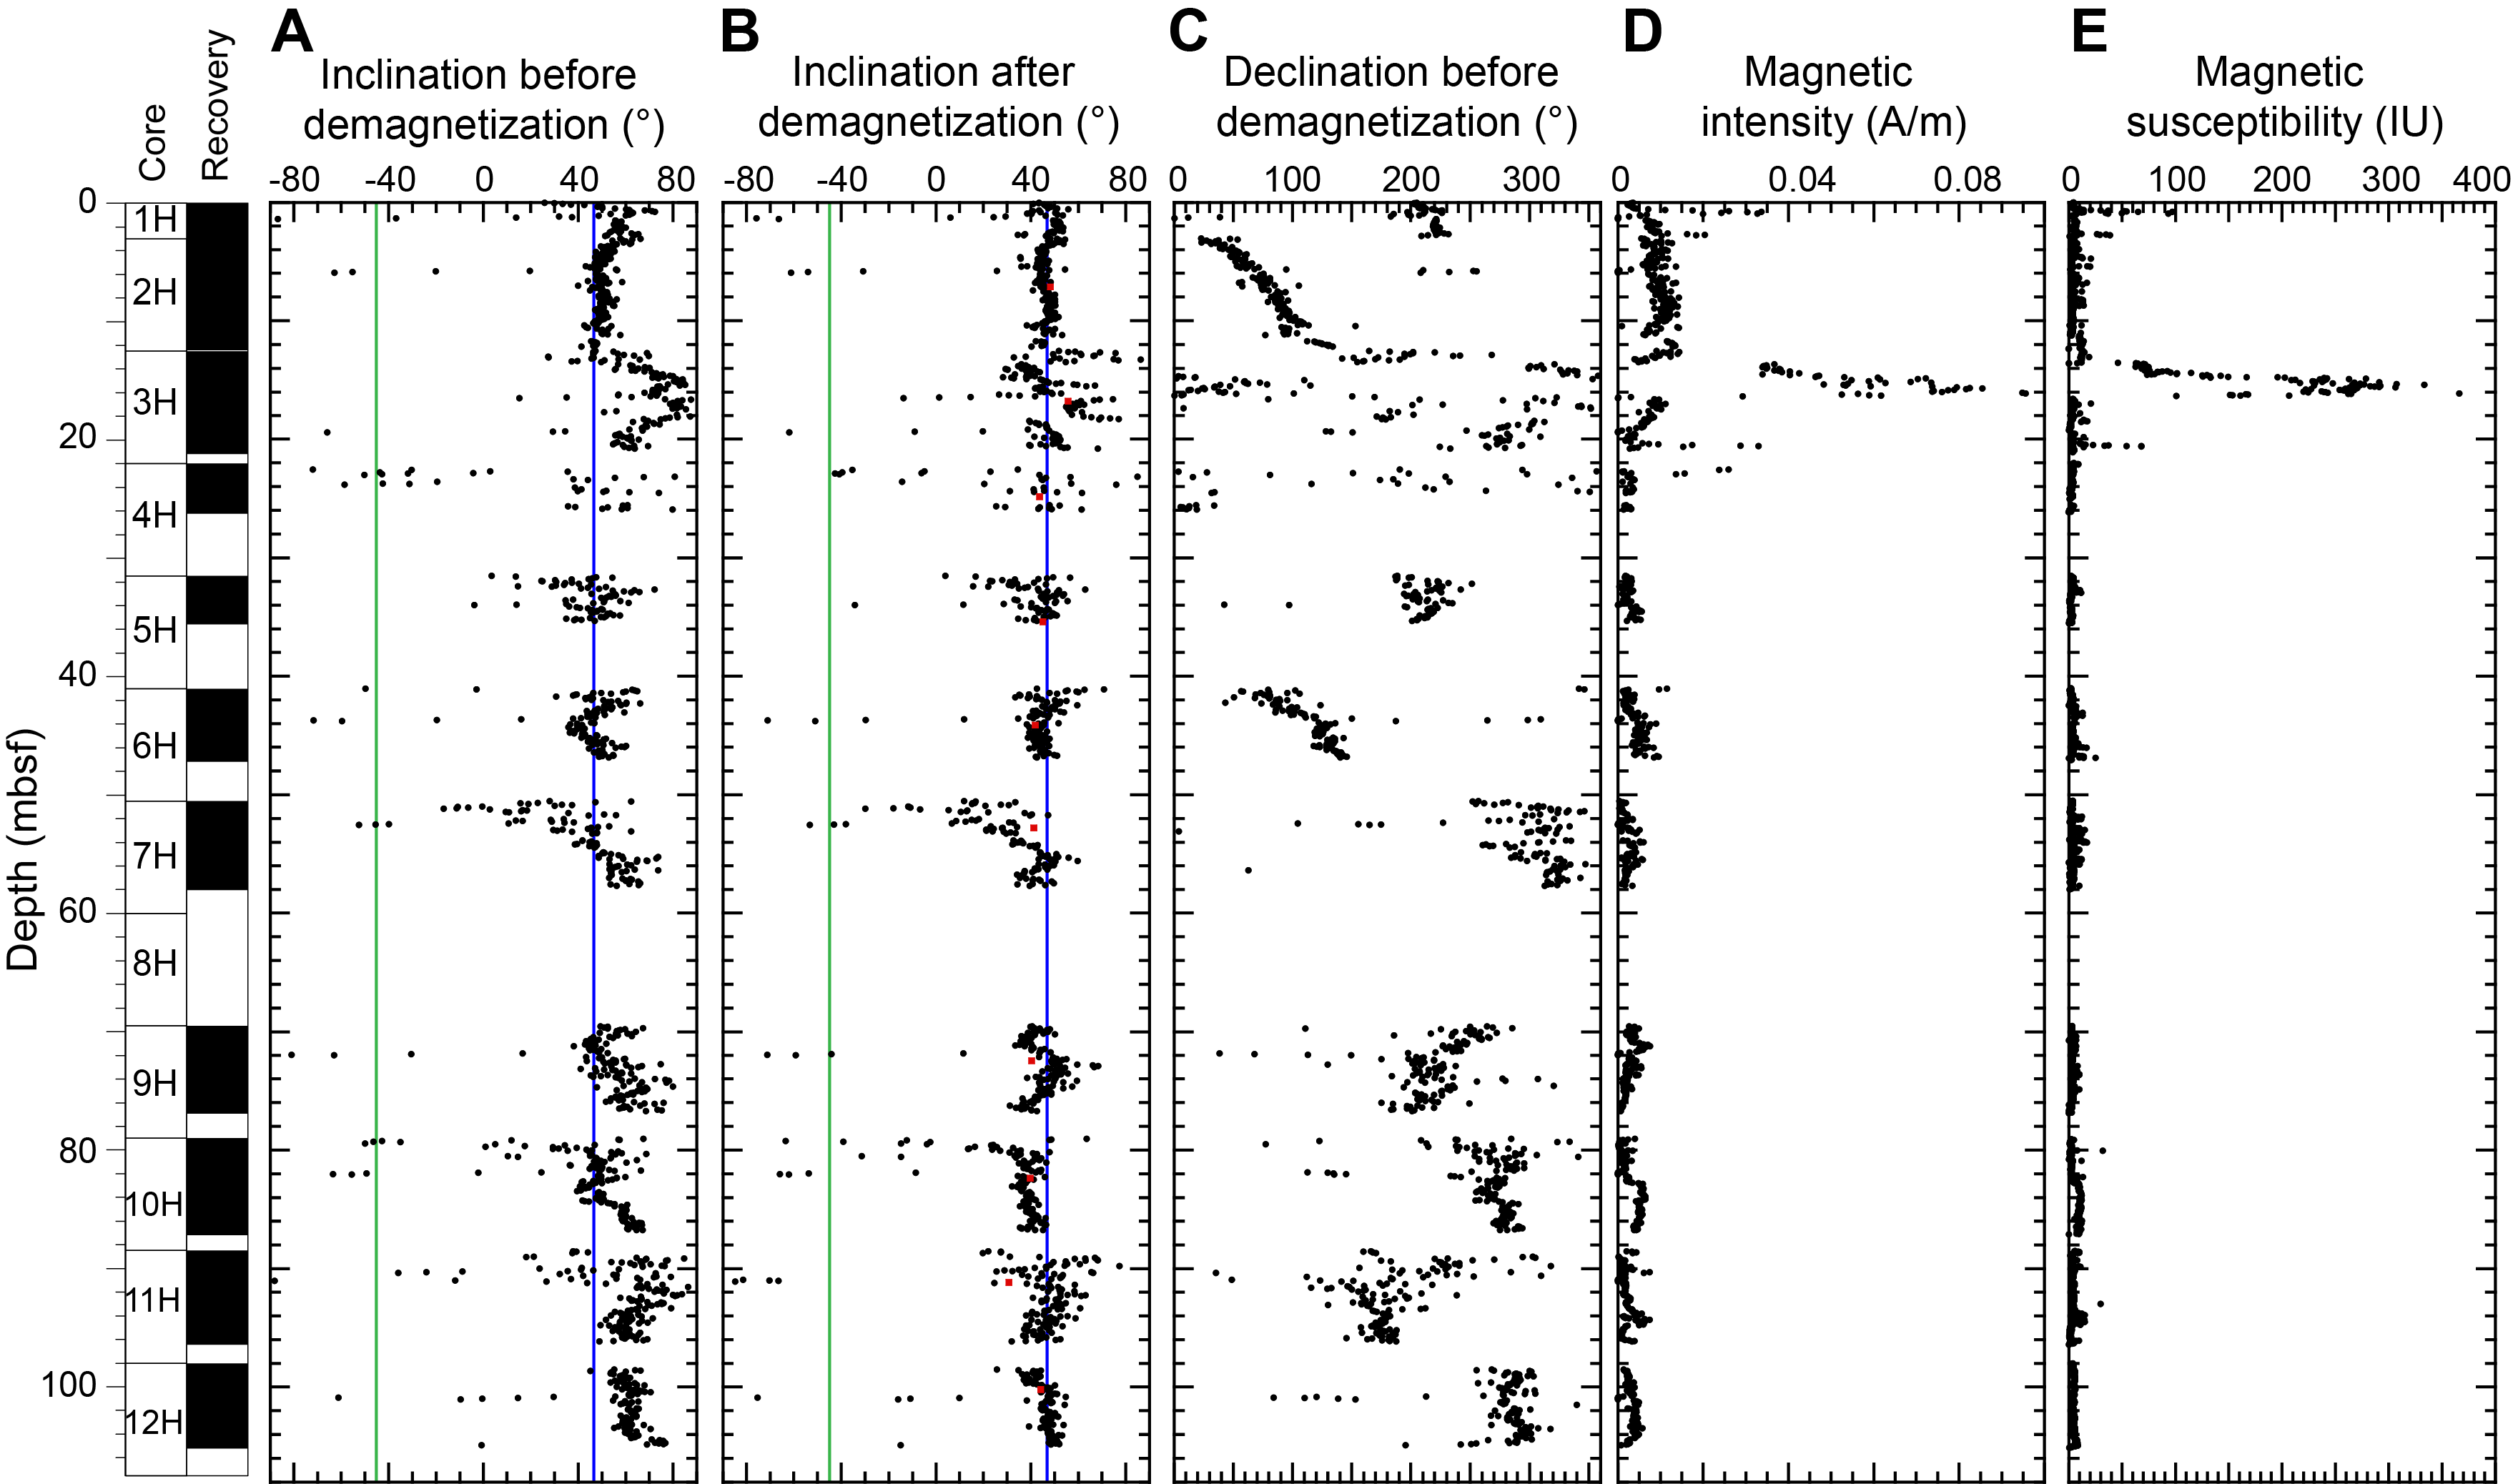
Figure F11. Sample analysis, Hole U1552A.
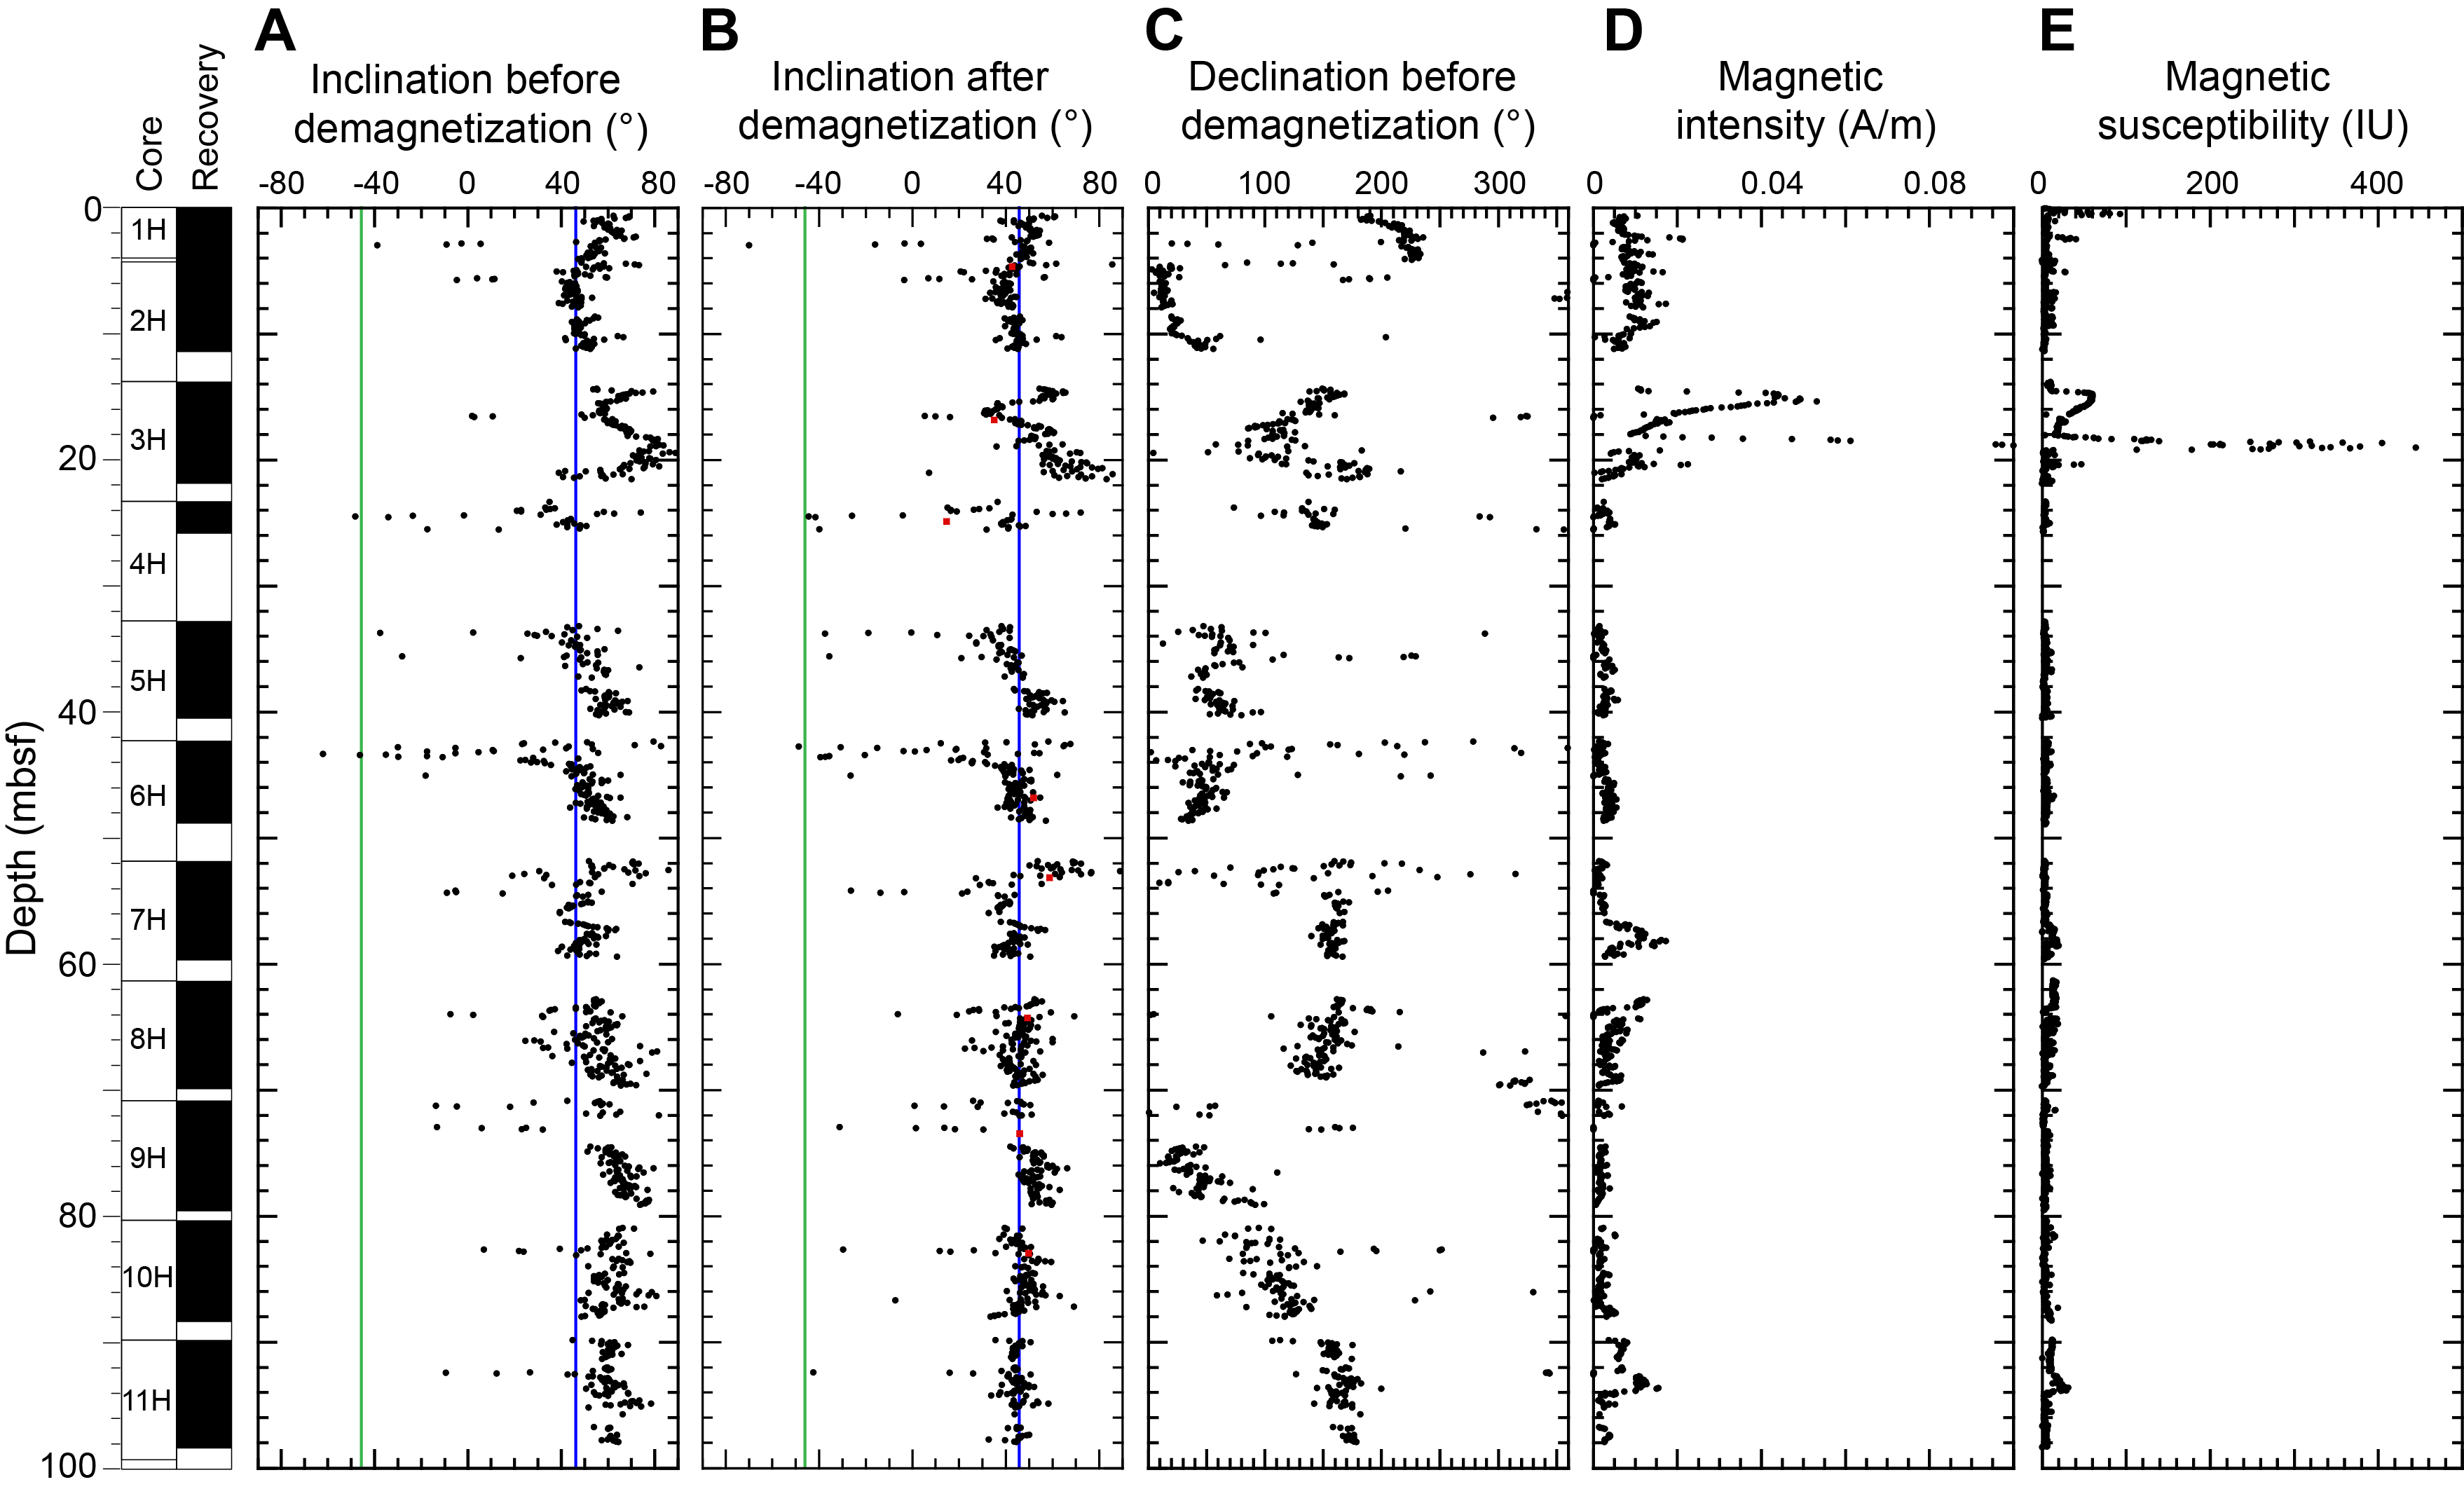
Figure F12. Sample analysis, Hole U1552C.
Magnetic intensity at Site U1552 is generally <0.02 A/m (Figures F11D, F12D), which is similar to the other sites drilled during Expedition 385 (see Paleomagnetism in the Site U1545, Site U1546, Site U1547/U1548, Site U1549, Site U1550, and Site U1551 chapters [Teske, et al., 2021b, 2021c, 2021d, 2021e, 2021f, 2021g]). Higher magnetic intensity values up to 1.2 A/m are found at ~13–18 mbsf in Hole U1552A (Sections 3H-2 through 3H-4) and at ~14–16.5 mbsf in Hole U1552C (Sections 3H-1 and 3H-2). These intervals of higher magnetic intensity are mirrored in the downhole point magnetic susceptibility profile (Figures F11E, F12E) and correspond to coarser lithology with higher detrital input (see Lithostratigraphy and the visual core descriptions [VCDs] in Core descriptions). No significant decrease of magnetic intensity related to the occurrence of a SMTZ at ~10 mbsf (see Inorganic geochemistry) was observed in shallow cores, despite a slight decrease in magnetic intensity at ~14 mbsf in both holes.
7.2. Discrete sample analysis
For a more detailed study of the remanence at Site U1552, discrete samples were taken from the working-half sections of Cores 385-U1552A-2H through 12H and 385-U1552C-1H through 10H at intervals of one discrete sample per core.
Measurements of remanence were made using an AGICO JR-6A spinner magnetometer on a total of eighteen 8 cm3 samples (see Figure F21 in the Expedition 385 methods chapter [Teske et al., 2021a]). All of these samples were demagnetized using a stepwise-increasing alternating field (AF) to isolate the ChRM direction using principal component analysis (Kirschvink, 1980). No samples were thermally demagnetized because all discrete samples were taken using plastic sampling boxes.
NRM intensities vary between 9.54 × 10⁻⁴ A/m and 8.52 × 10⁻² A/m with a mean intensity of 1.01 × 10⁻² A/m (Table T6). AF demagnetization was done up to 60 mT, by which level the samples had lost more than 90% of their total magnetization (Figure F13B). Representative demagnetization diagrams (Zijderveld, 1967) are shown in Figure F13A. All reported declination and inclination data are shown in the sample coordinate reference frame. However, because cores are free to rotate in the core barrel, only the inclination data are taken into account for interpretation. Two magnetic components were identified on the demagnetization diagrams for each discrete sample (Figure F13A). The first component is removed by an AF demagnetization treatment of 5–10 mT and corresponds to a drilling overprint. The second component is stable and points toward the origin. This component is of normal polarity for all analyzed discrete samples. The median destructive field ranges from 3.6 to 28.6 mT with a mean of 18.1 mT, comparable to results obtained from previous sites during this expedition. This suggests a magnetic mineral assemblage dominated by low-coercivity (titano)magnetite.

Figure F13. Discrete sample analysis, Site U1552.
The distributions of the inclinations of the NRM and the ChRM of all discrete samples are shown in Figure F13C. The NRM inclinations range from 15.8° to 76.2° with a mean inclination of 49.9°. Demagnetization at 20 mT causes the inclinations to take a shallower average of 39.9°, ranging between 27.5° and 52.3°. After principal component analysis, a mean inclination for the ChRM was calculated using the maximum likelihood method of Arason and Levi (2010) (Table T7). The calculated mean inclination for the ChRM results in 44.11°, which is slightly lower than the GAD inclination expected at this location (~46.2°).
7.3. Anisotropy of magnetic susceptibility
AMS was measured for all discrete samples from Site U1552 prior to demagnetization to characterize the magnetic fabrics present in the samples. Results for the sediments of Holes U1552A and U1552C are shown in Figure F14 in the core reference frame. Because these results are unoriented, it is not possible to determine whether there is a preferred magnetic lineation in these rocks; therefore, only the inclination of the anisotropy is taken into account. Sedimentary samples obtained from Site U1552 show a mixture of prolate and oblate behavior downhole; Kmax (maximum) principal axes are distributed in the horizontal plane, and Kmin (minimum) principal axes are oriented perpendicular to the sedimentary bedding.

Figure F14. Anisotropy of magnetic susceptibility, Site U1552.
7.4. Magnetostratigraphy
We used the SRM measurements on archive-half sections to determine the polarity at Site U1552. We based our interpretation of the magnetic polarity on the sign of inclination at the maximum AF demagnetization step of 20 mT (Figures F11B, F12B). All APC cores from Holes U1552A and U1152C show a positive inclination close to the GAD inclination. This is supported by the detailed discrete sample analysis, which shows a mean inclination value of 44° (Table T6). Therefore, we assigned the cores to the normal Brunhes Chron (C1n; <0.78 Ma), in agreement with the biostratigraphic observations (see Biostratigraphy). No magnetic excursions during C1n were observed, despite the fact that previously published paleomagnetic results from Deep Sea Drilling Project Leg 64 Site 480 identified the Mono Lake and Laschamp magnetic polarity excursions at ~29–26 ky before present (BP) and ~51–49 ky BP, respectively (Levi and Karlin, 1989).
8. Inorganic geochemistry
8.1. Interstitial water sampling
All samples were prepared in a nitrogen-filled glove bag prior to squeezing. One sample of hydrate-bound water from Section 385-U1552C-4H-CC (32.8 mbsf) was sampled, carefully scraped to minimize any contamination during handling, and dissociated into a clean 20 mL glass beaker. This water was collected in an HCl precleaned, 12 mL high-density polyethylene syringe and subsequently filtered through a 0.45 µm polyethersulfone membrane disposable filter. The chemical composition of the IW is listed in Table T8. All downhole profiles of elements are presented in Figure F15.
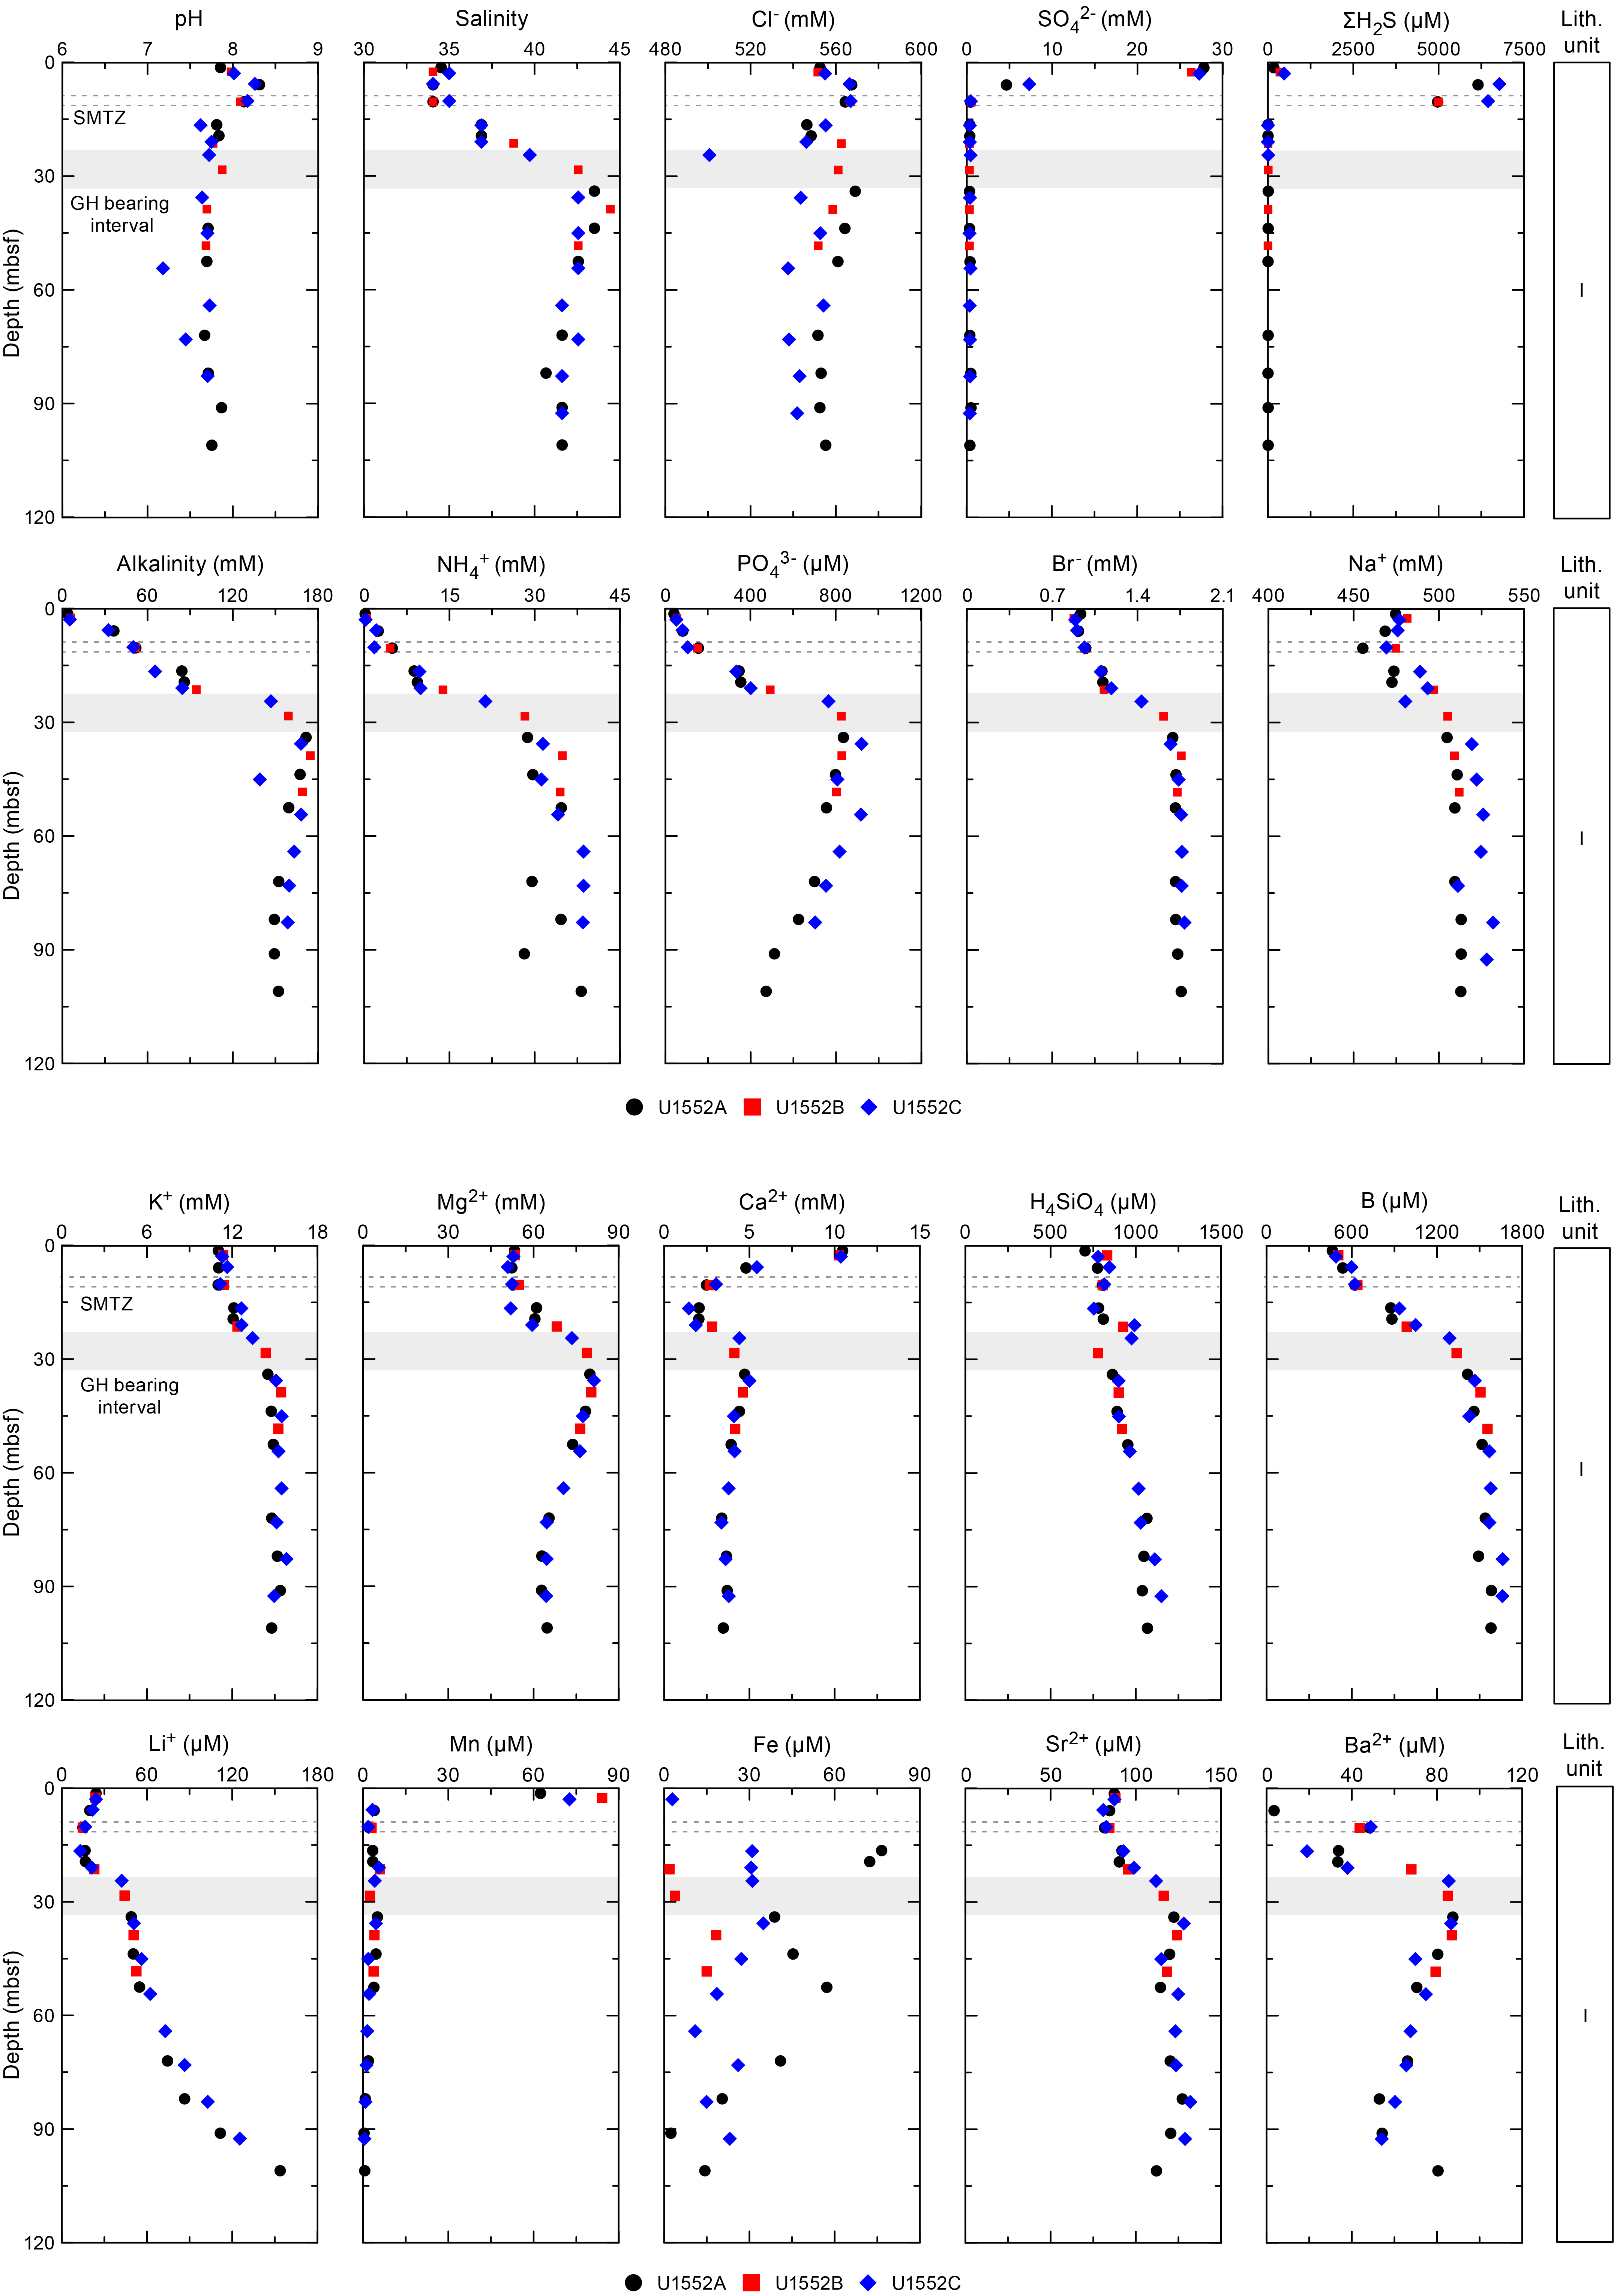
Figure F15. Interstitial water chemistry, Site U1552.
8.2. Interstitial water results
8.2.1. pH, salinity, chloride, and sodium
pH values show a maximum of 8.3 between the seafloor and 6 mbsf and then start to decrease. Below 20 mbsf, pH values remain within a narrow range (7.5–7.8). Salinity sharply increases below 10–15 mbsf to values around 44–45 around 36 mbsf. Below this depth, salinity exhibits a relatively constant value (42–43). To a lesser extent, locally elevated salinity is also observed at Site U1549. The salinity of hydrate-bound water is around 2 (Table T8).
Chloride (Cl−) concentration generally varies within a narrow range (540–570 mM) except for one outlier with a lower concentration (501 mM) at 25 mbsf in Hole U1552C. Because gas hydrates were observed in Core 385-U1552C-4H (between 23.3 and 32.8 mbsf; see Lithostratigraphy) and the measured Cl− concentration of hydrate-bound water is 10.5 mM (Table T8), this depleted Cl− at 25 mbsf in Hole U1552C could be caused by gas hydrate dissociation during recovery (e.g., Dählmann and de Lange, 2003; Hesse, 2003). Nevertheless, this minimum excursion was not observed for salinity.
Sodium (Na+) concentration shows an increasing trend from 10 to 36 mbsf. It varies from 456 to 505 mM in Holes U1552A and U1552B and from 469 to 519 mM in Hole U1552C. Below 40 mbsf, Na+ concentration remains relatively constant in all holes.
Massive gas hydrates associated with chloride-rich brines produced by salt exclusion have been reported on Hydrate Ridge off the coast of Oregon (USA), the northern Cascadia margin (Canada), the Krishna Godavari Basin (India), and the Ulleung Basin (Korea) (Haeckel et al., 2004; Torres et al., 2004, 2011; Kim et al., 2013). However, massive gas hydrate was not observed at Site U1552. As described by You et al. (2019), gas hydrates found at Site U1552 are more likely disseminated low-concentration hydrate (Type I) or most likely concentrated hydrates in sand-rich intervals (Type V). Depending on the timing of their formation, salt exclusion effects might not be clearly visible on IW profiles because of diffusion processes (Haeckel et al., 2004). Indeed, further analyses are needed to decipher the influence of gas hydrates (formation and composition) on IW profiles.
8.2.2. Sulfate, sulfide, alkalinity, ammonium, phosphate, and bromide
Sulfate (SO42−) concentration decreases from 28 to <0.5 mM in the upper 10 mbsf, and below this depth it remains <0.5 mM in all holes. Hydrocarbon concentrations increase markedly around 9 mbsf in Hole U1552B (>8 mM; see Organic geochemistry). Therefore, the SMTZ is estimated to be around 10 mbsf at this site (Figure F15). Sulfide concentration (ΣH2S = S2 + HS− + H2S) exhibits a maximum near 7 mM at 6 mbsf and decreases to <10 µM below 16 mbsf. The interval exhibiting the maximum sulfide concentration is consistent with the SMTZ.
Alkalinity increases from the seafloor to 36 mbsf to values between 168 and 175 mM in all holes (Figure F15). Below 36 mbsf, alkalinity remains at 150–170 mM. High alkalinity is also observed at Site U1549, but the maximum alkalinity value is twice as high at Site U1552. The downhole profile of alkalinity is congruent with that of salinity at Site U1552.
Ammonium (NH4+) concentration increases from the seafloor to around 36 mbsf with values of 28–35 mM in all holes. Below this depth, ammonium concentration ranges between 28 and 39 mM. Phosphate (PO43−) concentration generally increases from the seafloor to 36 mbsf, ranging from 42 to 922 µM. Below this depth, it decreases to values around <500 µM. Bromide (Br−) concentration steadily increases from 0.88 to 1.69 mM from the seafloor to ~36 mbsf and then has a nearly constant value (1.8 mM).
8.2.3. Calcium, magnesium, potassium, and silica
Dissolved calcium (Ca2+) concentration decreases from 10.5 to 1–2 mM from the seafloor to around 17 mbsf (Figure F15). This trend is generally caused by carbonate precipitation (2HCO3− + Ca2+ = CaCO3 + H2O + CO2). Ca2+ concentration increases from 2 mM at 20 mbsf to 5 mM at 36 mbsf and then remains within a narrow range between 3 and 4 mM.
Dissolved magnesium (Mg2+) concentration varies within a narrow range (51–55 mM) from the seafloor to 11 mbsf in Holes U1552A and U1552B and from the seafloor to 17 mbsf in Hole U1552C. Below these depths, it increases sharply and reaches a maximum value of 80–81 mM around 36 mbsf in all holes and then gradually decreases to 63–76 mM at 82 mbsf. Below 82 mbsf, it has a relatively constant value (63–65 mM).
Dissolved potassium (K+) varies within a narrow range (11–12 mM) above the SMTZ and increases below that zone to 15 mM at 35 mbsf. It then varies within a narrow range of 15–16 mM.
Dissolved silica (expressed in solution as H4SiO4) shows an increasing trend with depth. It reaches a maximum value of 1151 µM at the bottom of Hole U1552C.
8.2.4. Manganese and iron
Dissolved manganese (Mn = Mn2+ + Mn4+) has a maximum concentration of 85 µM at 2 mbsf in Hole U1549A. Below this depth, Mn concentration sharply decreases and remains <6 µM.
The concentration of iron (Fe = Fe2+ + Fe3+) reaches maximum values of 76 µM at 17 mbsf in Hole U1552A, 19 µM at 39 mbsf in Hole U1552B, and 35 µM at 36 mbsf in Hole U1552C. A second peak (57 µM) is observed at 53 mbsf in Hole U1552A. Below these depths, iron concentration steadily decreases.
8.2.5. Boron, lithium, strontium, and barium
Boron (B; dissolved as borate; B[OH]4−) gradually increases from the seafloor to around 40 mbsf from 464 to 1470 µM. Below this depth, concentrations remain within a narrow range (1448–1661 µM). Lithium (Li+) decreases in the upper 17 m from 24 to 13 µM. Li+ concentration then increases with depth and reaches 154 µM at the bottom of Hole U1552A. Strontium (Sr2+) concentrations vary within a range of 82–88 µM above the SMTZ and then steadily increase to reach 122–128 µM around 36 mbsf in all holes. Below this depth, Sr2+ concentration varies within a narrow range (112–131 µM). Barium (Ba2+) concentration is low (< 5 µM) from the seafloor to 6 mbsf and then sharply increases below the SMTZ. Ba2+ reaches its maximum concentration of 87 µM around 39 mbsf and generally decreases, with the exception of the bottom of Hole U1552A (80.4 µM).
8.3. Concluding remarks
Based on the sulfate profile and an increase in methane concentration (see Organic geochemistry), the SMTZ is estimated to be around 10 mbsf (Figure F15). This and the comparably shallow SMTZ at Site U1550 are the shallowest SMTZs encountered during this expedition. Alkalinity reaches 175 mM at depth, which is the highest value recorded during this expedition. High salinity is observed below the SMTZ at this site, as well as increases in many ions (potassium, magnesium, calcium, etc.) but interestingly not in chloride content. Measurements on gas hydrate–bound water from Hole U1552C resulted in salinity values of 2 and a chloride concentration of 10.5 mM, both of which are indeed highly depleted compared to seawater (35 and 559 mM, respectively). Thus, the dissociation of such hydrates could cause local anomalies in the retrieved IW, as observed in chloride concentration at 25 mbsf in Hole U1552C with a value around 500 mM.
Similar profiles were observed in Site U1549, with lower accumulation of these ions, and further analyses will be necessary to decipher the influence of hydrates (formation and composition) in such IW profiles.
9. Organic geochemistry
At Site U1552, organic geochemists performed sampling and analysis of gas samples. For Hole U1552A, one to two headspace gas samples were analyzed per 9.5 m core for routine hydrocarbon safety monitoring, and void gases were quantified and sampled for hydrocarbon content. For Hole U1552B, hydrocarbon analyses on headspace gas were performed; H2 and CO contents in headspace vials were measured; void gases were quantified and sampled for hydrocarbons, H2, and CO contents; and a comprehensive suite of gas and sediment samples for shore-based analyses was taken. Finally, for Hole U1552C, hydrocarbon analyses on headspace gas were performed and void gases were quantified and sampled for hydrocarbon content, H2 and CO contents, and shore-based analyses. Because Site U1552 was drilled near the end of Expedition 385, no sediment samples were analyzed for carbon, nitrogen, and sulfur content aboard the vessel. This data set will be acquired through postexpedition shore-based analysis and provided by means of a separate data report.
9.1. Hydrocarbon gases
Headspace samples were taken from each core to monitor C1–C6 hydrocarbons per the standard safety protocol during drilling (Pimmel and Claypool, 2001). For Holes U1552A–U1552C, 29 headspace samples were analyzed for their parts per million by volume concentration (Table T9) and then corrected by sample weight and porosity to determine the molar concentration of dissolved hydrocarbons (Table T10). Trends observed in Holes U1552A–U1552C differ slightly but are combined for discussion below.
Site U1552 hydrocarbon data are shown in Figure F16. Methane concentrations are close to the detection limit to 6 mbsf in all holes. In Holes U1552A and U1552B, erratically high methane concentrations were observed between 6 and 26 mbsf. A maximum value of 93.1 mM was measured at 26 mbsf in Sample 385-U1552A-4H-5, 56–61 cm, and two maxima of ~8 mM are present at 8.9 and 27 mbsf in Hole U1552B. These high values and their erratic character could be related to the presence of gas hydrates that were noted in Core 385-U1552A-4H on the core receiving platform. Methane concentration then decreases from 34 to 54 mbsf and plateaus at ~2 mM from 54 to 82 mbsf. A second maximum of 3.8 mM at 91 mbsf is followed by a decrease to 1.6 mM in the deepest sample of Hole U1552A. In Hole U1552C, methane concentration reaches a maximum value of 7 mM at 16.7 mbsf. From 24.6 to 92.7 mbsf, methane concentration progressively decreases from 2.0 to 0.7 mM. Ethane concentrations show profiles similar to methane concentrations but have values approximately one order of magnitude lower. C3–C6 compounds are detected below ~25 mbsf in all three holes. In general, C3–C5 compounds remain present throughout at the submicromolar to micromolar level downhole, whereas C6 compounds are more erratic. No clear trends are discernible in the C3–C6 concentration profiles (Figure F16).
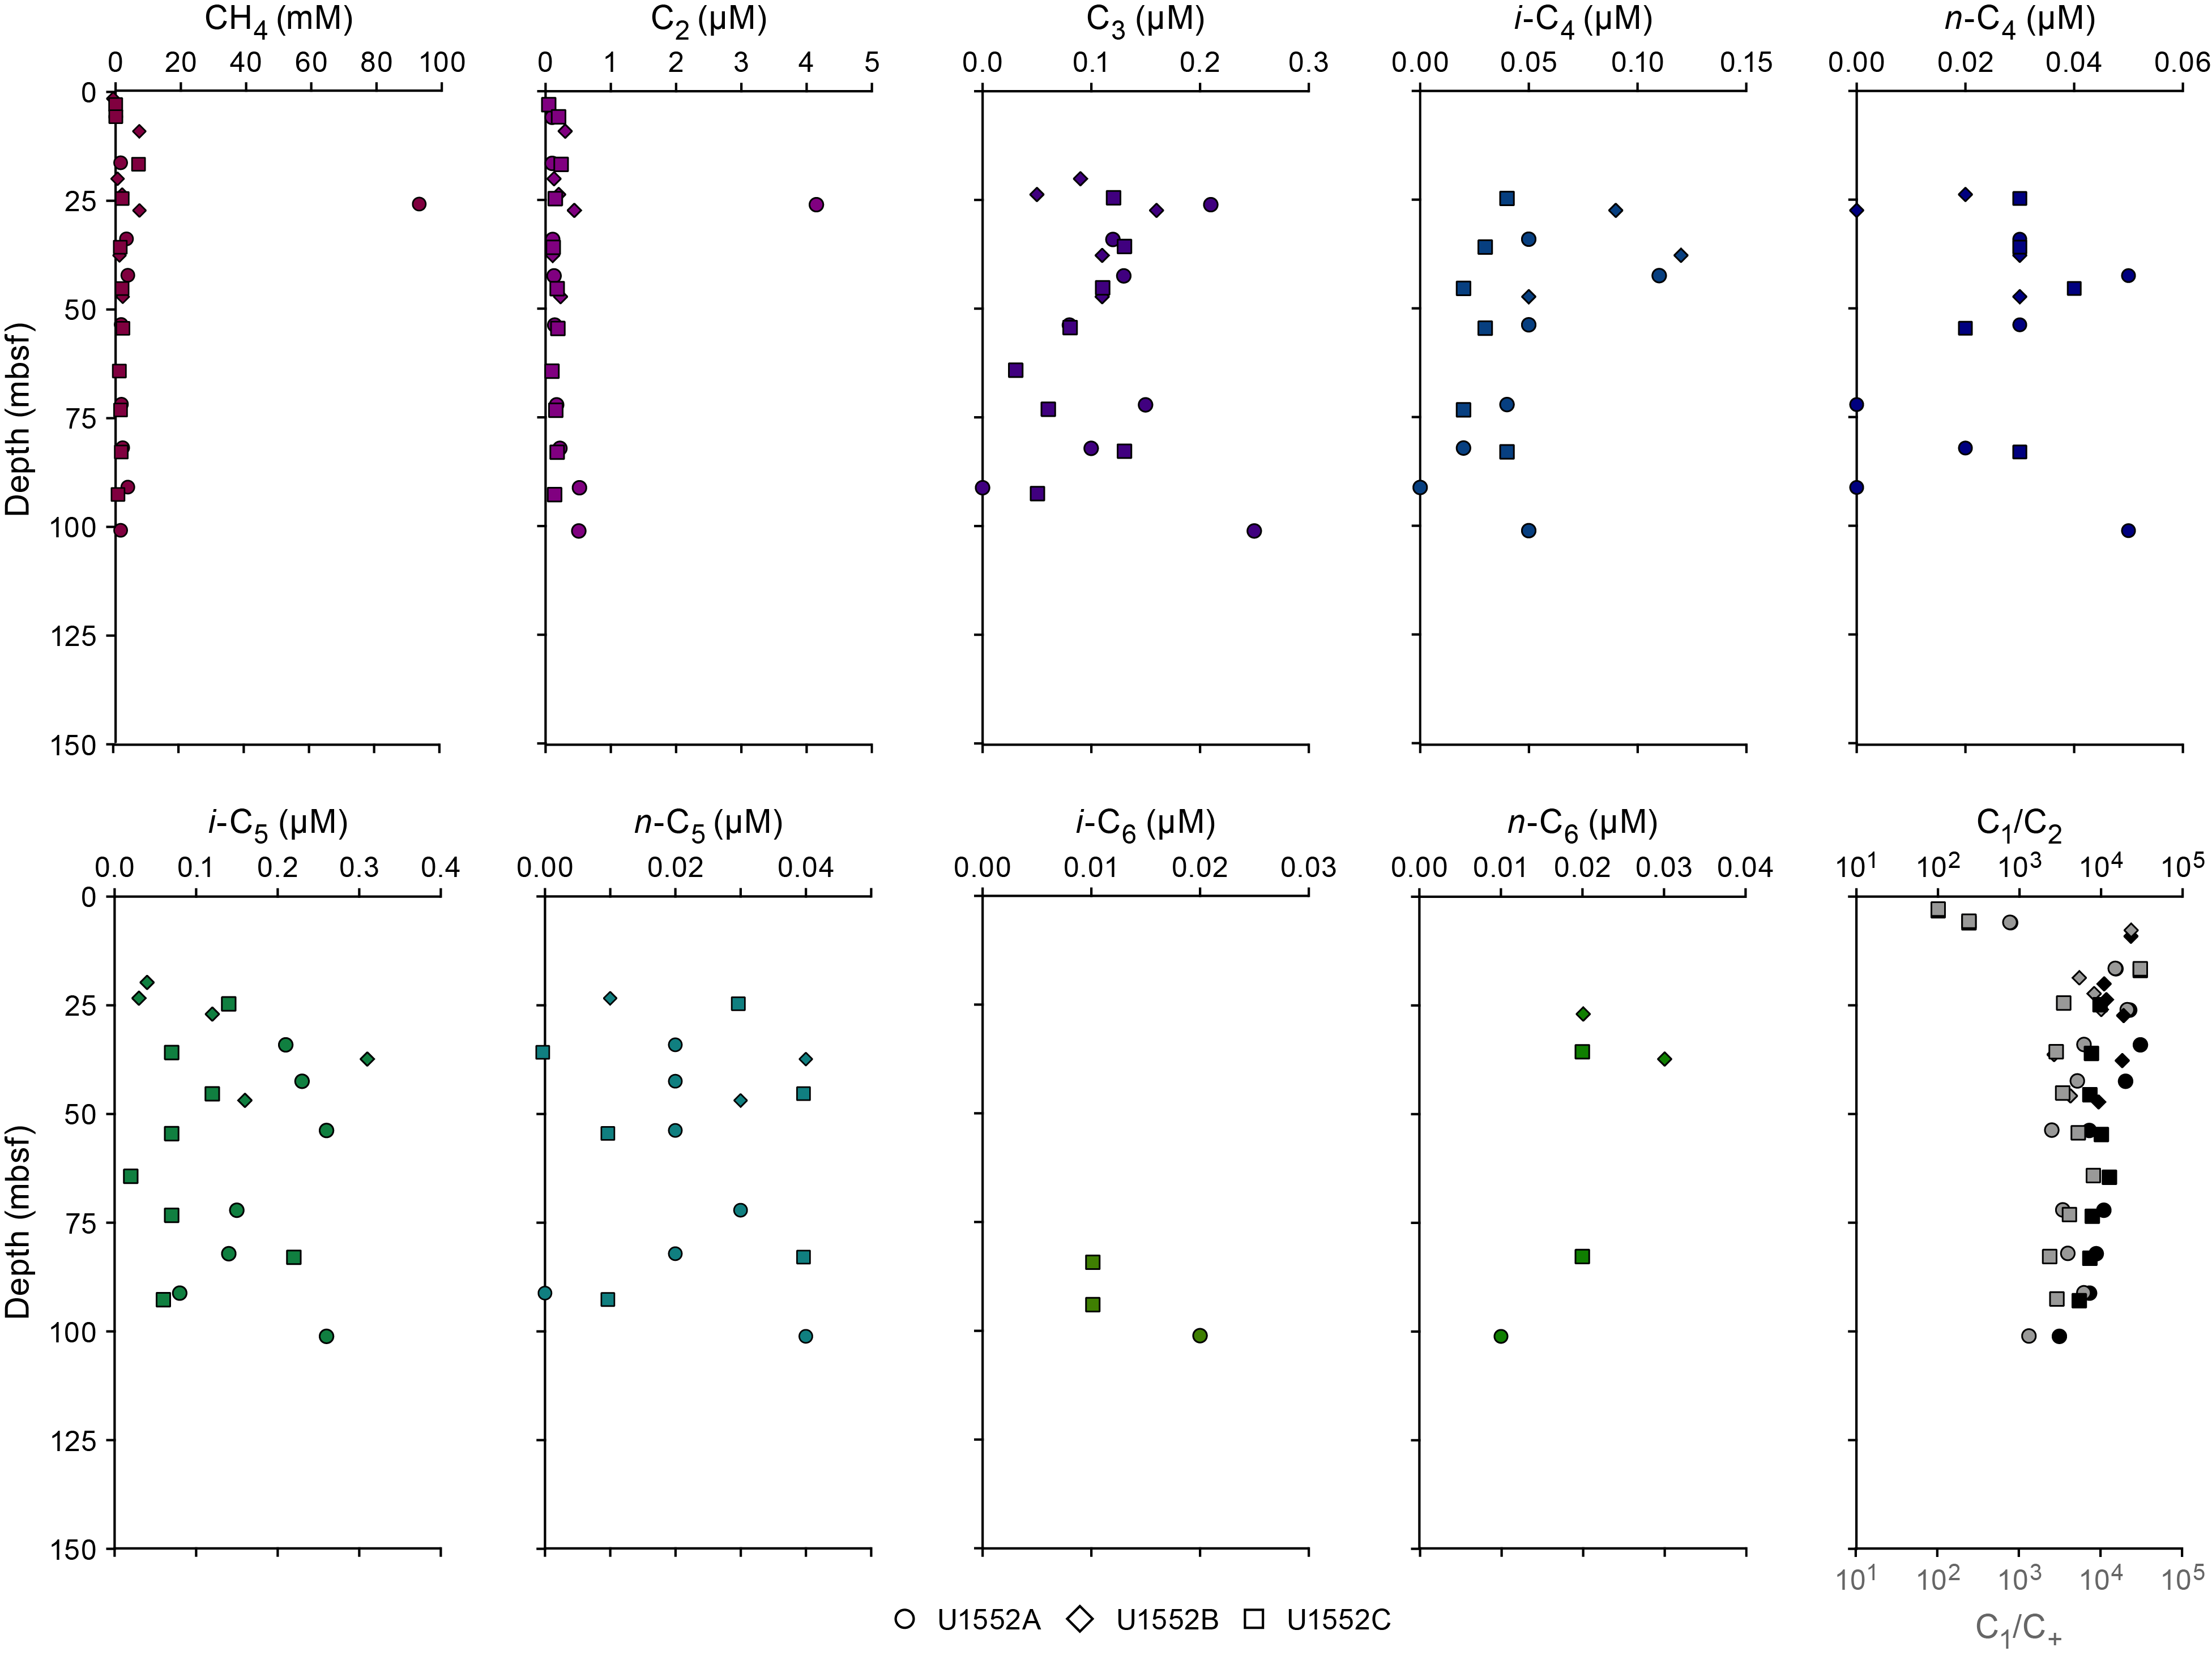
Figure F16. Carbon concentrations and values in headspace gas samples, Holes U1552A–U1552C.
These variations in methane and C+ are reflected in values of C1/C2 and C1/C+ (Figure F16). When hydrocarbons first occur, a low C1/C2 value of ~780 is observed. C1/C2 rapidly increases to a maximum value of ~30,000 at ~9 mbsf in Hole U1552C and 34 mbsf in Hole U1552A. C1/C2 values then progressively decrease to a minimum value of ~4000 at the bottom of Holes U1552A and U1552C. Neither C1/C2 nor C1/C+ values show an anomalous temperature-dependent behavior, as defined by Pimmel and Claypool (2001).
In addition to the headspace measurements described above, 19 void gas samples were taken in Holes U1552A–U1552C when void spaces were observed on the core receiving platform (Table T11). These samples were analyzed to determine the parts per million by volume concentrations and values of C1/C2 and C1/C+ (Figure F17). Void samples were dominated by methane, which was present at the percent level throughout. Values range from ~47% to 89% and average ~72%. C2–C6 hydrocarbons are present at every interval sampled. However, C6 compounds are only present in the deepest sample. Ethane, C3, and n-C4 show a progressive increase downhole, and i-C4, i-C5, and n-C5 show maxima at variable depths.
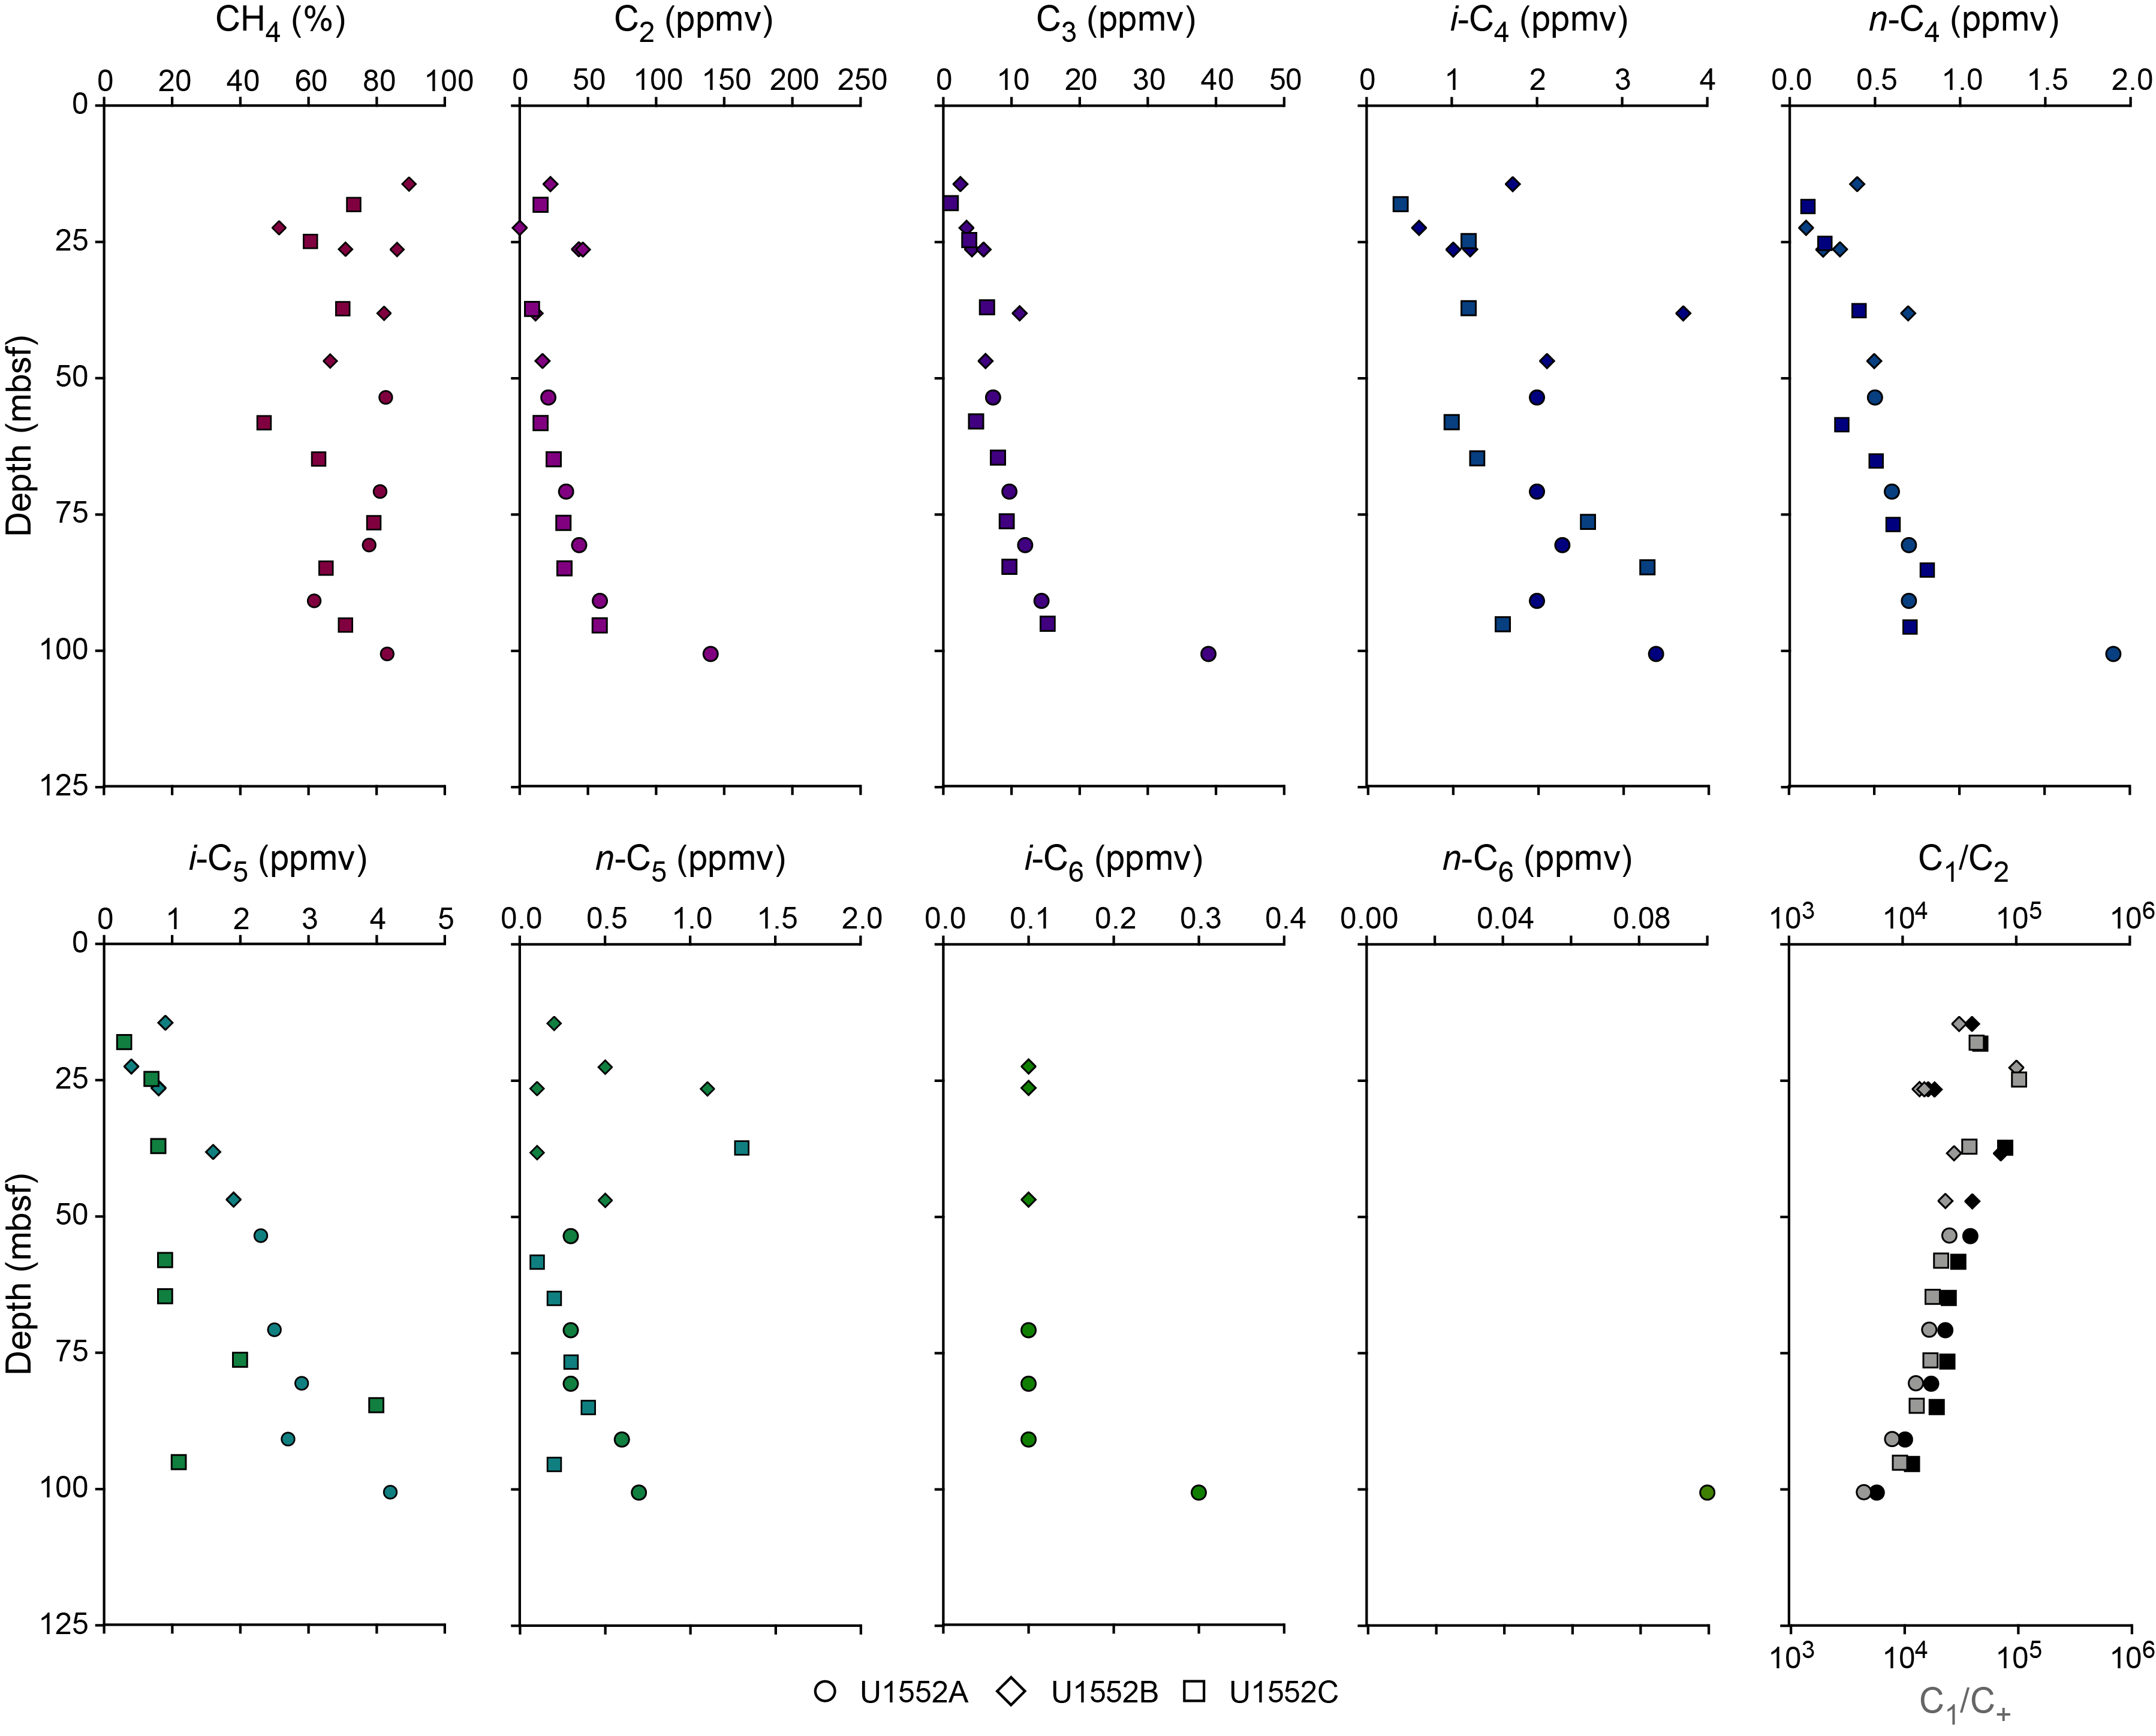
Figure F17. Carbon concentrations and values in void gas samples, Holes U1552A–U1552C.
In Holes U1552A–U1552C, the lengths of the void spaces within the core liner created by expanding gases were measured immediately after core recovery on the core receiving platform (Table T12). This monitoring started with Core 385-U1552A-7H. Voids were present from ~10 mbsf to the bottom of all holes. The percent of void space per meter core ranges from 2% to 333% and shows no clear depth trend (Figure F18).
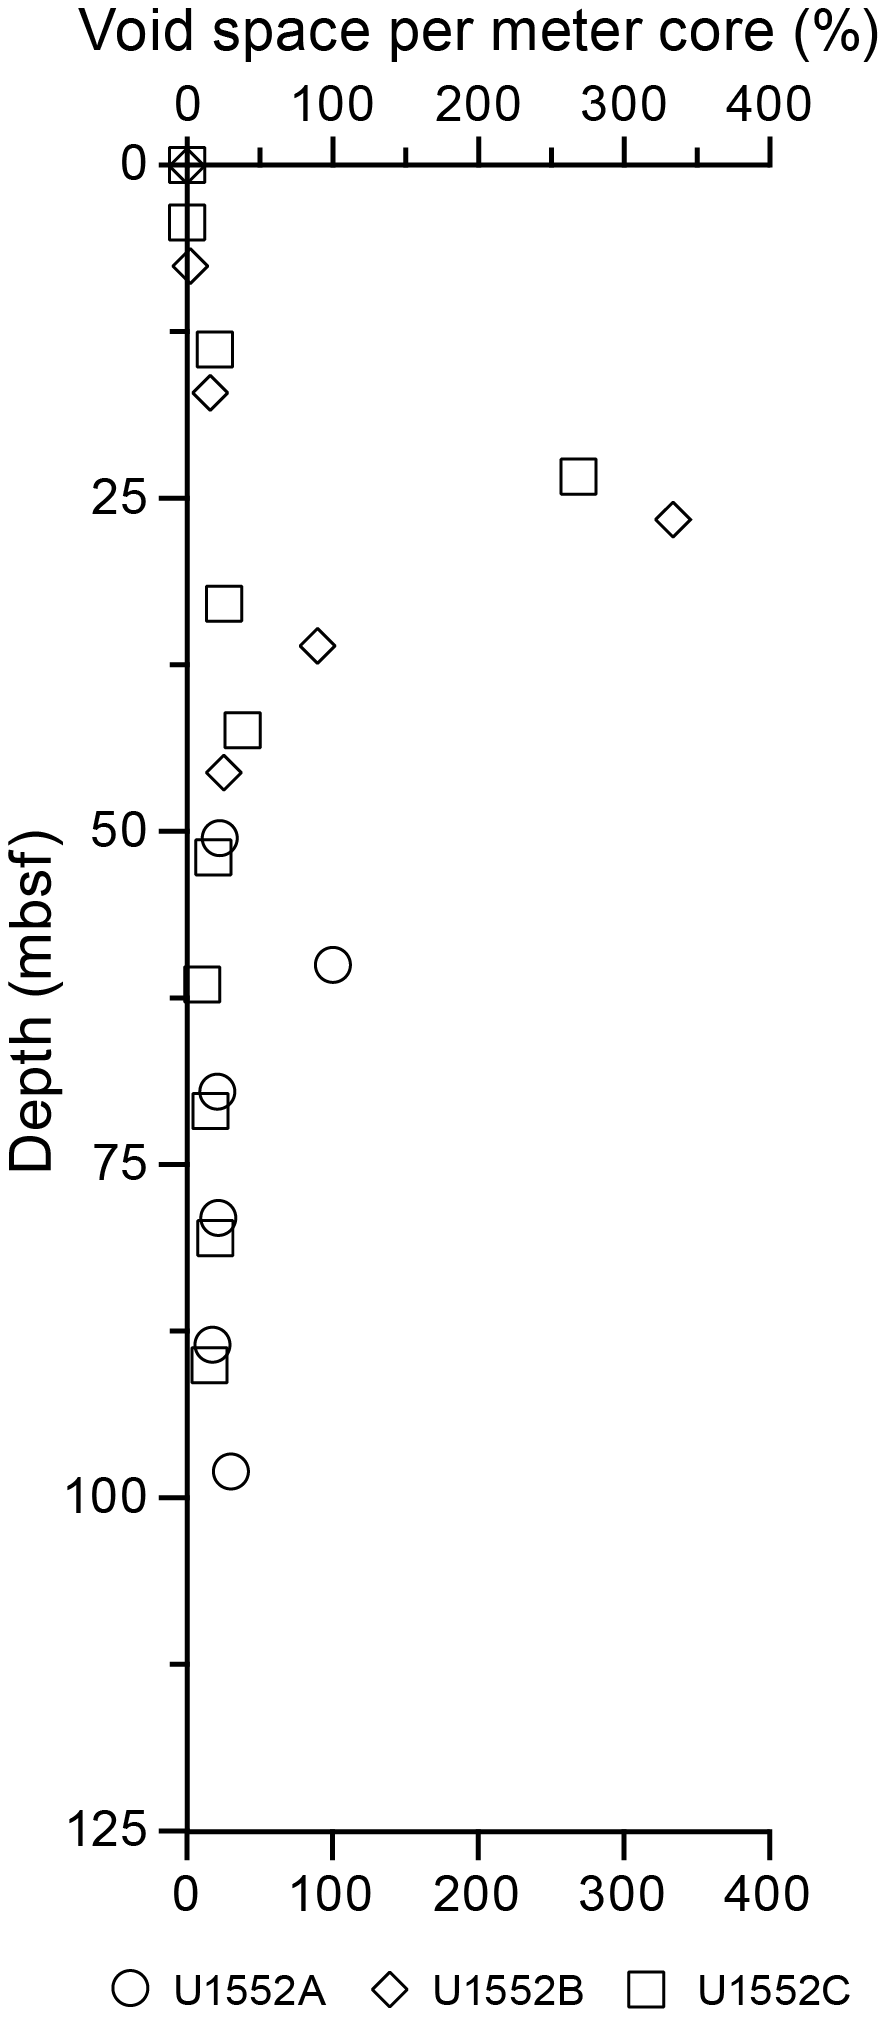
Figure F18. Void space, Holes U1552A–U1552C.
9.2. Hydrogen and carbon monoxide
For Hole U1552B, headspace samples were taken from each core to monitor molecular hydrogen (H2) and carbon monoxide (CO) contents. Duplicate samples were collected from depths next to samples for safety gas monitoring of hydrocarbon gases (Table T13). Dissolved H2 and CO were extracted into a defined headspace, the headspace gas was analyzed, and molar concentrations of dissolved H2 and CO were determined as described in Organic geochemistry in the Expedition 385 methods chapter (Teske et al., 2021a). Because of the presence of H2 and CO in the analytical blank, the minimum quantification limits for in situ concentrations of dissolved H2 and CO were 40 and 150 nM, respectively. Concentrations of dissolved H2 vary slightly with depth around an average near the minimum quantification limit (Figure F19). In contrast, CO generally decreases with depth from a maximum of 515 nM at ~1.4 mbsf to 159 nM at ~47 mbsf.
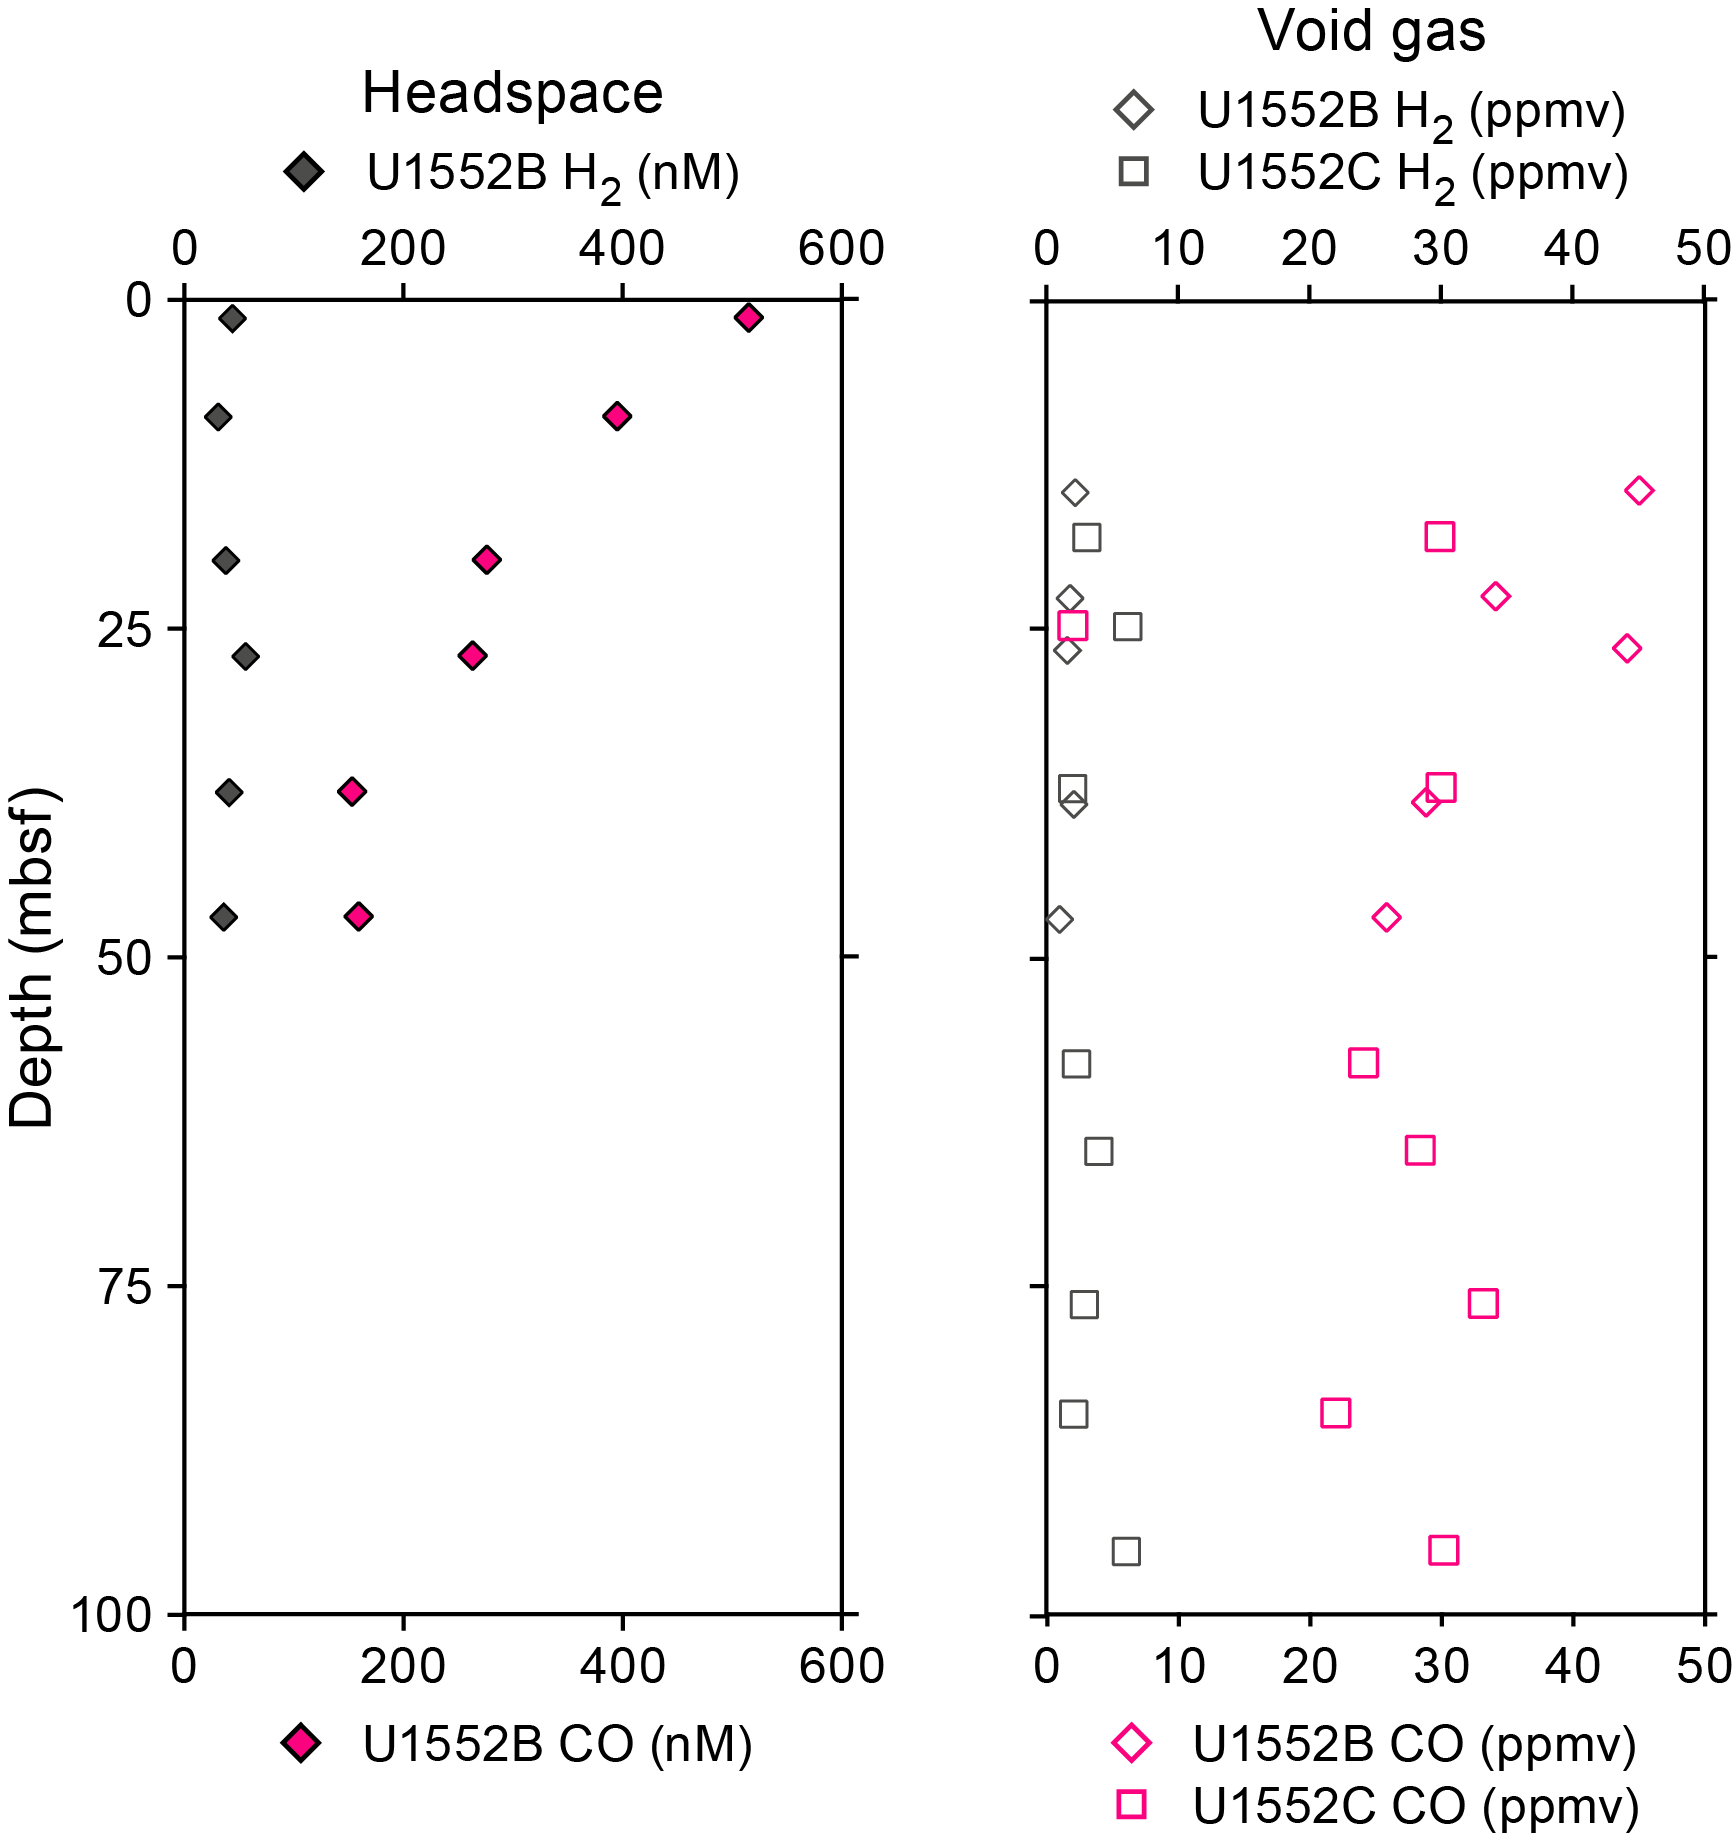
Figure F19. Gas concentrations in headspace and void gas samples, Holes U1552B and U1552C.
In addition to the headspace measurements described above, 19 void gas samples were collected using a gas-tight syringe and analyzed for H2 and CO contents (Table T14; Figure F19) for Holes U1552B and U1552C. H2 concentration varies slightly around average values of 1.8 and 3.6 ppmv in Holes U1552B and U1552C, respectively. The content of CO varies slightly around an average value of ~35 ppmv in both holes. No trends were observable for either species.
10. Microbiology
10.1. Sampling
Sediment cores for microbiological studies were obtained from Hole U1552B using the APC system. Site U1552 provides access to hydrate-rich sediments overlying deeply (>600 mbsf) emplaced sills on the northern flank of Guaymas Basin near the transition to the Sonora margin (Teske et al., 2018). This site presents an opportunity for microbiologists to examine microbial abundance and community structure changes throughout the gas hydrate stability zone in the sediment. Sampling for cell counting, 3-D structural imaging, RNA analyses, and contamination tracing was performed as described in the Microbiology section of the Expedition 385 methods chapter (Teske et al., 2021a).
Detailed curatorial information about all samples taken (e.g., core, section, interval, and absolute depths of samples) can be retrieved from the Curation and Samples Laboratory Information Management System Online Report (LORE) (http://web.iodp.tamu.edu/LORE).
10.2. Microbial cell detection and enumeration
10.2.1. Microbial cell counts
Cell abundance was quantified via direct counting with an epifluorescence microscope. For shipboard analysis of sediment, samples (V = 1 cm3) were aseptically taken from Hole U1552B sections using tip-cut syringes. Selected samples (Sections 385-U1552B-1H-1, 1H-3, 2H-1, 2H-3, 3H-2, 4H-1, 5H-1, and 6H-1) were processed by applying the non-cell extraction protocol outlined in the Microbiology section of the Expedition 385 methods chapter (Teske et al., 2021a). Cell abundance was determined to be at a level of 6.6 × 10⁶ cells/cm3 in bottom seawater and 1.2 × 10⁹ cells/cm3 in seafloor sediments. Below the seafloor, cell abundance gradually decreased to 8.1 × 10⁶ cells/cm3 at approximately 47.0 mbsf (Figure F20), which corresponds to the lowermost sampling depth in Hole U1552B.
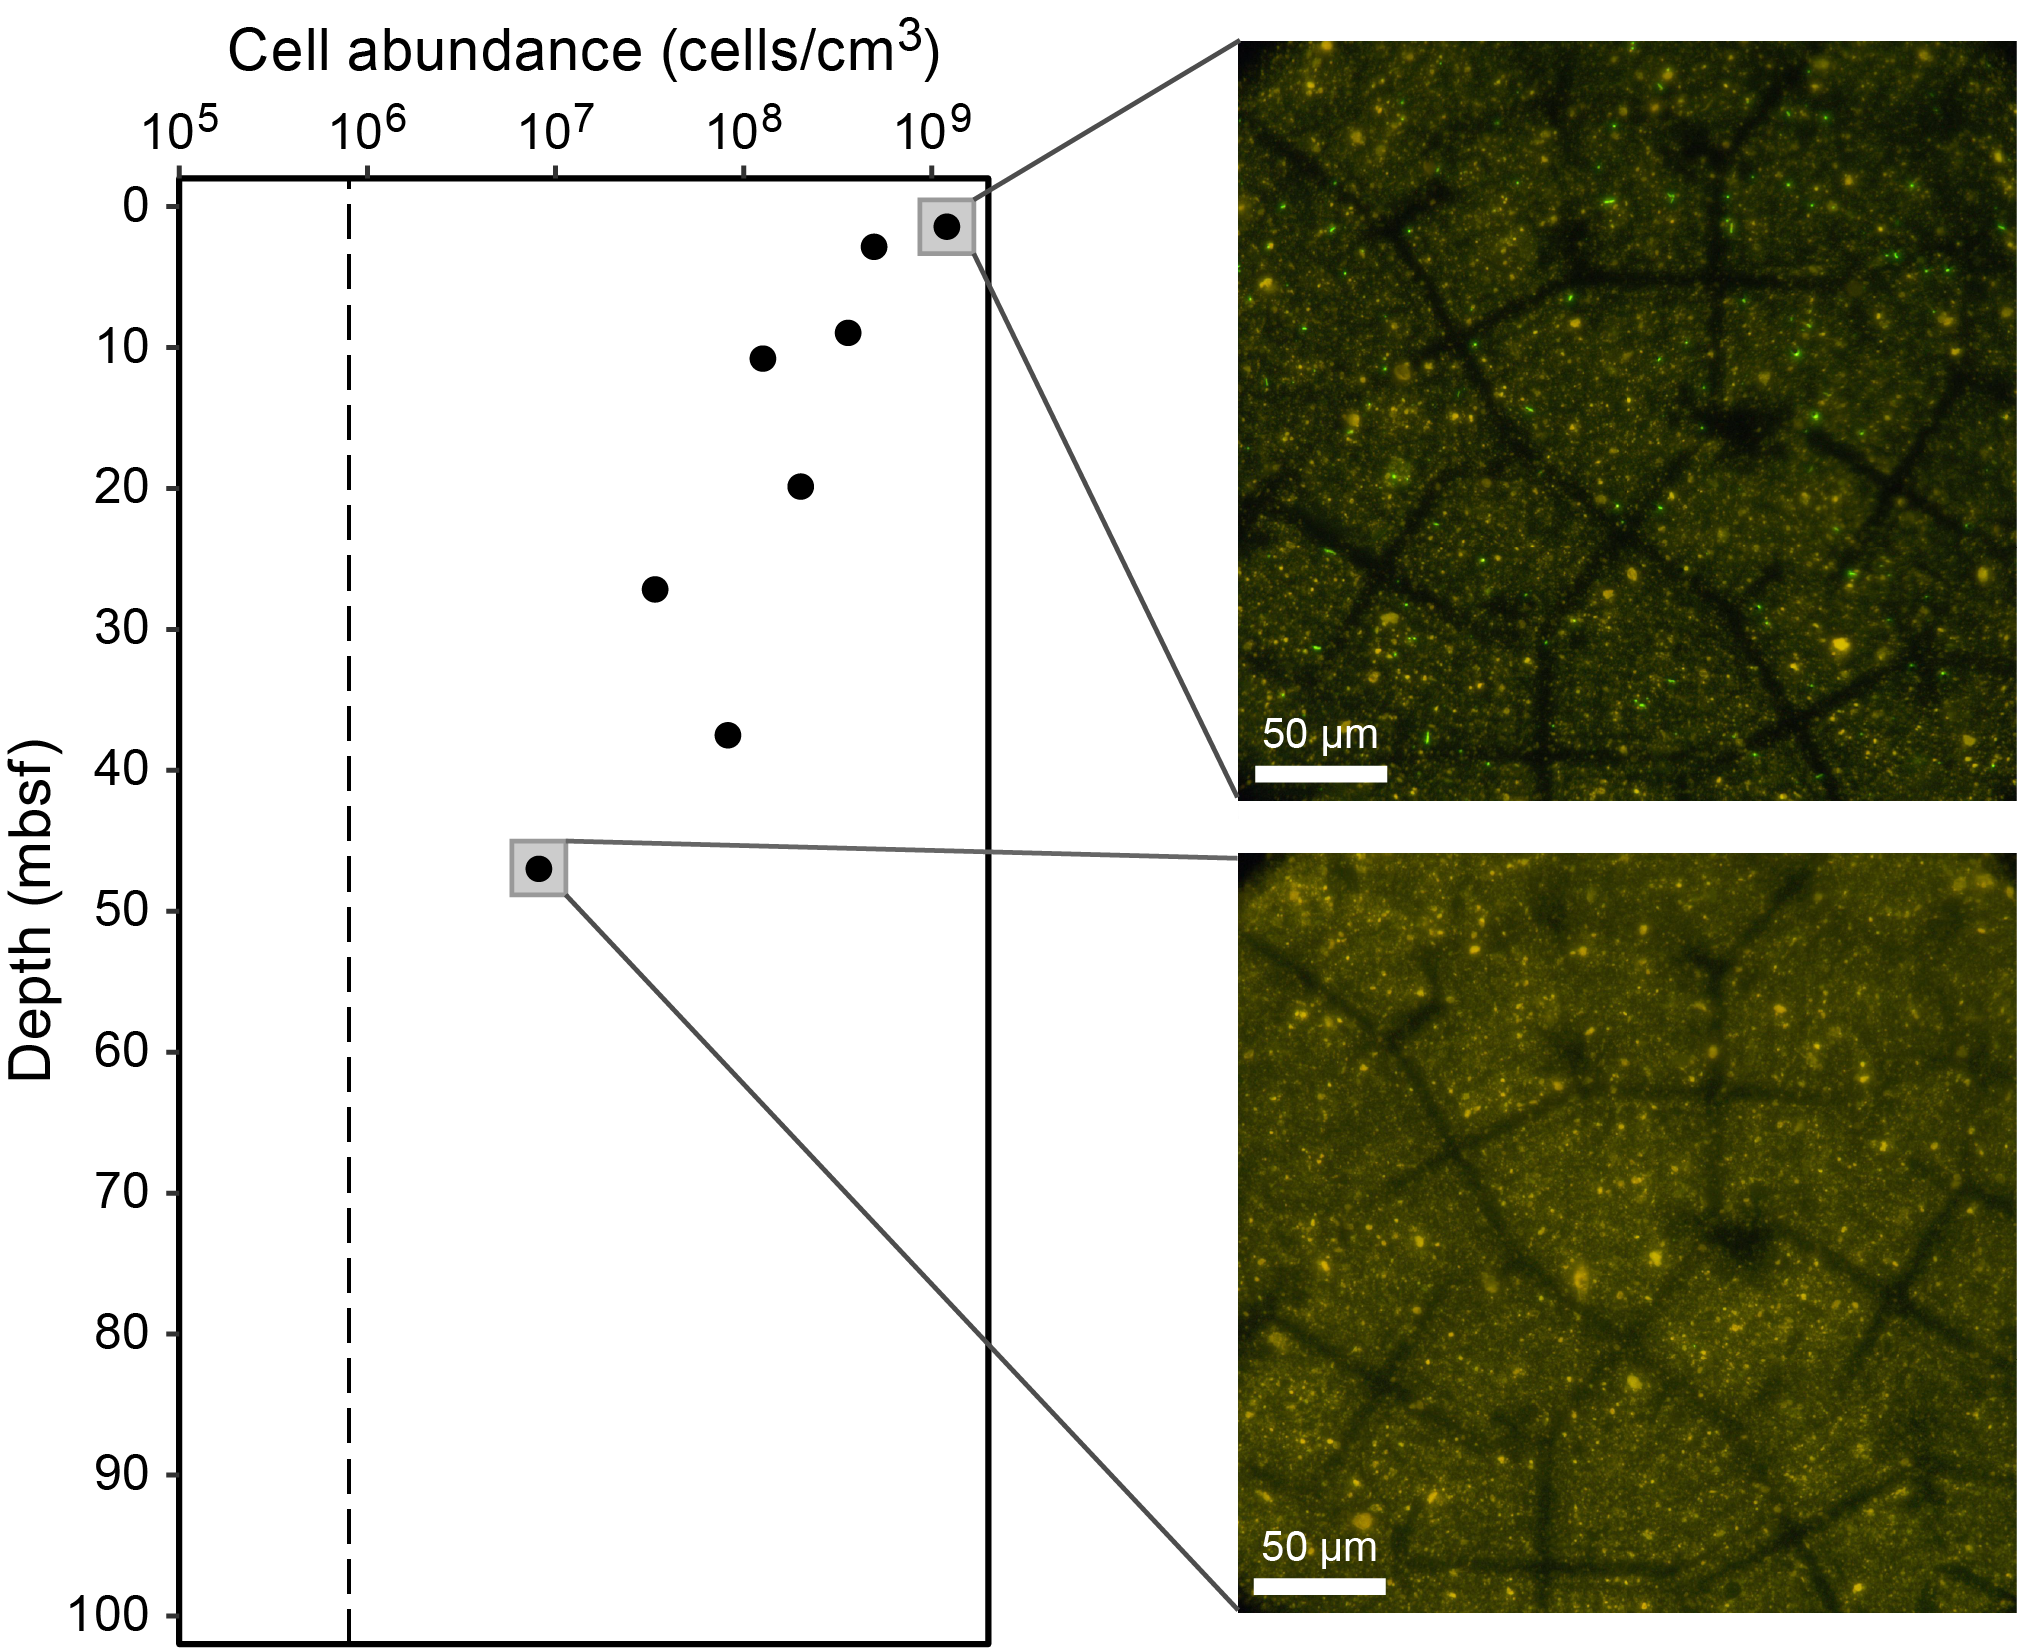
Figure F20. Microbial cell abundance versus depth, Hole U1552B.
10.2.2. CARD-FISH cell counts of fungi
For catalyzed reporter deposition–fluorescence in situ hybridization (CARD-FISH) cell counts of fungi, ~10 cm3 sediment samples from Sections 385-U1552B-1H-2, 2H-2, 3H-3, 5H-3, and 6H-2 were fixed, washed, and stored as described in the Microbiology section of the Expedition 385 methods chapter (Teske et al., 2021a).
10.3. Cultivation experiments
10.3.1. Cultivation of methanogenic subsurface microorganisms
Sediment samples from Hole U1552B were selected for stable isotope incubations and enrichments of potential methanogenic populations (Table T15). Aboard the vessel, whole-round sediment samples were kept for ~2–3 days at ~4°C in argon-flushed and heat-sealed trilaminated foil bags until further processing. For enrichment cultures and stable isotope incubations, whole-round samples were transferred to an anaerobic chamber. Sediment subsamples were taken aseptically from whole-round core interiors at least 1 cm away from the core liners and top and bottom caps. Enrichment samples were preserved under argon atmosphere for incubations at the home laboratory (see Microbiology in the Expedition 385 methods chapter [Teske et al., 2021a]). As a starting point for enrichment and incubation monitoring, subsamples of around 50 cm3 were frozen at −80°C within a few hours of core recovery for shore-based metagenomic and metabarcoding analyses.
10.3.2. Cultivation experiments for fungi
For each sample from Sections 385-U1552B-1H-2, 2H-2, 3H-3, 5H-3, and 6H-2, two enrichment cultures were initiated by placing 5 mL of sediment into each of two 30 mL Hungate bottles with 15 mL of filtered bottom water, followed by flushing with Biomix gas (5% H2:70% N2:25% CO2, V:V:V), capping, and storing at ~4°C. Additional live sediment overlaid with filtered bottom water was stored anaerobically in 250 mL glass bottles flushed with Biomix gas and stored at ~4°C. These samples will be used for fungal enrichment experiments in a shore-based laboratory.
10.4. Sample collection for postexpedition analyses
Because samples from Hole U1552B were collected late in the expedition, material for specific analyses previously performed aboard the vessel was stored in gas-tight bags or bottles under nitrogen atmosphere for experiments in shore-based laboratories. This included material for stable isotope probing of hydrocarbon degradation and radio- and stable-isotope incubations (Sections 385-U1552B-1H-3, 2H-3, 3H-4, 5H-3, and 6H-3), high-temperature and high-pressure incubations (Sections 1H-3, 2H-3, 3H-4, 5H-3, and 6H-3), and enrichments for autotrophic and heterotrophic bacteria, methanogens, and fungi as outlined in LORE (http://web.iodp.tamu.edu/LORE).
11. Petrophysics
Three holes were cored: Hole U1552A to ~108 mbsf, Hole U1552B to ~55 mbsf, and Hole U1552C to ~99 mbsf. The acquired data were compared between holes (U1552A and U1552C) for lithostratigraphic characterization and for correlating core descriptions with core-based physical properties data. Seven in situ formation temperature measurements were conducted using the APCT-3 tool for calculating the geothermal gradient and heat flow. Hole U1552A temperature and thermal conductivity data indicate that temperatures increase linearly with depth. Two different units can be identified in all petrophysical parameters. From the seafloor to ~12 mbsf and in the intervals between 18 and 87 mbsf, density, NGR, and MS are mainly constant. Peaks observed at ~18, ~58, and ~93 mbsf show increases in density, NGR, and MS intensity and decreases in porosity and rheologic parameters. Porosity measured on discrete MAD samples generally outlines a trend that mirrors the density measurements. Shear strength regularly increases with depth. Measurements of P-wave velocities from 12 mbsf to the bottom of both holes provide erratic data typical of cores with abundant voids and cracks.
11.1. Data acquisition
Core laboratory measurements for Holes U1552A and U1552C were conducted as described in the Expedition 385 methods chapter (Teske et al., 2021a). Measured properties and measurement procedures are listed in Tables T17 and T18 in the Expedition 385 methods chapter (Teske et al., 2021a). Hole U1552B was primarily dedicated to microbiology sampling. The petrophysical measurements made on cores from this hole were more sparsely spaced than for Holes U1552A and U1552C, and they are consistent with trends identified in data from the adjacent Hole U1552A. For visual clarity, data from Hole U1552B are not illustrated in this report (Figure F21).

Figure F21. Physical properties.
11.2. Downhole temperature and thermal conductivity
11.2.1. Downhole temperature
Seven in situ formation temperature measurements were made (four in Hole U1552A and three in Hole U1552C) using the APCT-3 tool (see Petrophysics in the Expedition 385 methods chapter [Teske et al., 2021a]). Measured temperature values range from 11.40°C at 31.1 mbsf (Core 385-U1552A-4H) to 31.37°C at 107.5 mbsf (Core 12H) and from 12.24°C at 32.8 mbsf (Core 385-U1552C-4H) to 27.60°C at 89.8 mbsf (Core 12H) (Table T16). These values indicate that formation temperature increases with depth in both holes along a joint linear geothermal gradient of 262°C/km (Figure F22). The slope of the linear fit between thermal resistance and formation temperature (Figure F22C) indicates a heat flow of 222 mW/m2.
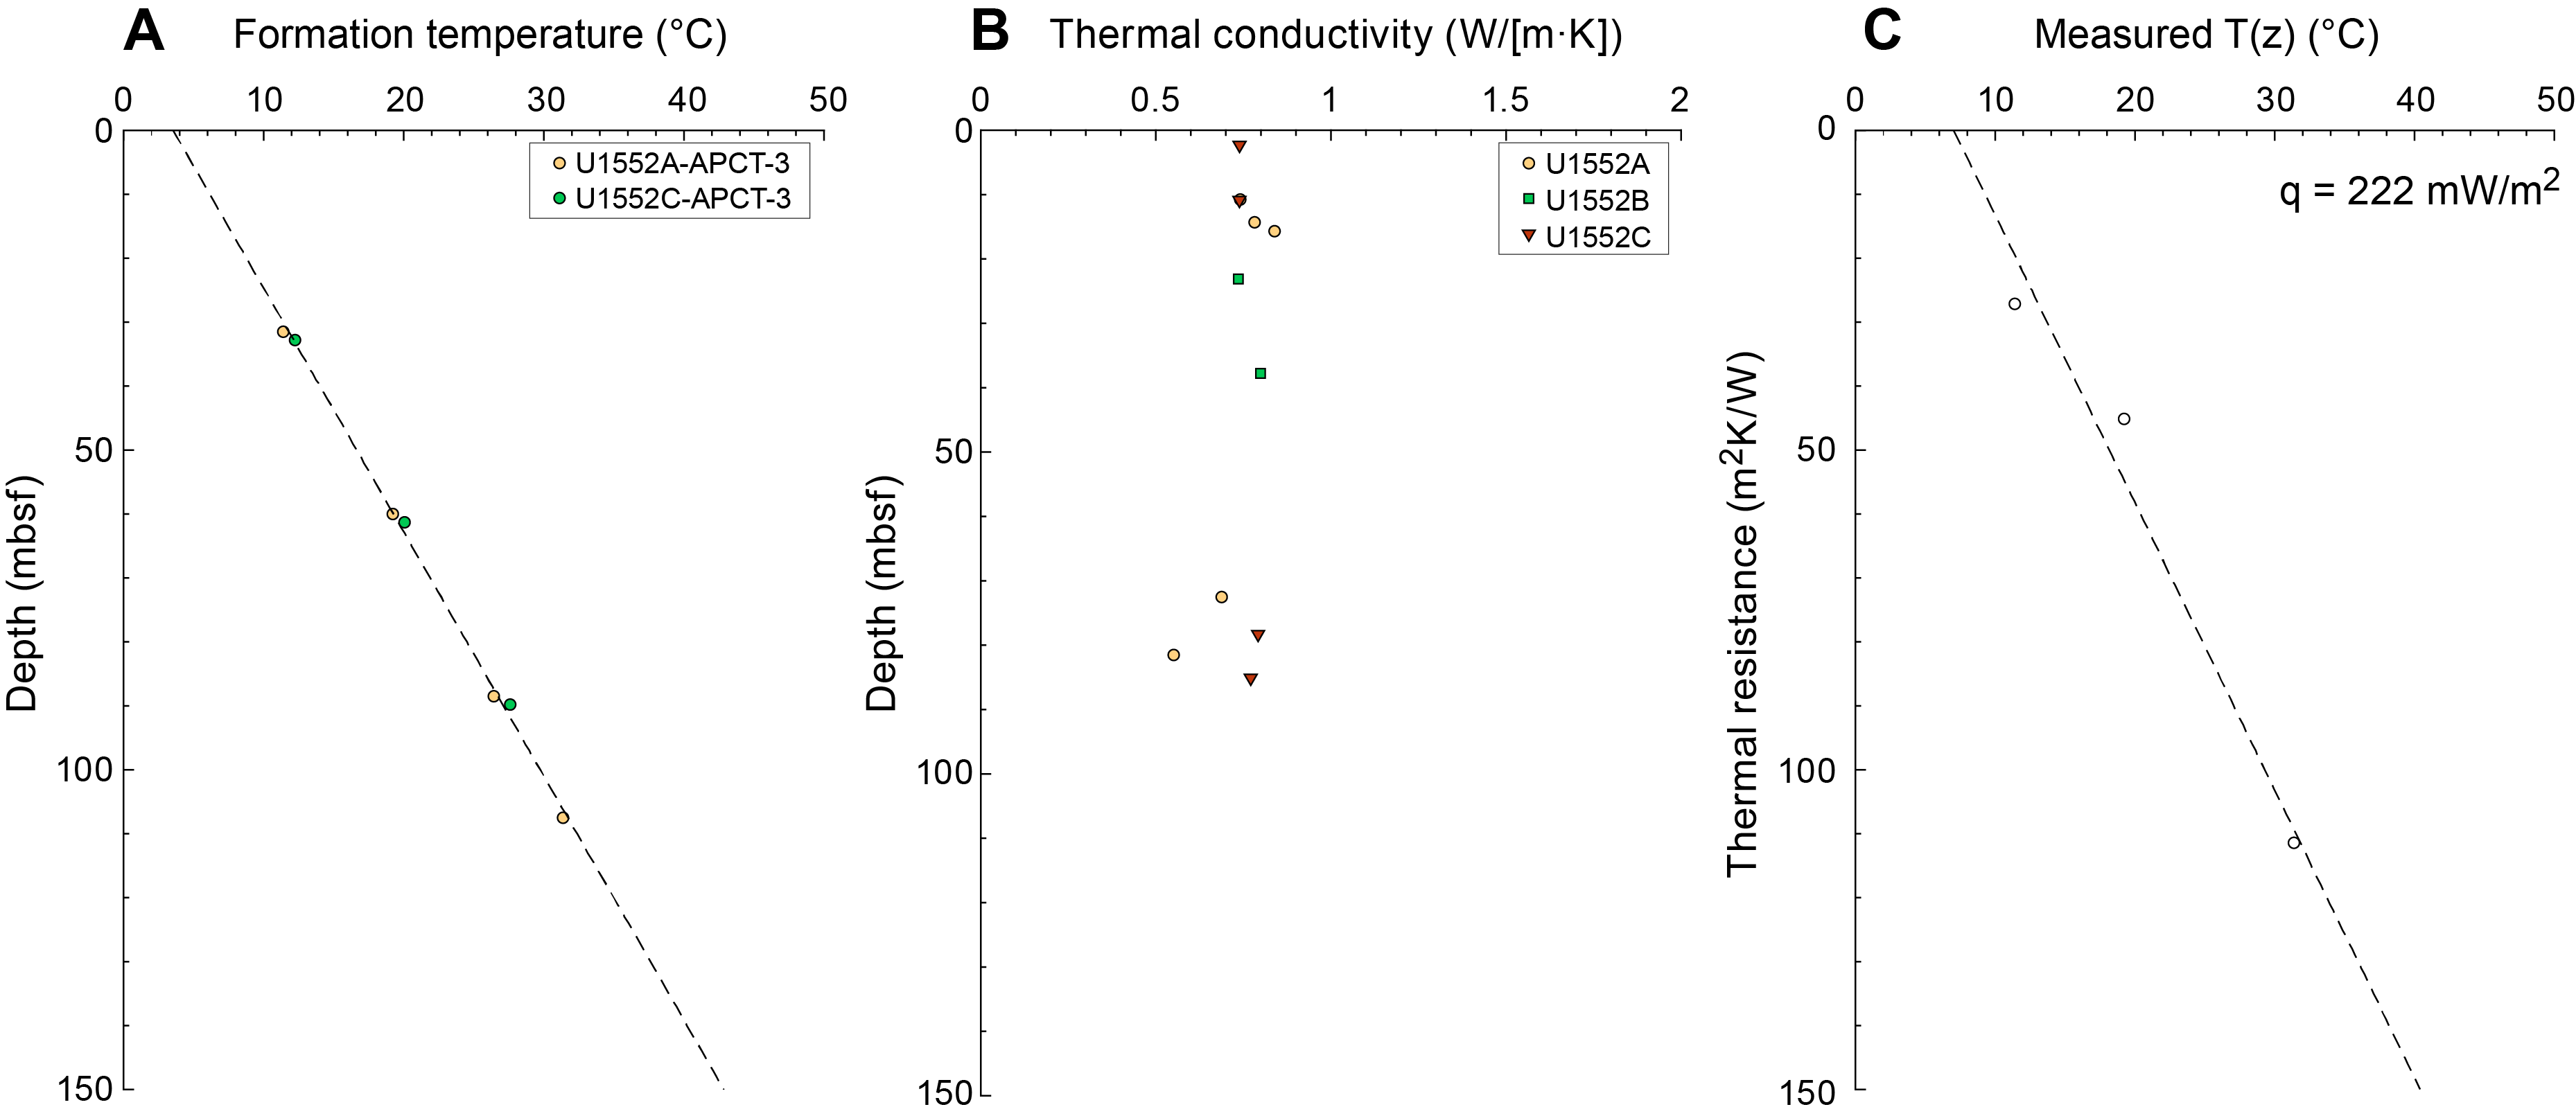
Figure F22. Heat flow calculations.
11.2.2. Thermal conductivity
Thermal conductivity for Site U1552 varies between ~0.55 and ~0.83 W/(m·K) with a mean of 0.74 ± 0.08 W/(m·K) (Figure F22B). Highly fractured sediments and voids in the cores made it difficult to obtain conductivity values. Additionally, core material recovered from depths where methane gas hydrate is believed to be present exhibited a “spongy” sediment texture indicating gas-hydrate dissociation prior to recovery of the corresponding cores. This texture prevented good contact for both the needle probe and the puck sensors used to measure thermal conductivity.
11.3. Density
Bulk density values determined from discrete samples agree well with values obtained from measurements on whole-round cores (Figure F21B). Density values are mainly constant at ~1.3 g/cm3 for both whole-round and discrete samples. Three peaks are observed at ~15, ~58, and ~93 mbsf, where density increases to ~1.6 g/cm3. These peaks correlate with high values in NGR and MS and low values of porosity and rheological parameters.
11.4. Magnetic susceptibility
MS and MSP values are in very good agreement along the entire profile (Figure F21C) and correlate with peaks observed in NGR and density. Between the seafloor and ~11 mbsf, MS intensity decreases to 3 SI. It then increases to a maximum value of 400 SI at ~18 mbsf. After a decrease, MS intensity values remain relatively constant at around 16 SI to the bottom of Holes U1552A and U1552C. MS intensity reaches values of ~366, ~17, and ~31 SI at ~16, ~58, and ~93 mbsf, respectively. These peaks are also observed in NGR, density, and porosity.
11.5. Sonic velocities
P-wave velocities measured with the Whole-Round Multisensor Logger (WRMSL) and the Section Half Measurement Gantry (SHMG) caliper show values close to seawater (1506–1512 m/s) and slightly less over the uppermost 10 m of penetration (Figure F21D). From 10 to 12 mbsf, P-wave velocities slowly increase from ~1500 to ~1600 m/s. Below 12 mbsf, erratic velocity measurements typical of cracked or gas-filled core within the plastic liner predominate from 12 mbsf to the bottom of Holes U1552A and U1552C.
11.6. Natural gamma radiation
NGR values from Holes U1552A and U1552C are similar (Figure F21E). Peak values of 44, 29, and 40 counts/s are observed at ~17, ~58, and ~93 mbsf, respectively. These values are positively correlated with peaks in density and MS. NGR is mainly constant at around 16 counts/s throughout Holes U1552A and U1552C. Generally, NGR values are in good agreement with MS, P-wave velocity, and density measurements.
11.7. Rheology
Shear strength increases from the seafloor to ~56 mbsf and ranges from 15 to 46 kPa. Shear strength correlates well with the compressive strength, which over the same interval increases from a seafloor value of ~5.5 to ~34 kPa at ~75 mbsf (Figure F21F). The depth at which compressive strength measurement becomes reliable (i.e., shows agreement between overlapping raw automated vane shear measurements and pocket penetrometer [PEN]/2 values) is ~84 mbsf, the deepest for all Expedition 385 drill sites. Beyond this depth, both measurements (AVS and PEN/2) show a consistent increase with depth.
11.8. Porosity
Porosity measurements on discrete MAD samples generally outline a trend that mirrors the density measurements (Figure F21G). From the seafloor to ~15 mbsf, porosity decreases from 92% to 60%. After an increase to 87% at ~17 mbsf, porosity varies around 82% to ~81 mbsf. A peak of ~68% in Hole U1552C at ~58 mbsf correlates well with other physical properties. At ~85 and 93 mbsf, porosity reaches minima of 72% and 68% for Holes U1552A and U1552C, respectively. Porosity increases to 77% at the bottom of Hole U1552A. MAD samples show negative correlation with density, NGR, and MS intensity.
11.9. Data integration and lithology correlation
Two different units can be identified in all petrophysical parameters:
- From the seafloor to ~12 mbsf and between 18 and 87 mbsf, density, NGR, and MS are mainly constant (Figure F21). This unit corresponds to diatom clay (see Lithostratigraphy).
- Peaks observed at ~18, ~58, and ~93 mbsf show increases in density, NGR, and MS intensity and decreases in porosity and rheological parameters (Figure F21). This unit consists of silty clay and sand (see Lithostratigraphy).
References
Arason, P., and Levi, S., 2010. Maximum likelihood solution for inclination-only data in paleomagnetism. Geophysical Journal International, 182(2):753–771. https://doi.org/
Barbara, L., Schmidt, S., Urrutia-Fucugauchi, J., and Pérez-Cruz, L., 2016. Fuerte River floods, an overlooked source of terrigenous sediment to the Gulf of California. Continental Shelf Research, 128:1–9. https://doi.org/
Dählmann, A., and de Lange, G.J., 2003. Fluid-sediment interactions at eastern Mediterranean mud volcanoes: a stable isotope study from ODP Leg 160. Earth and Planetary Science Letters, 212(3–4):377–391. https://doi.org/
Haeckel, M., Suess, E., Wallmann, K., and Rickert, D., 2004. Rising methane gas bubbles form massive hydrate layers at the seafloor. Geochimica et Cosmochimica Acta, 68(21):4335–4345. https://doi.org/
Helenes, J., Carreño, A.L., and Carrillo, R.M., 2009. Middle to late Miocene chronostratigraphy and development of the northern Gulf of California. Marine Micropaleontology, 72(1):10–25. https://doi.org/
Hesse, R., 2003. Pore water anomalies of submarine gas-hydrate zones as tool to assess hydrate abundance and distribution in the subsurface: what have we learned in the past decade? Earth-Science Reviews, 61(1–2):149–179. https://doi.org/
Kim, J.-H., Torres, M.E., Hong, W.-L., Choi, J., Riedel, M., Bahk, J.-J., and Kim, S.-H., 2013. Pore fluid chemistry from the second gas hydrate drilling expedition in the Ulleung Basin (UBGH2): source, mechanisms and consequences of fluid freshening in the central part of the Ulleung Basin, East Sea. Marine and Petroleum Geology, 47:99–112. https://doi.org/
Kirschvink, J.L., 1980. The least-squares line and plane and the analysis of palaeomagnetic data. Geophysical Journal International, 62(3):699–718. https://doi.org/
Levi, S., and Karlin, R., 1989. A sixty thousand year paleomagnetic record from Gulf of California sediments: secular variation, late Quaternary excursions and geomagnetic implications. Earth and Planetary Science Letters, 92(2):219–233. https://doi.org/
Lizarralde, D., Soule, S.A., Seewald, J.S., and Proskurowski, G., 2011. Carbon release by off-axis magmatism in a young sedimented spreading centre. Nature Geoscience, 4:50–54. https://doi.org/
Martini, E., 1971. Standard Tertiary and Quaternary calcareous nannoplankton zonation. In McKee, E.D., and Weir, G.W. (Ed.), Trace Elements Investigations Report, 269: Washington, DC (US Department of the Interior). https://doi.org/
McDougall, K., and Martínez, A.Y.M., 2014. Evidence for a marine incursion along the lower Colorado River corridor. Geosphere, 10(5):842–869. https://doi.org/
Morono, Y., Terada, T., Masui, N., and Inagaki, F., 2009. Discriminative detection and enumeration of microbial life in marine subsurface sediments. The ISME Journal, 3(5):503–511. https://doi.org/
Pimmel, A., and Claypool, G., 2001. Introduction to shipboard organic geochemistry on the JOIDES Resolution. Ocean Drilling Program Technical Note, 30. https://doi.org/
Silverberg, N., Shumilin, E., Aguirre-Bahena, F., Rodríguez-Castañeda, A.P., and Sapozhnikov, D., 2007. The impact of hurricanes on sedimenting particulate matter in the semi-arid Bahía de La Paz, Gulf of California. Continental Shelf Research, 27(19):2513–2522. https://doi.org/
Teske, A., Lizarralde, D., and Höfig, T.W., 2018. Expedition 385 Scientific Prospectus: Guaymas Basin Tectonics and Biosphere. College Station, TX (International Ocean Discovery Program). https://doi.org/
Teske, A., Lizarralde, D., Höfig, T.W., Aiello, I.W., Ash, J.L., Bojanova, D.P., Buatier, M.D., Edgcomb, V.P., Galerne, C.Y., Gontharet, S., Heuer, V.B., Jiang, S., Kars, M.A.C., Khogenkumar Singh, S., Kim, J.-H., Koornneef, L.M.T., Marsaglia, K.M., Meyer, N.R., Morono, Y., Negrete-Aranda, R., Neumann, F., Pastor, L.C., Peña-Salinas, M.E., Pérez Cruz, L.L., Ran, L., Riboulleau, A., Sarao, J.A., Schubert, F., Stock, J.M., Toffin, L.M.A.A., Xie, W., Yamanaka, T., and Zhuang, G., 2021a. Expedition 385 methods. In Teske, A., Lizarralde, D., Höfig, T.W. and the Expedition 385 Scientists, Guaymas Basin Tectonics and Biosphere. Proceedings of the International Ocean Discovery Program, 385: College Station, TX (International Ocean Discovery Program). https://doi.org/
Teske, A., Lizarralde, D., Höfig, T.W., Aiello, I.W., Ash, J.L., Bojanova, D.P., Buatier, M.D., Edgcomb, V.P., Galerne, C.Y., Gontharet, S., Heuer, V.B., Jiang, S., Kars, M.A.C., Khogenkumar Singh, S., Kim, J.-H., Koornneef, L.M.T., Marsaglia, K.M., Meyer, N.R., Morono, Y., Negrete-Aranda, R., Neumann, F., Pastor, L.C., Peña-Salinas, M.E., Pérez Cruz, L.L., Ran, L., Riboulleau, A., Sarao, J.A., Schubert, F., Stock, J.M., Toffin, L.M.A.A., Xie, W., Yamanaka, T., and Zhuang, G., 2021b. Site U1545. In Teske, A., Lizarralde, D., Höfig, T.W., and the Expedition 385 Scientists, Guaymas Basin Tectonics and Biosphere. Proceedings of the International Ocean Discovery Program, 385: College Station, TX (International Ocean Discovery Program). https://doi.org/
Teske, A., Lizarralde, D., Höfig, T.W., Aiello, I.W., Ash, J.L., Bojanova, D.P., Buatier, M.D., Edgcomb, V.P., Galerne, C.Y., Gontharet, S., Heuer, V.B., Jiang, S., Kars, M.A.C., Khogenkumar Singh, S., Kim, J.-H., Koornneef, L.M.T., Marsaglia, K.M., Meyer, N.R., Morono, Y., Negrete-Aranda, R., Neumann, F., Pastor, L.C., Peña-Salinas, M.E., Pérez Cruz, L.L., Ran, L., Riboulleau, A., Sarao, J.A., Schubert, F., Stock, J.M., Toffin, L.M.A.A., Xie, W., Yamanaka, T., and Zhuang, G., 2021c. Site U1546. In Teske, A., Lizarralde, D., Höfig, T.W. and the Expedition 385 Scientists, Guaymas Basin Tectonics and Biosphere. Proceedings of the International Ocean Discovery Program, 385: College Station, TX (International Ocean Discovery Program). https://doi.org/
Teske, A., Lizarralde, D., Höfig, T.W., Aiello, I.W., Ash, J.L., Bojanova, D.P., Buatier, M.D., Edgcomb, V.P., Galerne, C.Y., Gontharet, S., Heuer, V.B., Jiang, S., Kars, M.A.C., Khogenkumar Singh, S., Kim, J.-H., Koornneef, L.M.T., Marsaglia, K.M., Meyer, N.R., Morono, Y., Negrete-Aranda, R., Neumann, F., Pastor, L.C., Peña-Salinas, M.E., Pérez Cruz, L.L., Ran, L., Riboulleau, A., Sarao, J.A., Schubert, F., Stock, J.M., Toffin, L.M.A.A., Xie, W., Yamanaka, T., and Zhuang, G., 2021d. Sites U1547 and U1548. In Teske, A., Lizarralde, D., Höfig, T.W., and the Expedition 385 Scientists, Guaymas Basin Tectonics and Biosphere. Proceedings of the International Ocean Discovery Program, 385: College Station, TX (International Ocean Discovery Program). https://doi.org/
Teske, A., Lizarralde, D., Höfig, T.W., Aiello, I.W., Ash, J.L., Bojanova, D.P., Buatier, M.D., Edgcomb, V.P., Galerne, C.Y., Gontharet, S., Heuer, V.B., Jiang, S., Kars, M.A.C., Khogenkumar Singh, S., Kim, J.-H., Koornneef, L.M.T., Marsaglia, K.M., Meyer, N.R., Morono, Y., Negrete-Aranda, R., Neumann, F., Pastor, L.C., Peña-Salinas, M.E., Pérez Cruz, L.L., Ran, L., Riboulleau, A., Sarao, J.A., Schubert, F., Stock, J.M., Toffin, L.M.A.A., Xie, W., Yamanaka, T., and Zhuang, G., 2021e. Site U1549. In Teske, A., Lizarralde, D., Höfig, T.W., and the Expedition 385 Scientists, Guaymas Basin Tectonics and Biosphere. Proceedings of the International Ocean Discovery Program, 385: College Station, TX (International Ocean Discovery Program). https://doi.org/
Teske, A., Lizarralde, D., Höfig, T.W., Aiello, I.W., Ash, J.L., Bojanova, D.P., Buatier, M.D., Edgcomb, V.P., Galerne, C.Y., Gontharet, S., Heuer, V.B., Jiang, S., Kars, M.A.C., Khogenkumar Singh, S., Kim, J.-H., Koornneef, L.M.T., Marsaglia, K.M., Meyer, N.R., Morono, Y., Negrete-Aranda, R., Neumann, F., Pastor, L.C., Peña-Salinas, M.E., Pérez Cruz, L.L., Ran, L., Riboulleau, A., Sarao, J.A., Schubert, F., Stock, J.M., Toffin, L.M.A.A., Xie, W., Yamanaka, T., and Zhuang, G., 2021f. Site U1550. In Teske, A., Lizarralde, D., Höfig, T.W., and the Expedition 385 Scientists, Guaymas Basin Tectonics and Biosphere. Proceedings of the International Ocean Discovery Program, 385: College Station, TX (International Ocean Discovery Program). https://doi.org/
Teske, A., Lizarralde, D., Höfig, T.W., Aiello, I.W., Ash, J.L., Bojanova, D.P., Buatier, M.D., Edgcomb, V.P., Galerne, C.Y., Gontharet, S., Heuer, V.B., Jiang, S., Kars, M.A.C., Khogenkumar Singh, S., Kim, J.-H., Koornneef, L.M.T., Marsaglia, K.M., Meyer, N.R., Morono, Y., Negrete-Aranda, R., Neumann, F., Pastor, L.C., Peña-Salinas, M.E., Pérez Cruz, L.L., Ran, L., Riboulleau, A., Sarao, J.A., Schubert, F., Stock, J.M., Toffin, L.M.A.A., Xie, W., Yamanaka, T., and Zhuang, G., 2021g. Site U1551. In Teske, A., Lizarralde, D., Höfig, T.W., and the Expedition 385 Scientists, Guaymas Basin Tectonics and Biosphere. Proceedings of the International Ocean Discovery Program, 385: College Station, TX (International Ocean Discovery Program). https://doi.org/
Torres, M.E., Kim, J.-H., Choi, J.-Y., Ryu, B.J., and Bahk, J.-J., 2011. Occurrence of high salinity fluids associated with massive near-seafloor gas hydrate deposits. Proceedings of the 7th International Conference on Gas Hydrates (ICGH 2011).
Torres, M.E., Wallmann, K., Trehu, A.M., Bohrmann, G., Borowski, W.S., and Tomaru, H., 2004. Gas hydrate growth, methane transport, and chloride enrichment at the southern summit of Hydrate Ridge, Cascadia margin off Oregon. Earth and Planetary Science Letters, 226(1–2):225–241. https://doi.org/
You, K., Flemings, P.B., Malinverno, A., Collett, T.S., and Darnell, K., 2019. Mechanisms of methane hydrate formation in geological systems. Reviews of Geophysics, 57(4):1146–1196. https://doi.org/
Zijderveld, J.D.A., 1967. AC demagnetization of rocks: analysis of results. In Runcorn, S.K.C., Creer, K.M., and Collinson, D.W. (Eds.), Methods in Palaeomagnetism: Amsterdam (Elsevier), 254–286.